data-driven enterprise off your beat - clifton adcock - norman, okla., newstrain - march 4, 2017
TRANSCRIPT

Developing a data state of
mindData-driven enterprise
off your beat
Clifton Adcock
Reporter
Oklahoma Watch

Where are we headed today?P
ho
to b
y Fl
ickr
use
r B
arn
Imag
es
• Why do data journalism?
• Develop a data state of mind
• Where and how to find data
• What’s the story?
• Exercises

What have
YOU
done with
data?
By
Jam
es M
on
tgo
mer
y Fl
agg
[Pu
blic
do
mai
n],
vi
a W
ikim
edia
Co
mm
on
s

Why data journalism?

Why data journalism?• Powerful verification tool
• See the bigger picture
• Find stories
• Better understand the subject
• Enhances transparencyand credibility

2013 Pulitzer Prize for Public Service Sun Sentinel on police speeding
“Nearly 800
cops…drove 90 to
130 mph.”
bit.ly/speedpulitzer

What is a data state of mind?• Move from an
anecdotal view to a
big-picture one.
• Understand the
importance of public
records and data.
• “What data did you
use to come to that
conclusion, and where
did you get it?”
Understand how

What is a data state of mind?• Understand how
statistics and data
can be
manipulated.
• Understand your
own biases and
assumptions.
“There
are three
kinds of
lies: lies,
damned
lies, and
statistics.
” – Mark
Twain
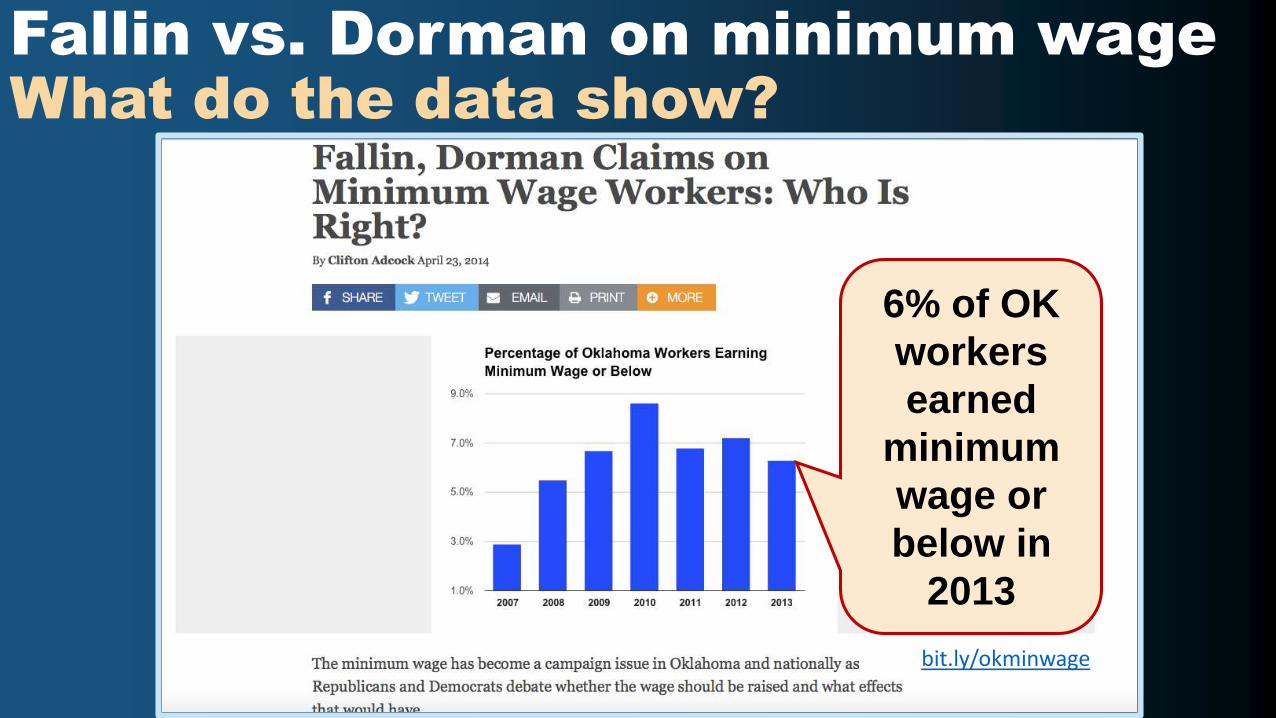
Fallin vs. Dorman on minimum wage What do the data show?
bit.ly/okminwage
6% of OK
workers
earned
minimum
wage or
below in
2013

Categorical

Categorical

Continuous

Continuous

What do you want to know?• A comparison of two or more things?
• Variations over time?
• Relationships between two or more things?
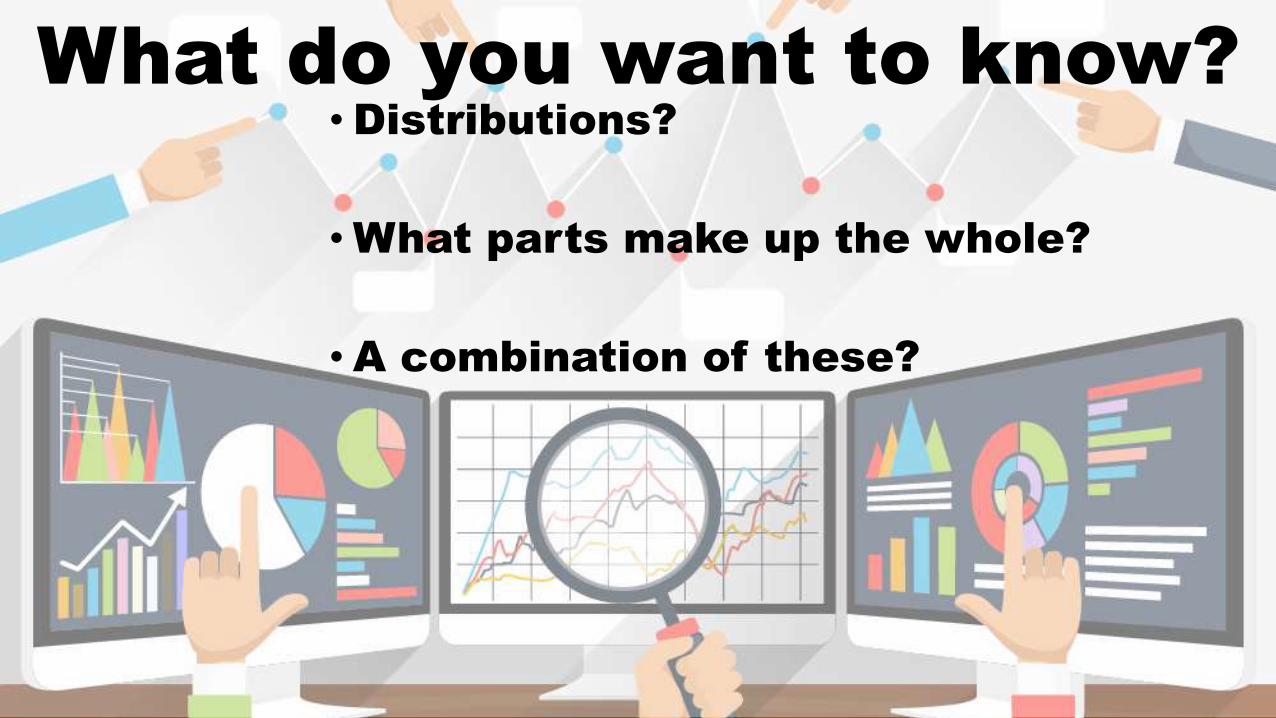
What do you want to know?•Distributions?
•What parts make up the whole?
•A combination of these?

Oklahoma earthquake data
bit.ly/quakeswarm
“More than a dozen
small earthquakes
shook central
Oklahoma…including
several temblors that
were 3.0-magnitude or
higher, which people
can generally feel.”

Where’s the story?
• Did you answer your original question?
• Do the findings matchother sources?

Where’s the story?
• How else can you analyzethe data?
• Was there something unexpected?
• How do you visualize the findings?
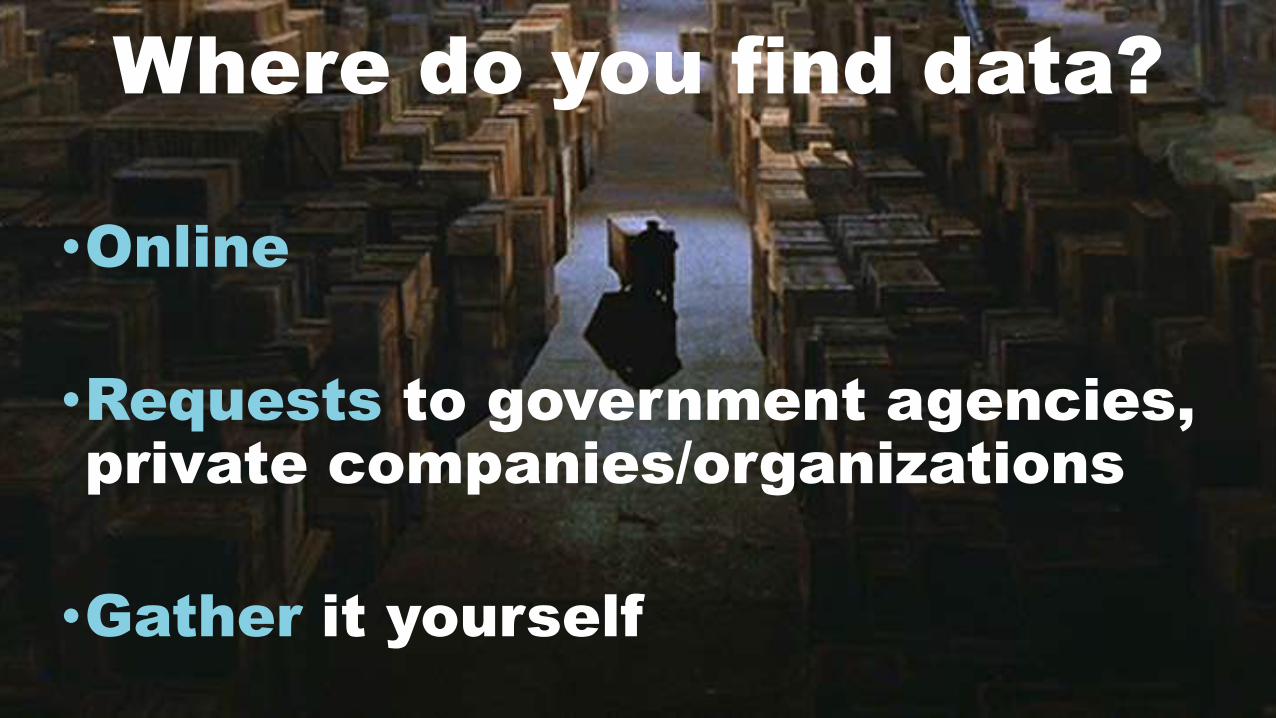
Where do you find data?
•Online
•Requests to government agencies, private companies/organizations
•Gather it yourself

Hospital-cost reports
bit
.ly/o
kho
spit
al
“Most of Oklahoma’s
small general hospitals
have lost money in
recent years, while the
opposite is true for
larger hospitals.”

Let’s try it: exercises1. Do a simple sort on
a data set. Open the Doctorsdatabase, and let’s see what you find.
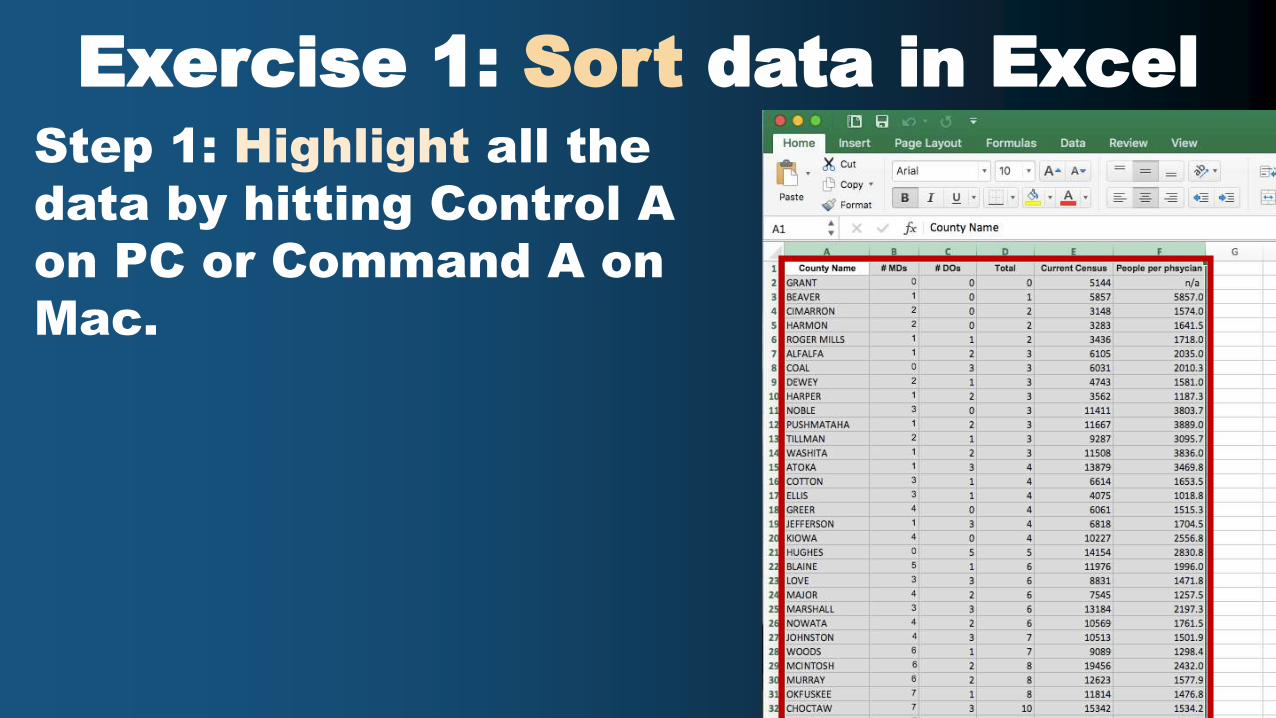
Exercise 1: Sort data in ExcelStep 1: Highlight all the
data by hitting Control A
on PC or Command A on
Mac.

Step 2: Click
on the Funnel
Exercise 1: Sort data in Excel
Step 2: Click on the funnel
Step 3: Click “Custom Sort”

Exercise 1: Sort data in Excel
Step 4: Click on “Sort by” drop-down and select “People per Physician”
Step 5: Click “OK”

Exercise 1: Sort data in Excel
Step 6: Click on the “Order” drop-down and select “Largest to Smallest”
Step 7: Click “OK”

Let’s try it: exercises1. Do a simple sort on
a data set. What did you find?
2. Do a simple filteron a data set. Open the Superintendentsdatabase, and let’s see what you find.

Exercise 2: Filter data in ExcelStep 1: Highlight
all the data by
hitting Control A
on PC or
Command A on
Mac.
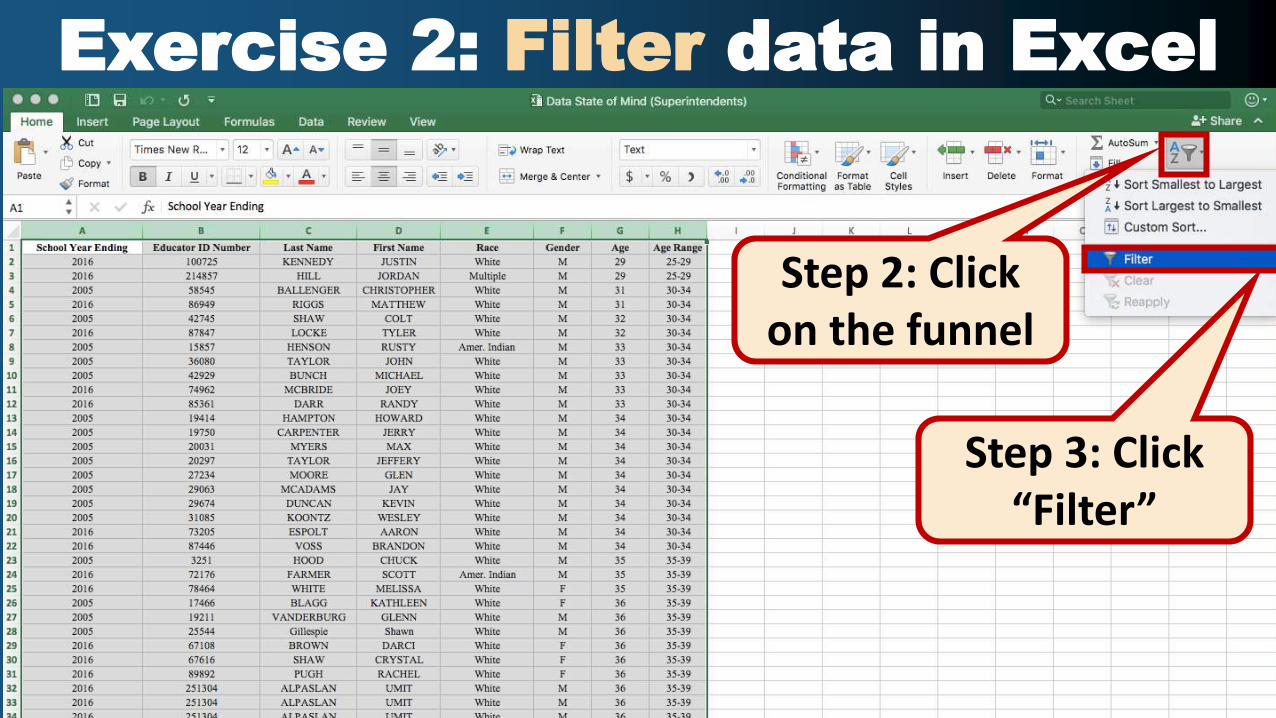
Exercise 2: Filter data in Excel
Step 2: Click on the funnel
Step 3: Click “Filter”

Exercise 2: Filter data in Excel
Step 4: Click on the small arrowhead to the right of
“School Year Ending” header.
Step 5: This box will appear.

Exercise 2: Filter data in Excel
Step 6: Click on the “Order” drop-down and select “Largest to Smallest”
Step 7: Click “OK”
Step 6: Unclick the box next to
“2005”

Let’s try it: exercises1. Do a simple sort on
a data set. What do you find?
2. Do a simple filteron a data set. What did you find?
3. Use the sort/filter functions on the county indicators data. Do you see a possible story?

What data apply to your beat?• Pair up and look at pages 4-6 of the handout.
• Discuss: What data apply to your beator interest you?
• Use Google Advanced Search to find data online.

https://www.google.com/advanced_search
Keywords
Website
.xls or .xlsx

Clifton Adcock
Reporter
Oklahoma Watch
(918) 561-1705
@cliftonhowze
What data story are you going to do?How can I help?
By
Gar
eth
Sim
pso
n