data concerning the fractionation of individual whey
TRANSCRIPT

Data in brief 25 (2019) 104102
Contents lists available at ScienceDirect
Data in brief
journal homepage: www.elsevier .com/locate/dib
Data Article
Data concerning the fractionation of individualwhey proteins and casein micelles bymicrofiltration with ceramic gradientmembranes
Hans-Jürgen Heidebrecht a, b, *, Ulrich Kulozik a, b
a Chair of Food and Bioprocess Engineering, Technical University of Munich, Germanyb ZIEL Institute for Food & Health, Technical University of Munich, Germany
a r t i c l e i n f o
Article history:Received 21 March 2019Received in revised form 25 May 2019Accepted 27 May 2019Available online 5 June 2019
Keywords:ImmunoglobulinsMicrofiltrationIgG
DOI of original article: https://doi.org/10.1016/* Corresponding author. Chair of Food and Biopr
E-mail address: Hans-Juergen.Heidebrecht@tum
https://doi.org/10.1016/j.dib.2019.1041022352-3409/© 2019 The Authors. Published by Elscreativecommons.org/licenses/by/4.0/).
a b s t r a c t
Data are related to the research article “Fractionation of caseinmicelles and immunoglobulins by microfiltration in diafiltrationmode Study of the transmission and yield of IgG, IgA and IgM” [1].The data show the transmission and yield of the individual wheyproteins a-Lactalbumin (a-La), b -Lactoglobulin (b -Lg), bloodserum albumin (BSA), lactoferrin (LF), lactoperoxidase (LPO) andthe immunoglobulins IgG, IgA, IgM during microfiltration (0.14mm) performed in diafiltration mode at 50 �C with differentapplied transmembrane pressures (0.6-3 bar). The data provideinformation on the decrease of the respective proteins in themicrofiltration retentate and their increase in the UF retentate.The relevant analytical methods for the individual protein detec-tion were performed by reversed phase high performance liquidchromatography and ELISA. The isoelectric point of IgG and IgMwas measured with the Zetasizer Nano ZS.
© 2019 The Authors. Published by Elsevier Inc. This is an openaccess article under the CC BY license (http://creativecommons.
org/licenses/by/4.0/).
j.idairyj.2019.01.009.ocess Engineering, Technical University of Munich, Germany..de (H.-J. Heidebrecht).
evier Inc. This is an open access article under the CC BY license (http://

Specifications Table
Subject area Chemistry, biologyMore specific subjectarea
Fractionation of individual whey proteins by microfiltration
Type of data Graphs, figureHow data wasacquired
Microfiltration pilot plant, Zetasizer Nano ZS, SDS-PAGE, reversed phase high performance liquidchromatography
Data format AnalyzedExperimental factors Fat (centrifugation), casein (microfiltration), lactose/minerals (ultrafiltration) removed from raw
colostrum or milk to obtain wheyExperimentalfeatures
Determination of individual whey proteins during microfiltration at different process conditions
Data source location Technical University of Munich (Freising), GermanyData accessibility With this articleRelated researcharticle
Data is provided as additional material directly related to the article H.-J. Heidebrecht, U. Kulozik,Fractionation of casein micelles and minor proteins by microfiltration in diafiltration mode: Study of thetransmission and yield of the immunoglobulins IgG, IgA and IgM, Int Dairy J, 93 (in press), 2019, 1e10 [1].
Value of the data� Transmission yield of the individual whey protein at different TMP� Data deliver information on how to operate the microfiltration process during the fractionation of casein micelles and
whey proteins with the assessment criteria time and yield� Data are valuable for the design of filtration plants with the aim of recovering the individual whey protein fractions in the
microfiltration permeate
H.-J. Heidebrecht, U. Kulozik / Data in brief 25 (2019) 1041022
1. Data
The dataset contains information on the transmission and yield of individual whey proteins duringmilk protein fractionation by microfiltration. Furthermore, data on the comparison of analyticalmethods for the determination of bovine IgG and b-Lg are as well as the influence of temperatureduring filtration on the respective whey proteins are presented.
Fig. 1. Linear correlation of the IgG concentration measured with RP-HPLC and ELISA.

Fig. 2. Linear correlation of b-Lg measured with two independent RP-HPLC methods (B); method 1 according to Ref. [6], method 2according to Ref. [7].
H.-J. Heidebrecht, U. Kulozik / Data in brief 25 (2019) 104102 3
Fig. 1 shows the linear correlation of IgG data measured by ELISA and RR-HPLC. Fig. 2 shows thesame correlation for b-Lg measured using two different RP-HPLC methods. Fig. 3 shows the zetapotential as a function of pH and the read of the isoelectric point of IgG and IgM. Fig. 4 shows thedepletion of the whey proteins a-La, b-Lg, BSA, IgG, IgA and IgM in the MF retentate as a function ofthe washing steps. Fig. 5 shows the protein transmission, determined by two different methods usingthe example of a-La. Fig. 6 shows the time-dependent decrease in the MF retentate and Graph 8shows the corresponding increase in the UF retentate in the form of a mass balance. Fig. 7 shows theflux at the different transmembrane pressures. Fig. 9 shows the concentration of a-La, b-Lg at 50, 55 �Cwith respect to the initial concentration in the skim milk during batch filtration and in a water bath.Figs. 10 and 11 show data on the denaturation of b-Lg during filtration operated in diafiltration mode at50 �C and the selective retention of the insoluble b-Lg by the MF membrane.
Fig. 3. Zeta potential as function of the pH from isolated IgG and IgM for IEP determination.
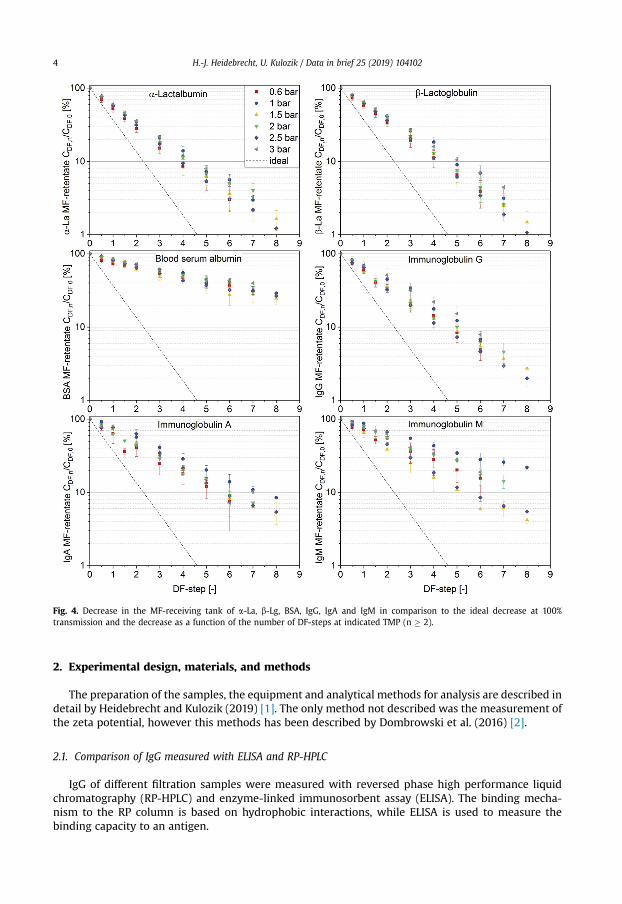
Fig. 4. Decrease in the MF-receiving tank of a-La, b-Lg, BSA, IgG, IgA and IgM in comparison to the ideal decrease at 100%transmission and the decrease as a function of the number of DF-steps at indicated TMP (n � 2).
H.-J. Heidebrecht, U. Kulozik / Data in brief 25 (2019) 1041024
2. Experimental design, materials, and methods
The preparation of the samples, the equipment and analytical methods for analysis are described indetail by Heidebrecht and Kulozik (2019) [1]. The only method not described was the measurement ofthe zeta potential, however this methods has been described by Dombrowski et al. (2016) [2].
2.1. Comparison of IgG measured with ELISA and RP-HPLC
IgG of different filtration samples were measured with reversed phase high performance liquidchromatography (RP-HPLC) and enzyme-linked immunosorbent assay (ELISA). The binding mecha-nism to the RP column is based on hydrophobic interactions, while ELISA is used to measure thebinding capacity to an antigen.
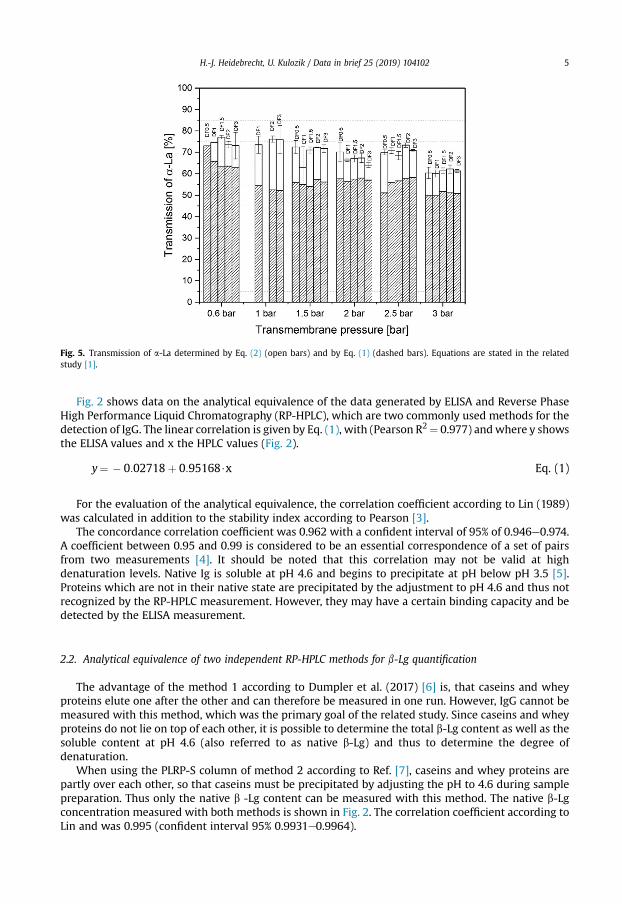
Fig. 5. Transmission of a-La determined by Eq. (2) (open bars) and by Eq. (1) (dashed bars). Equations are stated in the relatedstudy [1].
H.-J. Heidebrecht, U. Kulozik / Data in brief 25 (2019) 104102 5
Fig. 2 shows data on the analytical equivalence of the data generated by ELISA and Reverse PhaseHigh Performance Liquid Chromatography (RP-HPLC), which are two commonly used methods for thedetection of IgG. The linear correlation is given by Eq. (1), with (Pearson R2¼ 0.977) andwhere y showsthe ELISA values and x the HPLC values (Fig. 2).
y¼ � 0:02718þ 0:95168$x Eq. (1)
For the evaluation of the analytical equivalence, the correlation coefficient according to Lin (1989)was calculated in addition to the stability index according to Pearson [3].
The concordance correlation coefficient was 0.962 with a confident interval of 95% of 0.946e0.974.A coefficient between 0.95 and 0.99 is considered to be an essential correspondence of a set of pairsfrom two measurements [4]. It should be noted that this correlation may not be valid at highdenaturation levels. Native Ig is soluble at pH 4.6 and begins to precipitate at pH below pH 3.5 [5].Proteins which are not in their native state are precipitated by the adjustment to pH 4.6 and thus notrecognized by the RP-HPLC measurement. However, they may have a certain binding capacity and bedetected by the ELISA measurement.
2.2. Analytical equivalence of two independent RP-HPLC methods for b-Lg quantification
The advantage of the method 1 according to Dumpler et al. (2017) [6] is, that caseins and wheyproteins elute one after the other and can therefore be measured in one run. However, IgG cannot bemeasured with this method, which was the primary goal of the related study. Since caseins and wheyproteins do not lie on top of each other, it is possible to determine the total b-Lg content as well as thesoluble content at pH 4.6 (also referred to as native b-Lg) and thus to determine the degree ofdenaturation.
When using the PLRP-S column of method 2 according to Ref. [7], caseins and whey proteins arepartly over each other, so that caseins must be precipitated by adjusting the pH to 4.6 during samplepreparation. Thus only the native b -Lg content can be measured with this method. The native b-Lgconcentration measured with both methods is shown in Fig. 2. The correlation coefficient according toLin and was 0.995 (confident interval 95% 0.9931e0.9964).
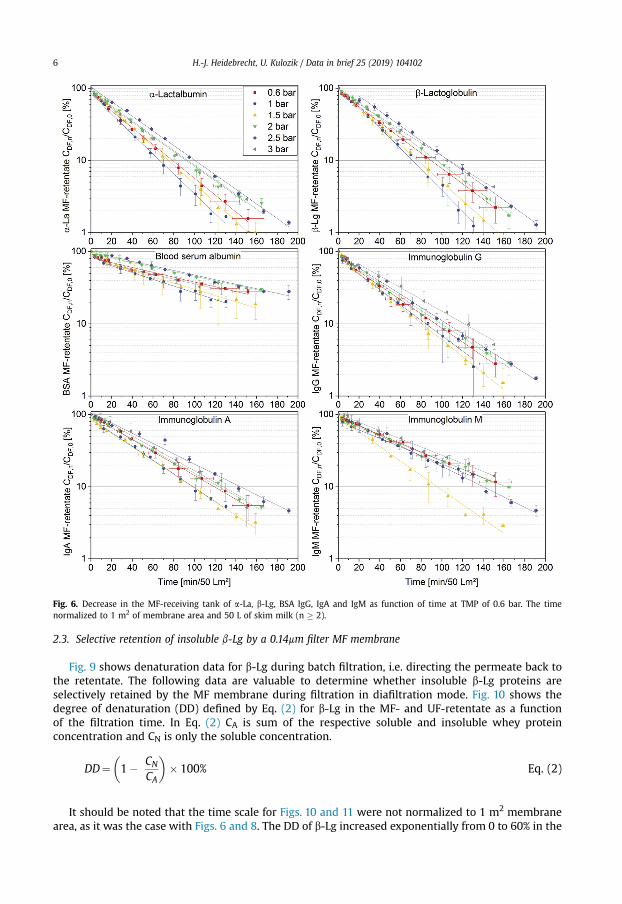
Fig. 6. Decrease in the MF-receiving tank of a-La, b-Lg, BSA IgG, IgA and IgM as function of time at TMP of 0.6 bar. The timenormalized to 1 m2 of membrane area and 50 L of skim milk (n � 2).
H.-J. Heidebrecht, U. Kulozik / Data in brief 25 (2019) 1041026
2.3. Selective retention of insoluble b-Lg by a 0.14mm filter MF membrane
Fig. 9 shows denaturation data for b-Lg during batch filtration, i.e. directing the permeate back tothe retentate. The following data are valuable to determine whether insoluble b-Lg proteins areselectively retained by the MF membrane during filtration in diafiltration mode. Fig. 10 shows thedegree of denaturation (DD) defined by Eq. (2) for b-Lg in the MF- and UF-retentate as a functionof the filtration time. In Eq. (2) CA is sum of the respective soluble and insoluble whey proteinconcentration and CN is only the soluble concentration.
DD¼�1� CN
CA
�� 100% Eq. (2)
It should be noted that the time scale for Figs. 10 and 11 were not normalized to 1 m2 membranearea, as it was the case with Figs. 6 and 8. The DD of b-Lg increased exponentially from 0 to 60% in the

Fig. 7. Flux as function of time at indicated TMP (n � 2).
Fig. 8. Time dependent mass balance. Measured concentration increase in the UF-receiving tank of a-La, b-Lg, BSA, LPO, LF as afunction of time based on 1 m2 of membrane area and 50 L of skim milk (n � 2).
H.-J. Heidebrecht, U. Kulozik / Data in brief 25 (2019) 104102 7

Fig. 9. IgG (A), a-La (B,C), b-Lg (D,E) concentration in skim milk during batch filtration at 50C and 55C compared to the respectiveconcentration in a water bath at 50 �C (55 �C) for 8 h. The time-dependent values were related to the intimate concentration in theskim milk (n ¼ 3).
H.-J. Heidebrecht, U. Kulozik / Data in brief 25 (2019) 1041028
MF-retentate, while the data show no denaturation in the UF feed tank. The data in Fig. 10 illustrate thereason for the increase of denatured protein in the MF feed. The concentration of native and total b-Lgin the MF-retentate is the same (the DD is the ratio of these values) at the beginning of the filtrationprocess. The data show that during the filtration process in diafiltration mode native whey proteinspass through the MF membrane, i.e. the concentration of native proteins in the MF-retentate sinks(see Figs. 4 and 6), and the amount of the few aggregated b-Lg continuously increases. At the same timethe relative DD in Fig. 11 increases disproportionally. After about 4 DF-steps, the curves deviate from
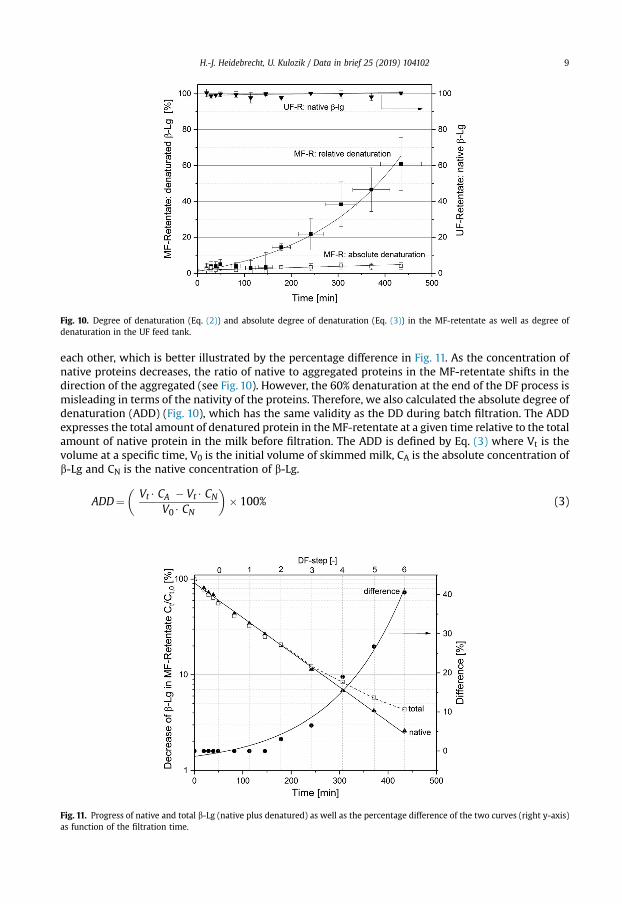
Fig. 10. Degree of denaturation (Eq. (2)) and absolute degree of denaturation (Eq. (3)) in the MF-retentate as well as degree ofdenaturation in the UF feed tank.
H.-J. Heidebrecht, U. Kulozik / Data in brief 25 (2019) 104102 9
each other, which is better illustrated by the percentage difference in Fig. 11. As the concentration ofnative proteins decreases, the ratio of native to aggregated proteins in the MF-retentate shifts in thedirection of the aggregated (see Fig. 10). However, the 60% denaturation at the end of the DF process ismisleading in terms of the nativity of the proteins. Therefore, we also calculated the absolute degree ofdenaturation (ADD) (Fig. 10), which has the same validity as the DD during batch filtration. The ADDexpresses the total amount of denatured protein in theMF-retentate at a given time relative to the totalamount of native protein in the milk before filtration. The ADD is defined by Eq. (3) where Vt is thevolume at a specific time, V0 is the initial volume of skimmed milk, CA is the absolute concentration ofb-Lg and CN is the native concentration of b-Lg.
ADD¼�
Vt$ CA � Vt$ CNV0$ CN
�� 100% (3)
Fig. 11. Progress of native and total b-Lg (native plus denatured) as well as the percentage difference of the two curves (right y-axis)as function of the filtration time.
H.-J. Heidebrecht, U. Kulozik / Data in brief 25 (2019) 10410210
The ADD increased to approximately 5% (Fig. 10), confirming 3e4% denaturation during batchfiltration (Fig. 9).
Acknowledgments
The research project (AiF 18818 N) has been partly funded by the Federal Ministry of Economics andTechnology (via AiF) through Research Association of the German Food Industry (FEI) under thescheme for promoting Industrial Collective Research (IGF). We also acknowledge our industry partner,Biosys UK Limited, for partial financial support of this study. This work was supported by the GermanResearch Foundation (DFG) and the Technical University of Munich within the funding program OpenAccess Publishing. We gratefully thank Waltraud Schmid, Tina Friedenauer, Vera Reitberger, ClaudiaHengst and Heidi Wohlschl€ager for analytical support.
Conflict of interest
The authors declare that they have no known competing financial interests or personal relation-ships that could have appeared to influence the work reported in this paper.
References
[1] H.-J. Heidebrecht, U. Kulozik, Fractionation of casein micelles and minor proteins by microfiltration in diafiltration mode:study of the transmission and yield of the immunoglobulins IgG, IgA and IgM, Int. Dairy J. 93 (2019) 1e10. https://doi.org/10.1016/j.idairyj.2019.01.009.
[2] J. Dombrowski, F. Johler, M. Warncke, U. Kulozik, Correlation between bulk characteristics of aggregated b-lactoglobulin andits surface and foaming properties, Food Hydrocolloids 61 (2016) 318e328. https://doi.org/10.1016/j.foodhyd.2016.05.027.
[3] L.I. Lin, A concordance correlation coefficient to evaluate reproducibility, Biometrics 45 (1) (1989) 255e268. https://doi.org/10.2307/2532051.
[4] G.B. McBride, A Proposal for Strength-Of-Agreement Criteria for Lin's Concordance Correlation Coefficient, NIWA ClientReport, 2005. HAM2005-H2062.
[5] C. Chen, H. Chang, C.-C. Chen, H.-M. Chang, Effect of thermal protectants on the stability of bovine milk immunoglobulin G,J. Agric. Food Chem. 46 (9) (1998) 3570e3576. https://doi.org/10.1021/jf970980f.
[6] J. Dumpler, I. Kieferle, H. Wohlschl€ager, U. Kulozik, Milk ultrafiltrate analysis by ion chromatography and calcium activity forSMUF preparation for different scientific purposes and prediction of its supersaturation, Int. Dairy J. 68 (2017) 60e69.https://doi.org/10.1016/j.idairyj.2016.12.009.
[7] H.-J. Heidebrecht, B. Kainz, R. Schopf, K. Godl, Z. Karcier, U. Kulozik, B. F€orster, Isolation of biofunctional bovineimmunoglobulin G frommilk- and colostral whey with mixed-mode chromatography at lab and pilot scale, J. Chromatogr. A1562 (2018) 59e68. https://doi.org/10.1016/j.chroma.2018.05.046.