data collection and analysis for sustainable forest ... commission directorate-general viii...
TRANSCRIPT

EUROPEAN COMMISSIONDIRECTORATE-GENERAL VIIIDEVELOPMENT
Data Collection and Analysis for Sustainable Forest Managementin ACP Countries
Linking National and International Efforts
EC-FAO PARTNERSHIP PROGRAMME (1998-2000)Tropical forestry Budget line B7-6201/97-15/VIII/FOR
PROJECT GCP/INT/679/EC
PROCEEDINGS OF SUB-REGIONAL WORKSHOP ONFORESTRY STATISTICS
SADC REGION
MUTARE, ZIMBABWE30 NOVEMBER – 4 DECEMBER 1998

page ii
WORKSHOP PROCEEDINGS FORESTRY STATISTICS – MUTARE, ZIMBABWE (30 Nov. – 4 Dec. 1998)
Acronyms
ACP African, Caribbean and PacificADG Assistant Director GeneralCATIE Centro Agronomia Tropical de Investigación y de Enseñanza.CFO Chief Forestry OfficerCIRAD Centre de coopéra. internat.en recherche agronomique pour le développementCNEARC Centre national d'études agronomiques des régions chaudesCNRS Centre national de recherche scientifique CSIRO Common Wealth Scientific and Industrial Research OrganizationDAO District Agriculture OfficerDCFL Director of Conservation, Forestry and Land Use PlanningEHESS École des hautes études en sciences socialesENGREF École national du génie rural, des eaux et des forêtsFAN Forest Action Network (Kenya) FAO Food and Agricultural Organization of the United NationFITC Forest Industries Training CentreFOSA Forestry Outlook Study for Africa GBZ Green Belt Zone GDP Gross Domestic ProductGOL Government of LesothoI.E.M.P Lesotho Energy Master PlanICRAF International Centre for Research in Agro-forestryIGAD Inter-Governmental Authority on DevelopmentINRA Institut national de recherche agronomiqueIUCN International Union of Conservation of Nature MoA Ministry of AgricultureNFAP National Forestry Action PlanNWFP Non-wood forest productORSTOM Institut français de recherche scientifique pour le développ. en coopérationRAFO Regional Office for Africa - Forestry groupRAFR Regional Office for Africa - OperationsTCP Technical Co-operation ProgrammeTOF Trees outside the forestUNEP United Nations Environmental ProgramWAICENT World Agricultural Information Centre

FSTCU – SADC PRESENTATION
WORKSHOP PROCEEDINGS FORESTRY STATISTICS – MUTARE, ZIMBABWE (30 Nov. – 4 Dec. 1998)
3
1. INTRODUCTION AND BACKGROUND
The Sub-Regional Workshop for South-African Countries on “Data Collection and Analysis forSustainable Forest Management in ACP Countries - Linking National and InternationalEfforts” was held in Mutare, Zimbabwe, from 30 November to 4 December 1998. The event wasorganised by FAO with the financial support of the EC through the EC-FAO PartnershipProgramme (Tropical Forestry Budget Line B7-6201/97-15/VIII/FOR - Project GCP/INT/679/EC).
This report provides the proceedings of the workshop, including an overview of the Project, theworkshop objectives and conditions, conclusions and lessons learnt from this exercise, which maybe useful during the implementation of future workshops.
FSTCU – SADC PRESENTATION
WORKSHOP PROCEEDINGS FORESTRY STATISTICS – MUTARE, ZIMBABWE (30 Nov. – 4 Dec. 1998)
4
2. THE WORKSHOP AT MUTARE (ZIMBABWE) 2.1. The Organisation of the Workshop
The Zimbabwe Workshop on Data Collection and Analysis for Sustainable Forest Management inACP Countries was held in Mutare, Zimbabwe from 30 November - 4 December 1998 under thesponsorship of FAO, and with the support of the EU through the EC-FAO Partnership Programme.
This workshop was the second of a series of five - four of which are taking place in Africa - andfocussed geographically on ten selected countries of the SADC sub-regional organisation, namely:Angola, Botswana, Lesotho, Malawi, Mozambique, Namibia, South Africa, Swaziland, Zambia andZimbabwe.
With the exception of Namibia, all the above countries were able to send at least one participant. Inthe case of Malawi, Mozambique, South Africa and Zambia, two participants from each countrycame, and the host country, Zimbabwe, had nine participants. There were five FAO staff memberspresent. The private sector and several NGO’s were invited but only one participant from an NGOand one from the private sector attended. A list of participants is attached as Appendix I.
The workshop took place in the Forest Industries Training Centre (FITC) by kind invitation of theZimbabwe Forestry Commission. Despite some difficult logistics at the beginning, it is believed thatthe choice of Mutare as location for the workshop was good. It has shown the SADC participantsthe training sawmill, veneer and plywood plant at FITC (an FAO implemented SADC project) and asample of the fine pine plantation forests and sound tree breeding research done by the ZimbabweForestry Commission.
The workshop, which lasted 4½ days, had 2 parallel groups (Forest Resources and ForestProducts/Information Technology) for 1½ days. A copy of the agenda is attached as Appendix II. Asenior officer of the host country, Mr. Crispen Marunda of the Zimbabwe Forestry Commission,was invited to chair the plenary sessions. The two working groups were chaired by Ms. SebuengKelatwang (South Africa) and Mr. Orastes Mandrate Nakala (Mozambique), respectively.
The participating countries were provided with several background documents related to the forestrysector together with the presently available information on the forest resources and products of theregion. This information had been sent approximately one month before the workshop, through theFAO Representative, to each country. Various other Secretariat papers were distributed during themeeting (see list of documents provided in Appendix III).
Useful additions to the agenda were:� an exhaustive preliminary meeting with the national chairman to review the agenda and
decide “who does what”;� a summary of the main trends (by chair) arising from the country presentations, as a
contribution to the parallel sessions;� a review of the parallel session reports as a contribution to the final plenary session in
which the recommendations were drafted.

FSTCU – SADC PRESENTATION
WORKSHOP PROCEEDINGS FORESTRY STATISTICS – MUTARE, ZIMBABWE (30 Nov. – 4 Dec. 1998)
5
2.2. Introductory addresses and highlights
The workshop was officially opened by the Acting General Manager of the Forestry Commission ofZimbabwe, Mr Phillip Kariwo, who welcomed the participants to Zimbabwe and to FITC. Heexpressed his desire for a constructive meeting. He highlighted the importance of forest statistics indecision making and urged all to actively participate in the workshop.
The Deputy Italian Ambassador, Ms Munzi, also welcomed the participants to FITC. She spoke ofher country's key role in establishing FITC through an FAO's field project. She reviewed current Italianinvolvement in the forestry and natural resources sector.
Owing to alternative commitments, no Representative of FAO's Country Office in Zimbabwe was ableto attend. In his capacity as Senior FAO Officer present, Mr Jim Ball, Senior Forest Officer, ForestResources Division, presented the workshop objectives and gave an overview of FAO ForestryDepartment's activities in Africa. He stated that forestry information is needed for three main purposes:a) national policy development and planning; b) investment appraisal and decision making, and c)international policy development and negotiation. Most of the information currently compiled by FAOfalls broadly into two main areas namely: a) Forest resources information and statistics on the area,stocking, growth, condition and type of forest resources; and b) Forest product information andstatistics on production, consumption and trade.
Mr Peter Lowe (Forestry Planning Officer, Regional Office for Africa, FAO), conveyed the cordialgreetings of Mr. Pape Kone, FAO's Senior Forest Officer in Africa, and presented a paper entitledthe Forestry Situation in Africa (see Appendix III A). This paper reviewed the needs for foreststatistics and, in particular, emphasised the importance of regional and sub-regional collaborationamong countries to provide policy makers with harmonised data in order that they might developand adopt common negotiating positions in global discussions of sustainable forest management.The speaker suggested that considerations of the contribution of forests to Food Security provided apowerful theme on which foresters could approach data collection, and he provided variousexamples. Finally, he highlighted various problems and deficiencies in forestry data collection inAfrica which need to be addressed, and in so doing, informed the participants of the proposedForestry Outlook Study for Africa (FOSA) which FAO was initiating in concert with variouspartners, including the EU.
Mr Charles Omoluabi, Forestry Officer (Forestry Policy and Planning Division) presented a draftreport entitled “Methodological guidelines for improving Forestry statistics in Africa”, which wascommissioned by the FAO Regional Office for Africa at the request of the African Forestry andWildlife Commission (AFWC) at its 10th Session in South Africa, 1995. Strong emphasis wasplaced on the need for a sub-regional approach to forestry information collection, focussed on thekey areas of forest resources, timber production, wood energy, non-wood forest products,operational costs and the socio-economic-political environment.
All participants were given the chance to introduce themselves. Each participating country presenteda paper on the current status of the forest sector. For each presentation, gaps in terms of informationwere identified and these formed the basis for the recommendations. Generally, it wasacknowledged in all country presentations that information on plantation forests is often adequateand up-to-date, but the information on NWFP and non-timber forest products is lacking.
Two working groups one on forest resources and another on forest products were formed and were

FSTCU – SADC PRESENTATION
WORKSHOP PROCEEDINGS FORESTRY STATISTICS – MUTARE, ZIMBABWE (30 Nov. – 4 Dec. 1998)
6
given the task of reviewing the set of documents presented by FAO. In the plenary final session theconclusions and recommendations of both working groups have been discussed. See Report of theForest Resources Team, the report of the Forest Products Team, and a set of general recommendationspresented and approved by the audience.
An informal meeting to introduce the concept of pilot studies in the EC-FAO Project and to airsome ideas was held over dinner with the Zimbabwean delegates on the final evening (3/12) of theMutare workshop. The delegation was led by Mr David Gwaze, Policy Coordinator, ZimbabweForestry Commission.
2.3. Presentation of Country Briefs
The participants from each of the nine countries attending presented in plenary session a countrybrief according to a format distributed prior to the workshop. The country presentations went onlonger than expected but were interesting. However, the majority of the participants did not focusenough on the topic of the workshop: statistics, their collection, analyses, uses and reporting. Instead,too much time was spent on generalities.
None of the reports included wildlife aspects to any significant degree, which may be attributed to alack of emphasis in the standard format, as well as institutional factors in the various countries. SeeAppendix V for the full Country Reports.
The country report of Angola described the socio-economic, political and security context for forestmanagement in the country. Despite the debilitated state of government administration in Angola,the country report contained statistics on forest resources, plantations and forest production,including fuelwood. However, in general, there is not yet any appropriate network of data collectionin the forest sector, no forest inventory, and there are few trained foresters - a situation that preventsany formal forest management from being undertaken.
The country report of Botswana provided an overview of the forestry sector, highlighting somebasic source documents. Of particular interest is the stated area (93%) of natural woodlands andforests in Botswana. This compares with a figure of 24.6% in the Forest Resources Assessment1990, a discrepancy which underlines the need for common terminology and definitions. Overall,the country report concluded that there is insufficient data relating to the forest sector in Botswanato guide the sustainable management of wood-lands and forests, and that there is a need for a ForestStatistics Unit to take on this challenge.
The country report of Lesotho provided extensive information of the general socio-economicbackground, but is less detailed in regard to the forestry sector. The presentation highlighted someof the difficulties faced by forestry officers in working effectively within the decentralisedgovernment administration.
The country report of Malawi provided a range of information on natural forest resources,plantations and forest production. It is interesting to note that productivity figures are quoted fornatural forests and that, according to national estimates, the deforestation rate is 1.5 - 2.0% annually- one of the highest figures in Africa. In regard to plantations, the report gives annual productivityfigures but cautions that these are likely to be much reduced owing to "the destruction of manyplantations by fire". The report concludes with an outlook prediction that wood consumption

FSTCU – SADC PRESENTATION
WORKSHOP PROCEEDINGS FORESTRY STATISTICS – MUTARE, ZIMBABWE (30 Nov. – 4 Dec. 1998)
7
demand, driven by population growth, will outstrip the sustainable supply levels in the late 1990s.
The country report of Mozambique gave a comprehensive picture of the forest sector with up-to-date figures on forest resources, forest production and the processing industry. This availability ofdata is due to a recent national forest inventory and a forest information collection and managementsystem, which were outputs of a UNDP funded FAO project in the National Forestry and WildlifeDirectorate.
Although not present at the workshop, Namibia submitted a short report on the status and use offorestry statistics in that country. This dealt with the institutions involved, data collection and reportproduction.
The country report of South Africa recognised many shortcomings of the forest policy and datacollection priorities inherited from the previous government, which had focussed on the informationrequirements of the formal industrial forestry sector. Broader based information is now essential forthe formulation of criteria and indicators of sustainable management and the development of forestresource accounting and, more specifically, to better manage national water resources. The newForest Act requires a report on the entire forest sector for 1999.
The country report of Swaziland surveyed the relative roles of natural and plantation forests in thekingdom. Recent figures are available for forest resources and forest production, the latter beingbased mainly on the private sector. The presentation concluded that there is an imbalance betweenthe excellent achievements of the private plantation sector, whilst the government is constrained inthe management of natural forests by a lack of qualified personnel.
The country report of Zambia gave a useful and detailed overview of the forest sector, based in parton outputs from the Zambia Forestry Action Plan. However, it should be noted that many of thestatistics presented are derived from expert estimates and localised inventories. The most recentnational forest inventory in Zambia dates from the 1960s. Notably, the report contains informationon wood supply from non-forest areas, including Trees Outside the Forest. The report concludesthat, owing to a lack of detailed inventory data and inadequate resources, forest management inZambia is not currently based on sustainable practices. Nevertheless, the report manages to presentvarious supply-demand scenarios through to the year 2016.
The country report of Zimbabwe reflected the maturity of the commercial plantation sector and,also, recent innovations in information on indigenous woodlands; for example, on the valuation offorest products and services, including NWFPs. However, coverage of natural forests is stillconsidered inadequate. The presentation revealed that private sector organisations are active and, insome cases, more effective in collecting forest sector data pertaining to commercial sector, but gapsstill exist in respect of small tree growers.

FSTCU – SADC PRESENTATION
WORKSHOP PROCEEDINGS FORESTRY STATISTICS – MUTARE, ZIMBABWE (30 Nov. – 4 Dec. 1998)
8
2.4. Other Presentations
Forest Sector Technical Cooperation Unit – FSTCU
Responsibility within SADC for the Forest Sector Technical Cooperation Unit (FSTCU) mandatedto Malawi by the Council of Ministers in Maseru, Lesotho in 1985. Mr Sam Kainja of Malawipresented an overview of the mandate, responsibilities, functions, programme and projects ofFSTCU (see Appendix V A). It was noted that FSTCU has a specific mandate to manage relevantinformation and data concerning the forest sector within its six programme areas of:♦ Forest Training and Education;♦ Forest Research;♦ Forest Utilisation and Trade;♦ Forest Resource Assessment;♦ Forest Resource management;♦ Forest Industry Development.
It was pointed out that SADC currently has six forestry projects underway, two partially funded andsix un-funded. In this last category are two potential projects of particular significance for forestsector information, namely:♦ Regional Vegetation Mapping;♦ Development of Forestry Information Management Network System in SADC Region.
The first of these originates from proposals discussed in the early 1990s for a sub-regional forestinventory project, and has now been broadened to encompass a more general vegetation mapping. Itis likely that the project could form part of the Africover vegetation mapping project, but fundinghas not yet been identified, although the EU has previously expressed some interest.
The second project proposal, for a forest information management network , would provide an idealmeans for the collection, harmonisation and exchange of forestry data on a sub-regional basis. Atpresent, no funding source has been identified.
Trees Outside the Forest
An introductory paper on Trees Outside the Forest (TOFs) was presented to the forest resourcesparallel session (see section 5 below) by Mr Peter Gondo of Zimbabwe. This was intended toprovide a basis for discussion among participants, many of whom were relatively unfamiliar withthis "non-forest" dimension of foresters' domain. Particular attention was given in the presentationto the practical difficulties of measuring and assessing TOFs in comparison forests and woodlands(see Appendix III D).
Overview of Data Collection Requirements
In view of the high number of data formats distributed by FAO to workshop participants, Mr PeterLowe of FAO provided an Overview of Data Collection Requirements (see Appendix III. B).

FSTCU – SADC PRESENTATION
WORKSHOP PROCEEDINGS FORESTRY STATISTICS – MUTARE, ZIMBABWE (30 Nov. – 4 Dec. 1998)
9
Presentation of the Working groups The discussion group was introduced by presentations made by the Senior Forestry Officer, FAOHQs, and the Regional Forestry Officer, FAO RAFR. The Forest Resources Working Group wasasked to consider the following aspects of forest resource information:
Review the classification, definition and structure of the core forest resources data (i.e. naturalforest area, other wooded land, forest types and ecological zones, volume and biomass,protected areas, wood supply potential and changes over time);
Review and validate FAO and national statistics on forest resources and document othervaluable data sources made available by the participating countries;
Discuss problems, constraints, and capacity needs in order to improve present methods of datacollection, processing, and dissemination;
Analyse existing data on Plantations, NWFPs, and TOF, and suggest improved methods for datacollection, analysis and dissemination.
The discussion group on Forest Products and Information Technology was briefed by the ForestryOfficer from FAO headquarters. The Forest Products Working Group was asked to consider thefollowing aspects of forest products:
Review the classification, definition, and measurement procedures of forest products inparticipating countries, in order to assess their coverage and socio-economic relevance;
Review of country data on production, prices, and trade of forest products, including fuelwoodand charcoal, and other relevant forest products other than wood (gums, myrrh, incense, etc.);and
Analyse the problems related to data collection, validation, and dissemination by usingconventional methodologies and new information technologies.
3. RESULTS AND CONCLUSIONS OF TECHNICAL SESSIONS
3.1. Forest Resources The Forest Resources Working Group was introduced by Mr Peter Gondo (Zimbabwe ForestryCommission). Under the Chairmanship of Ms Sebueng Kelatwang (South Africa), who was assistedby Mr. Kasizo Chirambo (Malawi) and Mr Dominick Kwesha (Zimbabwe) as rapporteurs, the groupwas asked to consider the following aspects of forest resource:
Forest Resources
1. Review the classification, definition and structure of the core forest resources data(natural forest area, other wooded land, forest types & ecological zones, volume &biomass, protected areas, wood supply potential and changes over time);
2. Review and validate FAO and national statistics on forest resources and documentother valuable data sources, made available by the participating countries;
3. Discuss problems, constraints, and capacity needs in order to improve presentmethods of data collection, processing, and dissemination; and
4. Analyse existing data on Plantations, NWFPs, and Trees Outside Forests, andsuggest improved methods for data collection, analysis and dissemination.
The working group on Forest Resources reached a number of conclusions and drafted

FSTCU – SADC PRESENTATION
WORKSHOP PROCEEDINGS FORESTRY STATISTICS – MUTARE, ZIMBABWE (30 Nov. – 4 Dec. 1998)
10
recommendations. In common with the other working group on Forest Products, some of theconclusions were of a more general nature and those are presented below.
Trees outside Forests (TOFs)♦ The group recognised the environmental and socio-economic importance of TOFs, and called
for the assessment of their contribution to the economy in each country;♦ The group noted that definitions of TOFs provided by FAO did not always match country
perceptions of TOFs; FAO was urged to reconsider its present definition of TOFs, particularlyas regard tree height and crown cover density, and to limit consideration to those trees with ademonstrable economic and social function;
♦ The group was concerned about the appropriate assessment methodologies and possible highcosts involved, and welcomed FAO's initiatives in regard to Country Briefs and Pilot Studies; allthe countries present showed interest in preparing country briefs on TOFs, and also observedthat FAO was willing to support both the preparation of the country briefs and the pilot studieson TOFs.
Forest Cover Classification♦ The group recognised the importance of having concrete terms and definitions, and that these
should be determined primarily by national needs. It also noted the importance of compatibilityand exchange of forest cover information at sub-regional level.
♦ The group noted that harmonisation of forest cover classification has already been initiatedthrough SADC, and the meeting reaffirmed the importance of the SADC classification whichhad been developed during an EC funded project feasibility study. It also noted that SADCmember states have already endorsed this classification during a meeting held in 1997, inPretoria, South Africa, but that follow-up with the SADC Vegetation Mapping Project was stillawaiting funding.
Information for monitoring change♦ The group recognised the importance to Sustainable Forest Management (SFM) of recurrent
assessment of Permanent Sample Plots (PSPs) for monitoring change in forest productivity,health and condition, and for providing indicators of SFM;
♦ Countries should prepare a comprehensive review of the status of their PSPs, which wouldsupport the proposed role of FSTCU in compiling PSP information for the region.
Plantations♦ The group observed that there is variation in the amount of plantation data and details collected
amongst the participating countries; that such data may often be misleading and unreliable, inparticular, data collection from the private sector is difficult to acquire; it was also noted that thequestionnaires from FAO, as in many other instances, were too detailed and laborious tocomplete; in those instances when plantation data is unavailable, participants approved the useof "expert opinion" to make estimates.

FSTCU – SADC PRESENTATION
WORKSHOP PROCEEDINGS FORESTRY STATISTICS – MUTARE, ZIMBABWE (30 Nov. – 4 Dec. 1998)
11
Fires and Forest Health♦ The group recognised that fires are severe actual and potential hazards to SFM. Information on
fire affecting plantations is well recorded by most countries, but there is little information fornatural forest;
♦ Participants noted that various studies (e.g. CIDA, 1995) have been carried out in the Regioninto the economic importance of fires;
♦ In general there seemed to be few problems with forest pests and diseases, although elephantsand baboons were reported as damaging in two countries.
3.2. Forest Products
Under the Chairmanship of Mr. Orastes Mandrate Nakala, who was assisted by Ms. Anne Chishawaas rapporteur, the Forest Products Working Group was tasked to consider the following aspects offorest products information and information technology:
Forest Products
1. Review the classification, definition, and measurement procedures of forestproducts in participating countries, in order to assess their coverage andsocio-economic relevance in the Region.
2. Review of country data on production, prices, and trade of forest products,including fuelwood and charcoal, and other relevant forest products other thanwood (gums, myrrh, incense, etc.).
3. Analyse the problems related to data collection, validation, and dissemination byusing conventional methodologies and new information technologies.
The working group on forest products and information technology reached the following principleconclusions and recommendations (see below):
Non-Wood Forest Products (NWFPs).♦ The meeting discussed the format and content of the tables on NWFPs prepared by FAO, and
reviewed definitions in relation to the exclusion of small wood (Non-Timber) products, and alsonoted the apparent exclusion of TOFs. It was agreed that information was generally sparse andinadequate.
Fuelwood♦ The importance of fuelwood and the supply-demand situation in participating countries was
reviewed, and data problems were assessed with particular emphasis on timeliness,measurement problems, and on the need for reliable data for national planning purposes.
Informal Wood Production♦ The meeting noted the growth in small-scale wood industries, particularly in the informal sector,
and the need to obtain reliable data covering this aspect.

FSTCU – SADC PRESENTATION
WORKSHOP PROCEEDINGS FORESTRY STATISTICS – MUTARE, ZIMBABWE (30 Nov. – 4 Dec. 1998)
12
3.3. Institutional Aspects
National Forest Statistics Collection
Both working groups recognised that relevant and reliable information is essential for policydevelopment, updating and revision. But, all participants reported that their data collection capacitywas limited by shortage of funds for operational activities to collect store, and analyse data relevantto sustainable forest management. Many participants also reported difficulties in data collection andanalysis due to high staff turnover and lack of continuity. Most countries reported the presence ofskilled staff, but some do not, especially in certain fields such as data analysis. Participants drewattention of FAO and other donors to the need for training and institutional support in the field ofdata collection and analysis for sustainable forest management and appropriate policy development.
The groups also recognised the increasing importance of participatory approaches in SFM. In viewof the general trend towards privatisation, several countries expressed concern over the weak co-operation between the public and the private sectors and NGOs. It was felt that Forest Departmentsand data gathering institutions of member states should liase closely with the relevant stakeholders,and explore new ways of collecting data from community and other participatory schemes, throughpartnership with NGOs where appropriate.
Participants drew the attention of FAO and other donors to the need for training and institutionalsupport in the field of data collection and analysis for SFM and appropriate policy Development.
Data Exchange with FAO♦ It was noted that the data sets prepared by FAO had not been received before the meeting by all
participants and thus could not be checked by participants. Concern was expressed that FAOdata collection forms lacked standardisation and that they were, in parts, irrelevant to specificcountry conditions. It was felt that these formats could be better designed to permit selectivityin data completion by countries.
♦ The meeting noted that forest statistics should serve primarily national needs for SFM, but thatcountries should make such data available to international institutions and agreements in atimely manner within their capacity and the availability of the data.
3.4. Pilot Study Project for Zimbabwe
The purpose and modalities: Zimbabwe could host a pilot project (financed through the EC-FAOprogramme) to look deeper into collection and analysis of data on forest products and services fromnatural forests and trees outside forests. These aspects were brainstormed by a group of SeniorForestry Officers from the Zimbabwean Forestry Commission and that can be included in the studyare data requirements to analyse the supply and demand dynamics of fuelwood at the sub-nationaland national level, analysis of the impact of the tree planting activities in quantitative terms (RuralAfforestation, Tree Growing and Tree Care Competition and the National Tree Planting Day) andanalysis of the impact of introducing co-management schemes in gazetted state forests. Generally itwas acknowledged that not much information is available on the volumes or quantities of NWFPobtained from natural forests. It is thus impossible to assess whether natural forests are beingmanaged sustainably or not.
The proposed project will aim to develop methodologies of data collection and analysis and to test

FSTCU – SADC PRESENTATION
WORKSHOP PROCEEDINGS FORESTRY STATISTICS – MUTARE, ZIMBABWE (30 Nov. – 4 Dec. 1998)
13
the applicability of the methodologies in assessing whether natural forests, or Trees Outside Forestsor artificial plantations/woodlots are being managed sustainably. A fuller concept note will beprepared in collaboration with FAO sometime early this year. It was indicated that the pilot studywill be financed for a minimum of US$ 50, 000 for three years until 2002.
Review of Forest Statistics in Zimbabwe: The review is based on the information on Zimbabwethat was provided during the workshop.
Forest Resources Set: The information on Forest Resources was corrected and edited by Dr. D.Gwaze. An edited paper was sent to FAO, Rome.
Forest Products: The information on plantation forest products is available and a number of tablesshowing the latest figures on forest products are included. Detailed statistics as required by FAO onforms FP1 to FP5 require more time and visits to different timber growers and producers.
Information on non-woody forest products, firewood produced is not available at a national level.The absence of information on such products forms the basis of the pilot study proposed forZimbabwe under the EC-FAO Partnership programme.
An informal meeting to introduce the concept of pilot studies in the EC-FAO Project and to airsome ideas was held over dinner with the Zimbabwean delegates on the final evening (3/12) of theMutare workshop. The delegation was led by David Gwaze, Policy Coordinator, Zimbabwe ForestryCommission. They identified the following, in order of priority:♦ NWFP, both as resource and as products (items such as carvings and mushrooms); other SADC
countries might be included and be tied in with an ICRAF initiative;♦ Evaluation of extension and tree planting programmes (as part of TOFs);♦ Biomass/Fuelwood/Yield studies. Various ideas were put forward, including:♦ Analysis of permanent sample plot: results are collected but not yet computed; this would
support the workshop and would involve other neighbouring countries;♦ an investigation of fuelwood dynamics;♦ Plantations, including the development of a management information and modelling system for
testing options.
3.5. Relevance of workshop to technical responsibilities♦ There was a loud and clear message of support from the SADC countries to the EC-FAO
initiative;♦ All participants, even those not specialised in statistics, recognised the prime importance of the
workshop;♦ For at least six overseas participants, and several of the national Zimbabwean participants the
workshop was very relevant and the information useful in the execution of their daily duties onreturn home;
♦ The workshop provided an occasion to identify good candidates for TCDC programmes and forthe recruitment of national consultants and focal points for specific subjects (FRA, NWFP,woodfuels, TOF, Yearbook, etc.); The FAO recruitment roster will be updated with somePersonal History Forms for African sub-regional and regional Forestry Officers;
4. WORKSHOP RECOMMENDATIONS

FSTCU – SADC PRESENTATION
WORKSHOP PROCEEDINGS FORESTRY STATISTICS – MUTARE, ZIMBABWE (30 Nov. – 4 Dec. 1998)
14
4.1. Forest Resources Working Group Recommendations
Trees outside forestsThe working group recognised the environmental and socio-economic importance of Trees OutsideForests (TOFs); the working groups acknowledged FAO's initiatives with regards to starting pilotstudies on the subject; the following recommendations were made:♦ Reconsider (for FAO) the its present definition of TOFs, particularly as regard tree height and
crown cover density, and should also include a clause into the definition limiting TOFs to thosewith a demonstrable economic and social function.
♦ Convene a regional workshop by FSTCU with assistance from FAO or other appropriateinstitution, which would use as direct inputs the country briefs on TOFs to be prepared throughFAO assistance.
Forest cover classificationIt was recognised that there is need to have concrete terms and definitions of forests resources, thedefinitions should reflect national needs and that the information should be compatible andtransferable at the sub-regional level. The following recommendations were made:♦ SADC will do what it can to find a donor to support the implementation of the SADC
Vegetation mapping and Information Network Projects.♦ Countries should prepare a comprehensive review of the status of their Permanent Sample Plots.
PlantationsThe working group observed the inconsistency of data on plantations and detail amongst the SADCcountries. It was noted that questionnaires from FAO were too detailed and laborious to complete.Recommendations on plantation data were as follows:♦ institutions responsible for data collection should work closely with growers, producers and
users and special attention should be given to the small scale growers and millers.♦ where plantation data is missing, FAO and countries should use "expert opinion" to make
estimates.
Fires and forest healthFires are actual and potential hazards to natural woodlands. It was noted that there is a dearth ininformation on the effects of fires on the condition and health of natural forests. It wasrecommended that:♦ countries should, where necessary, adjust forest areas to reflect losses arising from drought, fire
and other causes;
♦ SADC, with FAO assistance, should follow up studies on the causes and economic importanceof fires;
♦ Countries should, improve their record keeping in regard to bush-fires and, where possible,distinguish controlled from wildfires;
♦ Greater regional co-operation should be sought in the monitoring of bush-fires.
4.2. Forest Products Working Group Recommendations
Non-wood forest products (NWFP)The current definition of NWFP was considered too sparse and inadequate and the following

FSTCU – SADC PRESENTATION
WORKSHOP PROCEEDINGS FORESTRY STATISTICS – MUTARE, ZIMBABWE (30 Nov. – 4 Dec. 1998)
15
recommendations were made:♦ FAO should review existing definitions of NWFPs to ensure inclusion of products from TOFs
and of small wood products;♦ The existing reporting formats prepared by FAO should be modified to include data source and
target end-user of the report’;♦ FAO should include products from Trees Outside Forests in the definition of NWFP;♦ FSTCU with assistance from FAO should take lead in developing appropriate methodology and
assessment criteria for data collection on NWFPs.♦ National reports on NWFPs (including small wood products) should make use of varied formats
such as tables, text and maps.
Fuelwood dataGross fuelwood data does not reflect the supply and demand dynamics in a country. There is need tore-visit the quality of data on fuelwood to reflect supply and demand situations. The followingrecommendation was made:♦ countries should compile statistics on fuelwood supply, distribution, consumption and trade at
national and sub-national levels.
Informal wood productionThe working group noted the proliferation of small scale wood industries, particularly the informalsector, and the need to obtain reliable data covering such production scenarios. The followingrecommendation was made:♦ FSTCU with FAO assistance should develop strategies and methodologies applicable at the
regional level, for capturing data on wood production from the informal sector.
4.3. Recommendations on Aspects of Forest Statistics
The following recommendations were made concerning data collection capacity within SADCcountries, high staff turnover, lack of continuity, lack of institutions/offices specifically tasked withcompilation and analysis of forest data:♦ FAO, among other institutions, should promote technical co-operation in all aspects of data
collection, analysis and dissemination between countries within the region and within theframework of the TCDC programme.
♦ FAO should support and work with the Forest Sector Technical Cooperation Unit (FSTCU) ofSADC in joint initiatives on forest sector information and statistics.
♦ Countries should seek collaboration through FSTCU, and with the assistance of FAO anddonors, in improving their updating their data collection and analysis for SFM.
♦ FSTCU, FAO and countries should endeavour to improve feedback of statistical reports in orderto encourage greater participation in data collection and use of results for SFM.
♦ Countries should explore new ways to involve stakeholders (communities, NGOs and theprivate sector) in the primary collection of forestry statistics, and should improvecommunications with the private sector in this regard.
♦ Each country should establish a Forest Statistics Office to be responsible for forest sectorstatistics, and also designate an FAO Focal Point for contact and information exchange.
♦ Countries should examine their own forest sectors to remove constraints arising fromorganisation structures in order to ensure smooth and free data flow. Promote technical co-
FSTCU – SADC PRESENTATION
WORKSHOP PROCEEDINGS FORESTRY STATISTICS – MUTARE, ZIMBABWE (30 Nov. – 4 Dec. 1998)
16
operation in all aspects of data collection, analysis and dissemination between countries withinthe SADC region.
♦ remove constraints arising from institutional structures to ensure smooth and free data andinformation flow.
♦ improve feedback on statistical reports in order to encourage greater participation in datacollection and use.
Data exchange with FAO♦ FAO should present country data sets such that countries only need consider sections relevant to
their own circumstances;
♦ FAO should ensure that data exchange between countries and FAO should be harmonised andmade available in electronic formats;
♦ Country contact points should review the data sets prepared by FAO for their countries toconfirm that they are complete, up-to-date and accurate, and should return them when correctedto FAO as soon as possible.
4.4. Recommendations for future workshops♦ Send the workshop invitation 3 months before the workshop starts so that the appropriate staff
can make itself available to attend;♦ Send the documentation for the workshop 2 months ahead of time so that the appointed officers
can brief themselves well and prepare their country report well in advance;♦ Screen the country report before the workshop starts so that the relevance (forest statistics and
the way it is gathered) is emphasised; timely preparation of the workshop is therefore crucial.

FSTCU – SADC PRESENTATION
WORKSHOP PROCEEDINGS FORESTRY STATISTICS – MUTARE, ZIMBABWE (30 Nov. – 4 Dec. 1998)
17
� F APPENDXESAPPENDIX I: WORKSHOP AGENDA
Mutare, Zimbabwe30 November - 4 December 1998
MONDAY 30 NOVEMBERMorning♦ Welcome address by the Zimbabwean Chairman (Mr. Crispen Marunda);♦ Welcome remarks by Mr. Phillip Kariwo, General Manager, PC;♦ Welcome remarks by Ms. Monzi, Italian Embassy;♦ Photo session (Mr. Sibanda);♦ Welcome and introductory address by Co-Chairman (Mr. J. Ball): Objectives and functions of
socio-economic and forestry statistical information; Role and activities of FAO ForestryDepartment; and Objectives of the project and workshop;
♦ Review of workshop documents (Mr. Peter Lowe);♦ African Forestry and Wildlife Commission Initiative on Forestry Statistics Development (Mr.
Charles Omoluabi);
Welcome Lunch
Afternoon♦ Presentation by FSTCU Representative – SADC Region overview – Mr. Sam Karnya;♦ The Forestry Situation in Africa by FAO Forestry Officer (Regional Office for Africa);♦ Presentation of FAO’s Forest Resources Assessment (FRA 2000) (Mr. Jim Ball);♦ Reports of participants on the status of forestry statistics in their countries and its use in forest
policy and planning;♦ presentation – Angola;♦ presentation – Botswana;♦ Visit of FITC sawmill;♦ Evening: Introduction of all participants and welcome party.
TUESDAY 1 DECEMBER
Morning: ♦ Continuation of previous session: Reports of participants on the status of forestry statistics in
their countries and their use in policy and planning;♦ Country presentation for Lesotho;♦ Country presentation for Malawi;♦ Country presentation for Mozambique;♦ Country presentation for South Africa;♦ Country presentation for Swaziland;♦ Country presentation for Zambia;♦ Country presentation for Zimbabwe ;♦ General discussion on trends in Southern Africa;Afternoon:♦ Formation of groups for parallel sessions, terms of reference for the groups, election of Chair

FSTCU – SADC PRESENTATION
WORKSHOP PROCEEDINGS FORESTRY STATISTICS – MUTARE, ZIMBABWE (30 Nov. – 4 Dec. 1998)
18
persons and rapporteurs;♦ Parallel sessions on forest products and forest resources (for details see ANNEX).
Evening: ♦ Voluntary Session on NWFPs and TOFs.
WEDNESDAY 2 DECEMBERMorning and afternoon: Continue parallel sessions.
Afternoon: Conclude parallel sessions, including preparation of parallel session reports.
Evening: Presentation of Parallel Sessions Report in plenary.
THURSDAY 3 DECEMBER
Morning: 1. Plenary session to discuss out-come of parallel sessions;2. Review of the results; and3. Workshop report and country reports; lead by FAO Forestry Officer (Reg. Office).
Afternoon: Field visit (Field visit to John Meikles Forest Research Station Tree);
Evening: Discussion of Pilot Studies - Zimbabwe Delegates.
FRIDAY 4 DECEMBER 1998
Morning:1. Closing note by Co-Chairman on the use of forestry sector data and next steps to be
implemented. Uses of forestry sector data (national and international uses; and publicavailability of data);
2. Next steps: Pilot Studies, Outlook Study Country Reports, Regional Outlook Study reports;
and capacity building and assistance needs; and 3. Conclusions and recommendations by the Chairman; evaluation of the workshop.
- Afternoon: Farewell toast and lunch; andDeparture to Harare.

FSTCU – SADC PRESENTATION
WORKSHOP PROCEEDINGS FORESTRY STATISTICS – MUTARE, ZIMBABWE (30 Nov. – 4 Dec. 1998)
19
Items for Review in Parallel Sessions
Forest ResourcesForest Resources Information• Methodology (definitions, model, etc.)• Means of dissemination Needed Forest Resource Information• Forest area: Type, disturbance, species group, availability for wood supply, ownership and management, eco-floristic zone, protection status, change• Forest Plantations: Area, species, ownership,
function, etc.• Volume and biomass: Biomass, growing stock,
commercial volume, increment, losses, fellings andremovals, change
• Forest health, forest fires• Non-wood forest products• Trees outside forests Needed Model data• Sub-national units, Population data Classification systems• Local, FAO Review of local data availability• Country by country
Review of constraints
Forest ProductsInformal Sector• Statistics on Fuelwood• Statistics on non-wood forest products• Survey methods• Working Group
Formal Sector• Production and trade statistics of industrial
roundwood, sawnwood, wood residues, panels,pulp and paper
• Yearbook of Forest Products• Capacity & price statistics, conversion factor• Working Group
Forestry Statistics and IT today• Data structure, classification and definition• Collection, processing and dissemination of
forestry statistics• Demonstration: National and international.
exchange of forestry statistics and the role ofnational focal points
• Working Group
Country by Country data review• Hands on use of FAO electronic questionnaires• Historical country data review

FSTCU – SADC PRESENTATION
WORKSHOP PROCEEDINGS FORESTRY STATISTICS – MUTARE, ZIMBABWE (30 Nov. – 4 Dec. 1998)
20
APPENDIX II REPORT OF THE PARALLEL WORKING GROUPS
a) FOREST RESOURCES
Composition of the workgroupChairperson: Ms Sebueng Kelatwang South AfricaRapporteur #1 Mr Kasizo Z. Chirambo MalawiRapporteur #2 Mr Dominick Kwesha Zimbabwe
Members:Mr Afonso Zola AngolaMr Kemonnaa K Keapoletswe BotswanaMr Elias L. Sekaleli LesothoMs Carla Cristina Dinis Cuambe MozambiqueDr Themba L. Simelane South AfricaMr. Cliff S. Dlamani SwazilandMr. Charles Taulo ZambiaDr. David Gwaze ZimbabweMr Lazarus Tawonezvi ZimbabweMr Peter Gondo ZimbabweMr. Jim Ball FAO, HQ, RomeMs Saori Hirai FAO, HQ, RomeMr Peter Lowe FAO, Regional Office, Accra
1. Trees Outside Forests (TOFs)
The working group recognised the environmental and socio-economic importance of Trees OutsideForests (TOFs). It called for the assessment of their contribution to the economy in each country.The group reviewed the definitions supplied by FAO and noted these did not always match countryperceptions of TOFs.
In the case of Zimbabwe, for example, the following definition was suggested:"Trees not covered by present vegetation classification and planted or managed in situ,singly or collectively, in fields, live fences, gardens, streets, homesteads or urban centres,and providing goods and services to the local communities."
The working group noted that all the countries present showed interest in preparing country briefson TOFs, and also observed that FAO was willing to support both the preparation of the countrybriefs and the pilot studies on TOFs.
Recommendations♦ that a regional workshop be convened by FAO or another appropriate institution with country
briefs used as inputs to the workshop; and that♦ FAO should reconsider the its present definition of TOFs, particularly as regard tree height and
crown cover density.
2. SADC Classification of Forest Cover
The working group recognised the importance of having concrete terms and definitions, and that

FSTCU – SADC PRESENTATION
WORKSHOP PROCEEDINGS FORESTRY STATISTICS – MUTARE, ZIMBABWE (30 Nov. – 4 Dec. 1998)
21
these should be by national needs. It also noted the importance of networking on vegetationmapping to exchange information at regional level. It observed that harmonisation of vegetationclassification has already been done through SADC and reaffirmed the importance of theclassification. It noted that the member states have already endorsed this classification during ameeting held in 1997 (Pretoria).
Recommendation♦ SADC will do what it can to find a donor to support the implementation of the SADC
Vegetation Mapping and Information projects and the establishment of a network
3. Permanent Sample Plots for Monitoring Change
The working group recognised the importance of recurrent assessment of permanent sample plotsfor monitoring change in forest growth and health condition, and providing indicators of SFM.
Recommendation♦ Member states should prepare a comprehensive review of the status of their PSPs, including the
numbers of plots, location by eco-type, frequency of measurement, and date of establishment.This recommendation further supports the proposed role of FSTCU in compiling PSPinformation for the region (see Regional Vegetation Project: SADC appraisal mission formapping, SCOT Counsel Report of 12/96, section 4.10).
4. Plantations
The working group observed that there is variation in the amount of plantation data and detailcollected amongst the different member states, and that the reliability of this data leaves a lot to bedesired. In particular, data collection from the private sector is difficult to acquire. It was also notedthat the questionnaires from FAO were too detailed and laborious to complete.
Recommendations♦ Data gathering institutions should closely liase with the relevant stakeholders;♦ FAO data collection forms should be standardised as far as possible;♦ Where data is unavailable expert opinion should be used to make estimates.
5. Relevant Information
The group recognised that relevant and reliable information is essential for policy development,updating and revision. The Working Group identified the following data as being of importance:♦ land uses; vegetation maps using SADC classification; rate of deforestation;♦ NTFPs and NWFPs; TOFs (where significant).
Recommendation♦ FAO should present country data sets such that countries only complete the sections relevant to
their own circumstances
6. Institutional Aspects
All participants reported that their data collection capacity was limited by shortage of funds foroperational activities to collect store, and analyse data relevant to sustainable forest management.

FSTCU – SADC PRESENTATION
WORKSHOP PROCEEDINGS FORESTRY STATISTICS – MUTARE, ZIMBABWE (30 Nov. – 4 Dec. 1998)
22
Many participants reported difficulties in data collection and analysis due to high staff turnover andlack of continuity. Most countries reported the presence of skilled staff, but some do not, especiallyin certain fields such as data analysis. In view of the general trend towards privatisation, severalcountries expressed concern over the weak co-operation between the public and the private sectorsand NGOs.
Participants recognised the increasing importance of participatory approaches in SFM. ForestDepartments of member states should explore new ways of collecting data from community andother participatory schemes through partnership with NGOs where appropriate. Participants drewattention of FAO and other donors to the need for training and institutional support in the field ofdata collection and analysis for sustainable forest management and appropriate policy development.
Recommendation:♦ FAO, among other institutions, should promote technical co-operation in all aspects of data
collection and analysis between countries within the region, as well as support to thedevelopment of regional capability, within the framework of the TCDC programme.
7. Forest Health
The group recognised the consequences for forest health arising from increased human pressure,including the incidence of fires and high grazing intensity, which are severe actual and potentialhazards to SFM. Information seems to be well recorded by most countries for fire, especially forforest plantations, although there is little information for natural forest. In general there seemed tobe few problems with pests and diseases, although elephants and baboons were reported asdamaging in two countries.
Recommendations:♦ Countries should adjust figures on plantation areas where necessary, where necessary, to reflect
loss due to drought or fire or other causes.♦ Studies are required into the causes and economic importance of fires.♦ Records should be maintained, distinguishing controlled fires from wildfires.♦ There is a need for regional co-operation in monitoring fire outbreaks and extent.
8. Data Sets
The data sets prepared by FAO had not been received before the meeting by all participants and thuscould not be checked by participants. The meeting noted that forest statistics should serve primarilynational needs for SFM, but that countries should make such data available to internationalinstitutions and agreements in a timely manner within their capacity and the availability of the data.
Recommendations:♦ Country contact points should review the data sets for their countries to see whether they are
complete, up to data and accurate, and should return them when corrected to FAO as soon aspossible.

FSTCU – SADC PRESENTATION
WORKSHOP PROCEEDINGS FORESTRY STATISTICS – MUTARE, ZIMBABWE (30 Nov. – 4 Dec. 1998)
23
b) FOREST PRODUCTS
Composition of the group
M. Naka- Mozambique - ChairpersonAnne Chishawa - Zimbabwe ( Rapporteur)Crispen Marunda - ZimbabweD. Mabvurira - ZimbabweD. Duwa - ZimbabweMemory Zirobwa - ZimbabweWalter Mapanda - ZimbabweJ. Mulombwa - ZambiaS. Kainja - MalawiCharles Omoluabi - FAOMichel Laverdiere - FAO
Recommendations
1. Non-wood forest products (NWFP)
The group discussed about the format of the NWFP tables prepared by FAO. It agreed that therewas very useful information to be gathered through that process. Definitions, contents andpresentation were revised by the group and the following recommendations were produced.
1. That FAO re-examines the existing definitions of NWFP as the present definition tendsto technically exclude NWFP from trees outside forests.
2. The Definition of NW goods should exclude the term “services rendered“ as it is coveredunder NW services.
3. The NWFP definition excludes woody products such as those used in farm implements,household implements, tooth brushing and cattle sticks. Thus it is recommended thatforests statistics should retain the use of NTFPs to cover products which are notcovered in the NWFP definition and timber sector definitionsCriteria for defining relative importance of NWFPs are not clear. It is thereforerecommended that importance should be based on:
- widespread use/local consumption; and- contribution to national economy.
5. For effective data collection on NWFP, FAO will need to lead in the development ofappropriate methodology and measurement/assessment criteria for data collection on each product NWFP
6. It is recommended that statistics on NWFPs and NTFPs should be presented in text,GIS, and numeric formats for effective communication
7. The existing reporting format on NWFPs provided by FAO should include informationon source, end users and final destination of product
2. Fuelwood production
The situation of fuelwood in Africa was reviewed. Data problems were also assessed. by the groupwith particular emphasis on timely update of data, assessment challenges, and product importance.

FSTCU – SADC PRESENTATION
WORKSHOP PROCEEDINGS FORESTRY STATISTICS – MUTARE, ZIMBABWE (30 Nov. – 4 Dec. 1998)
24
Recommendation1. It is recommended that for effective national planning fuelwood statistics collection at
national level should provide information on supply, demand, distribution and tradedynamics at regional levels within a country
3. Collection of Wood production Statistics
Participants noted the growth in small-scale wood industries (industries of the informal sector) inAfrica resulting from economic depression. For reliable data collection on the forest industrialsector there is need:
1. To design means of capturing forest statistics from the expanding wood/forest basedinformal sector;
2. To establish a national contact office and to provide a focal point for contacts and coordinate data update;
3. (for FAO) to maintain support to countries with technical advise/training of nationalforest statistics personnel;
4. to harmonise electronic data transfer between different countries and FAO foreststatistics office;
5. (for countries in the SADC region) to examine the forest sector in order to removeconstraints that inhibit data flow due to organisational structures.
Feedback Mechanisms1. Develop an interactive feedback mechanism to monitor use and the changing needs of the
end-users
Capacity Building1. Further support to enable countries to regularly update woodfuel databases;2. Strengthening of national forestry sector capacity to collect, analyse, disseminate and
maintain forestry statistics;3. Support regional ( FSTCU) networking initiatives in the forestry sector information
and statistics;4. Appropriate communication between forest state authorities and the private sector
must be maintained and straightened.

FSTCU – SADC PRESENTATION
WORKSHOP PROCEEDINGS FORESTRY STATISTICS – MUTARE, ZIMBABWE (30 Nov. – 4 Dec. 1998)
25
APPENDIX III - FAO INPUTS
A) THE FORESTRY SITUATION IN AFRICA
byMr. Peter Lowe
Forestry Planning OfficerRegional Office for Africa (Accra, Ghana)
Food and Agriculture Organizationof the United Nations
1. Introduction
Mr Chairman, it is an honour and a pleasure for me to participate on behalf of FAO's RegionalOffice for Africa in this second workshop on data collection and analysis under the FAO-ECPartnership Programme. At the outset, I should like to convey the cordial greetings of FAO's SeniorForestry Officer in Africa, Mr. Pape Kone, who wishes us a week of hard but fruitful work.
The first workshop was held in Nakuru, Kenya, 12-16 October 1998, and was attended mainly bymember countries of IGAD. Two further workshops are planned for next year; in Libreville, Gabonin May, and in Abidjan, Côte d'Ivoire in July.
2. Why Forest Statistics are needed
The needs for information about forestry in Africa, as in other regions, are expected to increase inthe future for Africa’s own use and for the international community. Broadly speaking, forestryinformation is used in three main areas:
- national policy development and planning- investment appraisal and decision making- international policy development and negotiation.
Without hard facts and analysis, foresters cannot expect to convince political leaders that theirforestry concerns should receive more consideration vis á vis other sectoral priorities. Thus, it is notenough to assert that forests should be conserved. Whereas, from our perspective, an average annualdeforestation rate of 0.7% for Africa may be deplorable, this may seem to others a small price worthpaying for expanded agricultural production or cooking of food. Not only do foresters need accessto incontestable facts, they need also to ensure that there is full awareness of the likely consequencesof policy options.
When it comes to competing for development funding, foresters need to be able to present economicarguments based on quantifiable costs and benefits. Therefore, in addition to facts, there is a need toassess analytically the impacts on beneficiaries. Thus, rather than be content to assert that, duringthe "hungry season", many rural people depend on the forest to supplement their diets, there is aneed to quantify how many families and to what extent.
Following the Rio Summit in 1992, there has been an ongoing discussion by the internationalcommunity concerning sustainable forest management. The Africa participation in identification of

FSTCU – SADC PRESENTATION
WORKSHOP PROCEEDINGS FORESTRY STATISTICS – MUTARE, ZIMBABWE (30 Nov. – 4 Dec. 1998)
26
internationally agreed criteria and indicators was facilitated through an FAO/UNEP Workshop onCriteria and Indicators for Sustainable Forest Management in Dry-Zone Africa held in Nairobi inNovember 1997, in follow-up to the Expert Meeting held on the same subject in November 1995.
However, Africa's voice has not been heard as clearly as it should, particularly in regard to theconservation and utilisation of its own sovereign forest resources. The major impediment has beenthe lack of a commonly adopted negotiating position. For this to be achieved, policy makers needharmonised data aggregated on a sub-regional and regional basis, which FAO is mandated to assist.
3. What Forestry Statistics are needed?
Statistics and outlook studies are both central to the mandate of FAO which includes compiling,analysing and disseminating information on all aspects of agriculture and rural development,including forestry, at regional and global levels.
Most of the information about forestry in the Africa region currently compiled by FAO falls broadlyinto two areas:
Forest Resources:* information and statistics on the area, stocking, growth, condition and type of forest
resources in countries* information on wood/fibre production potential of the forest resource;
Forest Products:* including information and statistics on production (including capacity), consumption,
and trade.
Yet, in view of the broad scope of criteria and indicators of sustainable forest management, thesedata series do not fully satisfy the needs. In addition to the forestry statistics, FAO also compiles awide range of extra-sectoral information relating to land-use, policy, institutional, social, economicand environmental factors and developments that have a strong bearing on the forestry sector.
Undoubtedly, the key development issue for Africa as a whole is Food Security. Food security isdefined by FAO as access by all people at all times to the food needed for a healthy and active life.Achieving food security means ensuring that sufficient food is available, that supplies are relativelystable and that those in need of food can obtain it.
Although over the years governments, with support from FAO and other development agencies,have addressed food security and its related elements in many ways, today more than 800 millionpeople in developing countries - about 20 percent of their total population - do not have sufficientfood to fulfil their basic nutritional needs, despite worldwide increases in food supplies. In Africa,things are twice as bad, with more than 40% of people unable to enjoy food security and, unlikeother regions, the absolute number of Africans affected is projected to worsen by the year 2010.
Studies undertaken by FAO, the World Bank and the International Food Policy Research PolicyInstitute (IFPRI) all indicate that while global food supplies will be sufficient to meet the growth inglobal demand, sub-Saharan Africa may buck the trend; that is, the rate of increase in demand forfood in this region is expected to outstrip the supply. The solution must be found in the ability ofindividual countries to pay for imports not covered by food aid. That is why, when we speak of

FSTCU – SADC PRESENTATION
WORKSHOP PROCEEDINGS FORESTRY STATISTICS – MUTARE, ZIMBABWE (30 Nov. – 4 Dec. 1998)
27
Food Security, we do not mean Food Sufficiency at the country level, nor on the household levelbecause of the pressure of urbanisation.
Efforts to achieve food security in Africa will have an impact on forests, and will draw increasingattention to the supportive role that forests play in attaining food security. Increased production offood in developing countries is likely to be achieved through both intensifying food production onexisting agricultural lands, and increasing the area of land available for agriculture. The conversionto agriculture is unstoppable. Whether this might be a positive contribution to SustainableDevelopment will hinge on the criteria by which forest lands are selected, their suitability forcultivation and the net economic and social profit over time associated with the new land use.
By adopting Food Security as a thematic approach for data collection, foresters can mount apowerful case for sustainable forest management. Consider, for a moment, the roles of forests, andof forests and trees outside forests, in providing the following benefits:
(i) Forest Protective FunctionsCertainly, the most important contribution of forests to food security worldwide is their rolein the protection of the resource base needed for agricultural production. Maintaining goodforest cover on critical watersheds is essential for safeguarding a reliable and clean watersupply for downstream irrigation systems, and for mitigating the effects of peak rainfall. Inthe past year, countries such as Bangladesh and China are struggling with extensive floodingattributed to deforestation, with consequent agricultural losses. In both Kenya and Uganda,heavy rains have caused severe damage earlier this year.Trees used as windbreaks offer essential protection for agricultural fields; windbreaks areused the world over where risk of wind erosion, wind damage and desiccation is high.
(ii) Maintenance of Soil Fertility and StructureTrees are found in intimate association with farming systems throughout the world in a vastarray of agroforestry systems, attesting to their economic importance and, ultimately, to theirsupportive role towards the provision of food security. The oldest agroforestry system of all -shifting cultivation - relies on the regrowth of woody vegetation to restore soil fertility. Thesupport provided by trees to agriculture, or to the welfare of the farm household including tofood security, is most critical in subsistence farming or low-income households.
(iii) Forest FoodsA wide range of trees and forest products regularly provide a direct food source for people,or fodder for their livestock. While forests and trees are not the major suppliers of foods inmost farming systems, they often provide important supplements and may be critical inplaces where there are strong seasonal cycles of food availability and scarcity and where riskof crop failure is high. In addition, they often provide 'fallback" foods in times of emergencyor during the "hungry season". Tree and forest plant products and bushmeat generally makethe greatest contribution to the diets of the rural poor who have limited physical andeconomic access to other foods. Grazing in open woodland pastures are vital for livestock.

FSTCU – SADC PRESENTATION
WORKSHOP PROCEEDINGS FORESTRY STATISTICS – MUTARE, ZIMBABWE (30 Nov. – 4 Dec. 1998)
28
(iv) Fuelwood for CookingIn most African countries, fuelwood accounts for upwards of 75% of domestic energyrequirements, mainly for cooking. This demand constitutes an obvious and major cause ofdeforestation in many countries, particularly when urbanisation is high. The homesteadfirewood demands of rural dwellers may not exhaust local wood supply, but the commercialexploitation for urban consumption can reach indiscriminately to the economic limitsimposed by transportation costs.
Nevertheless, the sustainable management of forest for the provision of fuelwood constitutesan inescapable challenge associated with the need for food security.
(v) Commercialisation of Forest ProductsForest products are major sources of income for many rural poor in developing countries.Forests contribute to household food security by providing employment and products forsale. As with cattle, tree crops can serve as the household bank. They can be cashed in to payfor special occasions, such as school fees or clinic bills, and also provide families with aninsurance against poor annual food harvests. There are, of course, many non-destructive usesof forests, woodlands and trees, such as hunting for bushmeat, honey gathering and gumextraction.
Forest industries and exports of forest products generate income and foreign exchange, thusfinancing the import of essential foodstuffs. Logging of natural forest therefore contributesto food security in many countries.
4. African Challenges
Many of the forest goods and services listed above are more important regionally, to Africa, thanthey are globally. Certainly, the underlying driving force of agriculture and the quest for foodsecurity are inescapable.
With regard to forest products statistics, it is recognised that in Africa much production,consumption and exchange occurs through informal channels so that the forest products data FAOreceives and publishes are valid mostly for the monetised part of the region’s economies. Thisinevitably means under-reporting the full extent to which demands are being exerted upon forests bydemand for forest products.
Statistics on non-wood forest products (NWFP) production and trade are very weak. For keyproducts, such as gum arabic, customs statistics can be accessed through the international tradedatabase (COMTRADE) of the UN Statistical Office, but production information is incomplete andis not systematically collected. Due to the wide array of NWFPs and problems of definitions,reporting cycles and units of measurement used for NWFPs in different countries, compilation ofinternational statistics is quite challenging. A general weakness is that FAO does not publish NWFPstatistics due to their being relatively insignificant at global level; current thinking is to promoteregional statistical publications in which products of regional importance can feature.
The fact that this series of FAO-EC Workshops of forestry data have been organised on a sub-regional basis is based on a recognition of the diversity of Africa. The various sub-regions arecharacterised by widely differing ecosystems, forest types and richness. Not only do they differ in

FSTCU – SADC PRESENTATION
WORKSHOP PROCEEDINGS FORESTRY STATISTICS – MUTARE, ZIMBABWE (30 Nov. – 4 Dec. 1998)
29
natural endowments. Even within sub-regions, the countries may have inherited differentadministrative systems which overlay a rich diversity of customary practice in regard to land andforest use.
Although the collection of forestry data may be shared with non-governmental entities, it is aprimary responsibility of government administration. Generally, statistics may be generated at alocal level but the manner of their collation and national reporting is heavily reliant on the degree ofdecentralisation in government structure, and the flow of revenues associated with primarystatistics. But, even disregarding this hierarchical aspect, foresters are may be hampered by theunnatural divisions imposed by the line ministries involved. Thus, wildlife - to which the foresthabitat is an integral part of the ecosystem - may commonly be the responsibility of anotherministry. Similarly, production and trade statistics may be collected by ministries completelyremoved from the sector.
No sub-region of Africa has been immune to the disruptions arising from internal strife, naturalcalamity or collapse of political order. Most countries are relatively poor in world terms and manyare struggling with the obligations incurred under Structural Adjustment to reduce administrativecapacity. Although most countries in the region have achieved a degree of institutional maturity intheir forestry services, the loss of experienced and talented professional and technical staffrepresents an unaffordable loss in human talent and institutional memory.
Yet, the International Community is engaged in a continual process of increasing complexityinvolving heavy additional burdens on national governments in terms of data requirements.
5. Future Prospects
Although the realities described above will continue to impede and limit the availability and qualityof forestry statistics - particularly at field level - the prospects for regional and sub-regional co-operation have improved beyond recognition with the potential of internet access.
A major improvement in the dissemination of international forestry and related statistics has beenthe development and updating of forestry statistics databases on the World Agricultural InformationCentre (WAICENT) available on the FAO INTERNET site. WAICENT carries information onforest resources as well as forest products; forest products data on WAICENT is now updated fourtimes a year as new or revised data are received from countries.
For the entire range of data from resources to products, the long-term solution to statistical qualitylies in capacity building in all countries for data collection techniques but also for equipment andskills in identifying and appraising information needs and in analysing and interpreting it. Thisworkshop will play its part in that process. FAO's Regional Office for Africa has prepared draftMethodological guidelines for improving Forestry statistics in Africa which are currently beingreviewed; your comments on these during the week would be welcomed.
FAO has identified the need for as Forestry Outlook Study for Africa (FOSA), similar to that for theAsia and Pacific Region which has just been completed. The study would build upon ongoingstudies and activities - particularly, the series of data collection and analysis workshops in which weare participating. FOSA would go further, however, to provide an overall prognosis on a regionaland sub-regional basis to assess the prospects for sustainable development in the forestry sector to a

FSTCU – SADC PRESENTATION
WORKSHOP PROCEEDINGS FORESTRY STATISTICS – MUTARE, ZIMBABWE (30 Nov. – 4 Dec. 1998)
30
horizon year of 2020.
Strong working partnerships are being forged with other international, regional and sub-regionalorganisations. Already the EU is supporting the key component relating to data collection andanalysis. The African Development Bank has expressed its concrete desire to be associated withFOSA, and FAO has recently strengthened its regional presence in Accra and Harare with the out-posting of four Regional Officers.
The proposed outlook study has been welcomed and endorsed and afforded high priority by AfricanGovernments at the 11th Session of the African Forestry and Wildlife Commission (AFWC) inDakar, April 1998. Furthermore, the AFWC commended FAO to work closely with sub-regionalorganisations, such as SADC, in carrying out FOSA.

FSTCU – SADC PRESENTATION
WORKSHOP PROCEEDINGS FORESTRY STATISTICS – MUTARE, ZIMBABWE (30 Nov. – 4 Dec. 1998)
31
b) DOCUMENTATION PROVIDED BY FAO
Forest Resources♦ Forest Resources Background Information,♦ Country Briefs,♦ Note on data collection for the Global Forest Resources Assessment 2000,♦ NWFPs statistics paper,♦ Maps of Protected Areas of each countries, prepared by WCMC,♦ Vegetation map prepared by EROS data Centre,♦ Terms and Definition of FRA2000♦ Guidelines for Assessment in Tropical and Sub-Tropical Countries, FRA2000♦ Working Paper on Trees Outside the Forest. Forest Products♦ Objective and functions of economic and statistical information for the forestry sector,♦ Organising Forestry Statistics, Collection Processing Dissemination,♦ Using Information Technology for Forest Products Data Processing and Exchange,♦ Forest Products: Production, Consumption, and Trade (1996, Africa)♦ Measurements of Forest Products,♦ Collecting Production Statistics,♦ Collecting Trade statistics,♦ Statistics on Woodfuel, an introduction,♦ A Forestry Statistical Office,♦ Synopsis on Country brief on Forestry Statistics,♦ FAO Yearbook of Forest Product country data, for revision 1961-1996,♦ State of the Art of the information on Woodfuel in East-Africa countries.
FAO Electronic media:♦ FAOSTAT/PC Forest Products (2 floppies + installation manuals),♦ FAOSTAT/CD (1 CD),♦ Yearbook of Forest Products 1992-1996, publication in Acrobat format (1 floppy),♦ Pulp and Paper Capacity Survey 1997-2002, publication in Acrobat format (1 floppy),♦ FAO Yearbook of Forest Product country data, for revision 1961-1996 (1 floppy),♦ FAO Yearbook of Forest Product questionnaire(a prototype in Excel). FAO Publications:♦ Yearbook of Forest Products 1992-1996,♦ Pulp and Paper Capacity Survey 1997-2002,♦ Pulp and Paper Mill List,♦ Statistics Today for tomorrow, 1945-1994, 2010,♦ State of World's Forests, 1997,♦ Proceedings, FAO Working Group on Forestry Statistics, Rome, 1996,♦ Report of the Internat. Expert Consultation on NWFP, Yogyakarta, 1995.

FSTCU – SADC PRESENTATION
WORKSHOP PROCEEDINGS FORESTRY STATISTICS – MUTARE, ZIMBABWE (30 Nov. – 4 Dec. 1998)
32
C) Note on data collection for FRA 2000 This note briefly describes the interrelation between the Global Forest Resources Assessment 2000and the EC-FAO Programme “Data collection and Analysis for Sustainable Forest Management:Linking National and International Efforts”. The Global Forest Resources Assessment 2000 (FRA 2000) The FAO, in cooperation with its member countries, is currently conducting the Global ForestResources Assessment 2000 for the tropical - and sub-tropical countries. Outputs will includeinformation on forest area (status 2000 and change), ecological aspects of forests and economicalpotentials of forests. The assessment work depends on collecting, analysing and standardising ofexisting country data/information on forest resources. Data are collected in close cooperation withthe countries, in the following ways:♦ Organization of regional workshops, with participation of country contacts♦ contributions by regional cooperators and consultants, involving country missions.♦ documentation and library search. The collected or provided country data, adjusted to a common international classification scheme,will be stored in the FAO FORIS (Forest Resources Information System) database. FAO will thenestimate country forest area figures for the years 1990 and 2000 by applying enhanced and updatedadjustment functions which relate forest area changes to ecological settings and human populationdevelopments. Prior to publication, the assessment results will be presented and/or disseminated tothe countries for comments and agreement, also through a number of workshops. Link with EC-FAO project in ACP countries Currently, a joint EC- FAO Partnership Programme: is being implemented in the ACP-countries(Sub-Saharan Africa and the Caribbean). Data are collected on forest resources and forest products,and the former will to a large extent serve the needs of the FRA 2000 programme. A number of“data collection” workshops will be organised. Prior to the workshops country data on forestresources compiled by FAO (presented in country briefs) are sent to the country participants forreview and update, together with guidelines and tables for data collection. During the workshops, FAO staff and country participants will jointly review and further completethe country data, and discuss follow-up actions on data collection. At the workshop, the Guidelinesfor Assessment, will be distributed and discussed. Contact persons FRA 2000: Peter Holmgren; E-mail: [email protected] Tel. ++39-60-57052714 Henk Simons; Email: [email protected] Tel. ++39-6-57052919

FSTCU – SADC PRESENTATION
WORKSHOP PROCEEDINGS FORESTRY STATISTICS – MUTARE, ZIMBABWE (30 Nov. – 4 Dec. 1998)
33
D) TREES OUTSIDE THE FORESTS (TOF)
by FAO - Conservation,
Research and Education Service (FORC) FAO, Rome
Summary of Activities The Forest Conservation, Research and Education Service (FORC) has assisted ProjectGCP/INT/679/EC mainly in developing the component Trees-outside-forests (hereinafter referredto as "TOF"). In order to set the stage for this topic, a letter of agreement has been signed withORSTOM (France) to undertake a General Study entitled "Assessment of Trees-outside-forests:Taking Stock". This study aimed to:♦ clarify the definition of TOF, have a better understanding of the resource, its classification, the
opportunities and constraints of existing methodologies of assessment and, lessons learned anddata from experiences in different regions of the world;
♦ initiate an International Consultative Group to orient and support FAO in the implementation ofthe TOF component of the Project and for the general topic development.
Within this framework ORSTOM has organised in Orléans, France, from 21 to 23 September 1998,a workshop for 40 participants with expertise in developing and developed countries related tomanagement, assessment and inventory of TOF. The majority of the participants came from France(such as CIRAD, CNEARC, CNRS, EHESS, ENGREF, INRA, MNHN, ORSTOM, Université P.Sabatier de Toulouse, Services de l'Inventaire Forestier National), but also from UK (ODI),Netherlands (National Reference Centre for Nature Management) and Cameroon (University ofYaoundé). ORSTOM will present the findings of the study at the end of December 1998. During the regional workshops in Nakuru (Oct. 1998) and Mutare (Nov. 98), a paper has beendistributed entitled "Trees-outside-forests: Towards a better understanding and assessment of TOFresources - brainstorming points". The report (see below) introduces the topic and stimulates thediscussions around 4 questions:♦ what are trees-outside-forest resources;♦ why to assess(inventory?) TOF and for whom?♦ how to assess TOF resources?♦ who assess TOF resources? During this meeting, the Forest Action Network - FAN (Kenya) assisted the FAO team infacilitating and reporting on the sessions related to TOF. FAN will pursue its collaborationsupporting a specific networking on TOF among the countries in Southern and Eastern Africa. It is important to mention the other activities funded by FAO Regular Program and by FRA2000which contribute substantially to the process initiated by the Project. Among these activities are thethree Regional Special Studies for Latin America (CATIE), Eastern and Southern Africa (MakarereUniversity), and Asia/Pacific (institution to be identified) entitled: "Valuation and Evaluation ofTrees-Outside-Forests: a first step in contribution to FRA2000 and topic development". Other

FSTCU – SADC PRESENTATION
WORKSHOP PROCEEDINGS FORESTRY STATISTICS – MUTARE, ZIMBABWE (30 Nov. – 4 Dec. 1998)
34
national studies in ACP countries are planned. A similar process will be adopted for the other sub-regions, namely the workshops to be held in Ivory Coast, Gabon, and the Caribbean. In early 1999 (proposed date March 1999) it is expected that the preliminary results of the Projectand of other FAO activities around TOF will be discussed during a Seminar in FAO/HQs in Rome,where the International Consultative Group would meet for the first time. The outcome of theSeminar would provide the basis and recommendations for the activities to be carried out in order toachieve the objectives of the Project (methodology development process and outlook studies relatedto TOF in the ACP countries). The activities around the pilot countries (Uganda and Zimbabwe)will be based on strong networking within the country and with the other countries, in order for allof them to contribute to the process and benefit directly from it for their national capacity building. Introducing Trees outside the Forests (TOF) ‘The significance and functions of Tree Resources Outside the Forest (TOF) are very diverse and canlocally be very different in nature and importance. Particularly in the tropics TOF play a prominentrole, embracing many ecological functions (e.g. conservation of biodiversity, erosion control, carbonsequestration, etc.), but also direct economic functions (e.g. provision of firewood, fodder, fence-posts,living-fence posts, etc.). TOF are present in various land use classes but do not form a land use classon its own. This makes a large area assessment for TOF difficult. Compared to other natural resourceslittle is known about TOF on a large area basis (e.g. floristic composition, spatial distribution, andfunctions of biomass). The ever-decreasing forest cover and increasing forest fragmentation, however,increase the relative importance of TOF. The need for better data and information is therefore obviousand expressed by many natural resource managers, planning institutions and projects that all want toinclude TOF into their planning activities. This need for more information is valid for many regions,particularly in regions where forest cover is very low and where tree components in agroforestrysystems are intensively promoted’.1 TOF data is currently not systematically recorded in national forest resources assessment and in theForest Resource Assessment Programme (FRA) of the FAO but it has been identified to be anessential element for Sustainable Forest Management. Gathering and analysing data on TOF is adifficult task, and data on fuelwood, non-wood forest products, forest plantations and environmentalservices must be taken into consideration. The objective of this paper is to:♦ present some elements showing the complexity of the topic;♦ present some on-going or planned initiatives undertaken by FAO and other institutions related to
TOF;♦ open a discussion among the participant of ACP countries present to this workshop on “why, for
whom and how to assess the TOF- resource”.
It is hoped that at the end of the workshop the subject of TOF has caught the attention and evokedthe interest of the participants. It is hoped that there are suggestions made to introduce TOF in theassessment methodology development process, and in particular in the framework of the differentcomponents of the DG-VIII project, as for instance through the pilot country studies.
1 Source: CATIE – ‘Tree resources outside the forest: Development of methods for assessment andmonitoring of natural resources to support regional planning, with study areas in Central America- 1999-2002’. Notes on EC-DG XII project.

FSTCU – SADC PRESENTATION
WORKSHOP PROCEEDINGS FORESTRY STATISTICS – MUTARE, ZIMBABWE (30 Nov. – 4 Dec. 1998)
35
Trees-Outside Forests: Taking Stock
What are trees-outside-forest (TOF) resources? Why to assess (inventory?) TOF for Whom ?How to assess TOF resources? Who assess TOF resources?
In the framework of the DG-VIII project, FAO is undertaking a study at world-wide level inpartnership with ORSTOM (France). This first step aims to review the concept and definition ofTOF, review the available information (including assessment and inventory methods, institutionalexperiences), and propose methodology assessment and data collection framework. To start toanswer the questions mentioned above (see box 1) ORSTOM has organised a seminar on Trees-outside-forest in Orleans, France, from 21 to 23 of September 1998. These experts coming fromdifferent disciplines and with world-wide practical research and assessment experience on TOFresources looked at these questions. The discussions confirmed that there is no one easy answer. TOF as defined by the FAO (see definition below) is a ‘non-category’. TOF are found in rural andurban area, on agricultural lands and other than forest and non-wooden-land; they constitute a widediversity of species and systems, and are under the responsibility of several institutions. Trees outside forest as defined by KOTKA III: Trees on land not defined as forest and other wooded land. ♦ Trees on land that fulfils the requirements of forest and other wooded land except that the area is
less than 0.5 ha; ♦ trees able to reach a height of at least 5m at maturity in situ where stocking level is below 5 %;♦ trees not able to reach a height of 5 m at maturity in situ where the stocking level is below 20 %;♦ scattered trees in permanent meadows and pastures; ♦ permanent tree crops such as fruit trees and coconuts; ♦ trees in parks and gardens, around buildings and in lines along streets, roads, railways, rivers,
streams and canals;♦ trees in shelterbelts of less than 20 m width and 0.5 ha area.
Source : KOTKA III, 1996 At the workshop in Orléans, it has been suggested that while defining and classifying TOF, aparticular attention should be paid to specific particularities of these resources such as :♦ the notion of multiple use and multi-function;♦ the dynamic of the evolution of the resource: deforestation, degradation, afforestation,
spontaneous regeneration;♦ anthropic pressure: to understand the management aspects of TOF, it is essential to introduce the
complexity of agricultural and pastoral systems and consequently, to take inventory of practicesand use according the cases;
♦ the role of TOF in tenure and political issues, namely the relation with deforestation, forestclearing, plantation, access to land and resources;

FSTCU – SADC PRESENTATION
WORKSHOP PROCEEDINGS FORESTRY STATISTICS – MUTARE, ZIMBABWE (30 Nov. – 4 Dec. 1998)
36
♦ the coherence between the categories of resources distinguished in field visit and those by othermethods (such as tele-detection and cartography);
♦ the coherence between different scale of needs: sub-national, national and supra-national ; at oneend of the spectrum, the poor people depend on TOF for their role in nutritional and foodsecurity, farm system conservation and income generation; the other end of the spectrumrepresent the contribution of TOF to regional and global issues and the commitment of countriesto convention such as on biodiversity, desertification and carbon substitution and sequestration.
Why assess TOF and for whom? How to assess TOF resources and Who assesses them? Why and for whom are definitively un-separatable. A look at the studies on Kenya and Indiaprovide insight on the assessment of specific TOF and how it may be useful to users of these data,namely communities, natural resource managers and planers, politicians and decision makers atdifferent levels. KENYA – FARMLAND RESOURCES ASSESSMENT In the article ‘Not all African Land in being degraded : a recent survey of Trees on farms in Kenya revealsrapidly increasing forest resource’ the authors present results from a survey of woody biomass on farmlandin Kenya. The survey, which covers 10 million ha where 80% of the country’s population lives, revealed arapid increase of planted woody biomass between years 1986-1992. Its also revealed that wood on farmlandcan become a major source of raw material for the wood industry, since the standing volume is larger thanthat found in conventional forests; question some pessimistic opinions on land-use development andfuelwood gap theory and land degradation is not directly related to rapid population growth. Kenyan farmersseem to apply wise and sustainable-management practices, including tree growing. It is suggested that asecure land-tenure system on agricultural land is a significant reason for this recent development.Source: P. Holmgren, E.J. Masakha and H. Sjoholm. ‘Not all African Land in being degraded : arecent survey of Trees on farms in Kenya reveals rapidly increasing forest resource’. The RoyalSwedish Academy of Sciences. AMBIO. 1994. NON-FOREST AREA INVENTORY In India, a section of the State of Forest Report in 1997 is dedicated to Non-Forest Area. From 1991-92 theForest Survey of India (FSI) took up inventory of trees growing outside conventional forest areas in thecountry. The main objective of the inventory is to assess the extent of plantations raised under various socialforestry schemes by different agencies. The sampling design, field formats, data processing methodologyhave been developed at the FSI. Planted trees are classified in eight categories: Farm forestry, Villagewoodlots, Block plantation, Road, Pond, Rail and Canal side plantations and Other. The inventory of thenon-forest area of Haryana has been completed in 1997. The result reveal that farm forestry contributesabout 41% of the total standing volume of wood in non forest areas in Haryana, followed by villagewoodlots (23%), Roadside plantations (13%) and Block plantations (11%). Sampling Design – Non Forest Area: The sampling design adopted for this inventory is a two stage stratifiedsampling. Sampling unit in the first stage is a district and in the second stage a village. While taking up thesurvey of a state, optimum number of villages to be surveyed is determined on the basis of data obtainedfrom a pilot survey. The number of villages to be inventoried in a district is decided according toproportional allocation. Trees standing in the selected villages are enumerated and measured by the fieldparties. Compilation and data processing is done district-wise.Source: State of Forest Report 1997. Forest Survey of India (Ministry of Environment and Forests).Dehra Dun, 1997.

FSTCU – SADC PRESENTATION
WORKSHOP PROCEEDINGS FORESTRY STATISTICS – MUTARE, ZIMBABWE (30 Nov. – 4 Dec. 1998)
37
Activities in TOF Resource Assessment As said previously, TOF resource is not subject to any systematic assessment and is not taken intoaccount at its real importance in the decision making process regarding natural resourcemanagement. But data on TOF is needed for sustainable development. FRA 2000 will enlarge itsassessment to trees-outside-forest and will help the countries to strengthen their national capacity toproceed to these assessments. However, data related to TOF is:♦ scattered;♦ of diverse a nature and quality (e.g. revenue and product flow marketed on international
market);♦ gathered for different objectives (e.g. tax perception, fuelwood supply, marketing study);♦ available in different institutions and organisations (e.g. palm oil exported revenue in agriculture
department, fodder biomass in agro-forestry research institutions, home-garden andmultipurpose tree cover by bilateral projects, wood production by hedgerow plantations) dataexist that inter-sectoral and integrated approach will have to consider.
The EC-FAO partnership project propose to the countries of the region and those present to discussthese questions and see how to develop assessment methods including pilot-country studies. It ishoped that during the next months it will proceed to the compilation of conceptual and operationalpreliminary information on:♦ review of the FAO definition of TOF and provide technical information on terminology and
classification (systems and species, distribution, structure; land cover/use) used by FRA andother programme/institutions, of resource and related products in the environmental, economicand social context.
♦ review the available information at country, sub-regional and regional level related to TOF: (i)assessment and inventory methods; (ii) data basis (to analyse information such as needs, usesand potential of resources and products, inventory methods).
♦ provide various countries of the region the list of institutions involved in different aspectsrelated to TOF (resources and products) assessment such as in national planning, trade statistics,forest and agriculture assessment, environmental impact assessment. Why and where and howthese institutions are related? What is the definition used?
It is hoped to discuss the results of these studies during an International Meeting on TOF (probablyin Rome, end of February 1999) which would invite institutions and resource person of ACPcountries, other regions of the world and different departments of FAO to discuss how to combineour efforts to implement the DG-VIII project, contribute to FRA 2000 report and provide generalorientation to the development of the topic. An International Consultative Group would be createdto support a better integration of TOF resources into sustainable natural resource management

FSTCU – SADC PRESENTATION
WORKSHOP PROCEEDINGS FORESTRY STATISTICS – MUTARE, ZIMBABWE (30 Nov. – 4 Dec. 1998)
38
E) METHODOLOGICAL GUIDELINES FOR IMPROVEMENT OF FORESTRYSTATISTICS IN AFRICA
A REPORT ON DEVELOPMENT OF FORESTRY STATISTICS IN AFRICA- BASED ON AFWC-FAO INITIATIVES
By
Abodunrin Charles OmoluabiForestry Officer (Economic Analysis)
Forestry Planning and Statistics Branch (FONS)Forestry Policy and Planning Division,
Food and Agriculture Organisation of theUnited Nations - Rome
Background
While Forestry Statistics is important in the planning of sustainable management of forest resources,its general situation in terms of collection, compilation processing and dissemination in Africaremains unsatisfactory. The poor situation of Forestry Statistics has been identified years ago as theprincipal factor limiting the quality of National Tropical Forestry Action Plans.
At the 1995 session of the Forestry and Wildlife Commission for Africa (AFWC) which took placeon the 27th of November 1995 in South Africa, the deplorable situation of Forestry Statistics inAfrica was re-echoed and proposals were made to FAO to work towards strengthening Africancountries in forestry data collection and analysis.
In response to this problem, the preparation of a methodological guideline for the use of Africancountries for the collection, processing and dissemination of forestry statistics, including resourcebase information was proposed as one of the activities needed for the development of ForestryStatistics in Africa.
This conclusion led to the reporting officer's recruitment as a consultant on the subject by the FAORegional Office for Africa, Accra in September - October 1997 when he was under the employmentof the Forestry Management, Evaluation and Coordinating Unit (FORMECU), Nigeria. Theopportunity for the consultant to present this report at the FAO workshop in Zimbabwe 1998 wascreated by the re-engagement of the reporting officer (consultant) on a short-term appointment afteran earlier service to FAO in the Sudan.
The objective of the presentation of the report on " Methodological Guidelines for the Improvementof Forestry Statistics in Africa" during the workshop was to generate discussions that could lead tothe improvement of the report and strategies for Forestry Statistics Development in Africa. It wasalso aimed at exposing the workshop participants who are also a core group in African ForestryStatistics Development to the observations and recommendations of the report for their reaction.The need to present the is also justifiable by the fact that the consultant concluded that the reportcould not be described as a final document as the expert suggested that sub-regional or countryguidelines should be the ideal target.

FSTCU – SADC PRESENTATION
WORKSHOP PROCEEDINGS FORESTRY STATISTICS – MUTARE, ZIMBABWE (30 Nov. – 4 Dec. 1998)
39
The terms of reference according to the consultant were specific:♦ Analyse in general the situation of Forestry Statistics in Africa using existing documents and by
studying the situation in Ghana and Togo.♦ Analyse the legal and institutional organisation of the countries as well as the capacity of their
national technical services to collect and manage reliable forestry data.♦ Assess the needs in terms of personnel and logistics for adequate and effective management of
data essential to the development of the forestry sector in Africa.♦ Propose the structure and content of a methodological guideline for the improvement of
collection, processing and management of Forestry data (including the resource base).♦ Prepare methodological guideline for the use of African Countries, with the view to improving
collection, processing and the management of statistics on forest resources and products.
Organization of the Report
The study report was presented in nine chapters. The study background, objective and terms ofreference were highlighted in Chapter one. Chapter two presented the status of Forestry statistics inAfrica with particular references to the situations in Ghana, Togo and Nigeria.
Highlights of the major groups of databases including major variables that are needed for theimprovement of Forestry Statistics in Africa were carefully identified in Chapters 3, 4, 5, 6, 7 and 8.
Chapter 9 provided some useful field guides to facilitate data collection for the establishment andupdate of the identified databases. Useful past experiences of the specialist in data formats designand in the implementation of surveys were provided in this Chapter.
Finally, proposals for development of Forestry Statistics in Africa were made in Chapter 10 asrecommendations of this report.
Scope of the Study
Based on the observations in the countries studied during the assignment, major constraints to thedevelopment of forestry statistics in Africa were identified by the consultant. Proposals were madeto address these problems and enhance the status of Forestry Statistics in the region
According to the consultant, the major databases including their contents that are required forforestry planning, policy formulation policy analysis and development programmes monitoring forthe sustainable management of forests were also identified in this report. The uses to which theidentified databases can be put in forestry planning, policy fine-tuning and forest managementdecision taking processes were fully noted.
The consultant made no attempt in the report to exhaust the list of data required. He noted that thesustainable management of the complex forest ecosystem of Africa and its innumerable resourcesrequires expertise from many disciplines including ecology, silviculture, biometrics, rural sociology,economics, remote sensing, cartography, soil science and engineering. The consultant observed thatthe growing expertise in these fields in Africa would naturally expand forestry database in Africa inthe future.

FSTCU – SADC PRESENTATION
WORKSHOP PROCEEDINGS FORESTRY STATISTICS – MUTARE, ZIMBABWE (30 Nov. – 4 Dec. 1998)
40
No attempt was also made to provide field formats for data collection. The design of formatsaccording to the specialist should be the responsibility of individual countries. He observed that dataacquisition, processing and storage is expensive and that data interests and emphasis of each countrywill depend on country potentials. This fact, country socio-political structure, forestry organisationand data collection cost considerations will determine data scope, format structure and finalguidelines for data collection. Finally, the following observations and recommendations were madefor development of forestry statistics in Africa.
Findings of the Consultant
The consultant observed that available data for sustainable forest management in Africa are currentlyinadequate and unreliable due to:♦ The methodology of collection and estimation;♦ Poor responses from the field (particularly from industries);♦ The limited scope of data collection programme (wood-based industries data, products
consumption data and NTFPs data usually neglected);♦ Data loss due to institutional arrangements and occasional instability arising from survival and
competition problems and office relocations;♦ Manpower quality and staff retention problems;♦ Available infrastructure for processing, storage and retrieval (computers);♦ Untimely update of databases;♦ The lack of data development programmes;♦ Absence of compelling legal instruments; and♦ Inadequate funding.
The specialist affirmed that it was clear during the study period that all the countries were inproblems with data coordination. For example, he noted that the Forestry Commission of Ghanawhich assumes the responsibility of forestry statistics coordination in the country was lacking inmanpower and infrastructure. Like Ghana, the planning cell of the Federal Department of Forestryresponsible for data coordination in Nigeria was equally lacking in manpower and infrastructure.
However, the expert commended the efforts of some field Departments of Ghana, in particular, theForestry Management Capacity Building Unit based in Kumasi. The Cross River State of Nigeria hasequally made some commendable progress in forestry data acquisition and database development.
These success cases which the consultant found in bilateral project units demonstrate the importanceof finance in Forestry Statistics Development and the potentials of international support for forestrydevelopment in Africa.
Conclusions and Recommendations of the Report
The poor status of forestry statistics in Africa can be associated with institutional weaknesses ingeneral. The indices of forestry sector weaknesses in Africa include the poor structural organisationof forestry units in many countries; inadequate expertise and manpower; poor funding ofprogrammes; and weak support for enacted laws and enunciated policies.
The Forestry Sector in most African countries require internal re-organisation to acquire the needed

FSTCU – SADC PRESENTATION
WORKSHOP PROCEEDINGS FORESTRY STATISTICS – MUTARE, ZIMBABWE (30 Nov. – 4 Dec. 1998)
41
capacity to collect adequate and reliable data. While there are no strong barriers to the effectivefunctioning of forestry in this domain, the structural organisation of institutions of the forestrysector in most African countries hinder data flow. Roles and responsibilities with particularreference to forestry statistics should be well defined. International assistance in statisticsdevelopment should assist countries to organise structurally by proposing units and relationshipsthat are best fitted into their socio-economic circumstance. Established units within the forestrysector should be strengthened to acquire capability in the maintenance of databases relevant to theirspecialisation.
Communication problems exist within the forestry sector of many African countries. This can beaccentuated by country administrative and governance systems; number of forestry sectorinstitutions and ministerial location of units. To improve forestry statistics and information on theforest environment, the communication problems that can be associated with the situations abovehave to be well managed to reduce the problems of data co-ordination, data validation andduplication of effort in forestry data acquisition, processing, storage and dissemination. Programmesfor forestry statistics development in Africa must establish the appropriate infrastructure forimproved communication between forestry units and for data flow to the National Forestry StatisticsCo-ordinating Unit.
Communication with other national agencies in forestry statistics such as the National Bureaux ofstatistics, the Central Banks, Export Promotion Boards, the Ministries of Trade, the Ministries ofIndustry and the Customs Departments should be improved for greater assess to forestry informationwithin their domains.
As national infrastructure for telecommunication improves, Forestry Units should be assisted tooperate national networks for the promotion of information sharing and dissemination nationally. The overall ambition of the forestry sectors of Africa should be their connection to the rest of theworld through Internet.
In identifying the databases in this report, the survival of the growing specialised units in Africanforestry such as Forest Management Units, Rural Forestry, Marketing and Utilisation, RemoteSensing and Cartography, Planning and Statistics have been assumed. The conclusion here is that aNational Forestry System that is well organised and structured with officers that are professionallyoriented is important to development of an efficient Forestry Statistics in Africa. These Unitsrequire national political and financial support for growth and survival.
While Forestry databases need co-ordinating officers, forestry data collection and processing shouldremain a major item in the schedule of all field staff. There is a need to re-emphasise theimportance of field record keeping systems, such as timber extraction records; records of forestrevenues including, revenues accruing to land owners; forest regeneration records includingoperations costs; summary of forest offences; and records of forest reservation and de-reservation.
Intensive training of officers will be needed for the development of forestry statistics in Africa. Fortraining effectiveness however, training modules must be directed to the immediate functionalresponsibilities of officers. All forest officers must be made to acquire computer literacy at least inword processing, use of DOS, spreadsheets and data management programmes.
Databases should be processed analysed and published for users. Published hard copies areimportant in safeguarding data losses that are possible during major computer breakdowns. Forestry

FSTCU – SADC PRESENTATION
WORKSHOP PROCEEDINGS FORESTRY STATISTICS – MUTARE, ZIMBABWE (30 Nov. – 4 Dec. 1998)
42
information centres and libraries should be developed as part of statistics development programmes.
NTFPs collection, processing and marketing form part of the crucial economic base of many ruralcommunities in Africa. Due to the lack of data on the contribution of the products to nationalincome, however, the NTFPs sub-sector has not received the needed policy and political support fortheir sustainable management. Forestry data collection programmes will need to focus a little moreattention on the products. The NTFPs sub-sector is critically short of data.
The collection of timely, adequate and reliable data is expensive requiring competent statistics co-ordinators, forestry experts and support staff. Equipment and funds are also involved. For thedevelopment of forestry statistics in Africa, forestry statistics projects are necessary to define datacollection objectives, data output expected and data delivery time. National budgets for forestry inAfrica must therefore provide for forestry data collection annually.
Poor response to requests for data is one of the problems militating against forestry statistics inAfrica. For example, industries do not readily release production information (inputs and outputs).The problem of poor response is also common where governance system is highly decentralisedsuch as in strong federalism where states are responsible for the management of their forestresources. To effect behavioural change some compelling legal instruments may be necessary insome countries to enforce data supply to National Statistics Co-ordinating Units. However, thismeasure should be used only where the avenues opened for consultation within the sector such asNational Forestry Development Committees or National Forestry Development Commissions areunable to use their auspices and communication channels to resolve issues of poor responses toforestry statistics.
Linking the Report to Forestry Development Programmes in Africa
The draft report completed by the consultant, according to Michael Martin, Chief, Forestry Planningand Statistics Branch, became part of the conceptual foundation for the EC- FAO Partnershipprogramme on Data Collection and Analysis for Sustainable Forest Management in Africa and theCaribbean.
The project's on-going sub-regional workshops according to the Chief, are designed to support andassist AFWC member countries in underscoring the value of good statistics, highlight data needsand identify opportunities to strengthen their statistical capabilities.
The head of the FAO Forestry Statistics Branch concurs with the consultant's suggestion that sub-regional or country guidelines should be the ideal target.
The AFWC who discussed the report during its inter-sessional meeting of the Commission in Accra,26-30 October 1998 equally commended the potentials of the report. Extracts from the proceedingsof the meeting of the Commission on the report were as follows.♦ "The meeting noted that the case studies featured in this paper were focused geographically on
West Africa, although it drew on regional material, including country submissions on the 1997FAO statistics survey.
♦ The Meeting also pointed to some possible areas for improvement in the paper. For example,the author's reference to revenue collection as a motivating factor for data collections in many

FSTCU – SADC PRESENTATION
WORKSHOP PROCEEDINGS FORESTRY STATISTICS – MUTARE, ZIMBABWE (30 Nov. – 4 Dec. 1998)
43
countries could be misleading for various reasons. Concern was also raised over the exhaustivescope of data series proposed, which was considered over-ambitious in the context of presentcapacities in most countries.
♦ Overall, the Meeting commended the potentiality of the paper, but suggested that more workwas required before finalisation. In particular, that: (i) the author should recommend a minimumdatabase for each country; and (ii) FAO should arrange a workshop to discuss the document, inline with recommendations from AFWC"

FSTCU – SADC PRESENTATION
WORKSHOP PROCEEDINGS FORESTRY STATISTICS – MUTARE, ZIMBABWE (30 Nov. – 4 Dec. 1998)
44
APPENDIX IV LIST OF PARTICIPANTS
Summary:International Country Participants: 12Zimbabwean Participants: 9Observers (NGO - Intern. Organisation): 2FAO Staff and Consultants: 5
TOTAL: 28
ANGOLA1. Afonso ZOLA
Institute of Forestry DevelopmentP O Box 1257 LUANDA-ANGOLATel: 244-2-323934; 244-2-323581; Fax: 244-2-323934
BOTSWANA2. Kemonna K. KEAPOLETSWE
Forestry SectionP O Box 400 FRANCISTOWN – BOTSWANATel: 267-213234; Fax: 267-213234
LESOTHO3. Elias S. SEKALELI
P O Box 774 MASERU 100 – LESOTHO;Tel: 266-322754; 266-322154; Fax: 266-310349; 266-310515; E-Mail: [email protected]
MALAWI4. Sam KAINJA
Forestry Department HQP O Box 30048 LILONGWE 3 - MALAWITel: 265-781417; 265-828044; Fax: 265-784268E-mail:[email protected]; [email protected]
5. Kasizo Zukas CHIRAMBOForestry DepartmentP O Box 30048 LILONGWE 3 - MALAWITel: 265-781000; 265-781160; 265-781417; Fax: 265-784268E-mail:[email protected]; [email protected]
MOZAMBIQUE6. Mandrate N. ORESTE
Ministerio de Agricura e PescasDNFFB, Praca dos Herois MocambicanosC.P. 1406 MAPUTO - MOZAMBIQUETel: 258-01-460036; 258-01-460096; Fax: 258-01-460060; E-mail: [email protected]
7. Carla Cristina Dinis CUAMBEMinisterio Da Agricultura E Pescas DNFFB C.P. 1406 MAPUTO - MOZAMBIQUE

FSTCU – SADC PRESENTATION
WORKSHOP PROCEEDINGS FORESTRY STATISTICS – MUTARE, ZIMBABWE (30 Nov. – 4 Dec. 1998)
45
Tel: 258-01-460036; 258-01-460196; Fax: 258-01-460060
SOUTH AFRICA8. Ms Sebueng KELATWANG
Private Bag X93 PRETORIA 0001 - SOUTH AFRICATel: 27-12-3387766; Fax: 27-12-3387767E-mail: 1ae@ dwaf.pwv.gov.za
9. Dr Themba L. SIMELANEDept. of Water Affairs & ForestryPrivate Bag X93 PRETORIA 0001 - SOUTH AFRICATel: 27-12-338-7734; Fax: 27-12-328-6041E-mail: [email protected]
SWAZILAND10. Cliff S.DLAMINI
P O Box 162 MBABANE - SWAZILANDTel: 268-49229; 268-42731; 268-83038; 268-83017; Fax: 268-44700; 268-41104
ZAMBIA11. Charles M. TAULO
Provincial Forestry OfficeP O Box 510095 CHIPATA - ZAMBIATel: 260-062-22001; 260-062-21264; Fax: 260-062-22001
12. John MULOMBWAForest DepartmentP O Box 410017 KASAMA – ZAMBIATel: 260-4-221222 (Office); 260-4-222212 (Home)
ZIMBABWE13. Dominick KWESHA
C/O Forestry CommissionP O Box HG595 Highlands HARARE - ZIMBABWETel: 263-4-496878; 263-4-496879; Fax: 263-4-497070E-mail: [email protected]; Website:http://users.harare.iafrica.com/~vegris
14. Darlington DUWAC/O Forestry CommissionP O Box 40 CHIMANIMANI - ZIMBABWETel: 263-26-2440; 263-26-2441; Fax: 263-26-2966
15. Peter C. GONDOForestry CommissionBox HG 139; Highlands HARARE - ZIMBABWE

FSTCU – SADC PRESENTATION
WORKSHOP PROCEEDINGS FORESTRY STATISTICS – MUTARE, ZIMBABWE (30 Nov. – 4 Dec. 1998)
46
Tel: 263-4-498436; 263-4-498439; Fax: 263-4-497070; 263-4-497066E-mail: [email protected]
16. Dan MABVURIRASilviculturistC/O Zimbabwe College of ForestryP O Box 660 MUTARE - ZIMBABWETel: 263–20-64328; Fax: 263–20-60158E-mail: [email protected]
17. David GWAZEForestry CommissionP O Box HG 595 Highlands HARARE - ZIMBABWETel: 263-4-496878; 263-4-496879; Fax: 263-4-497070E-Mail: [email protected]
18. Lazarus TAWONEZVIForestry CommissionP O Box 322 MUTARE - ZIMBABWETel: 263-20-61010; 263-20-62750; 263-20-64515; Fax: 263-20-62446E-mail: [email protected]
19. Mr Hans JARLINDZimbabwe College of ForestryP O Box 660 MUTARE - ZIMBABWETel: 263-20-65455; Fax: 263-20-60158E-mail: [email protected]
20. Crispen MARUNDAForest Research CentreP.O Box HG595 Highlands HARARE - ZIMBABWETel: 263-4-496878; Fax: 263-4-497070E-Mail: [email protected].
21. Memory ZIROBWAForestry CommissionChesa Forest Research StationP.O Box 467 BULAWAYO - ZIMBABWETel: 263-9-42843; 263-9-45662; Fax: 263-9-74825Email: [email protected]

FSTCU – SADC PRESENTATION
WORKSHOP PROCEEDINGS FORESTRY STATISTICS – MUTARE, ZIMBABWE (30 Nov. – 4 Dec. 1998)
47
NGO22. Ms Annie M. CHISHAWA
Southern Alliance for Indigenous Resources (SAFIRE)P O Box B E 398 Belvedere HARARE - ZIMBABWETel: 263-4-795461; 263-4-794333; Fax: 263-4-790470E-mail: [email protected]
PRIVATE SECTOR23. Mr Mike Chihambakwe
ECON AssociateP.O Box BW 1061 Borrowdale - HarareTel: 263-4-885208; Fax: 263-4-885208
SPECIAL GUESTS AT OPENING
24. Mr.P.KariwoGeneral ManagerForestry CommissionP O Box HG 595 HARARE - ZIMBABWETel: 263-4-498078(Ext.9); 263-4-498436(Ext.9); 263-4-498030; Mobile: 263-11-266151E-Mail: [email protected]
25. Dr. P Munzi,Deputy Ambassador,Italian Embassy, Harare - Zimbabwe
OTHER PEOPLE MET26 Gus Le Breton,
Director of SAFIRE - NGO(Southern Alliance for Indigenous Resources)10 Lawson Avenue, Milton Park, Harare - ZimbabweTel: 263-4-795461; Fax: 263-4-790470Email: [email protected]
27 Mrs C. Dunlop,Canadian International Development Agency (CIDA)Canadian Embassy, Harare - Zimbabwe
28 Dr Robson MutandiResearch and Technical Services Co-ordinator(Southern Alliance for Indigenous Resources)10 Lawson Avenue, Milton Park, Harare - ZimbabweTel: 263-4-795461; Fax: 263-4-790470Email: [email protected]
FAO

FSTCU – SADC PRESENTATION
WORKSHOP PROCEEDINGS FORESTRY STATISTICS – MUTARE, ZIMBABWE (30 Nov. – 4 Dec. 1998)
48
29. Jim BALLSenior Forestry OfficerForest Resources Development ServiceForest Resources DivisionViale delle Terme di Caracalla, 00100 ROME - ITALYTel: 39-06-57054047; Fax: 39-06-57055137E-Mail: [email protected]
30. Peter LOWEForestry Planning OfficerFAO Regional Office for AfricaP O Box 1628ACCRA - GHANATel: 233-21-244051; Fax: 233-21-668427E-Mail: [email protected]
31. Michel LAVERDIEREForest Conservation OfficerFAO Sub-Regional for Southern and Eastern Africa6th Floor Old Mutual CentreJason Moyo AvenueP O Box 3730HARARE - ZIMBABWETel: 263-4-791407; 263-4-791420; 263-4-791485; Fax: 263-4-793497E-Mail: [email protected]
32. Charles OMOLUABIForestry Officer (Economic Analysis)Forestry Planning and Statistics Branch (FONS)Forestry Policy and Planning DivisionViale delle Terme di Caracalla – 00100 ROME - ITALYTel: 39-0657052811; Fax: 39-0657055137E-Mail: [email protected]
33. Saori HIRAIAssociate Professional OfficerPlantation and Protection DatabaseForest Resources Development ServiceForest Resources DivisionViale delle Terme di Caracalla, 00100 ROME - ITALYTel: 39-06-57053181Fax: 39-06-57055137E-Mail: [email protected]

FSTCU – SADC PRESENTATION
WORKSHOP PROCEEDINGS FORESTRY STATISTICS – MUTARE, ZIMBABWE (30 Nov. – 4 Dec. 1998)
49
APPENDIX V COUNTRY CONTRIBUTIONS
OVERVIEW OF FSTCU (SADC) PRESENTATION
The SADC Forestry Sector Technical Coordination Unit (FSTCU) mandate, responsibilities andfunctions are based on the decision of the Council of Ministers that met in Maseru, Lesotho in 1985.
Mandate:
Monitor sector projects;Facilitate identification of opportunities;Coordinate policy, research, and training;Mobilize resources for approved projects;Organize technical meetings, workshops, and seminars;Manage relevant information/data; andReview Forestry Sector Program of action.
Responsibilities:Consultations with member states and Secretariat;Liase with co-operating partners; andProvide leadership and technical services for advancement of SADC programme of action.
Functions:Organise SADC Sectoral Committees of Ministers & Officials;Organise sectoral consultative meetings with Cooperating Partners;Disseminate sectoral meetings outcomes to member states;Prepare sectoral strategy papers;Initiate Project Activities;Assist identification of Project financing;Mobilise pledges made by Co-operating Partners;Provide technical back-up on Project funding;Witness signing of agreements; andReport on progress of Programme.
SADC-FSTCU Programme:Forest Training and Education;Forest Research;Forest Utilisation and Trade;Forest Resource Assessment;Forest Resource Management; andForest Industry Development.

FSTCU – SADC PRESENTATION
WORKSHOP PROCEEDINGS FORESTRY STATISTICS – MUTARE, ZIMBABWE (30 Nov. – 4 Dec. 1998)
50
Projects:Funded projectsUrban Fuelwood Project (AAA.5.3);SADC Tree Seed Centres Network ( AAA.5.5);S. African Biodiversity Programme ( AAA.5.6);Improvement and Strengthening of Forestry Colleges in SADC Region (AAA.5.9);Centre for Advanced Practical Forestry Training (-Urban fuelwood Project (TAN.5.16); andReforestation and erosion control at Nacala (AAA.5.14).
Partially funded projectsSustainable Management of Indigenous Forests ( AAA.5.20); andRegional Herbarium and Conservation of Endangered species (AAA.5.20).
Unfunded projectsRegional Vegetation Mapping;Capacity Building in extension for Community Forestry in the SADC Region (AAA.5.12);Agroforestry in Arable and Pastoral farming (AAA.5.19);Formation of SADC Timber Association (AAA.5.22);Strengthening of forestry and Forest Products Research (AAA.5.23); andDevelopment of Forestry Information Management Network System in SADC Region (AAA.5.24).
Challenge for FSTCUFunding
FSTCU – SADC PRESENTATION
WORKSHOP PROCEEDINGS FORESTRY STATISTICS – MUTARE, ZIMBABWE (30 Nov. – 4 Dec. 1998)
51

ANGOLA COUNTRY REPORT
WORKSHOP PROCEEDINGS FORESTRY STATISTICS – MUTARE, ZIMBABWE (30 Nov. – 4 Dec. 1998)
52
FORESTRY DATA ON ANGOLA
byAlfonso ZolaSenior Forestry OfficerInstitute of Forestry DevelopmentLuanda - Angola
PRELIMINARY COUNTRY DATA (ANGOLA)
Total land area (ha) 124,670 000
Natural forest area 1990 (ha) /% of the total land 23,074,000 / 19%Annual deforestation 1980-1990 (ha) / rate 174,000 / 0.75%Annual allowable cut ( m3 ) 320.000Reported plantation area 1990 (ha) 140,000Annual reforestaion 1990 (ha) 100Protected area (ha) 81,060 / 6.5%Other wooded lands 1990 (ha) 50,700, 000 /40.7%
Population 1996 / annual growth% 12,278,000 / 2.6%Density per Km2 9.8Urban / rural population 46% / 54%GNP (per capita) 1990 US $ 800Inflation rate%: annual (1995) 37.05Accummulated (1995) 824.30
1. CONTEXT
1.1. Background
Angola has total land area of 1,246,700 km2, situated between latitudes 4o41’ and 18o02’S andlongitudes 11o41’and 24o05E. The population was estimated at 12,278,000 inhabitants in 1996 andaverage growth is 2.6% with 9.8 inhabitants per square kilometre density. Reportedly around 60%of the population is living to the urban area. This figure is high compared to other countries in theregion. Some of the rural population have abandoned their original land area for security purposes.
The country is administratively divided into 18 provinces, bordered on the north and northeast byThe Democratic Republic of Congo, Zambia on the east and Namibia to the south. The country has1,600 km of coastline along the Atlantic Ocean.
The country consists of plateau generally between 1,000 and 1,200m covering threefold of itsterritory. The highest mountain is Serra Moco with an altitude of 2,620m.
The climate is generally tropical and moderated by the sea altitude, with more 1,800 mm of rainfall
ANGOLA COUNTRY REPORT
WORKSHOP PROCEEDINGS FORESTRY STATISTICS – MUTARE, ZIMBABWE (30 Nov. – 4 Dec. 1998)
53
in the nothern part of the country, and 100mm in the southern, mainly in Namibe province,influenced by the Kalahari desert. The rainfall is at about 1,500 mm in the high plateau, especiallyin the provinces of Uige, Huambo and Lunda.
1.2. Economy and economic policy
The government relies heavily on external support from international institutions like the WorldBank, IMF, United Nations, and bilateral agreements on extraction of mineral resources, particularlyoil and diamonds. Little or no emphasis is placed on promoting basic production sectors, such asagriculture, fishery and others equally important to Angola’s development.
1.3. Political situation
Currently Angola faces a critical political situation. In 1975 the country gained independence fromPortugal by the nationalist military. The military lead the country into a prolonged civil war. Thishas affected current and future resource operations in Angola.
The civil war has ended, but the trend to return to war is increasingly likely. The political situationis still fragile and in the extensive interior, government control is not fully implemented and mostsignificantly, the area is dangerous to access for field work due to the extensive presence of landmines. Acording to UN information sources, 11,000,000 different types of mines were disseminatedin the country. Removal operations have not been successful.
1.4. Social and human context for forestry
Despite the low rank of forests in the Angolan economy (due to the immense natural resources ofthe country, such as oil, diamonds and other important minerals and fisheries) forests and forestryplay a very important role for the survival of a significant part of the population. Some reports statethat more than 80% of the inhabitants of the country live in the rural area and their dependence onforestry is very high. The forest is an important resource of their lives. They extract almost all theirbasic products such as wood for energy purposes, poles for construction, plants for medicinalpurposes, hunting and trapping, watershed protection, game and wildlife conservation andbiodiversity maintenance.
Although the country is rich in mineral and agricultural resources, but it is still far away fromsatisfying the demands of the population. The government must locate within the economichierarchy, a place for this very important sector particularly because most of its inhabitants arelargely dependent on the forest and forest products.
2. FOREST RESOURCES
2.1. land ownership
After independence the country’s constitution stated that all land and forest in Angola belonged tothe state. Therefore, the Land Policy defining possession rights and conditions for its use wasestablished. Land as well as forest permits were issued under limited regulations.
The Constitution of 1992 approved the Law 21-C/92: the Law of Concessions, or so-called LandLaw. There is a clearly stated principle that local community land rights will be protected ( in the

ANGOLA COUNTRY REPORT
WORKSHOP PROCEEDINGS FORESTRY STATISTICS – MUTARE, ZIMBABWE (30 Nov. – 4 Dec. 1998)
54
preamble of the Land Law), it recognises different forms of land access, including rights acquiredby previous owners. These aspects are positive, however this law is based on old concepts, andreflects old ideas of the Government following central planning principles.
Pratically it is not a Land Law, but a law for issuing licences for approved economic activities onspecific areas. The Land Law does not define the land rights of different users competinng forresources and relationships between them. This law does not cover all national territory. Publicdomain areas such as National Parks and Forestry reserves, urban areas, airports, coastline, militaryand other public areas are excluded. The law fails to cover any systems that regulate land access andrights for at least 95% of all land use units in the country.
2.2. Land use
The country posesses imense land and forest resources and conflicts for land use are practically non-existent. Territorial surface is relatively larger compared to total population and during a largeperiod, land and forest were in very few proportion submitted to work production. This tendencydoes not seem to take long. New policy on Land Law has been formulated and the rights of landconcession are completely different, with some relevant constraints.
Conflict between different interest groups is inevitable in the future unless an appropriateframework can be found to accommodate them. Angola is very large, but the best land will quicklydisappear as it acquires new value as a productive asset after a secure political settlement.
2.3. Land use potential
Land-use classes Area, ha Percentage,%Arable landForest landPermanent pasture landMountain and shrublandOthersTOTAL LAND AREA
8,000,00050,700,00033,000,00028,000,0004,900,00024,670,000
6.440.726.522.53.9 100.0
3. NATURAL FOREST RESOURCES
3.1. Area, and change of area volume over time
Angola is divided into 12 biomass classes. The standing biomass of the different vegetation types isslightly less important in this classification than the phenology and productivity. The floristiccomposition is relatively unimportant. Consequently, some biomass classes incorporate a variety ofvegetation types which are related in terms of phenology, productivity and biomass, as distinct fromfloristic units. These biomass classes are more appropriate for the appraisal of fuelwood resourcesthan the previously defined floristic-mapping units.
Standing biomass reserves are very high over much of the country. Four of the twelve biomassclasses identified and described below are dominated by forest and woodland and have highfuelwood and timber potential. They also account for 61.6% of the country. This is substantiallyhigher than 40% closed forest and savannah-woodland cover calculated by Lanly (1981) even if his

ANGOLA COUNTRY REPORT
WORKSHOP PROCEEDINGS FORESTRY STATISTICS – MUTARE, ZIMBABWE (30 Nov. – 4 Dec. 1998)
55
deforestation rate of 40,000 ha year is taken into account. One of the discrepancies of this study wasthe inclusion of the wooded savannahs and cleared areas in the north of the country in the four forestwoodland biomass classes. Nevertheless, it is still difficult to arrive at Lanly’s estimate and itappears Angola has considerably more forest and woodland than previously suggested. In additionsome of the dry-savannah biomass classes have high standing woody biomass as well. Three classes– coastal and desert vegetation and two grassland classes – are characterised by very low reserves(5.61% of the country by area). Biomass classes dominated by savannah vegetation haveintermediate fuelwood reserves and they account for 29.5% of the country by area. The widevariation in vegetation types, and therefore fuelwood potential, is due to the fact that much ofnorthern Angola is transitional with the rain forest zone, and the Southwest is in the arid zone.Despite this extreme range of vegetation types, much of the country is covered by Miombowoodland, varying from Dense, High Miombo Woodland to Dry, Open, Deciduous MiomboSavannah. The strongest controls on distribution in Angola appear to be vegetation disturbance,rainfall amount and seasonality, depth of soil, and altitude.
Despite the very healthy national biomass picture, there are a number of areas that have obviousproblems with fuelwood supply. The provinces most affected, in terms of the area extent ofmoderately and highly productive fuelwood sources are Bengo, Namibe and Luanda. These areashave been identified previously. Trees in Bengo and Luanda provinces have been cleared foragriculture, grazing and fuelwood at an increasing rate over the past 15-20 years and the situation inthese provinces is now critical. The Namibe province suffers from a natural shortage of productivebiomass reserves and the problems of fuelwood supply to the main towns. Estimates have shownthat the cutting of vegetation exceeds annual growth in Namibe province. There is evidence that theDry Deciduous Savannah in Huila province, along the Lubango-Huambo Road and the Lubango-Namibe Railway, is being exploited to meet the fuelwood demands in Namibe. In addition, morelocalised shortfalls in production can be recognised from the biomass-class maps and productivitydate for the following provinces: Benguela – along the coastal and inland as far as Bocoio andCantangue; Cabinda – along the coastal plain; Cunene – around Ngiva City; Kwanza Norte – in thewestern half of the district; Kwanza Sul – along the coast and inland as far as Gabela and aroundKibala; Moxico – along the Luena Valley; and Zaire – along the coastal plain.
Summary of growing stock and data
Biomass class Area Growing stock MAI100 ha (% of
country)(mil.ton.)
(% oftotal)
(mil.ton.)
(% of t.)
Transitional Rain Forest/Miombo Woodland 159,600 13 1,137 24 40 25Dense High Miombo woodland 111,281 9 793 17 25 17Dense Medium-Height Miombo/woodland 221,164 18 1,575 33 50 35Seasonal Miombo, Woodland and WoodedSavannah
306,946 25 609 13 15 10
Dry Deciduous Savannah 229,657 18 386 8 11 8Dry Coastal Savan. Arid Coastal Thicket 48,484 4 57 1 2 2Dry Inland Savannah 26,263 2 31 1 1 1Degrad. Rain Forest, Miombo Woodland 33,220 3 31 1 1 1Degraded Dry Deciduos Savannah 34.987 9 82 2 3 2Bushy Arid Shrubland 15,748 1 11 1 1 0Chanas da Borracha Grassland 37,251 3 0 0 0 0Montane Grassland 833 0 0 0 0 0Coastal and Desert Vegetation 21,184 2 0 0 0 0TOTAL 1,246,698 4,713 141

ANGOLA COUNTRY REPORT
WORKSHOP PROCEEDINGS FORESTRY STATISTICS – MUTARE, ZIMBABWE (30 Nov. – 4 Dec. 1998)
56
3.2. Area of established plantations
Plantations in Angola were established during the colonial era, during 1960 and 1970. Most plantedareas are located in the Central plateau of the country, created by the Railway Company ofBenguela, CFB and by the Paper Board Company of Alto Catumbela with the purpose of supplyingthe energy for the train between Lobito Horbord and the extreme part of the eastern country and thesupply of raw material to the Paper Board Company.
There are also some public woodlots established for different purposes such as firewood supply andprotective purposes. Most of species used are Eucalyptus spp. They represent approximately 80%,the Pinus spp., the Cupressus lusitanica estimated at about 7,400 ha. Since independence theseplantations have been abandoned. No management took place on the Paper Board Companyplantations for many years. The situation is the same on the other plantations owned by the state andprivate enterprises.
Areas Of Industrial Plantations (Estimated, 1985)
Province CFB CFL PBC Ministry Private TotalBenguelaHuamboBiéMoxicoMalangeHuilaOuthersTOTAL
3,37314,97810,9485,027---34,326
----580--580
53,16611,390-----64,556
-25,900400--2,5041,10529,909
-3,234800---1,2325,266
56,53955,50212,1485,0275802,5042,337134,637
The planted area in the framework of National Afforestation Programme in the Coastal Zone, from1993 to 1998 on its first phase.
No Province Project Area, ha No. ofplants
Density/ha Species
1 Namibe Tombwa 174 87,100 500 1, 3, 10Umpata Catete 45 12,510 278 1, 3
2 Benguela Baia Farta 42 13,650 325 1, 2, 5, 11S. António 6 1,350 225 1, 2, 11Aeroporto 27 16,875 625 1, 2, 11
3 Luanda Benfica 15 3,200 213 1, 2, 4, 5, 9,12Ilha de Luanda 23 14,375 625 1, 2
4 Sumbe Balela 32 26,666 833 1, 2, 4, 5, 9,12Dois Morros 28 10,000 357Comunidades 13 10,833 833
5 Cabinda Dingo 8 9,720 1164N’Goio 2 2,837 1146
5 5,076 10251 214 305
TOTAL 423 215,491

ANGOLA COUNTRY REPORT
WORKSHOP PROCEEDINGS FORESTRY STATISTICS – MUTARE, ZIMBABWE (30 Nov. – 4 Dec. 1998)
57
1. Prospsis juliflora; 2. Azadirachta indica 3. Casuarina equisetifolia 4. Trichilia spp 5. Leucaenea leucocephala 6. Eucaliptus spp. 7. Pinus spp. 8. Cupresus lusitanica 9. Euforbiacea10. Euforbiacea 11. Acacia rubra 12. Terminalia catata
4. FOREST PRODUCTS PRODUCTION, TRADE AND CONSUMPTION
Roundwood, industrial, sawnwood, and other products
1995Value, NKz
1996Value, NKz
1997Value, NKz
Rondwood, m3 96,011 46,329,364.00 170,745 2,000,000.00 39,735 36,063,384.00Sawnwood, m3 na na na na 117 90,000,000.00Firewood, st. 85,818 2,013,461.00 125,625 3,987,500.00 35,427 577,958,000.00Charcoal, ton 43,498 5,562,017.00 15,000 na 21,051 3,082,597.00Other products 1,783,878.00 25,271,376.00 1,702,761.00
Figures above reflect the weakness of the forestry sector. It has been dificult to ascertain data relatedto many products largely used in the country. The sector is poorly equiped in means and skilledpersonnel. Data on trading and consumption of forestry resources is limited. This situation is alsoextended to other sectors directly or indirectly linked to the forestry sector, whereby others areconsidered as potential sources of data and information. Data regarding sawnwood is scarce toobtain, the few sawnmills operating are resistant to supply data.
It is the same when it comes to information on firewood and charcoal. Forest products are largelyused to satisfy the basic population demands. The data above are the results of permits issued by theforestry sector. It has been impossible to account for these products in the rural areas due to sectorweakness and inability to set control in those areas.
Other product aspects are not quantified because it includes a range of products and is the same asprevious cases, control is only possible around the main cities. The Paper and Paperboard Companyclosed in 1985 due to military confrontations in the area.
5. OTHER FORESTRY PRODUCTS AND ROLES
5.1. Woodfuels and wood energy
Firewood and charcoal are and will remain the most important secondary product to satisfy the basicneeds of a large number of the inhabitants in Angola, except a in the main cities. The figures forcommercial production of firewood and charcoal, however, are expected to be much higher thanthose quoted. Those figures are derived from royalties collected on the two commodities.
The estimated firewood and charcoal production in 1997 was 35,427 steres and 21,051 tonsrespectively. Very far from the 6,000,000 m3 required annually for energy purposes. Logging forcharcoal production is done by private agents usually directed to areas set for agricultural clearing.but in many cases also to zones inside forest reserves. Licences are also issued by the Institute ofForestry Development for firewood production purposes.

ANGOLA COUNTRY REPORT
WORKSHOP PROCEEDINGS FORESTRY STATISTICS – MUTARE, ZIMBABWE (30 Nov. – 4 Dec. 1998)
58
Production in the northern region is relatively satistactory due to the abundance of forest resources,but the situation in the central and southern region is different due to the climate.
Energy Statistics
CONSUMPTION ENERGY FOR DOMESTIC PURPOSESFirewood: 61%Charcoal: 31.6%Others (electricity, GLP, Kerosene and diesel): 7.4%
FIREWOOD CONSUMPTION7% for industrial and 93% for domestic purposes
CONSUMPTION OF CHARCOAL100% of domestic purposes
ENERGY CONSUMPTION PER CAPITAOil produts: 4484 MJ (very less comparing to Botswana, Namibe and Swaziland)Electricity: 301 MJCharcoal and firewood: 6345 MJ
Energy Balance
Firewood& charcoal
GLP Oil Hydro-electricity
Electricity By-oil Total
Total productionAvailable offer*Real offerFinal consumption%
8787494956*
143136---
59062.6---
77---
--222
--483742
826292 99 88100
*this figure is currently estimated at about 60%Source: SADC National Survey activities
5.2. Wood supplies from non-forest areas
Angola has vast forest resources, but their distribution is unequal. The scarcity of forest products isacute in the major concentration of the population, as is in Luanda and other main cities, mainly inthe coastal zone where the majority of population lives.
Forest products in these areas are supplied by other areas classified as forestry productive zones,especially roundwood, industrial wood, and fuelwood as well.
5.3. Non-wood forest products
Non-wood forest products play a role of paramount importance for the basic needs of the

ANGOLA COUNTRY REPORT
WORKSHOP PROCEEDINGS FORESTRY STATISTICS – MUTARE, ZIMBABWE (30 Nov. – 4 Dec. 1998)
59
population, particulary in the rural area, where industrialisation is almost non existent.
These non-forest products are well known, unfortunately it has been very difficult for theresponsible sector to quantify and include them their statistics.
5.4. Recreation and tourism
Recerational and touristic areas are under the Ministry of Tourism, and these are located in free andprotected areas. The six protected areas have been established for 30 years. In 1970 campaignsbegan sensitising the population for the protection of wildlife. This process was interrupted by thecivil war.
After independence the parks and game reserves were pratically abandoned and according toinformation and data from the sector, there are actually 13 protected areas in the country,representing a total area of 8,106,000 ha, i.e. 6.5% of the total land area.
Protected Areas
Protected area Province Biome Category Area, haIonaKameiaKisamaBicuariMupaKangandalaLuandoNamibeChimalavelaOther reserves (4)
TOTAL
NamibeMoxicoBengoHuilaCuneneMalangeMalangeNamibeNamibe
Karoo-NamibZambeziacoKaroo-NamibKaroo-NamibKaroo-NamibZambeziacoZambeziacoKaroo-NamibKaroo-Namib
National ParkNational ParkNational ParkNational ParkNational ParkNational ParkGame reserveGame reserveRegional ParkGame reserve
1,592,0001,400,000996,000790000660,00060,000828,000468,00016,0001,296,000
8,106,000
6. FORESTRY POLICIES, LEGISLATION, AND INSTITUTIONS
6.1. Forest management law and policy
Private and public sectors
Forest access and management is essentially a socio-economic issue, regulated by a legal frameworkreflecting the relations between different socio-economic groups in the society, and between theseand the State. Although good forest management in a country is a sine qua non for a prosperousagricultural economy, forest access and management are not simply a forest issue, to be managed bythe MoA.
Attention given to land issues should be the same for foresty resources since there is a stronginteraction between land and forest, therefore, other institutions and agencies have an important roleto play within the MoA, if forest management is understood in its administrative sense. Theinvolment of all these sectors, political parties, wider civil society and local communityrepresentatives and different levels of Government is mandatory for an effective solution. Only then

ANGOLA COUNTRY REPORT
WORKSHOP PROCEEDINGS FORESTRY STATISTICS – MUTARE, ZIMBABWE (30 Nov. – 4 Dec. 1998)
60
will the legal-administrative framework genuinely reflect social reality, and have the support ofinterest groups seeking forest resources for the future.
The administration of forest resources is under the MoA, the Institute of Forest Development is theimplementing agent, while the Directorate of Agriculture and Forest acts as a policy planner.
Despite the 6.5% of the protected area, there is not a management plan the areas. The lack of forestpolicy in the country is one of the negative aspects for the development of the Forestry sector as awhole. There is still in use the colonial Forestry regulations of 1962 and the National ParkRegulations of 1972. Both have already been submitted to revision but, some aspects such asmanagement, silvicultural treatments and training, were disregarded.
6.2. Investments in forestry and forest products
During the past 15 years the state was the only investor in all sectors, due to the socialist orientationof the economic and political system. At the beginning of 1990 the state decided to change thispolicy and economic system to a free-market system. The interest shown by domestic and foreigninvestors rose dramatically. However, the government must assure peace in Angola and reviewinvestment policy.
6.3. Institutional strengthening and capacity building
The forestry sector has a good structure, but it is inflexible. The sector is represented in the 18provinces of the country, but weakly equiped in terms of skilled personnel. Very few foresters haveformal degrees. A number of institutions are interested in becoming involved in the management ofthe environment. These institutions will play key roles in the sustainable development of naturalresources if strong links among the institutions are established. Enlargement and integration amongsocial groups and NGOs is needed so Angola can have strong institutional capacity building.
6.4. Sustainable forest management
As mentioned above, there is no forest management in the country, however, this need has beenidentified within the framework of several forestry sector programmes. In order to improve themanagement of forest and natural resources in Angola, attention should be paid to the followingaspects:
Management of production and distribution of firewood and charcoal;Management of forest resources in pasture areas;Management of productive forests and plantations;Management of protected areas; andForest and natural resource planning.
6.5. Biodiversity and ecosystem sustainability
Angola has great biodiversity. Its imense territory and variability of physioclimatic zones offer thecountry a large variety of plants and wildlife spp. According to IUCN estimates there are 8,000 plantspp., of which 1,260 are classified as endemic; 275 mammals of which 20 are endemic and 900birds.

ANGOLA COUNTRY REPORT
WORKSHOP PROCEEDINGS FORESTRY STATISTICS – MUTARE, ZIMBABWE (30 Nov. – 4 Dec. 1998)
61
To ensure Ecosystem sustainability of Angola’s biodiversity the following strategic actions sould beimplemented:
Conservation of biodiversity & protection of habitats in critical ecological areas;Conservation of endangered phytogenetic resources;Control of exploitation of forest resources and degradation of forestry areas;Management of soil fertility and erosion control;Roundwood and wood energy supply; andDecreasing of environmental impacts in fragile ecologic zones.
Based on an IUCN Study in 1992, there is a need to enlarge Angola’s protected area by creating 10integrated forest reserves, 6 regional parks and 10 natural monuments.
It is interesting to note that only Biome of Karoo-Namibe and Zambezi are represented as protectedareas, while the Guinea-Congolese representing the Rain forest in the northern part of the country,where large mammals are predominant, such as gorillas, retain non-protected areas status.
6.6. Soil and water conservation
Information on soil and water conservation and the level of degradation is scarce. However, thereare indications of the level of degradation of soil in the central zone becasue the area is has highagriculture potential. Intensive soil use, wild fire for clearing and growing crop, pasture and otheractivities contribute to high soil erosion in the region. These problems are also becoming commonin the eastern part of the country, where hundreds of hectares are being degradated, as well in thecoastal zone of the country, according to an 1992 IUCN Report. There are no efficient measuresbeing taken to minimise the problem, however, to guarantee soil productivities, farmers areconstructing terraces. Water degradation is high and no management plan to reverse the waterresource situation exists.
6.7. Taxation
The Government has created a national taxation system for almost all resources, but itsimplementation is still in review. Many agents exercising different kinds of activities can escapetaxation easily and corruption is another negative contributing.
Inflation is very high due to the Government’s inability update its taxation system on a timely basis.This envolves other institutions, including Parliament, for approval. These procedures require a lotof time and the Government moves slowly in solving issues related to taxation.
6.8. Indigenous people’s issues
Currently there are a range of problems presented by the society as a whole, and the capacity ofadressing to these problems is a very serious limitation of the Government, considerating thepolitical state of the country.
Indeed, the Government should prioritise the basic needs of the majority of the population ofcountry, mainly those who are living in the rural areas, where enormous problems related to theirsurvival continue without solutions.

ANGOLA COUNTRY REPORT
WORKSHOP PROCEEDINGS FORESTRY STATISTICS – MUTARE, ZIMBABWE (30 Nov. – 4 Dec. 1998)
62
The problems indigenous people face are as follow:
Threatened food security, once production shortfalls are translated into shortages in consumption;Shortage of fuelwood supply, since most families in certain rural areas cannot have three basic dailymeals;Shortage of wood for multiple use;Land scarcity for growing crops, associated with the lack of fertilizer especially in the Central partof the country.Lack of incentives;Weak support from Government institutions responsible for adressing indigenous people issues;After highly destuctive civil war, rural smallholders are now in a situation of descapitalisation;Displacement and ressetlement of most rural people; andThe political instability affecting the larger part of the population.
7. THE OUTLOOK FOR FOREST RESOURCES
7.1. Projected demand
The forestry sector is operating under its capacity and this is due to many factors, i.e. the lack ofskilled personnel at all levels, enabling the planning of forest resources to assess the real quantity offorest products consumed, and lack forest inventory. Projected demand can be made based onavailable data considered as standard for the country having similarities in terms of forest resourceslike Angola, such as Zambia and probably The Democratic Republic of Congo.
7.2. Projected supply under various scenarios and assumptions
This aspect is linked to the previous in that the results expected from the sector are possible only byconducting an assessment study. A study was done in this context, almost ten years ago. It is evidentthat the situation at that particular time was very different and it has not been possible to conduct afield study to have a clear picture of projected demand and supply.
Some Indicators Forest Data (projections)
Province WPM3
AACM3
Consump. M3
C. p.cap. M3
Ind. PC.M3
ExcedentM3
DeficitM3

ANGOLA COUNTRY REPORT
WORKSHOP PROCEEDINGS FORESTRY STATISTICS – MUTARE, ZIMBABWE (30 Nov. – 4 Dec. 1998)
63
BengoBenguelaBiéCabindaCuneneHuamboHuilaKuando KubangoKwanza NorteKwanza SulLuandaLunda NorteLunda SulMalangeMoxicoNamibeUigeZaire
TOTAL
10,2507503,000112,2504,00003,2505,25026,7508,000031,75010,25012,00016,000070,25012,250
326,000
10,4118463,113112,3094,1026383,4975,41626,9648,133031,90916,09012,1493,11343170,11212,346
329,128
4,27523,14523,41032,6203,905331,80022,1354,17515,48023,54057,7857,4158,90020,5959,2402,53519,6801,930
312,565
0.040.040.030.050.030.030.030.030.040.040.050.050.040.030.040.030.040.04
0.044
1731242916013218632110127414864022728
1,304
5,975
79,730
1,07511,270
24,3851,350
6,780
50,57010,320
191,380
22,39520,410
3,16631,80018,885
15,54057,785
8,595
2,585
177,947WP: Roundwood production, AAC: Annual Allowable Cut, C.p.cap: Consumption per capita, Ind. P.C: Industry ProcessingCapacity
8. CONCLUSIONS
Angola is one of the countries in Africa, perhaps the only country, where a forest policy is notestablished. The sector has been operating with colonial forestry and wildlife regulations in variousgovernment domains. Even in some updated cases, like forestry, the country’s real needs are notreflected in policy establishment because relevant aspects are not taken into consideration. The lackof participation of other sectors related to forestry and natural resources is another crucial aspect ofthe lacking forest policy of Angola.
The national forestry sector is still weak in terms of resources of all types to develop. The fact that alarge sector like forestry is under the MoA and is always in last position of ranking within theinstitution in terms of priorities makes it evident that the governmnet does not consider forestry animportant sector for sustainable development.
There is no possible development in Angola when there is no planning and no planning is possiblewhen the sector cannot quantify the forest resources. The lack of forest inventory, associated withthe lack of resources, mainly the skilled personnel in management and administration of forestresources to conduct relevant studies in collection, processing, storage and dissemination of data isand will remain the primary cause of the problem.
The sector has not developed an appropriate network of data collection within the forestry sectoritself and in the country. The mechanisms used are very weak and inconsitent. As a result, dataavailability continues to be a major constraint.
Another fact is that there are no operational links between the sector and other institutions, i.e.government, private, NGOs and the society, direct or indirectly considered as potential users offorest resources and data.
REFERENCES

ANGOLA COUNTRY REPORT
WORKSHOP PROCEEDINGS FORESTRY STATISTICS – MUTARE, ZIMBABWE (30 Nov. – 4 Dec. 1998)
64
Commission of the European Communities. 1993. Project Cycle Management Integrated Approachand Logical Framwork. Brussels.European Union. 1996. Guidelines for Forest Sector Devolpment Co-operation. Forest inSustainable Development. Volume 1. Strategic approach. Luxemburg.FAO. 1985. Plan d’Action Forestier Tropical. Comité de la Mise en Valeur des Forêts dans lesTropiques. 182 pp. Rome.FAO. 1995. Programmes d’Action Forestiers Nationaux. PAFAN. Actualisation. 32.FAO. 1981. Tropical Forest Resources Assessment Project (in the frawork of GEMS). ForestResources of Tropical Africa. Part II. Country Briefs. Rome.Instituto de Desenvolvimento Florestal. 1992. Plano Nacional de Investigacão Florestal. 46 pp.Instituto de Desenvolvimento Florestal. 1994. Banco Mundial Prege. Informe de la Mission deConsultoria para el Sector Florestal. 72 pp. Luanda.Instituto de Desenvolvimento Florestal. 1994. Lineamento generales sobre una Política y Estrategiapara el Sector florestal. Workshop sobre a Revitalizacão do Sector florestal e sua contribuicão aoDesenvolvimento nacional. Documento de trabalho. Luanda.Mellington A. and Townsend J. 1989. Biomass Assessment. Woody Biomass in the SADC region.A study commissioned by the SADC Energy Secretariat and carried out by ETC Foundation. (Consultants foe Development). London.MINADER. 1996. Agricultural Recovery and Deveolpment Options Review. Volumes II, III and IVof V: Working papers. Contribucão do Sector Florestal no Desenvolvimento rural.Scot Conseil. 1996. Final report. Regional Vegetation Project. SADC Appraisal mission formapping. Commission of the European Communities Delegation in the Republic of Malawi. Studycontract no ET57.Zola, A., 1998. European Commission/Angola Forest Sector Cooperation Strategy. 57 pp. Geneva.

BOTSWANA COUNTRY REPORT
WORKSHOP PROCEEDINGS FORESTRY STATISTICS – MUTARE, ZIMBABWE (30 Nov. – 4 Dec. 1998)
65
FORESTRY DATA ON BOTSWANA
byK. K. KeapoletsweMinistry of AgriculturePrivate Bag 003, Gaborone, Botswana
1. INTRODUCTION
1.1. Description of the country
Botswana is a landlocked country situated in southern Africa, sharing common borders with Zambia,Zimbabwe, South Africa and Namibia. The total land area of the country is 581,730 km2. A flat terrainwith little surface water characterises. Kalahari sands cover about 84% of the country. The averagealtitude is 950 m above sea level. The climate is tropical in the north and sub-tropical in the south. Rainfalls in summer between October and April. Mean annual rainfall is about 450 mm, with the highest levelof 650 mm occurring in the extreme north-eastern tip of the country and the lowest of about 200-mm insouth western tip. The average temperature is 240c, but during the summer it can rise to over 40oC andwinter temperature can fall below freezing point at night. Long periods of below average rainfallinterspersed with periods of above average rainfall in an approximate 20-year cycle.
The country's population is estimated at 1.3 million (1991 census) with a 3.5% growth rate. Botswana hasa diverse range of natural resources, which include minerals such as diamonds, copper, nickel, manganese,some gold, coal, soda ash and semi- precious stones and other minerals. The vegetation type is opensavannah woodland capable of supporting large numbers of wild and domestic animals. Major surfacewater is found in the north within the Okavango Delta system and Chobe. Main exports are diamonds,copper-nickel, beef, soda ash, textiles and vehicles.
1.2. Economy and economic policy
Botswana has a free market economy and it is one of the fastest growing economies in Africa. Thediscovery of diamonds after independence drastically changed the country's picture from one of thepoorest in Africa to one of the most progressive. Other major sources of foreign revenues are beef, copper-nickel, vehicles and recently tourism. Careful spending, creation of attractive conditions to foreigninvestors, diversification, sustainable management of natural resources, and human resource developmentwere recognised as the basis for the good economy by the government’s 8th National Development Plan.Much has been done to improve social services everywhere and infrastructure development. The problemof unemployment in both urban and rural areas still persists.
1.3. Political situation

BOTSWANA COUNTRY REPORT
WORKSHOP PROCEEDINGS FORESTRY STATISTICS – MUTARE, ZIMBABWE (30 Nov. – 4 Dec. 1998)
66
Politically the country is considered to be one of the most stable in Africa. Botswana has about 10 politicalparties, with general elections every 5 years. The ruling party, Botswana Democratic Party has been inpower since independence in 1966.
2. SOCIAL AND HUMAN CONTEXT FOR FORESTRY
Trees and forests in Botswana are considered an important national resource because of the numerousproducts and services they provide. In this semi-arid country natural woodlands are vital to the lives of theurban and rural population since there are no major man-made plantations that could support them. Thesewoodlands are major sources of building materials, fencing poles for arable lands, ranches, kraals,compounds, fuelwood, food and medicines. The woodlands support a wide range of biological diversity offlora and fauna, and are important for environmental protection.
As the population increases, the demand of various woodland products also increases. This trend causeslocalised shortages of forest resources, deforestation as well as degradation of land around settlements.These problems are clearly recognised by the government, hence the need for sustainable management offorest resources. Sustainable forest management is the management and the use of forests and woodedlands in a way, and at a rate, that maintain their bio-diversity and potential to fulfil, now and in the future,relevant ecological, economic and social functions, at local, national, and global levels, without causingany damage to other ecosystems (EC Council Regulations).
Traditional methods of attempting to manage these resources in a sustainable manner existed in the past inmany parts of the country. Traditional chiefs protected many species threatened by extinction and somelocal beliefs also prevented over exploitation of some species. Tribal chiefs in villages regulatedharvesting of forest resources. The traditional methods of managing resources collapsed afterindependence when landlords were established and empowered to control land. Currently somecommunities are beginning to realise the long-term impact of excessive harvesting of forest resources intheir respective villages or districts.
Recently Tati District villages banned any form of cutting trees without permission from relevant localauthorities. People from outside the district are prohibited to collect fuelwood or poles. Kgatleng Districtalso imposed a complete ban on fuelwood collection by Government Departments, while KwenengDistrict is collecting levies on fuelwood traders. In Chobe local communities agreed to the exploitation oftimber in the local reserves on conditions that 50% of the royalty fees paid by companies exploiting timberis spent on local development activities.
These restrictions on exploitation of forest resources declared by local communities may reduce depletionof these resources while promoting the use of substitutes. It also indicates that local communities can playa very important role in managing their resources without much support from government institutions.
Where initiatives by local people who have a sense of ownership and responsibility of their resourcesshow willingness to conserve and manage resources carefully, institutional support does not interfere withtheir plans. Participation of stake-holders in management of forest resources is be encouraged.

BOTSWANA COUNTRY REPORT
WORKSHOP PROCEEDINGS FORESTRY STATISTICS – MUTARE, ZIMBABWE (30 Nov. – 4 Dec. 1998)
67
BOTSWANA COUNTRY REPORT
WORKSHOP PROCEEDINGS FORESTRY STATISTICS – MUTARE, ZIMBABWE (30 Nov. – 4 Dec. 1998)
68
3. FOREST RESOURCES
3.1. Land ownership
There are basically three types of land tenure in Botswana:
Freehold: land owned by individuals or group who have exclusive rights or control over its use and theland can be transferred from one owner to another without obtaining permission from the state. It is 5% ofthe total land area of Botswana.Tribal: different tribes throughout the country own land and its administration is through the Tribal LandBoard under the authority of the Land Act. This land covers 71% of the country.State: this type constitutes 24% of Botswana and it is owned by the state and is used at present in anumber of ways.Communal grazing for certain areas;National needs such as National parks and Forests; andLeasehold rights are given to individuals or groups over certain fenced areas.
3.2. Land use
Land in Botswana is extensively used in enterprises such as cattle and large scale arable farming. Besidesagriculture, land is needed for uses such as industries and wildlife. The following are the main needs forthe land:
National needs: public transport system, roads, railways and airports; urban areas and the developmentof new towns; industrial uses such as mining and areas concerned with the national heritage. Land forthese needs is 1% of the country.Agricultural needs: these are arable lands used for growing crops to sustain the population as well asgrazing areas for the livestock industry. They cover about 79% of total land area.Conservation needs: about 20% of Botswana are specified as areas for protection of natural resources offlora and fauna.
3.3. Natural forest resources
Natural woodlands and forests in Botswana account for about 93% of the total land area of 581,730 km2.However, it is only about 0.5% of the total area that is reserved for forest management. There are 6 forestreserves with a total area of 455,000 ha. in Chobe District. The reserves consist predominantly of Miombowoodlands, in which Mukusi (Baikiaea Plurijuga) and Mukwa (Pterocarpus Angolensis) dominate.
Chobe Forest Reserves are the only areas in Botswana where forest resource inventories have beenundertaken through a project funded by NORAD between 1991 and 1992. The main objective of thisinventory is to provide a management plan for sustained industrial timber production and exploitation aswell as providing information on the multipurpose utilisation to satisfy local needs of forest products,protection and conservation of wildlife and flora.

BOTSWANA COUNTRY REPORT
WORKSHOP PROCEEDINGS FORESTRY STATISTICS – MUTARE, ZIMBABWE (30 Nov. – 4 Dec. 1998)
69
The results of the inventory estimated the standing volume of all species to a minimum diameter of 5 cmat 10.4 million m3 in the 6 reserves. Total volume of primary commercial species Pterocarpus Angolensisand Baikiaea Pluriguga were 8% and 46% respectively. The project recommended monitoring of thesereserves to assess their status in the future by measuring permanent sample plots after every 5 years. Veryfew of these plots were measured in 1996, but the results indicated a negative growth rate. The poorgrowth rate is attributed to wild fires and the increase of elephant population. Initial inventory resultsshowed that elephants destroyed 18% of Mukwa in all reserves.
3.4. Planted forest resources
Total plantation area is estimated at about 1,200 ha. in the country. This comprises government andprivate woodlots, which are 85% and 15% respectively, the above-mentioned area. Woodlots were plantedmainly with Eucalyptus species of unknown provenance. Data on production levels of these woodlots islacking; hence it is impossible to reveal their status. Tietema (1986) estimated the yields of one of largestwoodlots in Molepolole at 1.46 t/ha/year. It was concluded that this production is similar to that ofunattended savannah woodland. It has been suggested that some indigenous species, which are moredrought tolerant, could be more productive than exotic species such as Eucalyptus.
4. FOREST PRODUCTS PRODUCTION, TRADE & CONSUMPTION
Exports of forest products in Botswana have not been recorded for many years. Since the suspension oftimber exploitation in 1990 around Chobe and Nata State Land, where companies there were harvestingtimber from a couple of timber concession areas and forest reserves and exporting round logs and sawntimber to Zimbabwe and South Africa, there has never been any formal export of forest products.Botswana relies on imports for nearly all-industrial forest products, and these are imported from theneighbouring states and overseas countries.
4.1. Woodfuels and wood energy
In Botswana fuelwood is a major source of energy for many households. Kronen (1989) revealed that 68%of the urban population uses woodfuels and in rural areas almost 100% of the dwellers rely on them,hence wood energy is considered an important resource in the energy sector of this country. BotswanaEnergy Master Plan (1986) estimated the annual consumption of firewood at 484,000 tons per annum. Theimportance of fuelwood as a source of energy for both urban and major settlements has promoted the tradeof the resource between these centres and rural dwellers (Kgathi 1984). The trade is considered to be asource of income for many poor rural communities and it is used to supplement low agriculturalproductivity.
4.2. Wood supplies from non-forest areas
Wood supply sources are natural woodlands outside forest reserves and man-made plantations.Information on other supply sources is lacking, as there are insignificant tree planting activities going onin villages around the country.

BOTSWANA COUNTRY REPORT
WORKSHOP PROCEEDINGS FORESTRY STATISTICS – MUTARE, ZIMBABWE (30 Nov. – 4 Dec. 1998)
70
4.3. Non-wood forest products (NWFP)
The country’s non-wood forest products are essential for the well being of a majority of the populationand vital to local economies and environment. These resources support rural families because they havedirect access to them. Common NWFPs include food plants; forage that support livestock industry;handicrafts; medicinal plants; fibres and wildlife species. The basketry industry around Okavango Delta inNgamiland and harvesting of mophane worms in north-east and Central Districts generate income formany families. The products attract both local and international markets.
4.4. Recreation and tourism
Botswana is becoming one of the most attractive destinations to tourists coming to southern Africabecause of it’s diverse and abundant wildlife resources which are primarily supported by the naturalforests. Forests in northern Botswana are a home of more that 90,000 elephants.
4.5. Recycling and other re-use of fibre
Recycling facilities for any waste forest products have not yet been set up in Botswana. There is also lackof data of available regarding waste materials that could be recycled.
5. FOREST POLICIES, LEGISLATION AND INSTITUTIONS
The country does not have a national forest policy, the existing legislation is enshrined in the forest act of1968 which was designed for protection and administration of the forest reserves in the Chobe District.Botswana is now in the process of formulating a new national forest policy that will be coherent withpolicy, legal and institutional framework.
5.1. Forest management law and policy
The new proposed forest policy will cover the whole country and it’s objectives clearly stipulateconservation and development of forest resources by taking into account other policies which have animpact on forestry. It also emphasises involvement of public and private sectors in the development offorestry.
5.2. Institutional strengthening and capacity building
The new policy defines the roles and mandate the administrative and functional structures of allstakeholders in forestry. Stakeholders include Government and non-governmental institutions; privatesectors; and local or traditional institutions. The Government already recognises the role of NGOs inthe development of the forestry sector. NGO’s involved in forestry related research activities andtraining are receiving financial support from the Government. There are programs and schemes thathave been designed to assist individuals or groups with materials and financial resources who ventureinto forestry businesses, the most common being the Financial Assistance Program.

BOTSWANA COUNTRY REPORT
WORKSHOP PROCEEDINGS FORESTRY STATISTICS – MUTARE, ZIMBABWE (30 Nov. – 4 Dec. 1998)
71
Efforts to strengthen the capacity of the forestry sector started nearly 10 years ago when the Departmentof Crop Production and Forestry gave manpower development. Training of locals at various levels wasundertaken by sending serving officers for advanced training and a local forestry training institutionwas established hence the manpower level increased several times from 14 trained staff to about 60 thisyear.
5.3. Environmental ISSUES
Botswana is addressing critical and diverse environmental issues as reflected by ratifying internationalconventions such as the Convention on Desertification, the Convention on Biological Diversity, theConvention on Wetlands. Sustainable forest management issues are clearly reflected in the proposednew forest policy.
5.4. The outlook for forest resources
Forestry inventories for the country’s forest resources have been conducted in isolated areas and on anirregular basis, leading to a situation where little is known about the present uses of resources hencemaking it difficult for projection of demand and supply of most resources.
6. CONCLUSION
It is quite evident that the forestry sector in Botswana does not have any data that could guide themanagement in planning various forestry activities especially management of natural woodlands resourcesas well as in the few established woodlots. There is a need for the forestry sector to strengthen its capacityin collection and analysis of forestry data. It is impossible for any form of forest management to take placewithout knowledge of the quantity and quality of these resources. Despite the fact that Chobe ForestryInventory Project provided useful information in an area that is about 0.5% of the total land area ofBotswana, it will not be easy to produce forest management plans for the rest of the country. If areasalready covered by the last inventory project are not properly monitored it will be difficult to know of anychanges taking place in the Chobe Forest Reserves.
There is visual evidence of fast depletion of forest resource in many highly populated areas of Botswanaalthough very little is known about the quantity and quality lost annually.
It is possible for the forestry sector in Botswana to establish a permanent unit, which will be responsiblefor data collection and analysis of forest resources. To set up this unit services of consultants who willtrain local technical and professional are recommended. Facilities for training purposes are alreadyavailable within the MoA.
REFERENCES
Botswana Energy Master Plan Report (1987) Ministry of Mineral Resources and water affairs.Forestry protection and Development Project (1997) Final Report.Field D.I., (1978) Basic Ecology for Range Management in Botswana.

BOTSWANA COUNTRY REPORT
WORKSHOP PROCEEDINGS FORESTRY STATISTICS – MUTARE, ZIMBABWE (30 Nov. – 4 Dec. 1998)
72
Kgathi D.L, (1984) Firewood Trade between Botswana’s Kweneng and Urban Gaborone: EmploymentCreation and Deforestation; FAB Journal 1984.Kronen M, (1989) Biomass and Woodfuel Techniques.Tietema T.; Merkesdal E.; Kgafela S. & Maembolwa J., (1986). The Productivity of EucalyptusPlantations in Botswana: the case of the Molepolole Airstrip Plantation. FAB Journal 1986 –1987.

LESOTHO COUNTRY REPORT
WORKSHOP PROCEEDINGS FORESTRY STATISTICS – MUTARE, ZIMBABWE (30 Nov. – 4 Dec. 1998)
73
FORESTRY DATA ON LESOTHO
byElias S. SEKALELISenior Forestry Officer, PlanningForestry DivisionDepartment of Forestry, Conservation and Land Use PlanningP O Box 774, Maseru 100 - Lesotho
1. INTRODUCTION
1.1. Geography and climate
Lesotho is a landlocked country entirely surrounded by the Republic of South Africa. The total landarea is 30,355 km2 and the country is predominantly mountainous with approximately 73% of landover 2,000 m altitude. Four broad geographic zones are distinguished (see table) and the landformsoil. Climatic and vegetation characteristics of these zones largely determine their land use.
Geographic Zones
Zone Area (km) Area (%) Attitude (m)Mountains 19.730 65 2200-3500Foothills 2.430 8 1800-2200Lowlands 5,760 19 1400-1800Senqu Valley 2.430 8 1400-1800Source: Lesotho National forestry Action Programme (after May, 1994)2
The main agricultural land-uses are maize, sorghum, beans, peas and wheat (in the lowlands) andgrazing (in the mountains and the foothills). The range-land accounts for over 60% of the country’sland use while the cropland covers only 25% of the land.
The mountains ranges have a general north-south orientation and consist of rolling to hilly terrainoften exceeding 3,000m altitude, dissected by the deep valleys of the Senqu river and its tributaries.The western edge of the zone is characterised by a steep escarpment cut by deep valleys. The basaltderived soils of the plateaux and slopes are dark coloured and relatively well structured and fertile.Sheetwash and erosion is common, particularly on overgrazed range and cultivated land.
The foothills are a transitional zone of land with dominantly moderate slopes, and outlying hills.Yellowish red soils derived from sand-stones are dominant. with some black, basaltic, soils.
The lowlands comprise dominantly gently sloping plains interrupted by raised sandstone plateauxbounded by steep sandstone escarpments. The soils, which are derived from sand-stones and shales, 2 The areas quoted here differ from those in the Sectoral Round Table Discussion Paper (MoA, March 1996). Neither report has amap showing area boundaries which would enable an area check to be carried out. As the figures in NFAP have defined altitudinallimits, they are regarded as being more reliable.
LESOTHO COUNTRY REPORT
WORKSHOP PROCEEDINGS FORESTRY STATISTICS – MUTARE, ZIMBABWE (30 Nov. – 4 Dec. 1998)
74
are variable but are generally of low chemical fertility and poor structure (NFAP GOL, 1996). Thelowland area is particularly prone to erosion which is exacerbated by long term inappropriate landuse, Gullies or 'dongas' which are a prominent feature of the landscape.
The Senqu valley is characterised by a gently sloping alluvial plain and steep side-slopes.
Lesotho has a cool sub-tropical climate with summer rainfall (at least 75% of rainfalls betweenOctober and March for most stations). Temperature is mainly determined by altitude. The meanannual minima vary from 11°C at 1,750 m to 4°C at 3,000 m (Berding 1984). Extreme minima areas low as 20°C in the mountains. Mean annual precipitation varies from 600 mm in the far westernlowlands to more than 1,100 mm in the eastern highlands. Although the Senqu Valley lays in therain-shadow of the Maluti mountains it is significantly drier with an annual total of 500-600 mm.
1.2. Economic background
Preliminary estimates indicate that the economic activity has finally resumed its long-run rate ofgrowth following three years of economic boom. Real GDP which grew by 12.7 percent in 1996,has slowed down to 3.5 percent.
Employment and Wages: Comprehensive data on employment which was last collected in 1985 /86 through a Labour Force Survey and 1986 Population Census continue to be the basis forestimates of the current labour market statistics. A recent population census was conducted in 1996but the results are yet published. Available data on the employment situation in Lesotho is mainlyfor the formal sector and this makes it impossible to estimate the rate of unemployment or underemployment. The Government remains the largest employer in the formal sector in Lesotho (9%).At the end of 1997, the number of people employed by the government was 34 880. This was anincrease of 3.9 percent compared to the l996 figure of 33 485. This comprises the civil servants,teachers daily paid workers and armed forces. The Lesotho National Development Co-operation(INDC) is the second employer in the formal sector. In 1996, employment generated by LNDCassisted firms was estimated at 17 023. 15% of the workforce works as migrant workers in SouthAfrica. The rest of the labour force either is unemployed or engaged in subsistence agriculture.About half of the population lives below the poverty line
Tax Collection: As a percentage of GNP, total receipts are projected to increase from 39.7 percentin the previous fiscal year to 42.2 percent during the review period. This trend emanates from theGovernment's on-going policy of improving revenue collection.
Prices: Price movements in Lesotho are greatly influenced by price developments in South Africa.Annual inflation rate in South Africa ended the year at 6.1% and given the almost parallelmovement of prices in the two countries. Lesotho's inflation rate is expected to remain in the singledigit in 1998. Also, if the good rains experienced during early January and mid-February continue insubsequent months, then the inflation rate is expected to decline even further as food prices areexpected to drop. Food indices were affected by the rise in prices of staple food (maize meal,sorghum, jungle oats).
Economic Policy: The policy of the Government of Lesotho through actions consistent with otherpolicies and development goals is to ensure that optimal conditions are created so that the followingare adequately addressed:

LESOTHO COUNTRY REPORT
WORKSHOP PROCEEDINGS FORESTRY STATISTICS – MUTARE, ZIMBABWE (30 Nov. – 4 Dec. 1998)
75
sustainable human development with a focus on poverty reduction,appropriate roles for the public and private sectors,public participation in developmentgender issues,regional economic co-operation,public finance, anddevelopment of the financial sector and disaster management.
1.3. Social and human context for forestry
This report is putting the Lesotho Forestry Division's position into perspective. It cannot be overemphasised that there is usually a very great difference in how the “need” for trees is perceived byindividuals living in rural Lesotho, and how this "need" is perceived by officials and Donor AgencyRepresentatives.
Among officials, perceptions on forestry have ranged from:
“Lesotho is virtually treeless and it is obvious that rural Lesotho needs very large numbers of treesfor cooking food, constructing houses and keeping warm in winter”; to:”Lesotho has always been virtually treeless and, as a result it has developed traditional lifestyleswhich do not involve a major need for trees".
Those officials who have advanced the second case have asserted the fact that Lesotho has neverhad significant numbers of wild, indigenous trees and that its overall environment is simply notsuitable for growing trees successfully.
The extent to which additional trees are required for produce is not only determined by the numbers,accessibility, rates of growth and sustainability of existing trees but also by the perceptions of theeffort and costs involved in growing the additional trees and of the attractiveness of alternatives. Inthis regard, it has to be kept in mind that no determination has ever been made of the number,accessibility, rates of growth and sustainability of existing trees and shrubs nation-wide or in anyarea in Lesotho.
The policy statement of the Department of Conservation forestry and Land use Planning (DCFL)stresses that the role of Government is to support local people in beneficially managing their ownnatural resources. DCFL’s policy expands to the concept of food security to include food and fuelwhich covers the following specific needs:
conserve productive land,rehabilitate degraded land and conserve water resources,use land appropriately, and plan its use. andincrease the contribution of trees to livelihood security and environmental protection.
The MoA policy objective of food security can be expanded to include fuel security. The fuelwooddeficit at the household level is particularly serious in the mountains, which have the lowest treecover and which currently achieve much less forestry extension support than the lowland areas.With commitment to strengthen research and extension in the mountains there is an opportunity tomake a significant contribution to this policy goal. Women will particularly benefit from improvedaccess to fuelwood as the burden of carrying wood over long distances will be reduced.

LESOTHO COUNTRY REPORT
WORKSHOP PROCEEDINGS FORESTRY STATISTICS – MUTARE, ZIMBABWE (30 Nov. – 4 Dec. 1998)
76
People may be willing to plant trees, but often lack the resources to manage them efficiently andprofitably. Through enhanced training and extension efforts by the Forestry division and NGOs. anda reliable supply of seedlings, either from GOL or private nurseries, this opportunity may beexploited.
Similarly with the recognition that tree and livestock production are not necessarily incompatible,opportunities exist for the development of silvi-pastoral systems with controlled grazing andexclusion at key periods, such as when seedlings are becoming established.2. FORESTRY ACTIVITIES
The Forestry Division is currently engaged in activities in the fields of social forestry research, andutilisation and development.
The main thrust of the social forestry programme is directed through a GTZ supported project whichis active in the Districts of Maseru and Mafeteng. The programme supports farmers in tree plantingthrough training provision of tools (through credit loans) and apply of seedlings (free, within certainlimits). The project also supports selected farmers in the establishment of micro nurseries providinga subsidy covering 75°o of the costs of the inputs (up to Makoti 2.500). ''his subsidy is regarded as ameasure to launch the enterprise which should later be economically self supporting.
The main activity under forest research is the monitoring of permanent sample plots (IPSPs) whichare located in every woodlot in the country. The purpose is to monitor the performance of differenttree species at different sites. Information can be used to update recommendations on suitable treespecies for different areas and to construct tariff tables based on wood volume. Silvicultural trailsare being conducted and the Division maintains a national tree seed centre. The National Tree SeedCentre, which also falls within the Research Section and the district nurseries are important sourcesof planting material.
Forest utilisation activities will be scaled down with the proposed privatisation of woodlots). Aninventory of standing timber stocks in each of the reserves has been completed already Gol hasestablished a National Tree Planting day to promote awareness of the value of trees as sources offuel fruit and possible income, and for environmental protection. While this is a valuable initiative,the timing of the day in March is inappropriate as it may coincide with the onset of frosts,particularly in the mountain areas.
3. FOREST RESOURCES
3.1. Land ownership
Lesotho's traditional system of Land tenure is formerly defined within the laws of Lerotholi. Thelaws of Lerotholi are partly codified customary laws and partly regulations made by or at thedirection of the colonial government by Basutoland National Council from 1905 to 1959. TheLerotholi laws continue to be widely followed in the rural areas though most of them have beensuperseded by modern legislation.
Traditionally all land and associated rights to land use are voted: every Lesotho citizen is entitled tothree fields suitable for farming. If possible one of the fields would be of a better quality than the

LESOTHO COUNTRY REPORT
WORKSHOP PROCEEDINGS FORESTRY STATISTICS – MUTARE, ZIMBABWE (30 Nov. – 4 Dec. 1998)
77
other. Once allocated the fields are retained by the farmer for as long as he wishes. If however hefails to either cultivate them properly or completely fails to cultivate them for a period of two yearsthen in theory the fields can be repossessed and reallocated.
The system worked well as long as there was enough land to satisfy the demand. With populationincrease the system comes under pressure (Scnckane 1990). The first and the notable change wasthe introduction of the land Husbandry Act of 1969. In which the Minister of Agriculture receivesthe power to make regulations for improving the use of agricultural land and water resources. Itattempted to deal with a number of issues relating to the management of land. This act provided forthe delegation of power to the chiefs to enforce the regulations proclaimed by the Minister.
Forestry activities and the status of tree ownership are governed by the laws of Lerotholi and ForestAct of 1978. The latter however, was enacted mainly to support the development of woodlots ofForest Reserves and does not cater for ownership of trees by communities or individuals. A newForest Act was drafted in 1996 in response to the policy changes proposed in response to the policychanges proposed in the National Forestry Action Programme of 1996.
The draft forestry was discussed and agreed upon at a forestry workshop in Mohale's Hock in July -August 1996, but it has yet to he enacted by parliament. It places tree ownership in the lands of theindividual or group who planted the tree. It also empowers the Ministry of Agriculture through theChief Forestry Officer (CFO) to transfer ownership trees forest plantations or indigenous forest togroups or individuals for a specified period and subject to certain terms and conditions.
3.2. Natural vegetation
The natural vegetation of Lesotho is dominated by grassland and by indigenous shrubs in somemountain areas. Although the present vegetation is regarded as a sub-climax resulting from humaninterference and modification, it is unlikely that large areas of Lesotho were ever covered by forestor woodland in the recent past. However, some pockets of' closed evergreen forest in inaccessibleparts of the lowlands and foothills suggests that forest cover was previously more extensive than atpresent (NFAP; GOL 1996).
3.3. Planted forest resources
Much of the present woody biomass stocks in the country result from planted trees. In the inventorythat was carried out in 1993/94 there were still 10,362 ha of wood standing. In 1996/97 inventoryhowever, this area had been reduced to 8,173 ha which means that within a period of 4 years an areaof about 4,189 ha had been cut and not replanted. The purpose of the inventory was to estimate thearea still cover.
This substantial forest resource is targeted for privatisation which is expected to generate revenuefor communities and provide the opportunity for the woodlots to be managed in a more efficient andsustainable manner. The current distribution of woodlots by district is given below:
Distribution of Woodlots (SFRs)
District Stocked area(1995/96) (ha)
No.woodlots0-20 ha
No. woodlots21-50 ha
No.woodlots>50 ha
Totalwoodlots

LESOTHO COUNTRY REPORT
WORKSHOP PROCEEDINGS FORESTRY STATISTICS – MUTARE, ZIMBABWE (30 Nov. – 4 Dec. 1998)
78
Maseru 1619 89 22 3 114Berea 827 63 3 2 68Leribe 1799 55 14 7 76Butha-Buthe 513 15 4 1 20Mokhotlong 17 13 0 0 13Thaba-Tseka 50 15 0 0 15Qacha’s Nek 174 21 0 00 21Quthing 427 71 1 00 72Mohale’sHoek
290 40 10 1 51
Mafeeteng 457 31 6 0 37Total 6173 413 60 14 487Source Woodlot inventory carried out in 1995-96 by Forestry Division
4. FOREST PRODUCTS PRODUCTION, TRADE AND CONSUMPTION
At present wood is produced primarily for both fencing posts and fuelwood purposes. The annualproduction of posts is and fuel wood is sold through the following systems:
Wood Wholesaling: Here a forester measures and marks areas which are due for felling. Theretailers would then come in and buy the wood (standing) at the wholesale price. These retailers caneither be local individuals, communities or a business man who may not be a local person. Thishappens mainly in big woodlots which are far from villages.Retail System: In this approach a forester sells wood in small quantities i.e. head loads, van loads,ox drawn carts or single logs pulled by either oxen, a horse or a group of men). This is commonmainly in small woodlots adjacent to the villages.Government Sales Yards: Here the sales yards managers buy wood from the foresters in chargewhich they later haul to the sales yard where it is processed (either for the production of treatedposts or fuel wood).Non Wood Forest Products (NWFP): The NWFP commonly found in Lesotho are thatching grassand medical plants which is done at specific times of the year. All medicinal plants growing in theforest reserves are by law protected and may not be gathered at any time.
5. FORESTRY POLICIES, LEGISLATION AND INSTITUTIONS
5.1 Forest management and policy
Until recently, Lesotho had never had a formally approved policy for its forestry sectors. Despite theabsence of a legal policy document the government had always assumed the leading role in thedevelopment and maintenance of forest resources since 1876. This continues to be the case..
''he official National Forestry Policy was approved in 1997 and that marked a radical shift indirection by putting a strong emphasis on the role of communities in forestry management. In thispolicy the government has firmly committed itself to local ownership of forest resource and tomaximise the resource through actions consistent with other policies and development goals. Thestrategy adopted to approach these objectives is to focus support primarily at the village levelthrough supply of planting materials and appropriate extension and training in tree planting and

LESOTHO COUNTRY REPORT
WORKSHOP PROCEEDINGS FORESTRY STATISTICS – MUTARE, ZIMBABWE (30 Nov. – 4 Dec. 1998)
79
husbandry techniques.
The contributions forestry can make to the alleviation of poverty, livelihood security andenvironmental protection in Lesotho are the following:
Production and employmentPromotion and extensionEnvironment protection and bio-diversity conservationForest protection, management and people’s participationPublic awareness education and trainersForest researchGender issues in Forestry development
5.2. Guiding principles of the government
Commit to supporting the efforts and initiatives of local people to undertake tree and forestry relatedactivities to provide for their own needs and benefits.facilitate the tree planting and forestry endeavours of local people through:establishment of legal environment including security of land and tree tenure;provision of appropriate government services (research and extension).Primary responsibility for the sustainable and beneficial management of Natural resources and theenvironment lies with individual and communities.committed to the principle of free enterprise reflecting by permitting and supporting private sectordevelopment in all forestry activities.Committing to local ownership of forest reserves, including the existing areas of state forestreserves as gazetted under the 1978 Forest Act; In consultation with communities the governmentwill return the forest areas along with responsibility for their management and their benefits to thecommunities.commits to co-operation with NGO initiatives in forestry activities.
5.3. Legal frame work
Land in Lesotho traditionally belongs to the people as a whole. The King as Head of State is vestedwith the responsibility of allocating land on behalf of the nation.
The Land Act of 1979 grants village development councils (NDCs) the authority to administerallocation of arable lands to individuals by issuing a permit known as “Form C". In so doing, itguarantees exclusive rights licenses falling short of an officially registered title. The land regulationsof 1992 enable a 90 year lease to be taken out on land but this option is rarely applied to agriculturalholdings.
Forestry activities and the status of tree ownership are governed by the laws of Lerotholi and theForest Act of 1978. The latter, however, was enacted mainly to support the development ofwoodlots for ownership of tree by communities or individuals. A new Forestry Act was drafted in1996 in response to the policy changes prepared in the NFAP of 1996. This draft has already beensubmitted to the parliament for approved. It is hoped that by the end of December this bill wouldhave been enacted so that the prepared programmes may be implemented.

LESOTHO COUNTRY REPORT
WORKSHOP PROCEEDINGS FORESTRY STATISTICS – MUTARE, ZIMBABWE (30 Nov. – 4 Dec. 1998)
80
5.4. Investments in forestry and forest products
The 1978 Forest Act was not making it possible for companies to invest in Forestry because it wasmeant to support the development of woodlots or forest Reserves by either communities individualsor private organization. The present draft however paves way for the private sector to activelyinvolved.
5.5. Institutional strengthening
The Forestry Division is one of three divisions (Department of Conservation, Forestry, and LandUse Planning) within in the Ministry of Agriculture, Co-operatives and Land reclamation.
The Division has recently been restructured to reflect the major role of social forestry in thedivisional policy. There are four technical sections supported by units dealing with management andcartography.
The forestry Division has a complement of 11 technical professional posts (grade 6 and above), sixof which are vacant and three of which have been transferred, three senior administrative staff(grade 7-10 and 71 support personnel. The Division is headed by a Chief Forestry Officer whoreports to the Director of DCFL. The Principal Forestry Officer is currently acting in the Chief’sposition.
Superimposed on this structure are the three regional teams. These teams are organised atdepartmental level to coordinate delivery of technical backstopping and advisory services to thedistrict agricultural offices. Each professional forester is assigned to a regional team. A foresterheads the southern team. The other foresters are assigned between the central and northern teams.
The Division has a close functional linkage with the Soil Water and Nature Conservation Divisionwho use tree planting as a method for donga and gully rehabilitation. Tree planting activities alsofeature in the community land use planning (CLUP) carried out by the Land Use Planning Division.
5.6. Environmental issues
The management of forest is to date not sustainable. In the case of established woodlots there hasbeen continuously illegal felling over a period of 10 year since the woodlots were handed over to theGovernment. One of the many reasons for decline is that the government does not have the capacityin terms of personnel and capital to manage these forests. The reason why this is the case is thatalthough the total area is only 12, 900 ha it comprises many woodlots (about 487 in number)scattered over a wide area. In most cases there are no roads leading to some of these woodlots. Theproposed programme of handing over the management of these woodlots offers some hope for thesustainable management of these forests.
In the case of the individually and communally established forests the land tenure system, the lawsof Lerotholi and the Forest Act of 1978 were making it impossible for the local communities andindeed even private companies to establish and manage forests sustainably. The new- Act hashowever paved the way for the private organisations and local communities to establish their ownforests without any fear of using them at the later stage.
6. THE OUTLOOK FOR FOREST RESOURCES

LESOTHO COUNTRY REPORT
WORKSHOP PROCEEDINGS FORESTRY STATISTICS – MUTARE, ZIMBABWE (30 Nov. – 4 Dec. 1998)
81
6.1. Projected demand
The requirements for energy are expected to increase by around 74% in 20 years (from 28,700terajoules in 1990 to 50,125 terajoules in 2010). The most important sources of energy are firewoodand dung (LEMP, l991). If present rates of fuel consumption remain constant, potential ruralbiomass energy use will have risen to almost two million tons by 2010 which is 0.5 million tonsabove the estimates for sustainable supply. In order to close this energy gap it would he necessary toplant approximately 120 000 hectares of additional woodlots up to 2010.
These targets have, however, not been realised in the last 10 years. Instead, the indigenous shrub-land and present woodlots have been over used which has lead to increasing the energy gap.
The above analysis does not include any provision for tree planting to replace dung as fuel. In 2010it is estimated that 510,000 t of dung would be needed as combustibles (LEMP). To replace thisamount of dung with firewood 305,000 t of wood are necessary. To meet this wood requirement anadditional 64,000 hectares of forest must be estimated.
6.2. Projected supply
In order to address the above projected demand the Forestry Division in its position paper hasproposed the introduction of a BONUS system as indicated below: The two options are indicative.The districts of Maseru and Mafeteng have been used in the sampling because they are the only oneswith complete raw data available. Three important aspects are to be considered:
The extension service currently costs as much as the seedling production.Half of the cost (wages) are covered by the Government of Lesotho.The target group carries 18% of the costs, which are the costs for their work.
It is striking that the reduction of the costs in one section has only a small impact on the totalamount of expenditure e.g. Lowering the production costs by 50% (M 1,00 / seedling) reduces thetotal amount by 18%.
The survival rate is of overriding importance. It is a mathematical factor which has a serious impacton the costs: 50% losses doubles the total expenditure.
Bonus System: An alternative can he considered if the GoL is prepared to cover almost the entireproduction and planting costs. The following assumption serves as a basis:
The planting material of M0.80 seedling and transport costs of M0.30 / seedling are paid by theGoL.A bonus would be paid one year after tree planting if the survival rate of the plants is good. Thisamount, (incl. Seedlings, transport. bonus of M2.00/ seedling) would be paid to the farmer inparallel with the present seedling production costs in the government tree nurseries.The price seedlings (M0.80) is 60% higher than the present level set by government for seedlings inprivate nurseries (M0.50).The price of M0.80 could highly stimulate the establishment of private tree nurseries. Under suchframework conditions the major seedling production will be undertaken by privately owned treenurseries.

LESOTHO COUNTRY REPORT
WORKSHOP PROCEEDINGS FORESTRY STATISTICS – MUTARE, ZIMBABWE (30 Nov. – 4 Dec. 1998)
82
7. CONCLUSION
A lot of official studies and reports put a strong emphasis on the need to address the environmentalproblems and the energy requirements facing this country. Afforestation for environmentalprotection and fuel wood supply appear high in the list of strategies for addressing these problems.
The area which needs a lot of attention and official support is that of data collection and reporting. Itis very difficult to make sound management decisions if there is not enough data available. It is veryunfortunately that it has been very difficult to get reports from field foresters. Because of thisshort-coming it has not been possible to update FAO and other organisations’ records pertaining toforestry developments.
REFERENCES
Hall D. and Green T. 1989: Community Forestry in Lesotho: The People’s perspective.GOL, 1996: Lesotho National Forestry Action Programme.GOL, 1997: The Lesotho National Development Plan.GOL, 1997 / 98: The Lesotho Economic Background Paper.GOL, 1991: Lesotho Energy Market Plan.Sekaleli E. S. and 1997:Community Forestry in Lesotho: Possibilities and Constraints.Sekaleli E.S. and Cwielong P. 1998. Position Paper of the Forestry Division on present and futureProgrammes.Sekaleli E.T. 1996: Lesotho National Forestry Sector Cooperation Strategies.

MOZAMBIQUE COUNTRY REPORT
WORKSHOP PROCEEDINGS FORESTRY STATISTICS – MUTARE, ZIMBABWE (30 Nov. – 4 Dec. 1998)
83
STATUS AND USE OF FORESTRY STATISTICS IN MALAWI
bySam Kainja Kasizo ChiramboAssistant Director of ForestryForestry DepartmentP.O Box 30048, Malawi
1. ECONOMY AND ECONOMIC POLICY
Malawi is a landlocked country with an area of 118,580 km2. The population of the country isestimated to be 10 million with a growth rate of 3.2% per annum. More then 85% of the populationlive in the rural areas practising subsistence farming.
Malawi remains one of the poorest countries in the world with a per capita GDP of US $ 230 in1991 and over 60% of the population is living below the poverty line.
The economy of the country is heavily dependent on smallholder rain fed agriculture, which ishighly susceptible to the vagaries of weather. The structure of the economy has not changed muchover the years since the 1970s. Agriculture still dominates the economy with over 40% of the GrossDomestic Product (GDP), providing employment and subsistence for over 80% of the population,contributing 85% of export earnings. The industrial sector accounts for an average of 20%. Theservices sector accounts for 41%.
Malawi became a pluralistic state in 1993 after a referendum. The first multiparty presidential andparliamentary elections were held in 1994 with the United Democratic Front (UDF) emergingvictorious. The main opposition parties are the Malawi Congress Party (MCP) and the Alliance forDemocracy (AFORD).
2. SOCIAL AND HUMAN CONTEXT FOR FORESTRY
In Malawi, forests and trees meet the nation's requirements for fuelwood and poles and for most ofthe timber required for construction, joinery and board manufacture. Additionally, the existingplantations have the potential to meet the nations pulp and paper needs. The rural residents, whomake the majority of the population, rely to a large extent on forests for fuelwood, poles andmedicinal plants.
About 90% of the nation's energy requirements are satisfied by woodfuels derived from natural andplanted forests and trees on farm. The 1993 estimate of per capita city-residents fuelwoodconsumption was 2.0 m3 while 1.1m3 was the average per capita rural fuelwood consumption. Thepopulation growth rate is 3.2% resulting in increased pressure to cultivate forests and meet growingenergy requirements.
3. FOREST RESOURCES
3.1. Land ownership

MOZAMBIQUE COUNTRY REPORT
WORKSHOP PROCEEDINGS FORESTRY STATISTICS – MUTARE, ZIMBABWE (30 Nov. – 4 Dec. 1998)
84
Land ownership in Malawi can be classified into four categories.
Public land is basically owned by government and used for protection as well as agriculturalschemes. This land is set aside under the country’s Land Act for use by the government.Private/ Estate land is owned by individuals and companies after being leased from government.Private land is held as leasehold or freehold. This land is mostly used for growing tobacco and tea.Traditional authorities (chiefs) control customary land. The chiefs allocate land according totraditional customs. It is normally passed from generation to generation.Urban land belongs to the city and municipal councils. The legal system governs the activities onthese lands.
The bulk of the land is used for agriculture followed by protection for wildlife and forests.
3.2. Natural forest resources
The natural forests are composed of protected areas such as Forest and Wildlife Reserves. Most ofthe natural forests are found in hilly areas. The hilly areas constitute the protected areas thatrepresent half the remaining stocks of forest resources in Malawi. At the same time these areasmake up almost 20% of the country’s land area - land area which, regardless of suitability, has notbeen converted to agriculture. This is a result of the hilly areas being unsuitable for cultivation.
Forests on customary (flat) land are continuously being converted to agricultural land as a result ofpopulation increase. The forests are disappearing at the rate of 1.5 - 2% per annum. This is mainlydue to increased poverty and dependence on woodfuel for energy and expansion for agriculture.
3.3. Planted forest resources
Pine plantations dominate the planted forests. The pine plantations are mainly used for supply oflogs for timber sawing. The Eucalyptus plantations are used for the supply of firewood and poles forconstruction. Although the MAI has been estimated, in reality this estimation is not true due to thedestruction of the majority of the plantations by forest fires.
4. FOREST PRODUCTS PRODUCTION, TRADE AND CONSUMPTION
In Malawi, the timber industry’s present production of sawn timber is only around 45,000 m3
against an installed capacity of some 70,000 m3 (ignoring the pit-sawyers). Plywood production isaround 7,000 m3 with a similar production level for blockboard and around 6,500 m3 of other woodbased products – including gluelam.
Of the sawn timber, 65% is sold to the construction industry, 20% to the furniture and the rest ismainly used for packaging. Recent projections to the year 2010 have put the potential local marketat 80,000m3 with respect to sawn timber and 40 - 45,000m3 for timber panels.
According to the Forestry Department’s 1995 Wood Consumption figures, the formal industryconsumes 1,200,000 m3 of industrial roundwood or poles. The country does not produce paper orpaperboard. Malawi is having some success with exports of timber products, plywood, boardsand gluelam. These products are exported to the Republic of South Africa in particular.
5. OTHER FORESTRY PRODUCTS AND ROLES

MOZAMBIQUE COUNTRY REPORT
WORKSHOP PROCEEDINGS FORESTRY STATISTICS – MUTARE, ZIMBABWE (30 Nov. – 4 Dec. 1998)
85
5.1 Woodfuel and wood energy
Fuelwood is primarily produced to meet national consumption needs. About 90% of the country’senergy requirements are derived from both natural and plantation forests. To this end, thegovernment established 23,239 ha of eucalyptus plantations for the production of fuelwood andpoles. The bulk of the wood is obtained from common property resources on customary land forestsin addition to the wood from the fuelwood plantations. It was estimated in 1995 that about 11.7million m3 are consumed as woodfuel in the form of wood and charcoal for both domestic andindustrial purposes.
5.2. Non-wood forest products
Forests are a source of many non-wood forest products. These products include edible fungi(mushrooms), grass for thatching, medicinal plants, game, fruits, honey, insects, vegetables andother foods. Forests are also a habitat for a variety of fauna and flora.
5.3. Recreation and tourism
Apart from the supply of fuelwood and poles, forests play a vital indirect role in recreation andtourism. The forest reserves in Malawi provide high potential for recreation and tourism. To thisend some tourism facilities such as guesthouses have been erected in some forest reserves such asDzalayama and Ntchisi in the central region, Zomba in the Southern region and South Viphya in thenorthern region. According to the findings of PLUS 1998, forest reserves have the potential toattract 2,434 tourist per year with a potential revenue of US $ 145,635 per year (using Malawimultiplier US $ 60 per tourist).
6. FORESTRY POLICIES, LEGISLATION AND INSTITUTIONS
6.1 Forest management law and policy
The Malawi Forest Act was approved by Parliament in April 1997. The Act provides forparticipatory forestry, forest management, forestry research, forestry education, forest industries,protection and rehabilitation of environmentally fragile areas and international co-operation. TheAct also proposes the establishment of a Forest Development and Management Fund to be used bythe villagers to undertake forestry management activities.
However, the Act contains stiffer penalties for people who contravene the provisions of the Act. Thepunishments range from paying fines of MK 2,000 to MK20000 depending upon the seriousness ofthe offence. In the event that the culprit fails to pay the fines, penalties of about 1 to about 5 yearsimprisonment are meted out.
The Malawi Forestry Policy which was approved by the Cabinet in 1996 advocates participatorycommunity forestry. The goal of the policy is to sustain the national forest resources in order toincrease the quality of life of the people in the country through conservation the forest resources.
Both the Forest Act and Forest Policy calls for the involvement of the private and public sectors inthe management of the forest resources.

MOZAMBIQUE COUNTRY REPORT
WORKSHOP PROCEEDINGS FORESTRY STATISTICS – MUTARE, ZIMBABWE (30 Nov. – 4 Dec. 1998)
86
6.2. Investments in forestry and forestry products
The only investors in forestry are the tobacco and tea estates. These estates grow trees especiallyEucalyptus for curing their tobacco and tea. However, the noticeable investors in forest productsmanufacture VIPLY, Wood Industries Corporation (WICO) and International Timbers Limited(ITL). VIPLY is a state owned company manufacturing blockboards, plywood and sawn timber forexport and domestic consumption. WICO is a private company that produces both sawn timber andfurniture for export and local consumption. ITL is also a private company that makes gluelam,plywood and blockboards for export and domestic use.
6.3. Institutional strengthening and capacity building
The successful implementation of the new Policy and Law requires a cadre of well-trained staffequipped with many new skills. However, the Forestry Department (FD) does not have adequatestaff. Consequently, a massive effort has to be undertaken to reorient existing staff in participatoryapproaches and extension skills. The department needs to create additional extension capacity bybringing in NGOs.
Staff needs to be trained in technical aspects of forestry. Furthermore, the FD staffs need to improvetheir competence in the preparation of forest inventories and forest management plans from thenational level down to the village level.
Due to insufficient financial resources the FD is unable to conduct training for its staff. Training isdone by the FD and is solely dependent upon donor willingness to fund the department staff..
6.4. Environmental issues
The National Environmental Action Plan (NEAP) was adopted after a participatory process inDecember 1994. The NEAP identified the critical environmental issues facing Malawi and theactions to take to address the resource degradation. Among the issues identified was Degradation offorest resources, degradation of water resources, and climate change.
In February 1996, the National Environmental Policy (NEP) was developed. The policy seeksamong other things to:
Promote the efficient utilisation and management of natural resources; andPromote cooperation between the government and local communities, women’s groups, NGOs andthe private sector in the management of the environment.
The Environmental Management Act passed by parliament in June 1996 establishes the institutionaland legal framework for environmental management in Malawi.
6.5. Sustainable forest management
In an effort to manage the countries forests sustainably, the FD has embarked on empowering thecommunities to manage the forests and retaining part of the revenue realised from sale of the forestproducts. The communities capacity to manage the forests is built through training in differentaspects of forest management. The FD is also encouraging formation of Village Natural Resources

MOZAMBIQUE COUNTRY REPORT
WORKSHOP PROCEEDINGS FORESTRY STATISTICS – MUTARE, ZIMBABWE (30 Nov. – 4 Dec. 1998)
87
Committees (VNRCs) and creation of Village Forest Areas (VFAs).
Furthermore, the FD is reorienting its staff from the policing role to an extension & advisory role.The FD develops a comprehensive forestry extension service to promote and support large-scalecommunity forestry and joint management with the local communities and NGOs.
6.6. Biodiversity and ecosystem sustainability
Malawi’s biological diversity is very varied, in both terrestrial and aquatic habitants. Sixty-nineendemic plant species and an estimated 1000 endemic fish species have been identified (State of theEnvironment Report 1997). However, due to the pressures on all natural resources in the country,biological diversity is seriously threatened. Outside protected areas, the pressures from expansion ofagriculture production and unsustainable harvesting have already resulted inthe extinction of many species and loss of inhabitants.
A number of measures are already in place to address the threats to biodiversity. These includepublic awareness programs. As a party to a number of international conventions some of whichpromote conservation of biodiversity, Malawi has a political obligation to formulate policiesprotecting its biological diversity and in particular the many endemic species.
In order to protect and manage Malawi’s rich biodiversity in a sustainable manner, the governmentis promoting more viable income generating activities, in particular sustainable wildlife-basedenterprises, for communities neighbouring protected wildlife areas. Development andimplementation of policies and legislation that efficiently support effective land use planning inorder to promote the conservation and sustainable utilisation of biological diversity is being done.
6.7. Soil and water conservation
Soil erosion and declining land productivity continue to be the greatest environmental problem inMalawi. This is especially pronounced in densely populated areas which are heavily cultivated andwhere landlessness is a common socio-economic feature.
The government and its partner organisations have initiated several responses designed to meet theproblems. These include community based natural resources management initiatives and thedevelopment of innovative soil conservation technologies suitable for the country.
Malawi is rich in water resources that are stocked in its lakes, rivers and aquifers. All the water isreplenished by rainfall falling in catchment areas, on the surface of the water bodies and in rechargeareas for groundwater resources. In order to meet the demand for quality water in particular andenhance sustainability of the water resources in general, the government is addressing the majorproblems of unsuitable agricultural practices. It is also emphasising community awareness on theimportance of catchment protection to enhance the availability of water in the country’s rivers.
6.8. Indigenous people’s issues
Unlike other countries there are no indigenous people. The major problem facing the people is theneed for more land there by calling for the de-gazettment of some of the protected areas. This hasbeen exacerbated by the rapid population growth.

MOZAMBIQUE COUNTRY REPORT
WORKSHOP PROCEEDINGS FORESTRY STATISTICS – MUTARE, ZIMBABWE (30 Nov. – 4 Dec. 1998)
88
6.9. Outlook for forest resources
According to PLUS 1998, based on the official estimates of wood consumption from the FD, thedemand is increasing at the rate of 9.25% per year. The figure below shows the results of theanalysis of sustainable supply and demand evaluated over time with the assumption that the changesyear to year correspond to the rates available. The figure shows that sustainable supply will beexceeded by demand within the next three years. The pace of decline in sustainable supply fromforests exceeds that of the national supply due in part to clearing for cultivation. The national supplyis supplemented by the effect of fast-growing exotic trees on agricultural land and on governmentplantations. It is generally assumed that forest decline could reach a point that would dramaticallyimpact the annual yields of trees on agricultural land as alternative wood sources become scarce(PLUS 1998) The bulk of the demand is related to fuelwood.
7. CONCLUSION
Malawi’s forest resources play an important role in the lives of the people. They provide energy forcooking and heating and timber for construction. The forest resources are also a source of ediblefungi, thatch and medicinal products. They also provide protection for catchments.
Protected areas represent over half the remaining stocks of forest resources in Malawi. At the sametime these areas make up almost 20% of the country s land area. However, these protected areasface pressure from the people. There is increasing demand for land and the continuing demand forresources from the land. The demand for land is currently being assessed by the Land Policy ReformProgramme. The people are calling for de-gazettment of some of the protected areas.
The demand for wood resources is increasing as a result of the population increase. It is predictedthat demand for forest resources will exceed sustainable supply within the next three years.

MOZAMBIQUE COUNTRY REPORT
WORKSHOP PROCEEDINGS FORESTRY STATISTICS – MUTARE, ZIMBABWE (30 Nov. – 4 Dec. 1998)
89
FORESTRY DATA ON MOZAMBIQUE
byMaundrate Nakala OresteandCarla Cristina CuembaMinistry of AgricultureDirectorate of Forestry and WildlifeEconomics and Planing DepartmentMaputo, Mozambique
1. INTRODUCTION
1.2. Country profile
The Republic of Mozambique lies on the Southeast African coast and has a surface area of 799.380Km2 (Saket, 1994). It shares borders with six countries - Tanzania, Zambia, Malawi, Zimbabwe,Swaziland and South Africa.
The country is divided into 10 provinces, 128 districts, 387 administrative posts, and nearly 100towns, 23 of which are classified as cities. The eastern side of Mozambique is about 2,500Kilometres of Indian Ocean and many islands (Christie, 1996). The north and Northwest plateauxreach a height of 1,800 m. and the country’s highest mountain, Mt. Binga is 1,436 meters.
1.1. Macro-economic indicatorsMozambique, with over 16.5 million people (estimated in 1997), of which 7.8 million are men and8.7 million are women, and with a virtually untapped agricultural, mineral, forestry, tourism andenergy resources, has the potential to be among the world’s richest countries (INE, 97). The annualinterest rates to be paid for deposit accounts are around 40%.
A structural adjustment program was launched in 1987, since then the country has moved from acentrally planned economy to one that is based on a free market. The government has adopted theEconomic and Social Recovery Program for renewed economic growth and development by:
Prioritising the rehabilitation of vital economic sectors and infrastructures;Restoring output particularly for exports;Cutting governmental deficits and re-establishing financial equilibrium;Reducing direct state involvement in non-strategic areas of economic activity and production;Promoting efficiency in state enterprises and revising the private sector;Promoting re-establishment of commercial network and market distribution channels;Encouraging both national and foreign investment to play a larger role in economic developmentcountry.
Mozambique’s economy has been growing continuously, in real terms, since 1993 and long-termeconomic prospects are good. The country’s annual GNP per capita, estimated in 1993 was US $ 90,

MOZAMBIQUE COUNTRY REPORT
WORKSHOP PROCEEDINGS FORESTRY STATISTICS – MUTARE, ZIMBABWE (30 Nov. – 4 Dec. 1998)
90
but by mid-1996 the World Bank believed that GNP per capita had risen to between US$ 120 andUS$ 150 (Christie, 1996).
The economy grew 4.1% in 1995, 6% in 1996, and 6.1% in 1997. There was a sharp decrease ininflation: 54% in 1995, 16.6% in 1996 and 4.1% in 1997 (CPI; 1998). The exchange rate in July1997 was 1 USD = 11.500 MT (Meticais), while in November 1998 was 1 USD = 12.100 MT.
Table 1. The Gross Domestic Product (GDP) by sector, is as follows:
sector GDP%Tourism and services 52.2% (1995)Agriculture 22.8% (1997)Industry 8.6% (1997)Others 13.4% (1985) Source: Christie, 1998
1.2. Forestry contribution to the GNP
In Mozambique, natural forests have a huge potential for social and economical development andcontribute to a large extent in providing goods and services.
Rural communities depend strongly on the forestry resources for their livelihood. The nationaleconomy receives direct contribution from the forestry sector for about 18% (estimate) annually ofthe GNP. Indirect contributions amount to around 80% of the country's needs for energy insubstitution of millions of tons of fuel oil that should be imported, something equivalent for housebuilding and various other products of very high financial values (Saket et. al, 1995).
Forestry’s contribution to the country’s national income or the value-added generated within thesector in 1981 was estimated at 5.299 million MT. The figure is an estimate based on availableinformation as well as on several assumptions, and therefore should be regarded as a roughindication of the sector’s role in the economy.
Subsistence production accounts for nearly 75% of the total value-added. There are no completestatistics on the country’s national income. For this reason, no attempt has been made to determinethe magnitude of the contribution of the forestry sector to the GNP.
In 1983, the forestry’s contribution was estimated at about 7% of GNP, and from 1980 to 1986,excluding fuelwood, the wood industry contribution has represented an average of 21% of the agro-industrial Gross Production (Strategy for development of the forestry sector, 1991), which hasamounted to 28% in subsequent years (1986-1988).
In 1977, the forestry sector contribution to the income generated from exports was US $ 5 million,which has decreased to US$1 million from 1989 to 1990 due to various economical barriers. At thebeginning of 1973 the exports income generation amounted to over US$ 7 million for 120,000 m3 ofprocessed wood, against the 2,400 m3 registered in 1990 (round timber included).
2. FOREST RESOURCES
The land is a key issue in the national social context. Under the 1990 Constitution, all property in

MOZAMBIQUE COUNTRY REPORT
WORKSHOP PROCEEDINGS FORESTRY STATISTICS – MUTARE, ZIMBABWE (30 Nov. – 4 Dec. 1998)
91
land is vested to the State. Land may not be sold or mortgaged but, the State grants titles for the useof land and long lease is available. Direct users and producers get priority.
In granting titles for the use of land the State protects rights acquired through inheritance oroccupation, unless there is a legal reservation. The constitution of the Republic makes it clear thatenvironmental considerations are important.
2.1. Forest land area
The natural forest extends over an area of 618,274 Km2, which accounts for 77.79% of the total landof the country, including the inland bodies. The forest with timber production capacity covers anarea of 197,354 Km2 or 24.43% of the total land of the country. The actual size of mangrovevegetation is defined at 396, 080 ha. (Saket et al; 1995).
Natural forest cover has been classified according to five major vegetation type as following:
High Forest: usually with 3 differentiated strata; dominant stratum has an average height of morethan 18 m.; co-dominant stratum of 12-15 m and understorey of 4 to 7 m.Low ForestThicket: frequently the result of a degradation process following burning, over exploitation orovergrazing of high or low forests.Grassland: The dominant component is the grassy herbaceous stratum. Scattered trees and scrubscan be present.Mangrove communities: All mangrove communities are grouped under this unit.Vegetation on dunes: All littoral dune formations are grouped under this unit.
Table 2. Land use distribution and land cover types
Land Use type Area (ha) 1980 Area (ha) 1990Natural forest (productive) 19,129,480 19,735,400Forest plantations 42,000 42,000Thicket 19,880,998 26,278,471Grassland 31,952,950 20,114,357Mangroves 455,500 396,080Dunes 98,250 78,867Agriculture 5,496,200 11,843,910Water bodies 1,029,948 1,029,948Not classified area 1,280,000 1,280,000TOTAL 80,799,033 80,799,033Annual deforestation (1980-1990)% 0.26Annual re-afforestation (1990)% 1,400Source: Saket, 1994
The forest types having timber capacity production has a growing stock estimated at 503 millioncubic meters, in which 68 million cubic meters of timber with commercial values of diametercategories of 25 cm and higher. The total standing timber of economically valuable species ofdiameter categories of 40 cm and more is estimated at about 22 million cubic meters (Saket; 1994).
Regarding yield rates, it has been estimated that total timber can produce 8.828 million cubic meters

MOZAMBIQUE COUNTRY REPORT
WORKSHOP PROCEEDINGS FORESTRY STATISTICS – MUTARE, ZIMBABWE (30 Nov. – 4 Dec. 1998)
92
per year and the total commercial timber is able to generate 1.195 million cubic meters a year.
2.2. State protected area
State protected area Total (ha)
Forest reserves 4,471National Parks 16,070Wildlife reserves 18,600Coastline reserves 1,050Hunting area 59,704
3. FOREST PRODUCTS
3.1. Wood products and industries
The forestry sector’s review carried out in 1995 shows that the majority of wood produced inMozambique is utilised by the rural sector as fuelwood and building material. Only a small portionof the total wood production comprises industrial wood.
Despite a declining trend in industrial wood production in the country since the mid ‘70’s the totalwood removal from the forests has shown a regular increase due to a steady growth of subsistencepopulation whose consumption pattern and wood usage remained the same.
The structure of wood production in Mozambique comprises:
Subsistence wood production;Market fuel wood production;Industrial roundwood; andProcessed wood production
Table 3. Registered Forest Industries in 1997
Province Sawmills Plywood ParticleBoard
Veneer Parquet
Posts Total
C. Delgado 10 10Zambezia 5 5Nampula 14 14Inhambane 13 1 14Gaza 7 7Tete 6 6Sofala 11 1 1 1 1 15Maputo 19 19Manica 10 1 1 12Niassa 6 6TOTAL 101 1 1 1 2 2 108Source: DEP/DNFFB, Annual Report, 1997

MOZAMBIQUE COUNTRY REPORT
WORKSHOP PROCEEDINGS FORESTRY STATISTICS – MUTARE, ZIMBABWE (30 Nov. – 4 Dec. 1998)
93
In the decade 1980, when Mozambique civil war, the majority of management, maintenance,operational and administrative staff of the industry suddenly immigrated; the industrial productionbegan to decline. There has been some progress in industry since 1994, when the armed conflictended.
Forest industry production for selected years is given in the table below:
Table 4. Forest Industries Production (1988-1997) (cubic metres)
Year Sawnwood Plywood ParticleBoard
Veneer Parquet
1988 19,456 173 3,270 6 571989 20.778 65 3,286 0 351990 25,661 2 4,007 0 461991 16,403 33 2,399 282 1001992 15,665 100 1,218 751 2081993 29,939 128 1,217 589 3171994 29,526 - 800 1,441 2,3141995 41,252 79 630 1,386 1,0421996 42,972 697 0 1,824 3,7091997 9,407 307 0 771 Source: DEP/DNFFB: Annual Report, 1997.
The recent change in government the Government policy prioritising the wood companiesprivatisation, will greatly encourage the private sector in the increase of wood production. The tablebelow shows the number of the privatised companies:
Table 5. Privatisation of Forest Industry
province privatised in processMaputo 3 0Inhambane 5 11Sofala 2 1Manica 0 1Tete 0 0Zambezia 1 0Nampula 3 0Cabo Delgado 1 0Niassa 0 0Total 15 13 Source: DEP/DNFFB, Annual report, 1997
3.2. Fuelwood production
On the basis of the FAO’s estimate of per capita fuelwood consumption of 0.665 cubic metres forAfrica as well as on estimated population of the country, it was concluded that the total householdfuelwood consumption in 1969 was 4.7 million cubic metres. The Forest Sector review hasprovided the 1992 per capita consumption in order of 1.0 to 1.7 m3.

MOZAMBIQUE COUNTRY REPORT
WORKSHOP PROCEEDINGS FORESTRY STATISTICS – MUTARE, ZIMBABWE (30 Nov. – 4 Dec. 1998)
94
Pole consumption for building and fencing in the rural areas is estimated at 0.03 cubic metres/person/ year, which corresponds to a total of 317 thousand cubic metres. So far there is no newstudy carried out which could update the previous one.
Annual consumption of fuelwood and small construction poles (3 to 12 cm) in 1996 was estimatedat 16.0 million cubic metres (DNFFB; 1997).
The low recorded information with the new system excluding the subsistence fuelwood productionfigures, shows that the consumption of wood for fuel, charcoal and poles is around 160,000 stackedcubic metres (steres), see table below.
Table 6. Wood Requirement in 1997
woodfuel wood for charcoal wood for poles1,166a 785a 144a
497,815b 1,081,243b 21,113b
131,763.8c 158,131.7c 44,834c
Source: DEP/DNFFB: Annual Report, 1997
Number of issued licencesa; The authorised wood quantity (s.c.m.)b; Wood removal/under licencec
With regards to the market fuelwood, production, consumed by part of the urban population and bysome industries, and according to the last survey in 1977, in Maputo, the average charcoalconsumption is assumed to be 160 Kg/ person/ year.
3.3. Roundwood production
Estimated log intake capacity of all operating units is 310,000 cubic metres, which corresponds tothe following annual outputs:
Sawtimber = 32,550.2 m3
Plywood = 959,0 m3
Blockboard = 2,454.0 m3
Veneer = 1,200,000 m3
Parquet = 9,448.0 m3
Source: DEP/DNFFB: Annual report, 1997
Of this log intake capacity, 202,500 cubic metres/year, corresponds to the logging capacity innatural forest, mostly located in the northern and central regions of the private sector holds thegreater part of the logging capacity (Saket, 1995).
Table 7. Logging Capacity in Natural Forest (cubic metre/year)
province public private mixed totalCabo Delgado 27,500 17,000 2,500 47,000Niassa 7,500 2,500 - 10,000Nampula 21,000 15,000 - 36,000Zambezia 2,500 22,000 5,000 30,000

MOZAMBIQUE COUNTRY REPORT
WORKSHOP PROCEEDINGS FORESTRY STATISTICS – MUTARE, ZIMBABWE (30 Nov. – 4 Dec. 1998)
95
Tete 2,500 - - 2,500Sofala 7,500 45,000 - 52,500Manica 7,500 - - 7,500Inhambane 15,000 - - 15,000Gaza 2,000 - - 2,000TOTAL 93,000 102,000 7,500 202,500Source: Ribeiro, 1991
As has happened in other production fields, industrial roundwood output showed a marked drop insome years and stead decline along the last two decades (see table below):
Table 8. Roundwood production (000 cubic metres)
year roundwood production1960 400.01981 260.01986 14.51987 16.11988 15.51989 9.41990 47.41991 50.21992 17.3
Source: DEP/DNFFB, Annual Report, 1997
4. INSTITUTION INVOLVEMENT AND LINKAGE
With regards to the Forestry National Statistics Network (FNSN), the Directorate of AgrarianEconomy (DEA) through its statistics department, constitutes a major link between ForestryDirectorate and the National Commission of Plan (CNP) to whom the exclusive right for thenational statistics publication was empowered.
The Forestry Directorate, represented by the Economics and Planning Department (DEP) have beensharing forestry product export statistics with the Ministry of Trade, before they submitted theirannual reports to the National Commission of Plan.
One of the main constraints within the National Statistics Network (NSN) is the discrepancy of therecorded and delivered figures. This incident could be explained by:
Differences in report formats designed by the involved institutions;Differences in the sources of information; andShortage of competent staff.
The lack of co-operation within the national forestry statistical network allows the delay or evengaps on monthly summary to be compiled and circulated, in the way of feedback to the datainformation sources.
5. FOREST AND WILDLIFE SECTOR INFORMATION SYSTEM

MOZAMBIQUE COUNTRY REPORT
WORKSHOP PROCEEDINGS FORESTRY STATISTICS – MUTARE, ZIMBABWE (30 Nov. – 4 Dec. 1998)
96
5.1. Background
A shortage of systematically collected statistics from the forest sector in Mozambique has been aconstraint on the utilisation of the wildland resources on a sustainable basis and planning futureneeds and policy implementation.
In the past few years, statistics of the Forest Sector have been kept on an ad-hoc basis withindustrial export data being maintained on a systematic basis.
It was characterised by the (a) weakness on the relationship between forest industries and ForestProvincial Services (b) weakness on the content of the forms (c) diversity of the data andinformation sources (d) use of Lotus 123 worksheets accessed through macros to capture, verify andprice data and (e) lack of reliance on the existing information sources.
Very useful series were recorded and have lately been incorporated into the present and use of Lotus123 worksheets was abandoned in favour of Microsoft Excel and Word worksheets.
Major gaps, within the previous forest data base were completed from the last forest industry surveycarried out in 1986, with involvement of all forest enterprises (logging and wood processingcompanies), carpentry shops equipped with log sawing facilities and any other primary woodindustry.
The new forestry information management system was introduced in January 1992 as a result of theimprovement of the existing system. It is intended to provide comprehensive coverage of all forestryand wildlife activities in the provinces within a standardised format, and based mainly inclusion ofvarious report forms.
5.2. New reporting system and data base presentation
The new reporting system plays an important role on the resources, use and planning at short,medium and long terms. It should not be interpreted as more than simply statistics demanded by theNational Directorate of Forestry and Wildlife (DNFFB). It is an enhancement of the authority of theForestry and Wildlife Provincial Services (SPFFB) to be better informed on all forest sectoractivities in each of the 10 provinces. The DNFFB has chosen the SPFFB as the appropriate sourceof data information within the province.
These provincial authorities should collect forest sector data and information from several sourcesin their own provinces and check it for authenticity. The figures reported should be reviewedcritically against local knowledge of actuality and, report forms should be scrutinised forcompleteness before their submission to the National Directorate.
The actual forestry database comprises:
A system of information gathering through a monthly reporting system based on the provincialforest service (SPFFB),Data capture and verification on computers at the Economics and Planning Department (DEP) inMaputo,Analysis and preparation of standard report by DEP to be submitted to the National Directorate,

MOZAMBIQUE COUNTRY REPORT
WORKSHOP PROCEEDINGS FORESTRY STATISTICS – MUTARE, ZIMBABWE (30 Nov. – 4 Dec. 1998)
97
Feedback and dissemination of these to the provincial level.
5.3. Coverage and data base areas
The data base coverage will expand in the future in scope to include all activities such as:
Control of forestry resources: Issue of felling licenses; License royalty fees; Primary forest products;and Penalties for transgressions;Industrial production: Register of wood consuming industries; Supply of logs; Secondary forestproduction; and Price of forest products;Exports;Afforestation: Register of nurseries; Nursery production and sales; Register of commercialplantation areas; and Register of non-commercial plantation areas;Wildlife: Observation of animals; Hunting and culling; and Control of resources;Beekeeping activities;World Food Program activities;Human resources;Financial control;Forest projects Registration; andProjects Budget Control.
There are four main ways of making the forestry national statistics network more dynamic andoperational namely (a) creating a close relationship between the information sources and users(periodic visits to the main information sources), (b) feedback system implementation, (c) shorttraining courses and workshops and (d) periodic forestry inquiries.
The Forest Resource Database includes:
Forest Regeneration, which plays a main role in the forest management. The total area regeneratedafter fire destruction and forestry species regenerated should help in the forest harvestingprogramming and fires protection planning. It would also be useful for stock growing prediction.
Wildlife Resources Management (Survey, Protection and Utilisation).Survey: Area surveyed, animal species occurrence, species under the risk of disappearance.Protection: Area under protection, species under protection, revenues from royalties, penalties fortransgression.Utilisation: Revenue from royalties, penalties for transgression and penalties for the illegal transitwith wildlife products.
Sales in the local market and for exports.
5.4. Brief aspects of menu operations
The information management system for forestry sector in Mozambique uses three main Microsoftpackages described as follows:
Microsoft Excel (Improvement previous form; Design of the new forms; Forms record);Microsoft Word (Elaboration of instructions for the forms); andData Entry, Management and Maintenance (Updating and sorting of the data).

MOZAMBIQUE COUNTRY REPORT
WORKSHOP PROCEEDINGS FORESTRY STATISTICS – MUTARE, ZIMBABWE (30 Nov. – 4 Dec. 1998)
98
Each of the above mentioned data base areas is suitable for whatever the option. Once a certaindatabase area is selected, an operation menu appears with:
Select province.Select year.Browse data.Edit data.Add new data.Delete and pack.Reindex data.Exit for choice
5.5. Statistical information sources
The main sources of statistics have been:
Forestry and wildlife provincial office (SPFFB) which submits statistics directly to the NationalDirectorate of Forestry and Wildlife (DNFFB), through the Economics and Planning Department(DEP), covering such matters as license revenues, control activities;Industrial enterprise report, which submits forestry product utilisation, forms to the SPFFB, the onlystatistical information source for the central level (DNFFB). These reports cover aspects of theforest production and state enterprises; and,Public investment projects, which submit reports directly to the relevant department coveringoperational, personal and financial aspects of forest projects.
Within the National Directorate for Forestry and Wildlife (DNFFB), the Economics and PlanningDepartment (DEP) has assumed the responsibility of designing and implementing an informationdatabase for the forest sector. This is intended to overcome the major differences from each SPFFB.A monthly report concerning information on (i) provincial level activities (ii) forest projectactivities (iii) industrial enterprises production, is elaborated and sent to the National Directorate.
5.6. Structure of the forms
In accordance with their destination and use, the forms are classified into four main groups,presented as follows:
Group A - Forms to be filled in and kept by companies.(1-a) Logs entrance register(1-f) Logs outlet/logs transit registerGroup B - Forms to be filled in by the companies and submitted to the forestry provincial officestheir checking.(2-b) Logs supply to the sawmills/mills(2-c) Wood processed productionGroup C - Forms to be filled in and kept in the forestry provincial offices(1-a) Control of the Licences(1-b) List of the issue Licences(1-c) Flown off production/balanceGroup D - Forms to be filled in by the forestry provincial office and submitted to the National

MOZAMBIQUE COUNTRY REPORT
WORKSHOP PROCEEDINGS FORESTRY STATISTICS – MUTARE, ZIMBABWE (30 Nov. – 4 Dec. 1998)
99
Directorate of Forestry and Wildlife in Maputo.(1-d) Penalties for transgressions and their revenues(2-a) Enterprises register(2-d) Forestry products price survey(3-a) Exports undertaken within the provinces(4-a) Reforestation; List of the nurseries(4-c) List of commercial plantations(5-b) Hunting products/production(5-c) Wildlife resources use inspection(8-a) Human resources registration and its updating
The timing for form submission can be (a) monthly, (b) quarterly and (c) annually.
REFERENCES
Christie, I.; 1996: Mozambique: Land of Peace and Promise, Bureau de informaçao pública,Maputo, Mozambique.
CPI, 1998: Business guide to Mozambique. LPE international, Maputo, Mozambique.
DEP/DNFFB; 1998: Relatório estatístico anual 1997. Mnistério da Agricultura e Pescas, DNFFB,Maputo, Moçambique.
DNFFB, 1997: Sector de Floresta e Fauna Bravia. Programa de Investimento Revisto. (1998-2002).
I.N.A., 1997: Statistical yearbook. Instituto Nacional de estatística. Maputo, Moçambique.
Kirk, A., 1992: A Review of the forestry sector. Maputo, Mozambique.
Saket, M., 1994: Report on the updating of the Exploratory National Forest Inventory. FAO/UNDP,MOZ/92/013, Maputo, Mozambique.
Saket, A.Taquidir, M; Banze, C.: Methodology and Results of the Forestry Vegetation Mapping at1:250000. FAO/UNDP, MOZ/92/013, Maputo, Mozambique.

NAMIBIA COUNTRY REPORT
WORKSHOP PROCEEDINGS FORESTRY STATISTICS – MUTARE, ZIMBABWE (30 Nov. – 4 Dec. 1998)
100
STATUS AND USE OF FORESTRY STATISTICS IN NAMIBIA
byMr. Moses ChakangaPrincipal Forester, National Forest ServiceWindhoekNamibia
1. BACKGROUND
The Directorate of Forestry in Namibia was established in 1990. At present it is still in its earlydevelopmental stages. The Directorate produced the first Forestry Strategic plan for Namibia in1996. In August 1997 the Directorate began implementation of the Strategic Plan of the Namibia-Finland Forestry Programme. The Strategic Plan is based on ecological, environmental, cultural, andsocio-economic considerations and it considers ‘Production, Protection and Participation’ as thethree important issues of forestry development in Namibia.
New forest legislation was completed in 1997 and is awaiting approval by Parliament. At presentthe national forest policy of Namibia is under review.
The main challenges being faced by the directorate are manpower development, infrastructuredevelopment and forest resource data collection. Several forestry staff are in colleges anduniversities to obtain Forestry Diplomas and BS Degrees. The infrastructural development is almostcomplete. Forestry data collection, compilation, analysis and dissemination is in progress.
2. INSTITUTIONS DEALING WITH FORESTRY DATA COLLECTION
2.1. Directorate of forestry
The Directorate of Forestry is the main institution dealing with Forestry data collection in Namibia.These activities are handled by the Directorate’s three Divisions, namely, Management, Researchand Training & Extension (Planning and Extension). Under the Management Division there arethree Regions (North East, North-West and South-Central) which are managed by Forestry DistrictOfficers. The District Forest Officers are key personnel in direct contact with local communities.
2.2 Namibia Finland forestry programme
The Directorate of Forestry is implementing sub-components of a Namibia-Finland ForestryProgramme in cooperation with the Government of Finland. The overall programme objective is toensure an increased role of forestry in the socio-economic development of Namibia throughcontinuous implementation and development of sustainable forest management practices.
The Programme has four components: Public Sector Forestry Capacity Building, CommunityForestry, Integrated Fire Management and Environmental Forestry. The Public Sector ForestryCapacity Building Component has three sub-components: Institutional Development, Training at

NAMIBIA COUNTRY REPORT
WORKSHOP PROCEEDINGS FORESTRY STATISTICS – MUTARE, ZIMBABWE (30 Nov. – 4 Dec. 1998)
101
Ogongo Agricultural College and National Forest Inventory.
2.3 National remote sensing centre
The national Remote Sensing Centre is involved in the development of GIS applications. The centreproduces a variety of maps for different clients including presentation of forest statistics in mapform for the Directorate of Forestry.
2.4. Other institutions
Other institutions dealing indirectly with forestry data collection are: the National BotanicalResearch Institute (herbarium), Directorate of Environmental Affairs (environmental ImpactAssessments), Ministry of Trade and Industry ( forest products import and exports).
3. IN-COUNTRY CAPACITY
The main weakness of the Directorate of Forestry is the shortage of qualified local forestry staff.Out of the 123 positions of professional and technical staff 65 (or 52.8%) are filled and 57 arevacant. The Directorate of Forestry, as the major institution directly involved in forestry datacollection is in the process of developing its human resource capacity to be able to deal with datacollection, compilation, analysis and dissemination. This is particularly essential in the area of forestresearch to increase the human resource capacity to manage and perform scientific research toproduce data and information to support the various forest management activities of the Directorate.
4. FREQUENCY OF DATA COLLECTION
For routine operations such as nursery operations, issuing wood harvesting and export permits etc.data is collected daily. In the case of forest inventory, data collection will be repeated after 15-20years while for local areas requiring forest management information, the data will be gathered whenappropriate. For other components such as Community Forestry, Environmental Forestry, IntegratedForest Fire Management the data is collected when appropriate.
5. THE CONDITION OF DATA-DISSEMINATION
The forestry statistics information is mainly disseminated through the Directorate’s monthly,quarterly and annual progress reporting system. The routine statistics, inter alia, include Number of:Plants raised, Plants sold, Permits issued, Plants for Own use/donated; Revenue (N$) generatedfrom: Plant sales, Wood harvest permits, Fines, Timber contracts, exports of forest products etc.
The data from the Forestry Inventory, Community Forestry, Environmental Forestry, IntegratedForest Fire Management is disseminated through the various reports produced by the respectivecomponents. The Forest Inventory Sub-component has so far produced 4 forest inventory reports,(West Tsumkwe in Otjozondjupa region; Nkurenkuru Concession in Kavango Region;Otjinene/Okakarara districts in Omaheke region; and Ongandjera Community Forest in OshanaRegion). This Sub-component is in the process of preparing a report for Caprivi where 861 treeplots were measured in both East and West Caprivi between September-December 1997.

NAMIBIA COUNTRY REPORT
WORKSHOP PROCEEDINGS FORESTRY STATISTICS – MUTARE, ZIMBABWE (30 Nov. – 4 Dec. 1998)
102
6. USE OF INFORMATION
The information developed is used by the Directorate of Forestry and other institutions for planningvarious forestry and natural resource management activities in order to develop the forestry sector inNamibia.

SOUTH AFRICA COUNTRY REPORT
WORKSHOP PROCEEDINGS FORESTRY STATISTICS – MUTARE, ZIMBABWE (30 Nov. – 4 Dec. 1998)
103
SOUTH AFRICA FOREST REPORT
byMs. Sebueng Kelatwang & Dr. Themba L. SimelaneDepartment of Water Affairs & ForestryPrivate Bag X93, Pretoria 0001, South Africa
1. BACKGROUND
South Africa (SA) is a large, diverse country at the foot of the African continent. It is flanked in thenorth by Namibia, Botswana, and Zimbabwe and in the Northeast by Mozambique and Swaziland.The country has a total land surface area of 122.3 million km2. Of this, 42 million ha is opensavannah of which as little as half remains as natural area, 400,000 ha is closed canopy forest, ofwhich 300,000 ha are in protected areas, i.e. 58% in state forest and 42% in other legally protectedareas and about 1.48 million hectares is industrial plantations managed for sustainable production.Most of the plantations are located where climatic conditions are suitable for afforestation, i.e. 41%in Mpumalanga; 37% KwaZulu-Natal; 11% Eastern Cape; 6% Western Cape and 5% in theNorthern Cape. Afforestation is occurring at a rate of around 10,000 ha per year.
Prior to 1994, South Africa’s forest policy focus was mainly on industrial timber plantations andtimber production and as such we collected commercial timber statistics only. Forest information inSouth Africa is characterised by:
Fragmentary nature;Partiality, i.e. it does not cover all forest types or issues;Resource waste;Duplication of efforts;Existence of information gaps;Lack of a system to pull information together; andHigh costs of collecting information.
Following the launch of the NFAP in 1996, forest policy changed to focus on all forest sectors. Thenew forest policy and National Forests Bill necessitate the need to develop a forest resourceinformation service that will address forest information problems. Essential and correct informationshould reflect the needs of preparing a report on the State of South Africa’s forest resources, thedevelopment of a system of criteria and indicators for SFM and the development of a ForestResource Accounting System. The system should have the following outputs:
Information on forest resources of all types (ecological, economic and social);Information on demands on the forests;Resource implications of forest;Important influences on the forest sector; andForest Resource Accounting.
2. SOUTH AFRICA'S MACRO-ECONOMIC POLICY FRAMEWORK

SOUTH AFRICA COUNTRY REPORT
WORKSHOP PROCEEDINGS FORESTRY STATISTICS – MUTARE, ZIMBABWE (30 Nov. – 4 Dec. 1998)
104
2.1. Proposed policy framework
A collaborative network approach to develop a system of Forest Resource Accounting will be aprerequisite for success. The proposed policy framework includes the following target areas:
The deficit in the budget will be reduced more rapidly i.e. 3% of GDP by the year 2000, inter aliaeliminating the government dissaving by 2.5% GDP. In other words free more capital forinvestment purpose;Import tariff reduction will be accelerated to contain imported inputs prices, facilitate industrialrestructuring and enhance international competitiveness of the economy;Maintain a stable real effective Rand Exchange rate;Providing tax incentives to stimulate new investment in labour intensive project;Restructuring of state assets which will attract foreign investment, expertise and technology.
2.2. Achievements
overall macro-economic balance was restored to an important extent;the budget deficit of the national government was reduced faster than most observers hadanticipated;the deficit on the current account of bop was reduced in terms of absolute value and as a ratio ofgdp;inflation fell and inflation expectation diminished considerably;productivity improved in the formal sector of the economy; andfixed investment in the productive business sector of the economy has increased in recent years.
2.3. Drawbacks
South Africa has experienced a period of slowdown in economic activity and consolidation sincethe third quarter of 1996. Economic growth has been weak and the current indicator of employmentin the formal sector of the economy has declined to its lowest level in 20 years. The main factorsthat have adversely affected the economy are:
Financial turbulence in Asia: the domestic financial market came under intense pressure in May1998 and monetary conditions tightened considerably;Economic growth as measured by year to year change in real Gross Domestic Product deceleratedfrom 1996 to 1997, reflecting the consolidation of real GDP and a decline in agriculturalproduction;Declining employment and slow growth in private household disposable income were manifested inslow growth in the real value by trade sectors. The slowdown in the economic growth brought in itswake a further decline in total employment in the non-agricultural sectors of the economy;The turbulence in emerging markets during the second quarter of 1998 and a sharp decline in thesurplus on the external capital account brought downward pressure to bear on the exchange rate ofthe Rand. The normal effective exchange rate of the Rand as such fell by about 20% in sevenmonths of 1998. This event delayed the anticipated recovery in overall real economic activity.
3. POLITICAL SITUATION
The new South Africa is moving into its 5th year in 1999 and the second elections are to be heldbetween May and July 1999. The current ruling party is the African National Congress. The

SOUTH AFRICA COUNTRY REPORT
WORKSHOP PROCEEDINGS FORESTRY STATISTICS – MUTARE, ZIMBABWE (30 Nov. – 4 Dec. 1998)
105
National Party is the official opposition party.
4. SOCIAL AND HUMAN CONTEXT OF FORESTRY
The current relationship between forest owners and the neighbouring communities can be groupedinto three main categories:
Access to land and other resources;Economic opportunities; andAccess to social service and infrastructure.
Access to land: Statistics of families occupying forestland is estimated at 100,000 family membersof employees alone. These families do not have any legal status and are vulnerable to evictions. Theinsecurity of tenure status of these families is sometimes a cause for instability and conflict. Thisproblem is not confined to forest land only but, it is common to state and privately owned landthroughout South Africa both in rural and urban areas. The land reform programme is therefore veryimportant in addressing these problems. Communities living in forest land require some livestockgrazing and cropping to supplement or sustain their livelihood. In some cases the forest industryallows communities to graze their cattle on forest land and allow them to collect firewood and othernon-timber forest products.
Economic opportunities: Companies such as Mondi and Sappi also outsource some timber fromcommunities using out-grower schemes.
5. FOREST RESOURCES
5.1. Land ownership
Of the total surface land area, 84% is farm land, 10% is nature conservation, 1% and 4.8% otherland (DBSA 1994);Of the total farmland and nature conservation, 23% is natural forest and woodlands and only 7% ofthis resource is conserved in national parks and nature reserves;White owned farmland accounts 87% of the total land area and the remaining 13% is black-ownedsubsistence farmland in the former homelands.
5.2. Forest land ownership
Forestland is estimated at 1.48 million ha (1.1% of the total land area). Of this land:
46% is forest industry companies;24% is private individuals;17.2% is SAFCOL; and12.8% is public.
6. LAND USE
6.1. Comparison of land use
Of the total land area:

SOUTH AFRICA COUNTRY REPORT
WORKSHOP PROCEEDINGS FORESTRY STATISTICS – MUTARE, ZIMBABWE (30 Nov. – 4 Dec. 1998)
106
Sugar cane 411,000 haWheat 1.4 million haForestry 1.5 million haMaize 3.9 million ha
Plantation area by species
Species Private (ha) Public (ha) TotalSoftwood 432,992 364,618 799,610E. Grandis 386,295 55,099 441,394Other gum 134,507 22,063 156,570Wattle 104,000 8,029 112,029Other 4,803 5,732 10,535Total 1,062, 597 455,541 1,518,138 Source : DWAF 1996/97
7. NEW AFFORESTATION OVER THE LAST SEVEN YEARS
Years Softwood Hardwood Total Softwood Hardwood1990/91 24.804 20.619 45.423 55% 45%1991/92 15.959 12.282 28.241 57% 44%1992/93 9.925 6.653 16.578 60% 40%1993/94 10.366 8.283 18.649 56% 44%1994/95 6.705 6.435 13.14 51% 49%1995/96 4.761 7.186 11.947 40% 60%1996/97 4.239 6.95 11.189 38% 62%Total 76.759 68.408 145.167 53% 47%
8. FOREST PRODUCTS PRODUCTION, TRADE, And CONSUMPTION
8.1. Sales at processing plants by volume
Product Units VolumeSawn Timber M3 1.32Pulp Tons 2.92Mining Timber Tons 565Poles M3 134Charcoal Tons 27Chips / Mill Residues Tons 1.155Firewood Tons 3
8.2. Export of forest products 1997
Product Production Exports Imports Apparent(RSA) (RSA) Consumptio
n

SOUTH AFRICA COUNTRY REPORT
WORKSHOP PROCEEDINGS FORESTRY STATISTICS – MUTARE, ZIMBABWE (30 Nov. – 4 Dec. 1998)
107
Graphic papersUncoated Paper 279,000 16,000 73,000 336,000Coated Paper 63,000 1,000 110,000 172,000Newsprint 332,000 182,000 4,000 154,000SC Mechanicals 81,000 35,000 2,000 48,000
Packaging papersLinerboard 613,000 186,000 1,000 428,000Fluting 248,000 4,000 2,000 246,000Other Kraft 149,000 22,000 41,000 168,000Paper- & fibreboard 137,000 4,000 91,000 224,000Tissue 145,000 10,000 2,000 137,000
Total paper &board
2,047,000 460,000 326,000 1,913,000
PulpPaper Pulp 1,780,000 210,000 80,000 1,650,000Dissolving Pulp 520,000 520,000 0 0Total pulp 2,300,000 730,000 80,000 1,650,000
9. OTHER FORESTRY PRODUCTS AND ROLES
9.1. Fuelwood consumption
Biomass accounts for almost 10% of the net national energy consumption and amounts to 11million tonnes per annum. The major proportion of this biomass based energy is utilised by ruralhouseholds and 6.6 tons/annum is consumed by semi-rural households in the homelands with theremainder being used by farm workers (3.5 million tons), other rural households (less than 0.5million tons) and urban households (0.7 million tons).
9.2. Fuelwood supply
Source VolumeFormer homeland areas Average 5.8 million tons per annumWoodlots from former homelands 100 000 tonsCommercial forestry Between 2 and 4 million tons of plantation residueInvasive alien 2.5 million tons on commercial farms
9.3. Forest management law and policy
The purpose of the New Forest policy is to promote the forest sector so that it is able to provideforest goods and services now and in future. It extends to any resource that provides forest goodsand services and any other activity that relates to tree based resources. The new forest act as suchprovides for effective protection, management and utilization of all types of forest resources in orderto promote the sustainable development of the forest including ecosystem and ecological resourcesthey contain for the benefit of all the people in South Africa.
Estimated capital in the forest products industry (at current market prices)

SOUTH AFRICA COUNTRY REPORT
WORKSHOP PROCEEDINGS FORESTRY STATISTICS – MUTARE, ZIMBABWE (30 Nov. – 4 Dec. 1998)
108
Industry PercentagesPulp and paper mills 80.0%Sawmills 17.6%Other mills 1.9%Mining timber mills 0.5%Total investment R 18.5 billion
9.5. Institutional strengthening and capacity
A strategy of human development is now being developed. This strategy needs to address thefollowing key areas:
Training standards and learning outcome to enable trainees to gain skills and knowledge;Career paths in forestry and related fields;Enhance the overall productive capacity and competitive capability of the forest sector.
9.6. Sustainable forest management
The development of the forest sector comes with environmental and social costs and benefits. Thisdevelopment must be directed by the appropriate and effective environmental management systems,procedures and regulations. This will ensure conformity with the South African environmentalpolicy and best practice internationally.
The development of criteria and indicators will improve resource use planning, to access theoutcome of forest management, provide a basis for continuos improvement and assistcommunicating the state of South African forest resources.
The new water act endeavour to ensure that the nation’s water resources are protected, used,developed, conserved, managed and controlled in the following ways:
meet the basic human needs of present and future generation;promote equitable access to water;protect aquatic and associated ecosystems and their biological diversity;promote beneficial use of water in the public interest;redress the results of past racial and future discrimination; andmanage floods and droughts.
9.7. Outlook and future
Outlook of the consumption of industrial roundwood in S.A (‘000m3) in 1995/96 and projection toyear 2020 in various products categories based on a scenario of GDP growth of 25% (LHA)
Product category Volume of roundwood soldfrom plantations 95/96
Projected consumption for thedomestic market and exports 2020
Lumber (sawn timber) 4,745 7,870Pulpwood and chip exports 10,920 24,130Mining timber 2,560 2,560

SOUTH AFRICA COUNTRY REPORT
WORKSHOP PROCEEDINGS FORESTRY STATISTICS – MUTARE, ZIMBABWE (30 Nov. – 4 Dec. 1998)
109
Other 1,070 2,585Total 19,295 37,145
The forest sector is exposed to globalisation and as such it is a part of many of the activities takingplace internationally. These include:
The Forest Resource Assessment 2000; andThe development of criteria and indicators for sustainable forest management.
In South Africa the following activities are taking place:
The Chief Directorate: Forest will produce every three years South Africa’s “State of the Forest”report;All the state forest are currently being restructured;The new water and forest have been promulgated;There is a national initiative to develop a Natural Resource Accounting system; andThe “State of the Environment” report is in current production.
12. CONCLUSION
South Africa is in a transitional period. New policies and acts are being developed in the interest ofall South Africans. The slowdown of economic growth, due to unforeseen circumstances hasresulted in high unemployment associated with high crime rates. Over the past few years the forestsector has developed 3 important policy documents: the White Paper on sustainable management,the NFAP document a policy framework that directs the implementation of the White Paper and theForest act. A crucial activity of the next millennium is the implementation of establishing the ForestResource Information System. In this process care must be taken to ensure that the format of theinformation is compatible with other national, regional and international bodies.
REFERENCESDWAF (1997) Commercial timber resources and roundwood processing in South Africa.DWAF (1997) South African NFAP (1997).SARB (1998): Annual Economic Report.
SWAZILAND COUNTRY REPORT
WORKSHOP PROCEEDINGS FORESTRY STATISTICS – MUTARE, ZIMBABWE (30 Nov. – 4 Dec. 1998)
110
THE STATUS OF FORESTRY STATISTICS IN SWAZILAND
byMr. Cliff S. DLAMINIP O Box 162Mbabane - Swaziland
1. INTRODUCTION
Swaziland is a small land-locked country in South-East Africa surrounded by Mozambique to theeast, with South Africa surrounding its other borders. The country lies between latitudes of 31º and32º south and longitudes 25.5º east. It covers only 17,364 km2 and can be divided into four broadecological zones, parallel to each other from north to south. There are Highveld, Lowveld andLubombo. The population is 960,000 according to the 1995 census.
Generally, Swazi economy developed alongside and fashioned after South Africa. Owing to historyand proximity the imports and exports manifest 80% and 60% interactions respectively, (SACU andCommon Monetary Area).
Commercial forestry accounts for diversity of produce that earns foreign revenue for Swaziland.The major forestry products are:
unbleached kraft-pulp,sawn timber,furniture from pine (Pinus patula, Pinus elliotti, Pinus taeda and Pinus kesiya),mining timber for South Africa's mines (eucalyptus grandis and eucalyptus saligna),poles for fencing, construction and transmission lines, andsawn wood for furniture making.
A small market South African for bark from black wattle has existed for a long time. A homemarket is situated at Matsapha Industrial Site to allow production, packing and export of tannindirectly from Swaziland to Europe. Wattle is the main tree of rural communities which providesfirewood, fencing and building material, bark (cash crop) and charcoal. Consequently, black wattlehelps reducing the rate of deforestation of indigenous species.
Indigenous forests are intermediate between grassland and bush cover. The trees are mostly lessthan 10 meters in height and with diameters of 10-15 centimetres. This is clearly an indication ofsavannah vegetation commonly found in lower, drier parts of the Middle and Lowveld. Degradationand deforestation of indigenous forests is occurring at serious but largely unmeasured rate.Exploitation of these forests is mainly for fuel wood, woodcarving and furniture by local people.
2. FOREST RESOURCES
Land Ownership: Land tenure arrangements play an essential role in the management of land andthe environment. The issue of land tenure in Swaziland is complicated. There are three main groups

SWAZILAND COUNTRY REPORT
WORKSHOP PROCEEDINGS FORESTRY STATISTICS – MUTARE, ZIMBABWE (30 Nov. – 4 Dec. 1998)
111
of land tenure:
Swazi National Land (SNL) = 75%Crown Land (CL) = 1%Private Freehed or Title Deed Land (TDL) = 24%
The SNL is land held in trust by the King for the Swazi nation. Crown land is land owned byGovernment and the TDL is privately owned. SNL is subdivided into two sub-groups:
SNL Senu Stricto, SNL at independence andSNL purchased, all free hold land purchased after independence
Land useKm2 %
Small scale subsistence crop agriculture (Rainfed annual fieldcropping)
2,140 12.3
Large scale commercial crop agriculture (Irrigated and rain-fedfield/tree cropping)
1,040 6.0
Extensive Communal grazing 8,670 50.0Ranching 3,320 19.1Plantation Forestry 1,400 8.1Parks, Wildlife management 670 3.9Residential, industry and recreation 80 0.5Water reservoirs 40 0.2TOTAL 17 360 100Source: (Rammelzwaal & Dlamini, 1994 cited in SEAP of 1997).
Natural Forestry Resources: There is a total forest area of 624,000 hectares which is 36% of totalland area, reported by the National Forestry Inventory of 1990. Out of this, there are 464,000hectares of indigenous forest and woodlands. These are classified into:
HaMontane and Highland (> 1,000 m) 11,930Riparian 2,344Moister Savannah 112,720Acacia Savannah 150,590Dryer Acacia Savannah 34,024Bushveld 151,890Source: (National Indigenous Forest Inventory of 1990)
Planted Forest Resources: Out of the 624,000 ha of forest areas, there are 135,000 ha ofcommercial forest plantation and 25,000 ha of wattle forest. Commercial forest plantationcomprises:
Coniferous (pines)Saligna/grandisOther gumsWattle

SWAZILAND COUNTRY REPORT
WORKSHOP PROCEEDINGS FORESTRY STATISTICS – MUTARE, ZIMBABWE (30 Nov. – 4 Dec. 1998)
112
Other non-coniferous.
The plantations are owned by five companies, namely:
Usutu Pulp Company, 65, 000 hectares,Mondi Forest Company, 26 000 hectares,Shiselweni Forestry Company, 11 000 hectares,Swaziland Mantantens Company, 4 000 hectares, andTonkwane with 2 000 hectares.
They are concentrated on the Highveld whose conditions are favourable for tree growth (NationalForest Research Plan 1992). The Forest Sector accounts for 16-18% of Swaziland's formal workforce.
3. FOREST PRODUCTS PRODUCTION, TRADE AND CONSUMPTION
Total annual industrial production is about:
174 000 tons wood pulp,102 000 m3 sawn timber,70 000 m3 mining timber and panels,420 tons of dry wattle bark for tannin.
Over 75% of the population in rural areas use firewood for cooking and warming houses. in million m3
Timber Fuel Others Total
Indigenous forestsWattle forests
TOTAL
3.93*0.98---------4.91
3.190.66-----------3.85
1.470.01-----------1.48
8.591.65----------10.24
Source: (Natural Forest Research Plan, 1993, 2003)
Non-wood forest products may include:
FoliageMedicinalHoneyEdible fruits and nutsMushroomsMopane worms etc.
Despite the already considerable income from forest products, there is a great potential to increasethis revenue by exploiting the non-wood forest products and to expand the tree species use fordifferent purposes.
Tourism and Recreation: Since the change of the political system in South Africa, the TourismIndustry in Swaziland is only just surviving. The tourism sector has to take renewed interest in the

SWAZILAND COUNTRY REPORT
WORKSHOP PROCEEDINGS FORESTRY STATISTICS – MUTARE, ZIMBABWE (30 Nov. – 4 Dec. 1998)
113
environment to attract tourists.
4. FOREST POLICIES LEGISLATION AND INSTITUTIONS
The revised mandate for Government with respect to forestry is to formulate and implement soundforest policies, plans and programmes towards sustainable development, management andutilisation of all forest resources in the country. Presently, the review of the Swaziland Forest Policyand Legislation is in progress with financial assistance from Denmark through the DANCEDProject (1998-2001) - see project document for more details.
Forest policy objectives may be summarised as follows:
To achieve efficient, profitable and sustainable exploitation of forest resources.To increase the role that forestry plays in environmental protection, conservation of plant andanimal genetic resources and rehabilitation of degraded lands.
Institutional Strengthening: Institutional strengthening and capacity building of the ForestrySection is still weak with limited professional and technical staff. The restructuring programme toupgrade the Section into a department by the year 2000 is in progress and highly considered by theMinistry's restructuring process.
Sustainable Forest Management: Environmental issues related to sustainable forest managementinclude: deforestation, inadequate management, habitat destruction and alien spp encroachment,loss of water resources due to excessive evaporation in commercial plantations (which exceed therate of replacement of ground water), bush fires, and legislation.
Biodiversity: Environmental issues related to biodiversity and ecosystem sustainability: Ignoranceabout the value of conservation, conflicts with local communities, lack of resources, support fromgovernment, alien plant control, indigenous knowledge systems, pollution, resource inventories, ex-situ inventories, levels of protection and outdated, conflicting and fragmented legislation. A leadconsultant from the University of Swaziland with the assistance of the National Steering Committeeof the Biodiversity Strategy and Action plan is working hard towards the establishment andimplementation of an action plan for the conservation of biodiversity in Swaziland.
Environmental issues relates to soil and water conservation: Land degradation, includingdeforestation, soil depletion, loss of habitat, declining biodiversity, watershed and rangedegradation, unsuitable land use and land management, loss of arable land to settlements, industryand infrastructure, pollution, water management and water quality (SEAP 1992).
Taxation: Presently there is no system through which users of forest products outside plantationforests and protected areas can be taxed.
4. CONCLUSION
Without an up-to-date National Forest Inventory and a study on the rate of deforestation andutilisation of forest products, it is difficult to make any projections for demand and supply offorestry products.

SWAZILAND COUNTRY REPORT
WORKSHOP PROCEEDINGS FORESTRY STATISTICS – MUTARE, ZIMBABWE (30 Nov. – 4 Dec. 1998)
114
The forest section in Swaziland is highly imbalanced: there are excellent silviculture andmanagement facilities available in Swaziland, including advanced research operations in the privatesector, while, at the same time, there is a serious lack of trained personnel in silviculture andmanagement in the government forestry section. There is therefore a serious need to embark on arecruitment campaign for professional officers, and to define a clear forestry managementprogramme. The new forest policy will hopefully be in place by year 2001-2002.
BIBLIOGRAPHY
National Forestry Research plan (1992).
Swaziland Environment Action Plan (1997).
Document on Review of Forest Policy and Legislation (1997).
National Development Plan (1996/97 - 1998/99).

ZAMBIA COUNTRY REPORT
WORKSHOP PROCEEDINGS FORESTRY STATISTICS – MUTARE, ZIMBABWE (30 Nov. – 4 Dec. 1998)
115
REPORT ON THE ZAMBIAN FORESTRY STATISTICS
byC. M. Taulo and J. MulombwaMinistry of Environment and Natural ResourcesForestry Department, Zambia
1. INTRODUCTION
1.1. The country
Zambia is a landlocked Central African country lying between latitudes 8oS and 18oS, and betweenlongitudes 22oE and 34oE. It shares borders with Angola, Democratic Republic of Congo, Tanzania,Malawi, Mozambique, Zimbabwe, Botswana and Namibia. The total surface area of the country isabout 752, 614 km2 most of which is plateau between 1,000 and 1,600 metres above sea level. 9%of this area is gazetted forest estate.
The country has a sub-tropical climate, with a warm wet season from mid November to April, a cooldry season from May to August and a hot dry season from September to mid-November. Theaverage annual rainfall decreases from about 1,300 mm in the north-west to about 800 mm in thesouth-west.
The greater part of the country is covered by the deciduous woodland often referred to as the“Miombo”. The structure and composition of this vegetation varies in soil quality, rainfall andtreatment. It ranges from tree grassland in the lower and drier areas to what is almost dry deciduousforest in the areas of high rainfall and deep soils. Much of this is not within reach of theconsumption centres, and, the slow growth and low volume production of the woodlands togetherwith the intractable nature of their timber render them unsuitable as providers of purpose timbers.
According to the 1994 estimates, Zambia’s human population stands at 9.3 million with a growthrate of 3.5% per annum. This means that, at the moment, the country’s population density is about10.4 persons per square kilometre.
1.2. The economy
The Zambian economy which was solely based on the copper production and export has sufferedfrom lack of real economic growth. According to the available information on the economic growthof the country, the real Gross Domestic Product fell 2.5% in 1992, by 3.1% in 1994, and by 4.3% in1995 (ZFAP, 1997). The economy of Zambia is heavily depended on the copper earnings whichaccount for about 90% of export earnings and contributes about 50% to government revenue.
With the depression of the copper industry and lack of an alternative industry, the Governmentattempted to maintain the standard of living of relatively privileged urban residents by strengtheningregulations, by intervening in the economy and tightening the control over farm villages. TheGovernment’s policy was to subsidise the maize (staple food) price and to set up a uniformproducer’s price for the entire country. This was an excessively heavy burden on the Government,bringing about a budget deficit and the deepening of aid dependency.

ZAMBIA COUNTRY REPORT
WORKSHOP PROCEEDINGS FORESTRY STATISTICS – MUTARE, ZIMBABWE (30 Nov. – 4 Dec. 1998)
116
As a result, the Structural Adjustment Programme (SAP), under the International Monetary Fund(IMF) and the International Bank of Reconstruction and Development (IBRD) aimed at decreasingsuch government regulations and interventions was ushered into the Zambian economy. A strongpower base was needed to promote the structural adjustment.
Zambia’s debt was incurred when the inflation rate became higher than the interest rate. Conditionshave changed and Zambia is caught in a trap. Zambia’s bilateral Paris Club debt was US$ 3.2billion, its multilateral debt to the IMF, World Bank and others was US$ 3.2 billion in 1997(Zambia’s Business Magazine, No. 7/2, July 1998 ). A certain amount of debt forgiveness may beappropriate, but it is likely to materialise only if the Government takes genuine measures tofacilitate the stability of the local industries.
1.3. The economic position of forestry and forest products industry
In considering the general economic conditions of Zambia in terms of GDP, the forestry sectorgenerated US$ 26.2 million, on average, per year over a five year period (1989–1993), representing0.9% of the country’s GDP. The forest product industry is included in the miscellaneous sector ofthe manufacturing industry, and the figures, unfortunately, are not available. During the sameperiod, this industry contributed US$ 395.7 million, accounting for 13.5% of the country’s GDP.
1.4. Social and human context for forestry
Forests and forestry are very important factors in the socio-economic well being of the peopleZambia. The forests are valuable in many ways, they provide shelter, food and medicines andwoodfuel which is the main source of domestic energy for the majority of the Zambian people.
Forests also play a very important role in the creation of the employment opportunities, thuscontributing to the income generation and the uplifting of the living standards of Zambians.
2. FOREST RESOURCES
2.1. Land ownership
Ownership of all land in Zambia is vested in the President of the Republic who holds it in perpetuityfor and on behalf of the people of Zambia. For the purpose of administration, the land is dividedinto state land and customary or traditional land.
State land is administered by the Commissioner of Lands, and is largely used for development worksuch as the urban settlements, mineral exploration and commercial farming. Customary land isadministered by the traditional rulers and is used by individuals or families in rural communities.State land covers about 3.5% of the total land and customary land covers about 96.5%.
Land holding in state land is based on renewal leasehold titles up to 99 years. In the customary land,an individual who has been allocated land by the traditional ruler returns ownership by cultivation,which includes fallow, and may pass ownership to his or her descendants or relatives. Under thecustomary tenure, land is not sold but, can be inherited though it is now possible to convertcustomary tenure into lease hold with the approval of the chief or local authorities.
ZAMBIA COUNTRY REPORT
WORKSHOP PROCEEDINGS FORESTRY STATISTICS – MUTARE, ZIMBABWE (30 Nov. – 4 Dec. 1998)
117
2.2. Land use
The major land use systems in Zambia are outlined as follows:
Land use Extent (million hectares) Sub Area Total
Forests Forest reserves 7.2 National parks 6.4 Game management areas 15.6 Forests in open areas 15.4 Total Forest Area 44.6Agriculture 15.1Councils and Settlements 7.2Swamps and Grassland 7.5Water 0.8TOTAL 75.2
SOURCE: Alajarvi , 1996.
Due to high population growth demand for more agricultural and settlement land is on the increase.Consequently, land under settlement and particularly under agriculture is rapidly increasing whilethat under forests is declining. Forest reserves in which, by law, settlements are prohibited, arebeing encroached and squatted..
2.3. Natural forest resources
Area: About 80% of the country is potential forest and woodland, but 20% has been converted toagriculture (MENR, 1994). The vegetation has been divided into four groups: closed forests, openforests or woodland, anthill vegetation and grassland.
Closed forests: On the basis of species composition and dominance, the closed forests, which aretwo or three stories are classified into the following categories:
Parinari forests;Marquesia forests;Cryptosepalum forests;Baikia forests;Itigi forests;Montane forests;Swamp forests; andRiparian forests.
Open forests or woodland: These are forests with less under wood or vegetation growth. These too,are subdivided into different types according to species composition and dominance. The main openforest type is the miombo woodland, which accounts for about 47% (or 35.34 million hectares) andis characterised by the Brachystegia, Isoberlina and Jubernardia species ( Sekeli, 1997). Others arethe Kalahari, Mopane, Munga, and Chipya .
Anthill vegetation: This occurs on the termite mounds and are found in different vegetation types.

ZAMBIA COUNTRY REPORT
WORKSHOP PROCEEDINGS FORESTRY STATISTICS – MUTARE, ZIMBABWE (30 Nov. – 4 Dec. 1998)
118
The common species found in the anthill vegetation are Boscia, Strychnos, Diospyros and Sterculia.
Grassland: This is land which naturally has no trees and found in places with permanently highwater table. Loudetia simplex is the most characteristic grass (Chidumayo, 1995). It includesbamboo, flood plains and swamps.
Table 5: Distribution of Land Cover Types in Zambia
land cover type area ( km2 ) Forest Dry evergreen 16, 060Deciduous 6,830Montane 40Swamps 1,530Riparian 810Plantation 500Chipya 15,560Thicket 1,900Miombo Woodland Wet 191,840Dry 119,620Kalahari 85,460Savannah Woodland Mopane 38,700Munga 32,600Termitaria 24,260Grassland Wetland 130,030
Dambo 76,320Open Water 10,500 TOTAL 752,560Source : Chidumayo, 1995
Volume: Reliable national wide information on the growing stock and growth levels does not exist(Alajarvi, 1996). Since the first forest inventory, covering the whole country, was conducted in the1960s, there has been no detailed forest inventory to determine or to asses the quantity and qualityof the country’s forest resources. Estimates of the forest cover, growing stock and stocking arebased on limited local level inventories and assumptions of changes over the past years.
The current estimates of the growing stock at are about 4,900 million cubic metres of cordwood,and the stocking density of about 75 m3 per hectare of stem wood.
Table 6: Estimated Growing Stock Volume
province stocking (m3 / ha) growing stock( million m3 )Central 82.88 176.03Copperbelt 154.00 657.20Eastern 84.98 344.65

ZAMBIA COUNTRY REPORT
WORKSHOP PROCEEDINGS FORESTRY STATISTICS – MUTARE, ZIMBABWE (30 Nov. – 4 Dec. 1998)
119
Luapula 41.16 112.46Lusaka 48.58 117.78Northern 40.32 173.10North Western 154.28 1,830.41Southern 64.68 234.38Western 144.20 1,263.43 TOTAL 4,909.44Source : Alajarvi , 1996.
Change of area and volume over time: Accurate information on the area and volume changes of theforest resources is lacking. Calculations and estimates of the changes are based on the 1965inventory that indicated that a total forest area of about 61.2 million hectares, representing 81% ofthe country’s total land area.
Estimates of the woodland in 1986 by FAO, by Woodroofe, was 58.194 million hectares indicatinga loss of about 3 million hectares over a period of three years. The estimates also put the annual lossof the forests at 0.5% which amounts to about 5.5% loss or 3.2 million hectares loss during the last11 years, thus reducing further the forest area to about 54.997 million ha.
There are, however, some variations in the estimates of the annual loss of the forests, with otherestimates indicating a much higher rate. These variations point to the fact that the actual situation isknown.
2.4. Planted forest resources
The common plantation tree species in Zambia are the exotic species of Pinus kesiya, Pinusoocarpa and Eucalyptus grandis. Pines cover about 80% of the plantation area. Almost all theplantations are owned by the Government through the Forest Department and the Zambia Forestryand Forests Corporation (ZAFFICO). The rotation periods vary from 15 to 25 years.
Plantation area: Plantations are estimated to cover 60,000 hectares of which about 50,000 hectaresare managed by ZAFFICO; 7,000 hectares by the Forest Department; and 3,000 hectares by theprivate sector.
Volume: According to Alajarvi (1996), the mean annual increment for the 25 year old Pine stand isabout 14.4 m3 per hectare, while that of the Eucalyptus stand is about 18.6 m3 per hectare perannum. The stocking density for the Pine and Eucalyptus is about 280 m3 per hectare and 300 m3
per hectare, respectively.
Change of area and volume over time: Statistical information on the area and volume changes existin scanty form. However, what is evident is that the plantation area is on the decline due to theunsustainable management practices. It is estimated that ZAFFICO is harvesting at the rate of about350,000 m3 per year resulting in the clearing of 1,000 ha while carrying out the annual planting andreplanting at the rate of 300 and 400 ha respectively. Similarly, the planting and replantingprogramme by the Forest Department is almost at a stand still, although harvesting from the oldstock has continued.
3. FOREST PRODUCTS PRODUCTION, TRADE & CONSUMPTION

ZAMBIA COUNTRY REPORT
WORKSHOP PROCEEDINGS FORESTRY STATISTICS – MUTARE, ZIMBABWE (30 Nov. – 4 Dec. 1998)
120
According to ZFAP (1997), the information regarding the forest products production, trade andconsumption statistical data in the country is scanty. However, the 1997 scenario is as shown in thefollowing table:
Table 7: Forest Products Production, Trade and Consumption
products production consumptionRound Wood 26,042,00 26,042,00Indust. Round Wood (m3) 319,000 319,000Sawn Wood (m3) 156,894 156,894Paper and Paper Board (Tonnes) 3,900 3,900
3.1. Woodfuels and wood energy
Woodfuel in Zambia plays a major role in the national energy supply. Woodfuel in the form offirewood and charcoal is the principal source of energy in the country accounting for about 68% onaverage of the total energy supply. The sectoral pattern of the woodfuel consumption is dominatedby households which consume 88%, and commerce and industry 9% (Chiwele, 1998).
Charcoal is the preferred form of wood energy among the urban households, and serves mainly as asource of income for the rural households. Firewood use on the other hand predominates in the ruralareas. Woodfuel use in the households include cooking, heating and lighting.
Industrial uses of woodfuel include smelting of copper in the mining industry, beer brewing,tobacco curing and fish preservation. Charcoal is also used in the copper refineries as a reducingagent (Chidumayo, 1988) .
Table 15: Energy consumption by source (TOE)
YearPetroleumProducts % Electricit
y% Coal % Woodfuel % Total
1986 505,000 12 553,300 13 338,800 8 2,879,082 67 4, 276,182
1987 545,000 13 560,400 13 286,800 6 2,922,800 68 4,314,660
1988 564,400 13 610,000 14 326,700 7 2,855,033 66 4,356,133
1989 698,200 16 524,500 12 304,300 7 2,914,905 66 4,441,905
1990 590,245 13 567,112 13 243,474 6 2,981,570 68 4,382,401
1991 631,374 14 517,317 12 239,457 5 3,063,053 69 4,451,202
1992 628,726 14 529,432 12 233,691 5 3,135,717 69 4,527,566
1993 514,685 11 545,785 12 229,546 5 3,210,457 71 4,500,473
1994 543,032 12 650,914 14 112,100 2 3,289,473 72 4,595,518
1995 572,883 12 635,279 14 95,502 2 3,367,086 72 4,670,750

ZAMBIA COUNTRY REPORT
WORKSHOP PROCEEDINGS FORESTRY STATISTICS – MUTARE, ZIMBABWE (30 Nov. – 4 Dec. 1998)
121
1996 565,402 12 567,107 12 239,400 4 3,449,552 72 4,821,461
Source: Chiwele, 1998
3.2. Wood supply from non forest areas
Trees in non-forest land-use areas or outside forests are estimated to cover an area of about 15.8million hectares according to Alajarvi, and have an estimated stocking of 5 cubic metres per hectare.Estimated growing stock at the 1996 levels was 81 million cubic metres.
Table 16 : Growing Stock by land Category in 1996 (Million M3)
provinces FR FOA GMA NP TOFCentralCopperbelt
49.74 0.17 115.83 0.17 10.12
Copperbelt 81.46 441.92 15.37 115.10 3.35Eastern 72.96 57.48 169.67 38.88 5.67Luapula 16.10 27.41 8.22 50.47 10.26 Lusaka 1.53 79.13 19.40 15.87 1.86Northern 45.91 21.32 72.45 17.47 15.95North Western 377.09 781.96 523.65 139.42 8.31Southern 43.96 39.42 77.48 63.46 10.07Western 90.21 298.63 748.55 110.63 15.41 TOTAL 778.96 1,747.44 1,750.61 551.44 80.99Source: Alajarvi, 1996FR = Forest Reserves, FOA = Forests in Open Areas , GMA = Game Management AreasNP = National Parks , TOF = Trees Outside Forest.
3.3. Non-wood forest products
Forests in Zambia produce or maintain a variety of non-wood products. The products are usuallyhunted for subsistence by the rural communities, although trade in these products is increasinglybecoming wide spread. Non-wood forest products in Zambia’s forests include: honey, mushrooms,insects, fruits, leaves, roots, fodder, grass, medicines and bush meat.
Collection of the non-wood forest products sometimes tends to have some negative impact on theforest ecosystem. Trees, for example, are cut down by the honey hunters to collect honey or aredebarked by the traditional bee-keepers to make bark hives. Trees are also quite often cut down bythe caterpillar collectors as an easy way of collecting caterpillars. Game hunters, especiallypoachers, are also in the habit of setting fire to the forests so that they could improve visibility.
3.4. Recreation and tourism
Game viewing, which is concentrated in the national parks and game management areas, is the maintourist attraction in the country. There are 19 national parks and 22 game management areas whichtogether cover an area of about 22 million ha. Miombo woodland is the most extensive vegetationtype in the national parks and game management areas (Chidumayo, 1995). Forests, therefore, bothas a habitat for wildlife and as a landscape, play an essential role in recreation and tourism.

ZAMBIA COUNTRY REPORT
WORKSHOP PROCEEDINGS FORESTRY STATISTICS – MUTARE, ZIMBABWE (30 Nov. – 4 Dec. 1998)
122
3.5. Recycling and other re-use of fibre
Information regarding the recycling and other re-use of the fibre materials is not readily available inthe country, although some recycling of paper is done by the Zambezi Paper Mill.
4. FORESTRY POLICIES, LEGISLATION, AND INSTITUTIONS
4.1. Forest management, law and policy
Until July 1998, the forestry sector was guided by a forest policy that was formulated and adopted in1965. This policy was heavily criticised and blamed for the poor performance of the forestry sectoras it tended to exclude other stakeholders from forest management and development , and toconcentrate the responsibilities in the hands of one institution (Forest Department) .
The new forestry policy which came into force in July 1998, encourages the participatory JointForest Management system with active involvement of the local communities and otherstakeholders in the protection , management and utilisation of forest resources.
Preparations for the new forestry legislation have also reached an advanced stage, and it is expectedthat before the end this year (1998), a new forestry act will be in place to facilitate theimplementation of the new forestry policy. At the time of writing this report, the Forests Act of1973 was still in force. This law recognises the Forest Department as the only institution to manageand control the utilisation of the forests resources in the country.
4.2. Private sector
The new forestry policy states that most commercial activities in forestry can be better handled bythe private sector while the Government creates an enabling environment for private sectorparticipation. Areas of intervention by the private sector include plantation establishment,management and utilisation of forest resources, harvesting and marketing of forest products anddevelopment of forestry industries and small scale enterprises.
4.3. Public sector
The role of the public sector (Government), represented by the MENR will be to formulate andreview the forestry policy and legislation, co-ordinate their implementation and ensure enforcementof rules and regulations pertaining to forestry development.
4.4. Investment in forestry and forestry products
Investment in forestry over the years has been minimal and the contribution of the forestry sector toGDP is reported to be only 0.9%. Many observers, however, say that this is an under estimate sinceit does not include forest products traded in the informal sector, and production by wood-basedindustries which is grouped under the general manufacturing sector ( Tables 2 , 8 to 14 ).
4.5. Institutional strengthening and capacity building
The Forestry Department is the only institution at the moment which has the overall field

ZAMBIA COUNTRY REPORT
WORKSHOP PROCEEDINGS FORESTRY STATISTICS – MUTARE, ZIMBABWE (30 Nov. – 4 Dec. 1998)
123
responsibility of managing and controlling the utilisation of the country’s forest resources. But theresources at its disposal are significantly inadequate. Because of this, the Department has not beenable to manage the forest resources professionally or fulfil its technical functions. In an effort torevitalise the forestry sector, the Government has taken a number of actions. These includerestructuring the Forest Department, review of the forest policy and legislation.
4.6. Environmental issues.
The main environmental issues in Zambia include: deforestation and forest degradation, soil erosionand fertility loss, land degradation in watershed areas, and loss of Biodiversity. Others are airpollution, water pollution, wildlife and fish depletion. The annual rate of deforestation in Zambia isestimated to be between 250,000 and 300,000 ha. This figure has not been current for a long timeand does not take into account the increasing population and the resulting increase in theconsumption of forest resources and the demand on forest land. The actual deforestation rate may,therefore, be higher than this.
4.7. Sustainable forest management
Due to lack of detailed inventory data and inadequate resources, forest management in Zambiacurrently is not based on sustainable practises. The only management activity at the moment iscontrol of forest exploitation through licensing. Minimum and maximum extractable volumes permonth, and minimum exploitable diameter are fixed for all commercial licences. But even this is notworking effectively due to difficulties in monitoring the activities of the licence holders.
4.8. Biodiversity and ecosystem sustainability
Conservation of the biological diversity and the ecosystems in Zambia date back to the 1930s whenthe first Government agencies mandated to conserve and manage biodiversity were established(MENR, 1997). The purpose was to protect and maintain the biological diversity for both faunal andfloral species while providing a sustainable flow of benefits. The two actors in biodiversityconsumption the Forest Department and the National Parks and Wildlife Service.
Biodiversity and ecosystem management has suffered, declining due to increased exploitation andreduced management capacity. The 1995 SADC report quoted by the MENR (1997) indicates that10 species of mammals, 10 species of birds, 2 species of reptiles, and 7 taxa of plants are classifiedas endangered.
The challenge for the nation, therefore, in biodiversity sustainability is to halt the decline in thespecies population.
4.9. Soil and water conservation
Zambia’s forest cover plays an important role in soil and water conservation because its influenceon water run-off and soil stability. A number of forest reserves have been established in hilly areasand areas of shallow soils to prevent soil erosion. Others have been established in main catchmentareas for the purpose of maintaining water sources and the flow of rivers. The rampant forestdestruction, however, has not spared such protection forests, and the problem of soil erosion isevident in many areas. Drying up of streams and rivers due to siltation is also very common and thisis causing local shortages of water.
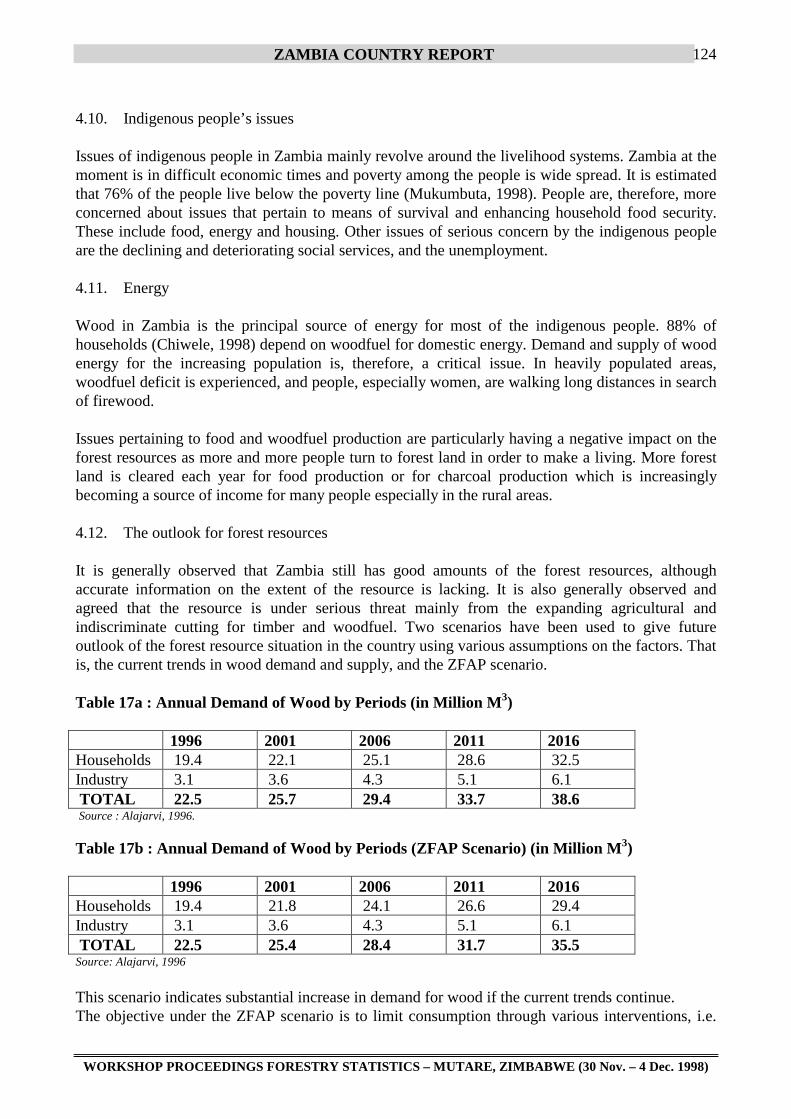
ZAMBIA COUNTRY REPORT
WORKSHOP PROCEEDINGS FORESTRY STATISTICS – MUTARE, ZIMBABWE (30 Nov. – 4 Dec. 1998)
124
4.10. Indigenous people’s issues
Issues of indigenous people in Zambia mainly revolve around the livelihood systems. Zambia at themoment is in difficult economic times and poverty among the people is wide spread. It is estimatedthat 76% of the people live below the poverty line (Mukumbuta, 1998). People are, therefore, moreconcerned about issues that pertain to means of survival and enhancing household food security.These include food, energy and housing. Other issues of serious concern by the indigenous peopleare the declining and deteriorating social services, and the unemployment.
4.11. Energy
Wood in Zambia is the principal source of energy for most of the indigenous people. 88% ofhouseholds (Chiwele, 1998) depend on woodfuel for domestic energy. Demand and supply of woodenergy for the increasing population is, therefore, a critical issue. In heavily populated areas,woodfuel deficit is experienced, and people, especially women, are walking long distances in searchof firewood.
Issues pertaining to food and woodfuel production are particularly having a negative impact on theforest resources as more and more people turn to forest land in order to make a living. More forestland is cleared each year for food production or for charcoal production which is increasinglybecoming a source of income for many people especially in the rural areas.
4.12. The outlook for forest resources
It is generally observed that Zambia still has good amounts of the forest resources, althoughaccurate information on the extent of the resource is lacking. It is also generally observed andagreed that the resource is under serious threat mainly from the expanding agricultural andindiscriminate cutting for timber and woodfuel. Two scenarios have been used to give futureoutlook of the forest resource situation in the country using various assumptions on the factors. Thatis, the current trends in wood demand and supply, and the ZFAP scenario.
Table 17a : Annual Demand of Wood by Periods (in Million M3)
1996 2001 2006 2011 2016Households 19.4 22.1 25.1 28.6 32.5Industry 3.1 3.6 4.3 5.1 6.1 TOTAL 22.5 25.7 29.4 33.7 38.6 Source : Alajarvi, 1996.
Table 17b : Annual Demand of Wood by Periods (ZFAP Scenario) (in Million M3)
1996 2001 2006 2011 2016Households 19.4 21.8 24.1 26.6 29.4Industry 3.1 3.6 4.3 5.1 6.1 TOTAL 22.5 25.4 28.4 31.7 35.5Source: Alajarvi, 1996
This scenario indicates substantial increase in demand for wood if the current trends continue.The objective under the ZFAP scenario is to limit consumption through various interventions, i.e.

ZAMBIA COUNTRY REPORT
WORKSHOP PROCEEDINGS FORESTRY STATISTICS – MUTARE, ZIMBABWE (30 Nov. – 4 Dec. 1998)
125
increasing charcoal production efficiency by 8%, and reducing consumption of wood by 20%.
Table 18a: Cordwood Supply (Current Trends), Growth in Million M3 / Annum.
1996 2001 2006 2011 2016Forests in open areas 16.7 15.3 14.0 12.8 11.6Forest reserves ( without plantations ) 11.4 11.3 11.3 11.2 11.1Plantations 0.9 0.8 0.8 0.8 0.8Game Management Areas 16.6 16.6 16.6 16.6 16.6Trees outside Forests 1.6 1.5 1.5 1.4 1.3National Parks 1.1 1.1 1.1 1.1 1.1 TOTAL 48.3 46.7 45.3 43.9 42.5Source: Alajarvi, 1996
The 1996 cordwood supply level of 48.3 million cubic metres is expected to decrease to 42.5million cubic metres in the year 2016 under the current trends due to deforestation, degradation andlack of management.
Table 18b : Cordwood Supply By Periods (ZFAP Scenario), growth in Million M3/Annum.
1996 2001 2006 2011 2016Forests in open areas 16.7 17.4 18.7 20.5 22.7Forest Reserves(without plantations) 11.4 12.6 14.0 15.6 17.3Plantations 0.9 1.0 1.1 1.2 1.4Game Management Areas 16.6 16.6 16.6 16.6 16.6Trees Outside Forests 1.6 1.7 1.8 2.0 2.1National Parks 1.1 1.1 1.1 1.1 1.1 TOTAL 48.3 50.4 53.3 57.0 61.3Source: Alajarvi, 1996
Under this scenario, the annual cordwood supply is expected to increase to 61.3 million cubicmetres by 2016 because of intensified management activities.
4.13. Wood supply and demand balance
The balance of supply was estimated separately in production forests(Forest Reserves and Forests inOpen Areas) and other tree producing areas(Trees Outside the Forest), and then for protected forests(Game Management Areas and National Parks). The first production of wood was consideredfeasible and the second not sustainable in the long term (as it comes from conservation areas). Thebalance of this two cases is presented as follows:
Table 19a : Annual Cordwood Supply & Balance (Current Trends) in Million M3/Annum.
1996 2001 2005 2011 2016Supply From Production Areas 30.6 29.0 27.5 26.2 24.8Supply From Protected Areas 17.7 17.7 17.7 17.7 17.7Demand 22.5 25.7 29.4 33.7 38.6Balance Not Sustainable 25.8 21.0 15.8 10.2 3.9Balance Sustainable 8.1 3.3 - 1.9 -7.5 -13.8

ZAMBIA COUNTRY REPORT
WORKSHOP PROCEEDINGS FORESTRY STATISTICS – MUTARE, ZIMBABWE (30 Nov. – 4 Dec. 1998)
126
Source : Alajarvi, 1996
Table 19b : Annual Cordwood Supply and Balance (ZFAP Scenario) in Million M3 / Annum.
1996 2001 2006 2011 2016Supply From Production Areas 30.6 32.7 35.6 39.3 43.5Supply From Protected Areas 17.7 17.7 17.7 17.7 17.7Demand 22.5 25.4 28.4 31.7 35.5Balance Not Sustainable 25.8 25.0 24.9 25.3 25.7Balance Sustainable 8.1 7.3 7.2 7.5 8.0Source : Alajarvi, 1996
5. CONCLUSION
It is generally observed that Zambia still has sufficient indigenous forest resources which, ifproperly managed will greatly contribute to the socio- economic development of the country. But,the extent and condition of these forest resources are not accurately known due to lack of nationaldetailed forest inventory. What is known about the country’s forest resources is based on theinventories from the 1960s and the assumptions of that time.
It is also generally observed and agreed that forest resources in the country are facing serious threatsof destruction mainly through clearing of the forest land for agriculture, and the uncontrolled woodharvesting for timber and woodfuel. However, there is no accurate information on the extent andrate of forest destruction as different estimates have arrived at conflicting figures.
The need, therefore, for the national wide forest inventory is urgent in order to facilitate thesustainable management of the forest resources. This will also help to guide the investment into theforest-based industries.
REFERENCES
Alajarvi P.(1996). Forest Management planning and inventory, Draft Report, ZFAP.
Chidumayo E.,(1995). Handbook of Miombo Ecology and Management.
Chiwele P.,(1998). Marketing of wood and non-wood products, First Draft.
FAO (1991). Forestry Statistics Today For Tomorrow: Wood and Wood Products.
FAO ( 1989 ). FAO Year Book, Volume 43.
GRZ/IUCN (1985). The National Conservation Strategy For Zambia.
JICA (1996). The Forest Resources Management Study for the Zambia Teak Forests in the SouthWestern Zambia.
MENR, (1998). Proposal for the Formation of the Zambia Forestry Commission.
MENR,( 1997). Challenges and opportunities for development, ZFAP document Volume 2.

ZAMBIA COUNTRY REPORT
WORKSHOP PROCEEDINGS FORESTRY STATISTICS – MUTARE, ZIMBABWE (30 Nov. – 4 Dec. 1998)
127
MENR, (1994). The National Environmental Action Plan.
Mukumbuta B. N.(1998). Socio-economic survey of communities in Central, Lusaka andCopperbelt provinces.
Sekeli P. (1997). Tree Seedling Production Techniques and Management of Forest Plantations inZambia (Proceedings of the Meeting in Tanzania).
Simpson, D (1998). We Shall All Dig Deeper: In Profit, Zambia’s Business Magazine No. 7/2, July1998.

ZIMBABWE COUNTRY REPORT
WORKSHOP PROCEEDINGS FORESTRY STATISTICS – MUTARE, ZIMBABWE (30 Nov. – 4 Dec. 1998)
128
THE STATUS OF FORESTRY STATISTICS IN ZIMBABWE
byD. P. Gwaze and C. MarundaForestry Commission,Zimbabwe
1. INTRODUCTION
Forestry information was obtained from extensive literature on the extent of forest resources,ownership, species, composition, volumes, age, trade, consumption, value of forest products,projected demand and supply, and employment.
Information on plantations was adequate, but information about indigenous forests was inadequateand is unlikely to be obtained in the near future given the financial and methodological constraints.This lack of certain information on indigenous forests compromises the efficiency of planning andmanagement of these forests. There is need to develop methodologies for collecting data particularlyfor non-wood forest products and provide adequate financial resources for collecting information onindigenous forests to improve planning and management of these forests. The FAO-EC PartnershipProgramme on “Data Collection and Analysis for Sustainable Forest Management - LinkingNational and International Efforts” provides an opportune time for Zimbabwe to developmethodologies for collecting information on products from natural forests.
2. BACKGROUND
2.1. Location and area
Zimbabwe is a member of the ten SADC member states. It is a land-locked country bordered byMozambique on the east, South Africa on the South, Botswana to the west and Zambia to the north.It is located between latitudes 16030' and 22030' S and longitudes 250 and 330 E.
Zimbabwe covers an area of 390,757 km2. One-fifth of the country is over 1,200 m (highveld),three-fifths between 600 and 1,200 m (middle veld) and one-fifth is below 600 m in altitude. Mostof the country is subtropical except low-lying valleys which experience tropical conditions.
2.2 Population
The estimated population of Zimbabwe is 12 million. The population growth rate is 3.3% a year.The fertility rate is six children per family, causing a projected doubling of population every 20years. Rapid population growth puts intense strain on natural resources. Table 1 shows therelationship between land area under different tenure categories, population density, farmingpotential and woodland area in the different tenure-systems in Zimbabwe. The table indicates thatthe majority of the population in Zimbabwe is rural and is concentrated in areas with poor farmingpotential and low woodland resources.
Zimbabwe's population density is 27 people per square kilometre. In comparison, the populationdensity in Zambia is 113 and in Malawi 162 persons per square kilometre. Population growth in

ZIMBABWE COUNTRY REPORT
WORKSHOP PROCEEDINGS FORESTRY STATISTICS – MUTARE, ZIMBABWE (30 Nov. – 4 Dec. 1998)
129
Zimbabwe is especially worrying considering the high pressure on forest resources.
Table 1. Relationships between population density, woodland cover and farmingpotential in the main land tenure categories of Zimbabwe.
Characteristics Land tenure categoryCommunal land Resettlement land Commercial
farmsState land
Land areaa) area(ha)b)% of total land area
a) 16,360, 000b) 42%
a) 3,790,000b) 8%
a) 12,450,000b) 31%
a) 6,970,000b) 18%
Farming potentialnatural regions
poor farm land 74%of the communallands are underNatural regions IVand V
mixed spread over allNatural regions.56% of resettlementland is in NaturalRegion II and III
good farm land,spread over allNatural Regions.63% of land isunder NaturalRegions I and II
Poor farm land.80% of state land isin Natural RegionsIV and V.
Populationa) totalb) densityc)% rural population
a) 5,352,304b) 32 pers/km2
c) 74%
a) 426,687b) 11 pers/km2
c) 6%
a) 1,346,753b) 10 pers/km2
c) 19%
a) 38,806b) < 2 pers/km2
c) < 1%Woodland areaa) area (ha)b)% of total woodlandarea
a) 10,000,000b) 43%
a) n.ab) n.a
a) 7,000,000b) 30%
a) 6,000,000b) 26%
2.3 Rainfall & temperature
The rainy season for most of Zimbabwe is from November to March, but along the eastern borderrainfall also occurs at other times of the year. In general, rainfall increases from south to north andwith increasing altitude. Areas in the low-veld receive less than 400 mm/year, while those in theeastern highlands more than 2,000 mm/year and those in the central watershed about 1,000mm/year. Mean annual temperature is 150C at 1,800 mm, 180C at about 1400 m, 230C at 450 mabove sea level. The highest temperatures are experienced in October and November, but whenprolonged dry spell occurs, very high temperatures are recorded in December and January (450C hasbeen recorded in low-lying areas). The temperatures are also influenced by soil type. Lowesttemperatures are found in very sandy soils that cool more rapidly than clay soils.
2.4. Natural regions
Differences in rainfall patterns, altitude and temperature give rise to five agro-ecological regions:
Natural Region I is situated along the eastern highlands of the country and is defined as thespecialised and diversified farming region. It has high effective rainfall and is thus suitable forafforestation using pines, eucalyptus, wattle, horticulture, tea and coffee plantations, and intensivelivestock production.Natural region II has reliable a rainfall pattern and is suitable for intensive crop (maize, tobacco andcotton) and livestock production. The region produces 90% of the country's crop.Region III is a semi-intensive farming region receiving between 650 and 800 mm of rainfall peryear, but the rainfall pattern is not reliable. Therefore, the region is suitable for livestock productionand growing of short-season crops.Region IV experiences fairly low total rainfall and is subject to periodic seasonal droughts and

ZIMBABWE COUNTRY REPORT
WORKSHOP PROCEEDINGS FORESTRY STATISTICS – MUTARE, ZIMBABWE (30 Nov. – 4 Dec. 1998)
130
extended dry spells making the region unsuitable for cropping. Therefore appropriate systems in thisregion are based on livestock ranching and wildlife utilisation.Region V represents the hot and dry areas below altitude of 900 m and follows the major riversystems (Zambezi, Limpopo and Save). This is the extensive farming region and is suitable forlivestock ranching and wildlife utilisation.
2.5. Macro economic policies
Zimbabwe’s economic policies are based on the Economic Structural Adjustment Programme(ESAP, 1991-1995) and Zimbabwe Programme for Economic and Social Transformation(ZIMPREST, 1996 - 2000) which are supported by the International Monetary Fund (IMF) and theWorld Bank. The economic policies include tight fiscal controls, removal of subsides and openingup of foreign investment. One of the vehicles that the economic policies delivered is the PublicEnterprise Reform. It is designed to reduce public enterprise reliance on taxes. Such enterpriseswere expected to operate more efficiently and effectively in the commercial environment usingprivate sector measures and to encourage competition in the industry. The Forestry Commissionbeing a public enterprise is being restructured in response to this policy. These policies haveresulted in less budgetary allocations to government departments including those in the naturalresources sector leading to inability of these respective departments to effectively regulateexploitation of natural resources.
For the natural resources sector (including forestry), ZIMPREST proposes the formation of anoverarching policy which includes:
land reforms,drought mitigation,research and extension,promotion of sustainable, balanced, utilisation of natural resources for economic and socialdevelopment.
Zimbabwe’s per capita income in 1996 was US$ 718, and it is likely to be much lower now duedrastic devaluation of the Zimbabwe dollar (exchange rate was Z$ 10 per US$ 1 in 1996 and inNovember 1998 it is Z$ 37 per US$ 1) and high inflation. Zimbabwe’s economic structure isdominated by agriculture, manufacturing and service provision. Manufacturing contributes for 25%of GDP. Forestry for about 3%. The timber industry contributes 8% to the manufacturing value.Forestry contribution to the economy is largely based on the wood processing industry (plantationsof exotic species, particularly pine and eucalyptus).
Natural resource conservation and use, at the provincial level, are coordinated by the ProvincialCouncil, at district level by the District Council and at the local level by traditional chiefs.
3. FOREST RESOURCES
3.1. Extent of forest resources
Forest (both natural and plantations) and woodlands in Zimbabwe cover about 66% of the total landarea of the country (39 million ha) (Table 2). About 40% of the indigenous woodlands are situatedin communal areas where they are traditionally exploited for fuelwood and pole supply. There is a

ZIMBABWE COUNTRY REPORT
WORKSHOP PROCEEDINGS FORESTRY STATISTICS – MUTARE, ZIMBABWE (30 Nov. – 4 Dec. 1998)
131
decline in woodlands due mainly to clearing for agriculture, and partly due to fuelwood and polecollection, infrastructural development and overstocking of domestic animals. Approximately100,000 ha are cleared annually (Gondo and Mkwanda 1991). Most forest cover in the gazettedstate forests, commercial farming areas and the eastern highlands of the country. The currentassessment do not give estimates of woody biomass in natural woodlands except where commercialtimber extraction is taking place. Exotic plantations cover about 156,000 ha (0.4% of the country) ofwhich 90% is located in the high altitude, high rainfall eastern highlands.
Table 2. Estimates of extent of each land use system in Zimbabwe
Land use Area (000 ha) % of total areaRain Forest 12 0,03Plantation 156 0,40Indigenous woodlands 25 772 66,00Grasslands 1,894 5,00Cultivated land 10,738 27,00Settlements 139 0,36Other (waters, rocky outcrops) 257,500 0,70Total 39, 090 100,00
Source: Forestry Commission (1996)
3.2. Vegetation types
The indigenous woodlands and bushlands can be divided into 5 types (Bradley & McNamara,1993):
Miombo woodland is dominated by Brachystegia spiciformis in association with Julbernardiaglobiflora. It covers most of the highveld at altitudes above 1200 m. The woodland is normallyassociated with sandy soils.
Mopane woodland is characterised by the species Colophospermum mopane and occurs at lowaltitudes below 900 m, where the climatic conditions are hot and dry. The woodland is normallyassociated with clay soils.
Teak Woodlands are found on the aeolian Kalahari sands in the north west of the country. Thewoodlands are characterised by Baikiaea plurijuga which grows in association with Pterocarpusangolensis and Guibourtia coleosperma mainly. These species are the main sources ofcommercially exploitable timber.
Acacia woodlands are dominated by various acacia species, depending on soil type.
Terminalia combretum woodlands are characterised by Terminalia sericea and Burkea africanaspecies.
The distribution of the major vegetation types are shown in Table 3.
Table 3. Distribution of the major woodland types by land tenure category in Zimbabwe (1,000 ha)

ZIMBABWE COUNTRY REPORT
WORKSHOP PROCEEDINGS FORESTRY STATISTICS – MUTARE, ZIMBABWE (30 Nov. – 4 Dec. 1998)
132
Vegetation type Communal Private State TotalMiombo 671 158 1,037 35,666Mopane 22,264 3,520 2,395 8,180Teak 16 206 981 1,365Others 237 1,501 1,129 2,868Total area 3,333 7,085 5,542 15,960
Source: Coopers and Lybrand 1985
3.3. Indigenous forests
Indigenous woodlands are quite extensive. The woodlands are divided into communal areas (CA),resettlement areas (RA), large scale commercial farming area (LSCFA) and gazetted state forests.The CA woodlands provide rural households with firewood, merchantable timber, constructiontimber, browse, fruits, medicines, mushrooms, bark and many other non-timber products. Thewoodlands are severely degraded due to over-exploitation as a result of high population growth,insecurity of tenure (communal ownership), agricultural expansion and conflicting land use policies.The RAs were once commercial farms and were endowed with tree resources. Because ofpopulation influx into these areas, the RA woodlands are now experiencing high rates ofdeforestation as land is cleared for farming. The woodlands found on the LSCFA’s are fairly intactas the demand for forest resources (e.g. firewood) is low when compared to the CA and RAwoodlands. The woodland areas in the different land use categories are given in Table 1.
The gazetted forests or forests reserves are divided into two categories. The first category are thewoodlands found on the Kalahari sand formation spread in the north western part of the country.The woodlands contain commercially productive species such as Pterocarpus angolensis (Mukwa)and Baikiaea plurijuga (Red Mahogany). Table 4 shows the list of the gazetted state forests and theareas they cover.
Table 4. List of gazetted forest in Zimbabwe under management of the Forestry Commission
Name of Forest Area (ha)Chesa 14,250Inseze 8,400Umgusa 32,200Gwaai 144,230Ngamo 102,900Nyamandlovhu (Grants/Batley) 7,420Mbembesi 55,100Lake Alice 39,000Gwampa 47,000Mzola 67,200Sikumi 54,400Kazuma 24,000Fuller 23,300Panda-Masui 35,500Kavira 28,200Sijarira 25,600Molo 2,900Umzibane 2,471

ZIMBABWE COUNTRY REPORT
WORKSHOP PROCEEDINGS FORESTRY STATISTICS – MUTARE, ZIMBABWE (30 Nov. – 4 Dec. 1998)
133
Mvutu 2,100Mafungautsi 82,100Ungwe 567Mudzongwe 1,420Total (22) 800,258
The woodlands are also an important habitat for wildlife and have recently become vital to thetourism industry. Because of increasing population pressure, these woodlands are under pressure forthe provision of services such as grazing, land and other forest products from legal and illegalsettlers living in or on the periphery of these forests. The other category of gazetted forests are theremnant mid-altitude montane forests found in the eastern highlands. These are currently protectedfor biodiversity, cultural and scientific values.
The Forestry Commission, through its Research and Development Division, also manages theChirinda Forest which is a mid-altitude afromontane forest located in the south eastern highlands. Itis about 700 ha in size and is a centre of endemism for many plants and animal species.
3.4. Wood stocks demand and supply
Generally the woodlands in Zimbabwe have very low growth rates averaging 0.8 m3/ha/year. Thiscoupled with the high population pressure has resulted in the fragmentation of the communalwoodlands. The official deforestation rate in Zimbabwe is about 100,000 ha/year, or 0.6% of thetotal forest area, translating into about 7 million m3 of woody biomass. The demand for fuelwood,which is the main product from natural woodlands, is estimated to be 13 million m3 per year. Table5 shows the estimate of total wood stocks of natural forests and woodlands.
Table 5. Estimate of total wood stocks of natural forests1 and woodlands
Land tenure category Wood stocks (million tonnes)Communal Land 104Resettlement Land 11Commercial Land 252National Parks 269Forest Reserves 1TOTAL 637
1plantation forests are not included
Natural woodlands are also a source of fuelwood, fodder, construction timber, fencing poles, fruits,and grass. These products form the basis for woodland enterprises. There is not much informationavailable about trees and forestry enterprises, but it is reported that 10-20% of rural households usewoodland resources mainly as alternative sources of income (Bradley and Dewees 1993). Benefitsfrom woodlands in Zimbabwe can be placed in the following categories; direct, local privatebenefits (e.g. fruits, fuelwood), indirect, local private benefit (e.g. nutrients, fodder and browse),indirect regional and semi-public benefits (e.g. soil erosion control, water catchment and recreation)and indirect global public benefit (e.g. carbon sequestration and biodiversity conservation).
Empirical data to quantify values is not available except in a few case studies in different parts ofthe country. For example, the wood carving industry which has mushroomed along the major touristroutes records monthly incomes ranging from Z$ 42 to Z$ 4,000 per month (Matose et. al, 1996). It

ZIMBABWE COUNTRY REPORT
WORKSHOP PROCEEDINGS FORESTRY STATISTICS – MUTARE, ZIMBABWE (30 Nov. – 4 Dec. 1998)
134
is therefore difficult to give a global figure of the total contribution to the national economy, but itsuffices to quote that "indigenous woodland management holds the potential for generatingfavourable returns compared to other land use options particularly in the drier parts of the country"(World Bank 1991). Table 6 shows values of some common forest products obtained from naturalwoodlands.

ZIMBABWE COUNTRY REPORT
WORKSHOP PROCEEDINGS FORESTRY STATISTICS – MUTARE, ZIMBABWE (30 Nov. – 4 Dec. 1998)
135
Table 6. Value of common forest products and services based on a case study in Zimbabwe. Product Value Z$/ha Share
Wild fruits 65 33Woodfuel 42 21Nutrient cycling 32 17Construction wood 27 14Wild foods 15 8Grazing 5 3Wooden implements 4 2Wooden crafts 3 2Source: Campbell et al. 1993
Fuelwood is one of the major sources of energy in Zimbabwe constituting about 52% of the totalenergy consumption. About 80% of the rural households depend on fuelwood for energy used incooking, brick making, beer brewing, tobacco curing and heating. Fuelwood resources in accessiblewoodlands cover about 20% of the total land area representing a stock of 320 million metric tonnes,with a sustainable yield of 13 million metric tonnes per annum. Although this sustainable yield isable to meet the total national demand, there are localised shortages in most districts creating theneed for local trade. However, there is little trade in fuelwood due to low trading margins, mostpeople harvest for personal consumption. Fuelwood consumption in wood deficient districts is usingup accessible stock in wood rich areas leading to increased cost of supply and further degradation ofthe woodland resources. The appropriateness of investment in interventions such as tree plantingand woodland management depends on the relationship between cost of such intervention to theeconomy compared to the cost of providing alternative sources of energy. Thus tree planting haslargely been funded by donor agencies (Rural Afforestation Programme- Phase I funded by theWorld Bank and Phase II funded by DANIDA) instead of government.
Timber harvesting concessions are issued in communal area (managed by Forestry ExtensionDivision) and gazetted state forests (managed by Indigenous Resources Division). The ForestryCommission stopped harvesting of logs in 1987 in the gazetted state forest as response todiminishing resource base. Limited harvesting has just re-begun. A total of 18,431 m3 was extractedin 1995/96 raising Z$ 456,364 from communal areas.
3.5. Commercial plantations
The major forest plantation species grown in Zimbabwe are Pinus patula, P. elliottii and P. taeda,Eucalyptus grandis, E. cloeziana and Acacia mearnsii. The pines are used mainly for structuraltimber production, and pulp and paper; eucalyptus for poles, and pulp and paper, and the black-wattle (A. mearnsii) for the production for tannin. Exotic plantations cover about 156,000 ha (Table2). Figure 1 shows the percentage areas planted under the major commercial species in Zimbabwe.

ZIMBABWE COUNTRY REPORT
WORKSHOP PROCEEDINGS FORESTRY STATISTICS – MUTARE, ZIMBABWE (30 Nov. – 4 Dec. 1998)
136
Figure 1. Percentage of area planted under the major commercial species
Pines 72.0%
Eucalypts13.0%
Wattle15.0%
The state owns 42% total forestry plantations, private companies 54% and small growers 4%. Themajor forest companies in the country are vertically integrated to include plantation developmentand saw-milling. Other primary processing plants include manufacturing of doors, block boards,plywood, pulp and paper, and treated poles. The timber industry contributes 3% to the GDP. Directjobs involved in plantation and processing of industrial forest products were estimated at 18,400 in1996/7 of which 37% were contract employees.
Source: Timber Producers Federation, 1997
4. FOREST PRODUCTS PRODUCTION, TRADE AND CONSUMPTION
Studies on the supply of timber indicate that the age class structure of pine species is not balancedwith most trees in the over-mature class (25 years or more). This is based on the Annual Report1995/96 of the Forestry Commission, Research and Development. The unbalanced age structure wascaused by limited markets, low milling capacity, remoteness of some growing stocks and warproblems faced in the country before 1980. The quality of the over-mature stock is poor with smalldiameters and heavy branching caused by poor planting material and no silvicultural management.
Table 7. Roundwood consumption by plant type in 1996/7
Plant type No. of plants Roundwood (m3) % increase over 1995/6Sawmills 54 885,971 0.1Veneer & Ply Mills 2 33,530 5Particle & Fibreboard 2 133,650 39Pulp & Paper Mills 2 125,900 8Match factory 1 12,000 97Pole production 5 88,278 32Mining Timber - 3,807 6Wattle Factory (stripped bark) 1 69,833 14Charcoal Production 1 50,125 2Total 1,323,961 6
In 1996/7 there were 68 primary processing plants, of which 54 were sawmills, 5 pole impregnationplants, 2 pulp mills, 2 particle board mills, 2 veneer and plywood mills, 1 charcoal plants, 1 matchfactory and 1 wattle extraction (Timber Producers’ Federation 1997). Production from theseprocessing plants in 1996/7 is shown in Table 7.
Currently, Zimbabwe is self-sufficient in sawn timber, and approximately 20% of the total output isexported to neighbouring countries and Europe. The current domestic consumption of soft

ZIMBABWE COUNTRY REPORT
WORKSHOP PROCEEDINGS FORESTRY STATISTICS – MUTARE, ZIMBABWE (30 Nov. – 4 Dec. 1998)
137
roundwood is about 172,700 m3 (about half the total production and the other half is exported to thelucrative foreign market). Volume and sales figures for the year 1996-1997 are shown in Table 8.
Future demands for forest products have been estimated by correlating trends in consumptionpatterns and gross domestic product (World Bank 1991). The Timber Producers Federation andTimber Council project that demand for forest products is strongly linked to the construction andbuilding industry and the demand is increasing. Growth in the agricultural, floricultural andhorticultural sectors will see an increase in the demand for packaging material whilst increasedstandard of living will see increased paper consumption. Pulp companies projected an increase indemand for long fibre (pine) and bleached pulp to improve quality of packaging material. Table 9shows the projected domestic demand of major forest products.
Plantation forestry has other minor non-wood products such as resin, honey and recreation. It is verydifficult to provide production and consumption figures for these products because there is noformal trade.
Table 8. Volumes and sales of timber and timber products during the 1996/7 year.
Plant type No. ProductionVolume
SaleVolumes
Z$1000 % increase
Sawn timber m3 54 396,235 339,937 614,325 6.7Veneer and plywood m3 2 13,098 10,473 80,795 0.5Poles m3 5 64,993 70,524 97,263 2.5Particle & fibre board m3 2 58,697 46,198 117,613 26.5Paper and products ton 2 68,686 66,832 n/a (8.2)Wattle extract ton 1 4,939 5,904 40,225 20Charcoal ton 1 10,025 10,602 13,395 3Matches 1 6,600 6,600 n/a 50Total * - - - 963,616 38
* Total comprise Z$439 million export and Z$518 million local sales.Source: Timber producers Federation (1997)
Table 9. Projected demand for forest products
Product 1995 2000 2005 2010Sawn-wood 199,000 238,000 2,890,00 355,000Panels 47,000 56,000 68,000 85,000Paper & Board 131,000 169,000 217,000 280,000Newsprint 29,000 36,000 46,000 58,000Packaging 100,000 134,000 175,000 230,000
Source: World Bank 1991
4. POLICIES AND LEGISLATION
4.1. Current laws governing forest resources management and utilisation
The laws that influence forest resources management and utilisation are listed in Table 10.Management and utilisation of forest resource in Zimbabwe are governed mainly by the Forest Actand the Communal Lands Forest Produce Act. Other Acts have indirect effects on management andutilisation of forest resource. Some of these laws do not promote sustainable forest management

ZIMBABWE COUNTRY REPORT
WORKSHOP PROCEEDINGS FORESTRY STATISTICS – MUTARE, ZIMBABWE (30 Nov. – 4 Dec. 1998)
138
(e.g. Mines and Minerals Act).
4.2. Environmental policies
At the international level, conventions such as the Convention on Biological Diversity, theConvention on Combating Desertification and the Convention on Climate Change are addressingthe issue of environmental management. These conventions are legally binding and have beenratified by nearly 170 countries, including Zimbabwe, and commits the countries to take collectiveand individual actions to promote environmentally sustainable development.
An environmental impact policy was developed in 1994 and is being implemented by the Ministryof Mines, Environment and Tourism. Its objective is to ensure unwarranted environmental negativeeffects are avoided or mitigated when development projects are implemented. This should lead toimproved environmental management.
Table 10. Laws that influence forest resources management and utilisation
Law Main themes and provisionsLand Apportionment Act of 1930 and Land Tenure Created the present Communal areas on marginally
productive landNatural Resources Act of 1942 (amended many times) Regulates use of natural resources. The Act is
administered by the Natural Resources Board. Providesfor the establishment of intensive conservation areas incommercial areas.
Forest Act of 1948 (amended 1982) The Act mandates the Forestry Commission as theForestry Authority to protect and conserve indigenousforests, and to regulate the harvesting of indigenoustrees on private and communal lands. The Actmandates the Forestry Commission in its role as theState Forestry Enterprise to undertake plantationdevelopment and sawmilling.
Communal Land Forest Produce Act of 1987 The Act vests the commercial utilisation of forestproducts on communal areas in the hands of the RuralDistrict Councils, and only allows subsistenceutilisation of forest products by local people andcommunities.
National Parks and Wildlife Act of 1975, amended1982
Designates ownership for wildlife to owners andoccupiers of alienated land (e.g. communal people).
Communal Land Act of 1982, amended 1985 control of land placed under the President through theRural District Councils rather than Chiefs.
Rural District Councils Act of 1988 Provides for the Rural District Councils to enact by-laws to regulate natural resources use and issuelicences for commercial exploitation of wood products.
Land Acquisition Act of 1993 Provides for the designation of under utilised landMines and Minerals Act of 1996 Confers absolute rights to land for mining. Establishes
that mining is not subject to impact assessment or landreclamation.
Environmental Management Act of 1998 The Act makes provision for regulations to promote thesustainable use of the environment throughenvironmental impact assessment, environmental auditsand penalties for those who pollute the environment.
In 1987 the National Conservation Strategy was developed to document environmental pressuresfacing Zimbabwe and recommend strategies to solve the problems. No priorities were identified norwere action programmes or projects identified and prepared for implementation, making it difficult

ZIMBABWE COUNTRY REPORT
WORKSHOP PROCEEDINGS FORESTRY STATISTICS – MUTARE, ZIMBABWE (30 Nov. – 4 Dec. 1998)
139
to monitor progress in addressing the issues raised. The implementation of the strategy was alsolimited due to lack of resources and technical capacity.
Currently, Environmental Action Plans (EAP) are being developed and so are National BiodiversityStrategies and Action Plans to promote sustainable environmental management. A proposal todevelop a National Forestry Action Programme has been drafted, and the programme will revealthat Zimbabwe is committed to solving its forest related problems, including environmental issuesand contributing to international efforts on sustainable environmental management.
Most of the players in the timber industry have developed corporate policies on the environment todefine corporate values and general management guidelines that promote SFM.
In 1997 the Timber Producers’ Federation developed and encouraged its members to implement theEnvironmental Conservation Guidelines. The guidelines prescribe conservation procedures atplanting, harvesting, construction of roads and other plantation development activities to avoid orminimise adverse impacts to the environment. These self-regulatory mechanisms can only beviewed as an important step towards environmental sustainability in forest plantations.Environmental audits are being implemented by the timber industry to monitor adherence to theguidelines. Currently, the Timber Producers’ Federation is in the process of compiling guidelinesfor sawmilling to complement the existing forestry management guidelines.
Central to SFM is the certification of forests, and forest products. To this end the timber industry isin the process of obtaining environmental certification, primarily from the Stewardship Council thatissues internationally recognised certificates for sustainable forest management.
4.3. National forest policy
The most recent National Forest policy statement dates to 1990, it is the mandate of the ForestryCommission. The policy sought to:
promote the sustained yield of forests;promote conservation of forests and trees;to maintain an inventory of the forest resources;promote research and training in order to meet the needs of the forestry sector;promote other land uses in commercial forestry; andpromote joint ventures.
The National Forestry Policy Statement replaced the 1982 policy statement by including three newareas of focus under its role as the Forestry Authority: promote afforestation and woodlandmanagement on communal areas; increase planting of indigenous trees; and supervise logging ofindigenous hardwoods.
There is a need to develop a new National Forest Policy which takes into account current socio-economic conditions and promotes the sustainable management of forests.
4.4. Indigenous people issues
It is unfortunate that small holders still play an insignificant role in the forestry industry. The timberindustry is dominated by 3 large players which monopolise the wood supply. This situation,

ZIMBABWE COUNTRY REPORT
WORKSHOP PROCEEDINGS FORESTRY STATISTICS – MUTARE, ZIMBABWE (30 Nov. – 4 Dec. 1998)
140
however, may change if the small holders get a stake in the new Forestry Company after thecommercialisation and privatisation of the State Forests. Privatisation would increase involvementof local people in the timber industry. This move will be in line with the policy of the governmentof Zimbabwe. Also prior to privatisation, sub-contracting of services such as transport and thinningwill empower indigenous people, particularly employee-formed companies and co-operatives.
Policies prior to independence focused on the regulation, control and exclusion of localcommunities around forest reserves. These policies continued after independence. They lead tounstructured illegal settlement and encroachment within forest reserves, and illegal activities such astimber poaching, wildlife poaching, cattle grazing and forest fires. It is now recognised that forsustainable management of forest resources to be successful, a partnership approach to resourcemanagement which allows access to the resources by the local people and sharing of benefits by allkey stakeholders is necessary for effective forest management. This policy is being pursued by theForestry Commission along the same lines as the successful wildlife resource sharing managementapproach (CAMPFIRE) developed by the National Parks and Wildlife Department.
Policies outside the forestry sector (macro economic policies, land policies, etc) must be reviewedso that they promote sustainable forest management.
5. DATA COLLECTION
5.1 Institutions collecting forestry information
Below is a list of institutions involved in collecting information on forestry:
Forestry Commission: The Forestry Commission collects information on commercial and industrialforests and roundwood processing. There is a legal obligation on the part of the land owners tocomplete the questionnaires. Information on commercial and industrial statistics include plantationareas by species, end use, age, ownership and province. Information on a number and categories ofstaff employed in plantations is collected. The roundwood processing information includesproduction figures for the various products, and amount imported and exported. Informationcollected includes ownership, number and categories of staff employed in the processing plants.Timber Producers’ Federation: The Timber Producers’ Federation is an association of Zimbabweplantation timber growers and sawmillers. It collects information on sales and production on amonthly basis from its members. The Timber Producers’ Federation, like the Forestry Commission,collect information on plantation area by species, ownership and amount harvested, and primaryplant production, and number employed. Unlike the Forestry Commission it collects information onprimary plant sales and value. All information is collected through questionnaires sent toorganisations and individuals.Central Statistics Office: The Central Statistics Office collects, on an annual basis, information onagricultural crops and employment figures in the sector. Forestry is included under agriculturalcrops. Information collected on forestry include volume and value of timber. All institutions &individuals to whom the questionnaires are sent are required by law to give accurate data and toreturn the questionnaires within a prescribed period. Central Statistics also collect on a monthlybasis information on imports and exports (quantities and value) from the department of Customsand Excise.National Herbarium and Botanical Gardens collects information on plant uses, particularly non-timber uses, species identification and ecology. It has developed vegetation maps for Matabeleland

ZIMBABWE COUNTRY REPORT
WORKSHOP PROCEEDINGS FORESTRY STATISTICS – MUTARE, ZIMBABWE (30 Nov. – 4 Dec. 1998)
141
and Zambezi valley. They are florist maps which show species distribution, and are complementarymaps to those developed by the Forestry Commission which show the structure of vegetation.International Organisations: Various international organisations such as the FAO, WWF and IUCNalso collect information on forestry
5.2. Methodology of data collection
Vegetation mapping is done using satellite remote sensing and geographic information system. Thesatellite images are obtained from South Africa. Existing topographic maps are obtained from theDepartment of the Surveyor General. Aerial photographs and ground truthing exercises are used toverify satellite image interpretations. Surveys are used to determine forest statistics. Forms areprinted and sent to the respective organisations and individuals. Data is then processed bycomputers and summaries are produced.
5.3. Some information gaps
Many trees are being planted by individuals on farms, as boundary trees, around homesteads orcollectively in small plantations or woodlots. The information on the trees outside forests is scanty.Information on non-wood forest products such as fruits, honey, fibre, grasses, etc. is lacking, andthis can be attributed to the inadequate knowledge on the methods for assessing non-wood forestproducts. These methods need to be developed.
With regard to vegetation mapping, the satellite data for monitoring is very expensive, and this hasbeen compounded by the devaluation of the Zimbabwe dollar. Currently, each image costs US$ 5,000 from South Africa. The current maps show the extent of forest cover but, not the volumes,hence there is need to gather information on the woody biomass and growth rates.
This information will be particularly important to assess the quality of the forests which aresubjected to selective commercial harvesting, and those subjected to selective harvesting offuelwood, building materials and non-wood products, and seasonal fires. Sustainable forestmanagement is unlikely to be achieved in the absence of such vital information. It should bestressed that indigenous forests are complex, are subject to extensive human activities which arehard and expensive to monitor. Furthermore, funding for such information gathering on indigenousforests, which is dependent on government funding, is limited. The lack of funding and lack ofpriority given to indigenous forests is also reflected in the disparity in the literature available inplantation forests (over 90%) compared to that on indigenous forests (less than 5%), and yet theindigenous forests consists of over 99% of the total forest area.
Maps produced by the National Herbarium on species distribution have only been done forMatabeleland and the Zambezi valley, and there is need to extend this to other parts of the country.
The most recent forest statistics compiled by the Forestry Commission covers the period 1992/3.This information is old because the Forestry Commission has not been able to process the data fastenough due to poor staffing levels and partly due to delayed responses. More up-to-date informationon forest statistics is required in order to make informed decisions. The questionnaire should berevised in order to make it easier to fill. This may result in quicker response. Also a decision mayneeded on the most efficient way to collect the information and the frequency of the collection.

ZIMBABWE COUNTRY REPORT
WORKSHOP PROCEEDINGS FORESTRY STATISTICS – MUTARE, ZIMBABWE (30 Nov. – 4 Dec. 1998)
142
6. CONCLUSION
Zimbabwe has done well in terms of collecting information on plantations. However, the same cannot be said for the indigenous forests where the lack of information is greater, and decision makinginefficient. There is a need to develop methodologies for collecting data particularly for non-woodforest products and to avail adequate resources for collecting information on indigenous forests.Given this information, and appropriate management and enabling policies, Zimbabwe’s indigenousforests could be managed sustainably for the benefit of all Zimbabweans.
REFERENCES
Anon (1992). Technical Assistance for the technical and economic feasibility study for the stateforests development of Zimbabwe; League of Arab states: Arab Organisation for AgriculturalDevelopment Volume 1 main report. 151 pp.Bradley and Dewees (1993): Indigenous woodlands, agricultural production and householdeconomy in the communal areas.Bradley, P.N. & McNamara, K. (1993): Living with trees - Policies for Forestry Management inZimbabwe; World Bank Technical Paper No. 210. 329 pp.Campbell, B., Grundy, I and Matose, F. (1993). Tree and woodland resources - technical practicesof small scale farmers. Bradely P. N. and McNamara, K. (1993).Living with trees: Policies for forestry management in Zimbabwe. World Bank, Washington.Forestry Commission, Research and Development Annual Report 1995/96.Gondo, P.C. and Kwesha, D. (1993): National Woody Cover Mapping: Application of Landsat MSSdata in Zimbabwe. In the Proceedings of the Ecology and Management of Indigenous Forests inSouthern Africa held in Victoria Falls, Zimbabwe.Gondo, P. C. and Mkwanda, R. (1991): The assessment and monitoring of forest resources andforest degradation in Zimbabwe: Proceedings of a regional workshop on methodology fordeforestation and forest degradation assessment. 25 Nov. - 13 Dec., 1991, Nairobi, Kenya.Matose, F., Mudhara, M and Mushove, P. (1996): The Woodcraft Industry along the Bulawayo-Victoria Falls road. Forestry Commission.Timber Producers Federation (1997): Zimbabwe timber industry statistics for 1976-1997.World Bank (1991): Zimbabwe Forest Policy Review.