data center application security: lateral movement
TRANSCRIPT
SMU Data Science Review SMU Data Science Review
Volume 1 Number 2 Article 10
2018
Data Center Application Security: Lateral Movement Detection of Data Center Application Security: Lateral Movement Detection of
Malware using Behavioral Models Malware using Behavioral Models
Harinder Pal Singh Bhasin Southen Methodist University, Dallas, Texas, [email protected]
Elizabeth Ramsdell [email protected]
Albert Alva [email protected]
Rajiv Sreedhar ShieldX Networks, Inc., [email protected]
Medha Bhadkamkar Hewlett Packard Enterprise, Inc., [email protected]
Follow this and additional works at: https://scholar.smu.edu/datasciencereview
Part of the Categorical Data Analysis Commons, Information Security Commons, and the Theory and
Algorithms Commons
Recommended Citation Recommended Citation Bhasin, Harinder Pal Singh; Ramsdell, Elizabeth; Alva, Albert; Sreedhar, Rajiv; and Bhadkamkar, Medha (2018) "Data Center Application Security: Lateral Movement Detection of Malware using Behavioral Models," SMU Data Science Review: Vol. 1: No. 2, Article 10. Available at: https://scholar.smu.edu/datasciencereview/vol1/iss2/10
This Article is brought to you for free and open access by SMU Scholar. It has been accepted for inclusion in SMU Data Science Review by an authorized administrator of SMU Scholar. For more information, please visit http://digitalrepository.smu.edu.
Data Center Application Security: LateralMovement Detection of Malware using
Behavioral Models
Harinder Pal Singh Bhasin1, Elizabeth Ramsdell1, Albert Alva1,Rajiv Sreedhar2, and Medha Bhadkamkar3
1 Southern Methodist University, Dallas, Texas2 ShieldX Networks, Inc., San Jose, California
3 Hewlett Packard Enterprise, Inc., Palo Alto, California
Abstract. Data center security traditionally is implemented at the ex-ternal network access points, i.e., the perimeter of the data center net-work, and focuses on preventing malicious software from entering thedata center. However, these defenses do not cover all possible entrypoints for malicious software, and they are not 100% effective at pre-venting infiltration through the connection points. Therefore, securityis required within the data center to detect malicious software activityincluding its lateral movement within the data center. In this paper,we present a machine learning-based network traffic analysis approachto detect the lateral movement of malicious software within the datacenter. Our approach employs an unsupervised learning approach thatuses the metadata of network transactions to learn the normal appli-cation network traffic behavior and detect anomalous communications.Utilizing over two million records for the training data and four hun-dred thousand records for validation, our approach identified 0.61% ofthe communications as anomalous. The fact that any anomalies weresuccessfully identified further confirms our theory that monitoring datacenter traffic for anomalous communications is an effective and necessaryapproach to detecting malicious software activity that remains internalto the data center.
1 Introduction
Data centers are an integral part of our daily lives, yet most people are unawarethat they constantly use services housed in data centers. The widespread adop-tion of cloud services allows our smart phones, laptops, self-driven automobiles,and home automation devices, to name but a few connected devices, to providea broad range of functionality and services that the devices alone are unableto provide. Applications routinely communicate from our personal devices todata centers, often relaying sensitive financial information, such as credit cardnumbers, and personal information, such as our current location.
Data center transactions can automatically involve multiple servers locatedwithin a single data center. Communication between servers for each of these
1
Bhasin et al.: Data Center Application Security
Published by SMU Scholar, 2018
transactions may communicate the sensitive and personal information that istransferred as part of the request. The communication of sensitive informationmust be secured, even when the communications are contained solely withina single data center. A data center must provide methods to securely processthis information in order to protect consumer privacy and prevent theft is acomplex problem. Protecting this information from malicious software, however,is a complex problem since the traffic between the servers within the data centeris expected to be reliable and predictable.
It is necessary to monitor and understand the behavior of this traffic in orderto detect anomalies leading to malicious software detection. Anomaly detectionon network is a demanding space where quite a bit of research has already beendone over the years and it continues because the demand for secure, high perfor-mance systems with increased storage capacity continues to grow. The challengein anomaly detection is that the majority of the data consists of normally be-haved patterns and a small portion is ever detected as anomalous.
Our solution uses Machine Learning techniques and algorithms to furtherprovide mechanisms to better measure for anomaly detection. Our data set dic-tates Unsupervised Learning technique since the data is unlabeled. A trainedset against which to classify is unavailable. The data center traffic data set isunlabeled, binary, multiclass, and yet very similar. The Jaccard similarity coef-ficient is applied to find dissimilarities in the traffic. Records from traffic dataset are measured for their similarities and a distance is calculated. Clusters ofsimilar distances are formed to classify as similar behavior. The training dataset is used to form clusters of different traffic patterns. For validation the testdata set is run against the trained model to detect anomalies.
The outcome from the training data set produced different results as weused full model, one-feature model, and a restricted model. The one-featuremodel was comprised of one feature and produced many dissimilarities resultingin numerous clusters. The quality of these clusters was rather weak in compari-son to the restricted model. In the restricted model we used four features. Therestricted model produced fewer but densely populated clusters. The quality ofthese clusters was tested using the distance between the clusters, measured fromthe centroid to centroid of resulting clusters. A test data set used for validationproduced few dissimilarities attributed to anomalous data.
Our training data set with cluster quality testing and validations resulted in0.61% of anomalous amongst the test data. Our theory to learn the applicationtraffic behavior for detecting malicious software has shown positive results.
The rest of the paper is organized as follows: Section 2 describes related workdone in application behavioral analysis field. In Section 3, we describe the datacenter application server and traffic patterns. In Section 4, we analyze the featureselection and the data set used for our experiments. In Section 5, we describehow we used the similarities in traffic to detect anomalies. In Subsections 5.1and 5.2, we describe the model construction, implementation, and validation. InSection 6, we describe results from our experiments. In Section 7, we analyze
2
SMU Data Science Review, Vol. 1 [2018], No. 2, Art. 10
https://scholar.smu.edu/datasciencereview/vol1/iss2/10

our results. In Section 8, we discuss ethics surrounding the application security.The Section 9, we conclude our findings and review the future work.
2 Related Work
Some research has been done by Cao [1] to analyze malware behavior at the appli-cation level. As described in the research paper, APIs (Application ProgrammingInterface) collect the internal call structure to monitor the application behavior.This approach requires an in depth knowledge of proprietary applications andlearning the implementation to appropriately classify a ”good” behavior. Ourapproach does not require any knowledge of proprietary interfaces and imple-mentation for classifying the behavioral pattern.
A neural network implemented in Network-based intrusion detection usingneural networks is presented by Palagiri [2]. This relatively basic method, how-ever, does not produce preferential results as it does not flag simultaneous at-tacks. It is better suited for individual attacks. We leave this as an opportunityto expand on our future considerations. Our approach is to use Machine Learningtechniques and algorithms to further provide mechanisms to better measure foranomaly detection. Machine Learning techniques can be divided into three cate-gories: Supervised Learning, Reinforcement Learning, and Unsupervised Learn-ing. In Supervised Learning the data is labeled or structured where the desiredthreats have already been classified. Reinforcement Learning develops an agentthat improves its performance based on interactions with the environment. Aclassic example is a chess game where an agent continues to learn with the goalof either winning or a losing. Unsupervised Learning is used where the data isunlabeled or unstructured and a trained set against which to classify is unavail-able.
Portnoy [3] discusses that in the case of Supervised Learning, the labeleddata needed is either impossible to obtain or very expensive. Using stagnant,labeled data assumes that the labeler was cognizant of every possible type ofattack, which is never the case. This reinforces the need to have a well-workingUnsupervised model. The model in the intrusion detection with unlabeled datausing clustering [3] resource takes a similar approach to what is presented here.The authors work with unlabeled data center in order to form clusters. Theymark all small clusters as being anomalies. As discussed, this approach assumesthat the number of normal transactions greatly outweigh the number of attackswithin the training data. This assumption proves to be a fairly accurate startingpoint for an intrusion detection model.
Another limitation of many current anomaly detection models is the timecomponent to this type of data. The models are based on a normal behaviorthat is derived from a training set. While this set may be what is normal at thetime of training, transactional behavior is constantly changing, thereby creatinga need for repetitive model retraining. This creates a possibility for increasederror as the model will be trained on the newest available data. This data mayinclude attacks that were not identified which will then be classified as normal
3
Bhasin et al.: Data Center Application Security
Published by SMU Scholar, 2018
behavior for all incoming interactions. Most machine learning techniques such asneural networks and SVMs are sensitive to the noise this creates in the trainingdata. In the model presented by Hu, Liao and Vemuri [4], robust support vectormachine technique is used and compared to the SVMs and K-nearest neighborresults. Robust support vector machines account for the overfitting of the initialmodel due to the noisy nature of the real-time training data. Another benefitof this method is a shorter testing time due to having fewer support vectorsthan a traditional Support Vector Machine. The authors used the three separatedetection methods on the same clean data set and a deliberately noisy dataset, into which simulated anomalous behavior has been injected. The resultsfor the Robust Support Vector machine based on these data were promising incomparison to the other methods. It showed lower false positive rates and higheroutlier detection rates. It also showed the lowest performance decline when usedin the presence of noise.
In addition to behaviors changing over time, the timeliness of the modelneeds to be considered. In the event of an attack, the speediness of detectionis vital in disaster management. Algorithms need to be able to detect anoma-lies in real-time. This can be difficult with the previously discussed dynamicenvironment and the large amounts of transactions happening at a given time.The need to learn continuously is addressed in Unsupervised real-time anomalydetection for streaming data [5]. Here, the authors used streaming data fromNumenta Anomaly Benchmark to test their model. This is a useful resource forthe testing phase as it contains real-world streams with labeled anomalies, al-lowing for testing to be done in real-time. To detect the anomalies, this articleoffers the more advanced Hierarchical Temporal Memory tool. This continuouslearning model considers the spatiotemporal characteristics of its input. It doesnot, however, model of detect anomalies. The output from this method is thenused as input for anomaly detection analysis. While this is outside the scope ofthis paper, we want to present this as a possible iteration technique.
3 Application Servers
As shown in Figure 1, a typical data center is considered in the south (S) side ofthe perimeter. Connections originating from the Internet to the data center aretermed as N-S traffic. In addition to the N-S traffic there may be connectionsbetween the various application workloads in the data center. These connectionsare termed as east(E)-west(W) traffic. Communication to process a transactionwithin a data center could potentially span across any number of (application)servers shown as east (E) to/from west (W) (a.k.a. lateral).
4
SMU Data Science Review, Vol. 1 [2018], No. 2, Art. 10
https://scholar.smu.edu/datasciencereview/vol1/iss2/10
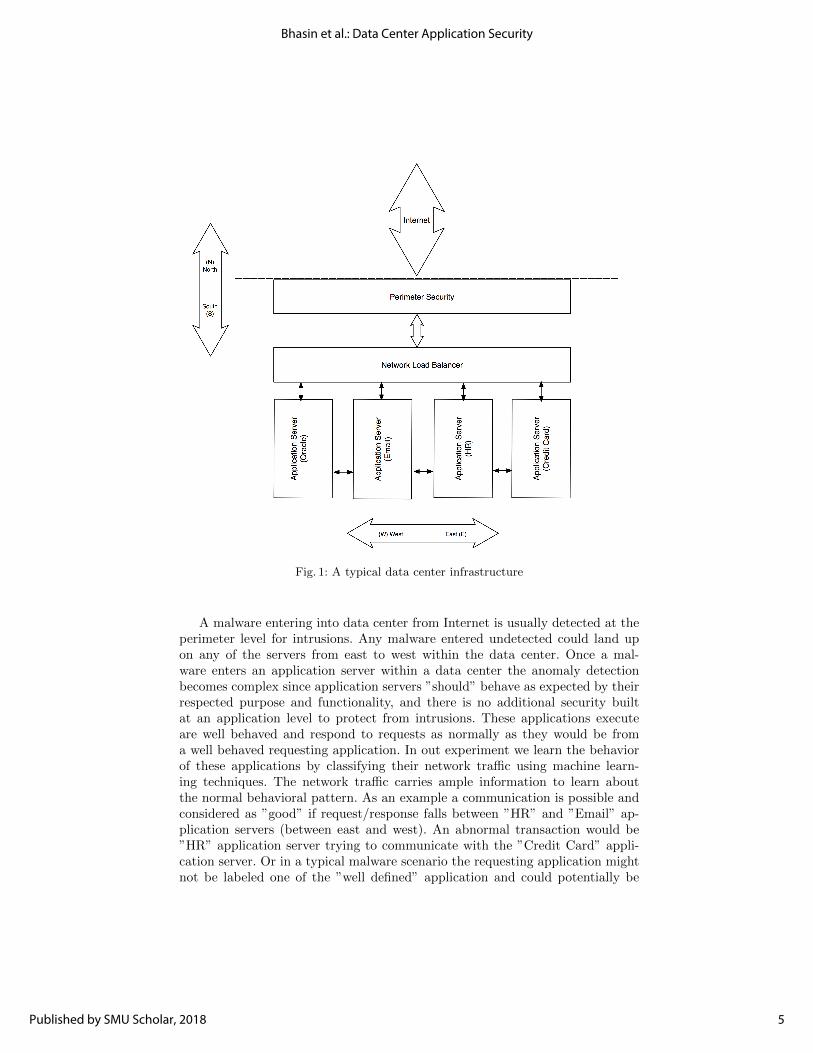
Fig. 1: A typical data center infrastructure
A malware entering into data center from Internet is usually detected at theperimeter level for intrusions. Any malware entered undetected could land upon any of the servers from east to west within the data center. Once a mal-ware enters an application server within a data center the anomaly detectionbecomes complex since application servers ”should” behave as expected by theirrespected purpose and functionality, and there is no additional security builtat an application level to protect from intrusions. These applications executeare well behaved and respond to requests as normally as they would be froma well behaved requesting application. In out experiment we learn the behaviorof these applications by classifying their network traffic using machine learn-ing techniques. The network traffic carries ample information to learn aboutthe normal behavioral pattern. As an example a communication is possible andconsidered as ”good” if request/response falls between ”HR” and ”Email” ap-plication servers (between east and west). An abnormal transaction would be”HR” application server trying to communicate with the ”Credit Card” appli-cation server. Or in a typical malware scenario the requesting application mightnot be labeled one of the ”well defined” application and could potentially be
5
Bhasin et al.: Data Center Application Security
Published by SMU Scholar, 2018

trying to establish communication to other ”well defined” application. A typicalflow of the information could potentially require to touch multiple entities asdescribed in Figure 1 in terms north (N), south (S), east (E), and west (W).
4 Feature Selection
The feature selection played an important role in our experiment as the datacenter application network traffic has similarities in addition to being enormousin size. For our experiment creating a workflow as described in Figure 2 improvedperformance and our ability to narrow the focus for anomaly detection. Theworkflow shown in Figure 2, separates out different components to modularizethe implementation providing future research feasibilities.
Data set for our research comprised of fewer attributes without any user data(a.k.a. payload). As show in the Figure 2 traffic is captured at the Network Packetlevel, however, we chose to use metadata once the packet processing has beenperformed. Packet processing is not relevant for our research since the metadatawhich consists of information relevant to application and communicating entities.
Fig. 2: Framework and the Workflow for Anomaly Detection
In our research we used the data set comprising of normal and anomalousrecords. We used the metadata in three different sets for our experiments: a fullmodel as described in Table 1, a restricted model as shown in Table 2, and aone-feature model as shown in Table 3. The full model used the entire data setpresented in metadata consisting of twelve features. In a restricted model we
6
SMU Data Science Review, Vol. 1 [2018], No. 2, Art. 10
https://scholar.smu.edu/datasciencereview/vol1/iss2/10
limited our experiment to four features. In each of these experiments we used1K, 750K, and 2M size for training data sets. These records were retrieved fromlive traffic within a data center.
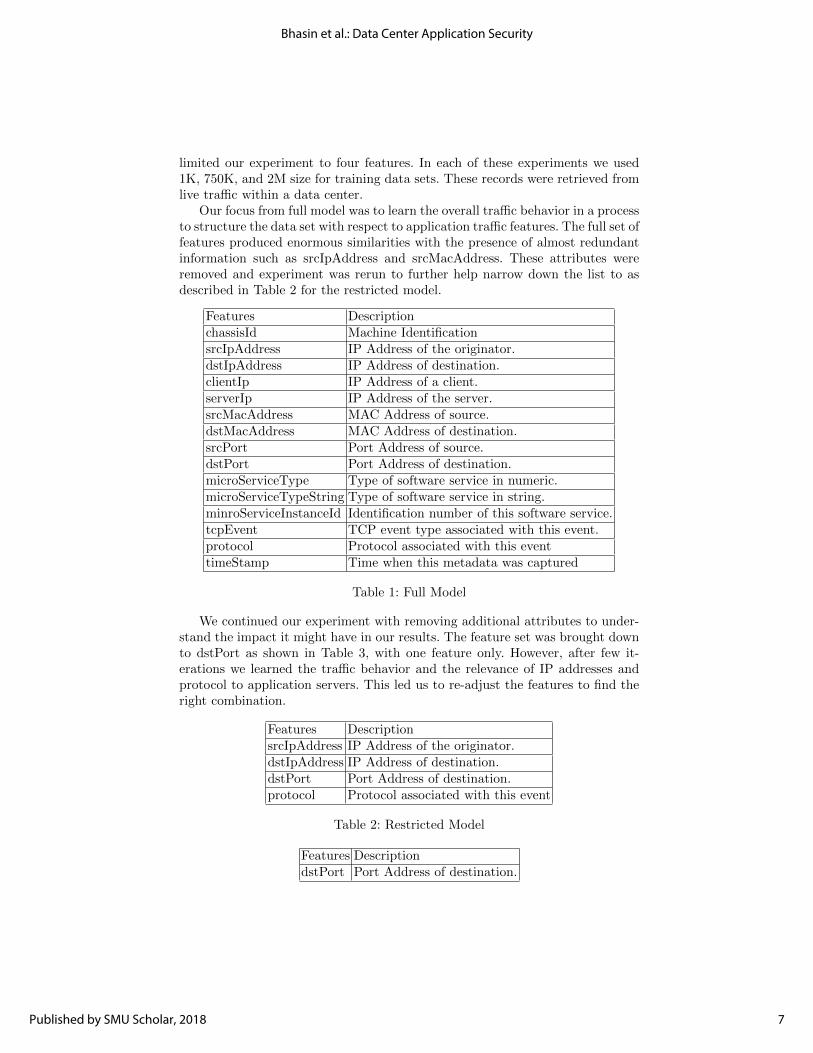
Our focus from full model was to learn the overall traffic behavior in a processto structure the data set with respect to application traffic features. The full set offeatures produced enormous similarities with the presence of almost redundantinformation such as srcIpAddress and srcMacAddress. These attributes wereremoved and experiment was rerun to further help narrow down the list to asdescribed in Table 2 for the restricted model.
Features DescriptionchassisId Machine IdentificationsrcIpAddress IP Address of the originator.dstIpAddress IP Address of destination.clientIp IP Address of a client.serverIp IP Address of the server.srcMacAddress MAC Address of source.dstMacAddress MAC Address of destination.srcPort Port Address of source.dstPort Port Address of destination.microServiceType Type of software service in numeric.microServiceTypeString Type of software service in string.minroServiceInstanceId Identification number of this software service.tcpEvent TCP event type associated with this event.protocol Protocol associated with this eventtimeStamp Time when this metadata was captured
Table 1: Full Model
We continued our experiment with removing additional attributes to under-stand the impact it might have in our results. The feature set was brought downto dstPort as shown in Table 3, with one feature only. However, after few it-erations we learned the traffic behavior and the relevance of IP addresses andprotocol to application servers. This led us to re-adjust the features to find theright combination.
Features DescriptionsrcIpAddress IP Address of the originator.dstIpAddress IP Address of destination.dstPort Port Address of destination.protocol Protocol associated with this event
Table 2: Restricted Model
Features DescriptiondstPort Port Address of destination.
7
Bhasin et al.: Data Center Application Security
Published by SMU Scholar, 2018
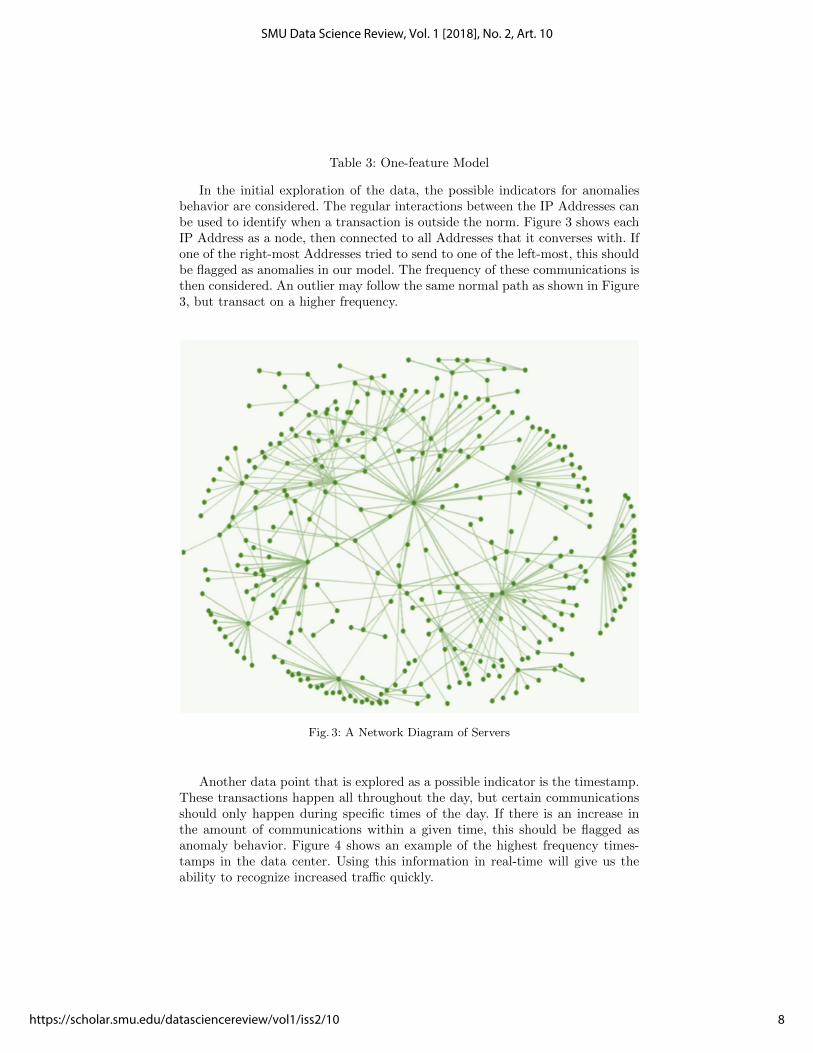
Table 3: One-feature Model
In the initial exploration of the data, the possible indicators for anomaliesbehavior are considered. The regular interactions between the IP Addresses canbe used to identify when a transaction is outside the norm. Figure 3 shows eachIP Address as a node, then connected to all Addresses that it converses with. Ifone of the right-most Addresses tried to send to one of the left-most, this shouldbe flagged as anomalies in our model. The frequency of these communications isthen considered. An outlier may follow the same normal path as shown in Figure3, but transact on a higher frequency.
Fig. 3: A Network Diagram of Servers
Another data point that is explored as a possible indicator is the timestamp.These transactions happen all throughout the day, but certain communicationsshould only happen during specific times of the day. If there is an increase inthe amount of communications within a given time, this should be flagged asanomaly behavior. Figure 4 shows an example of the highest frequency times-tamps in the data center. Using this information in real-time will give us theability to recognize increased traffic quickly.
8
SMU Data Science Review, Vol. 1 [2018], No. 2, Art. 10
https://scholar.smu.edu/datasciencereview/vol1/iss2/10

Fig. 4: Frequency of Traffic
Figure 5 shows a correlation of nodes with a dense color reflecting frequentlyused network paths among the application servers.
Fig. 5: Correlation of Traffic
9
Bhasin et al.: Data Center Application Security
Published by SMU Scholar, 2018
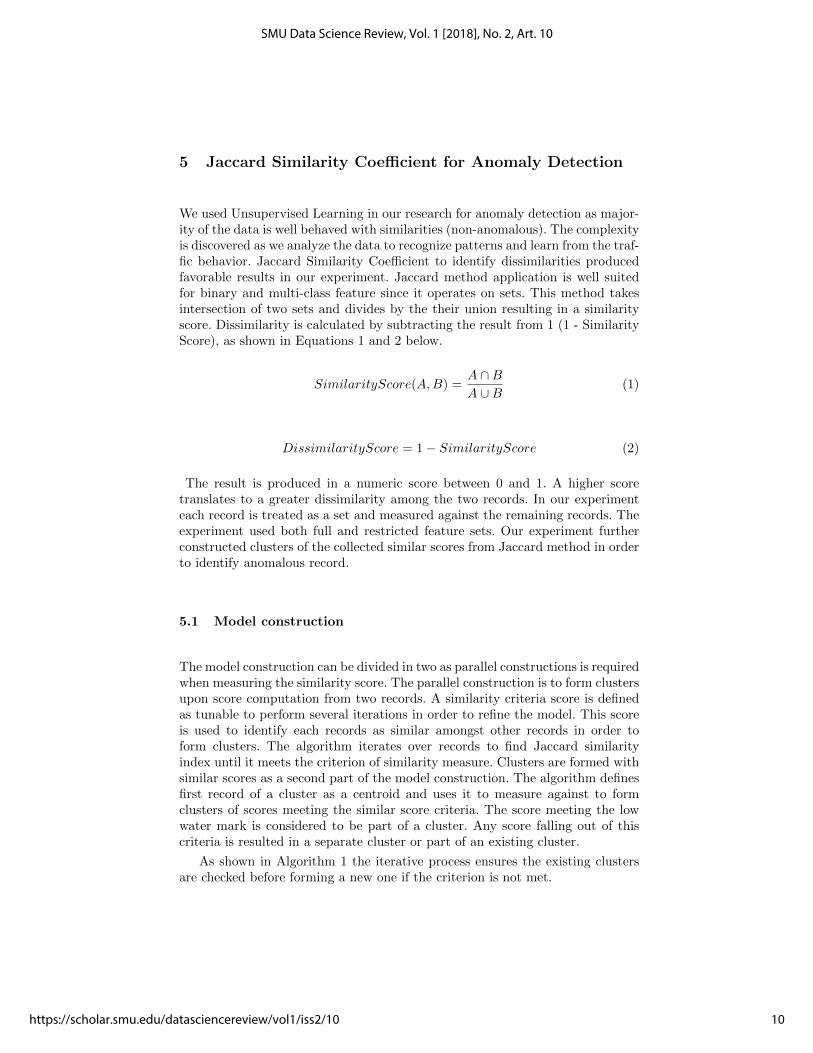
5 Jaccard Similarity Coefficient for Anomaly Detection
We used Unsupervised Learning in our research for anomaly detection as major-ity of the data is well behaved with similarities (non-anomalous). The complexityis discovered as we analyze the data to recognize patterns and learn from the traf-fic behavior. Jaccard Similarity Coefficient to identify dissimilarities producedfavorable results in our experiment. Jaccard method application is well suitedfor binary and multi-class feature since it operates on sets. This method takesintersection of two sets and divides by the their union resulting in a similarityscore. Dissimilarity is calculated by subtracting the result from 1 (1 - SimilarityScore), as shown in Equations 1 and 2 below.
SimilarityScore(A,B) =A ∩B
A ∪B(1)
DissimilarityScore = 1− SimilarityScore (2)
The result is produced in a numeric score between 0 and 1. A higher scoretranslates to a greater dissimilarity among the two records. In our experimenteach record is treated as a set and measured against the remaining records. Theexperiment used both full and restricted feature sets. Our experiment furtherconstructed clusters of the collected similar scores from Jaccard method in orderto identify anomalous record.
5.1 Model construction
The model construction can be divided in two as parallel constructions is requiredwhen measuring the similarity score. The parallel construction is to form clustersupon score computation from two records. A similarity criteria score is definedas tunable to perform several iterations in order to refine the model. This scoreis used to identify each records as similar amongst other records in order toform clusters. The algorithm iterates over records to find Jaccard similarityindex until it meets the criterion of similarity measure. Clusters are formed withsimilar scores as a second part of the model construction. The algorithm definesfirst record of a cluster as a centroid and uses it to measure against to formclusters of scores meeting the similar score criteria. The score meeting the lowwater mark is considered to be part of a cluster. Any score falling out of thiscriteria is resulted in a separate cluster or part of an existing cluster.
As shown in Algorithm 1 the iterative process ensures the existing clustersare checked before forming a new one if the criterion is not met.
10
SMU Data Science Review, Vol. 1 [2018], No. 2, Art. 10
https://scholar.smu.edu/datasciencereview/vol1/iss2/10

Algorithm 1 Dissimilarity algorithm
1: function computeScore2: distance← score of -13: top:4: if i > maxRecords then return done5: distance← JaccardMethod(existingRecordFromCluster, thisRecord).6: if distance <= lowWaterMark then7: addToExistingCluster← thisRecord
8: i← i + 1.9: goto top.
return distance10: procedure insertVector(thisRecord)11: distance← computScore(thisRecord)12: if distance == -1Or > lowWaterMark then13: top:14: if i > maxRecords then return15: if noExistingRecord then16: addToNewCluster← thisRecord17: i← i + 1.18: goto top.
5.2 Model validation
Similar to model construction the validation is divided in two. The model is val-idated for the algorithm and the cluster formation. The algorithm validation isfurther divided in two parts. The first part is validation by constructing synthetictest data to run against the trained model. The synthetic data is constructedwith good data as well as anomalous data with instrumentation. Upon refiningand training the model a new data set is constructed from the existing dataset from the working model by randomly selecting 20% of the records. Theserecords are then run against the model to ensure they measure with same sim-ilarity scores as expected. The second part of the algorithm validation requiredus to construct another data set comprising of randomly selected records withrandomly swapped features within the records and across records. This newlyconstructed data is then run against the trained model. Very few records wereobserved as anomalous. This is primarily due to the fact application traffic hasquite a bit of similarity. Both of these test cases with synthetic data confirmedthe algorithm is working as designed.
The second part of the model validation is performed to ensure the qualityof clusters. Each cluster is constructed based on a centroid of cluster and ameasured score of each record in the cluster which must fall within a set scorecriterion. Each record with the cluster is validated against the centroid of everyother cluster to ensure the clusters are disjoint. Further the records within eachcluster are counted with their corresponding score to ensure majority of theclusters are densely populated.
11
Bhasin et al.: Data Center Application Security
Published by SMU Scholar, 2018
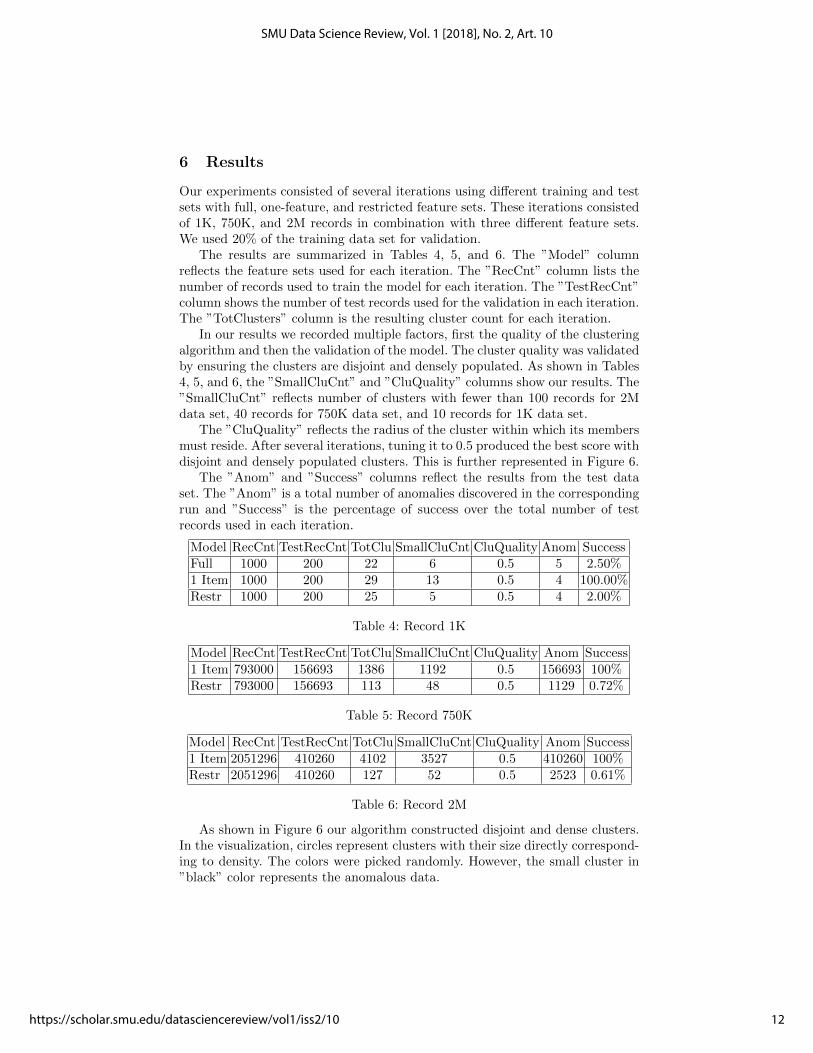
6 Results
Our experiments consisted of several iterations using different training and testsets with full, one-feature, and restricted feature sets. These iterations consistedof 1K, 750K, and 2M records in combination with three different feature sets.We used 20% of the training data set for validation.
The results are summarized in Tables 4, 5, and 6. The ”Model” columnreflects the feature sets used for each iteration. The ”RecCnt” column lists thenumber of records used to train the model for each iteration. The ”TestRecCnt”column shows the number of test records used for the validation in each iteration.The ”TotClusters” column is the resulting cluster count for each iteration.
In our results we recorded multiple factors, first the quality of the clusteringalgorithm and then the validation of the model. The cluster quality was validatedby ensuring the clusters are disjoint and densely populated. As shown in Tables4, 5, and 6, the ”SmallCluCnt” and ”CluQuality” columns show our results. The”SmallCluCnt” reflects number of clusters with fewer than 100 records for 2Mdata set, 40 records for 750K data set, and 10 records for 1K data set.
The ”CluQuality” reflects the radius of the cluster within which its membersmust reside. After several iterations, tuning it to 0.5 produced the best score withdisjoint and densely populated clusters. This is further represented in Figure 6.
The ”Anom” and ”Success” columns reflect the results from the test dataset. The ”Anom” is a total number of anomalies discovered in the correspondingrun and ”Success” is the percentage of success over the total number of testrecords used in each iteration.
Model RecCnt TestRecCnt TotClu SmallCluCnt CluQuality Anom SuccessFull 1000 200 22 6 0.5 5 2.50%1 Item 1000 200 29 13 0.5 4 100.00%Restr 1000 200 25 5 0.5 4 2.00%
Table 4: Record 1K
Model RecCnt TestRecCnt TotClu SmallCluCnt CluQuality Anom Success1 Item 793000 156693 1386 1192 0.5 156693 100%Restr 793000 156693 113 48 0.5 1129 0.72%
Table 5: Record 750K
Model RecCnt TestRecCnt TotClu SmallCluCnt CluQuality Anom Success1 Item 2051296 410260 4102 3527 0.5 410260 100%Restr 2051296 410260 127 52 0.5 2523 0.61%
Table 6: Record 2M
As shown in Figure 6 our algorithm constructed disjoint and dense clusters.In the visualization, circles represent clusters with their size directly correspond-ing to density. The colors were picked randomly. However, the small cluster in”black” color represents the anomalous data.
12
SMU Data Science Review, Vol. 1 [2018], No. 2, Art. 10
https://scholar.smu.edu/datasciencereview/vol1/iss2/10
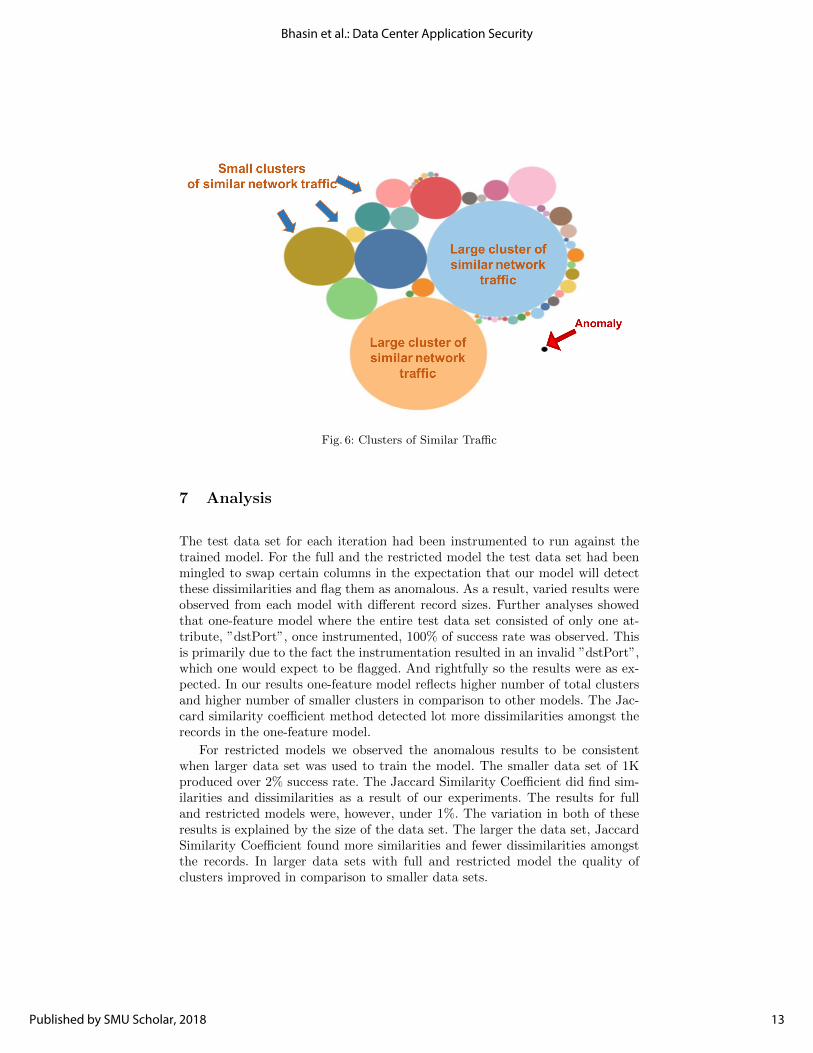
Fig. 6: Clusters of Similar Traffic
7 Analysis
The test data set for each iteration had been instrumented to run against thetrained model. For the full and the restricted model the test data set had beenmingled to swap certain columns in the expectation that our model will detectthese dissimilarities and flag them as anomalous. As a result, varied results wereobserved from each model with different record sizes. Further analyses showedthat one-feature model where the entire test data set consisted of only one at-tribute, ”dstPort”, once instrumented, 100% of success rate was observed. Thisis primarily due to the fact the instrumentation resulted in an invalid ”dstPort”,which one would expect to be flagged. And rightfully so the results were as ex-pected. In our results one-feature model reflects higher number of total clustersand higher number of smaller clusters in comparison to other models. The Jac-card similarity coefficient method detected lot more dissimilarities amongst therecords in the one-feature model.
For restricted models we observed the anomalous results to be consistentwhen larger data set was used to train the model. The smaller data set of 1Kproduced over 2% success rate. The Jaccard Similarity Coefficient did find sim-ilarities and dissimilarities as a result of our experiments. The results for fulland restricted models were, however, under 1%. The variation in both of theseresults is explained by the size of the data set. The larger the data set, JaccardSimilarity Coefficient found more similarities and fewer dissimilarities amongstthe records. In larger data sets with full and restricted model the quality ofclusters improved in comparison to smaller data sets.
13
Bhasin et al.: Data Center Application Security
Published by SMU Scholar, 2018
8 Ethics
The broader topic of Data center security may necessisate ethical considerations.Most of these involve following the structure of the Code of Ethics as it hasbeen applied to Information Technology. This extends ethical parameters suchas appropriate access to data and transparency of architecture to those usingthe service provided in this example. The Code is also used to ensure the privacyof the users and the protection of their data. Companies need to feel the sameresponsibility in protecting smaller clients as they do larger clients in the eventof a data breach.
The provider has certain responsibilities to the users in a case that an attackis successful and the customer data is compromised. In a service-based systemthis responsibility is split between the provider and the company using the ser-vices. Both are responsible for some piece of the security protocol, depending onthe extent of services being utilized. Once a server has been breached, they mustallocate resources to minimize impact and return the customer to a sense of nor-malcy and privacy. This ethical responsibility depends on the type of consumerdata that is being stored and used. In a case where an attack could be detri-mental to either the company or the consumer, is where the presented model ismost effective and important.
Data centers have ethical implications that naturally come with the aggre-gation of large amounts of data. Some are likely to detailed transactional datawhich can be used to derive personal information of vast amounts. The securestorage and privacy promise to the consumer needs to be done by the data centeritself. Employing this model will aid in the protection of information by ensuringonce a problem has started, it will be caught and controlled quickly.
This data center security model will be used in the identification phase ofthe attack. Although this is created to be a line of defense for the customer,the model itself has some ethics to consider. Due to the model monitoring themovement of transactions within the system, the highest-level access will needto be given to certain members. The current model is built using data froma security service company. The company has ethical guidelines pertaining tothe use and access to the client data. Most clients likely carry data that isconsidered personal information for their customers. Because the company thatwill be running the model has access to some of this data, this adds another layerof Information Technology personnel to be trusted in appropriate data usage.Necessary levels of confidentiality of the data at hand needs to be consideredwhen giving access to employees. Although implementation of this model doesnot require usage or storage of the client data, it is necessary to consider thesame ethical responsibilities that they do.
Another ethical consideration in the use of our model is, in the event of abreach, how much responsibility falls on the owner of the model versus the ownersof the data. This needs to be fairly and clearly documented between the partiesbefore the first implementation. Ensuring the guidelines for this scenario areclear and precise will lead to the most effective protection to the final consumer.Since the model can be used for any type of data, the ethical considerations used
14
SMU Data Science Review, Vol. 1 [2018], No. 2, Art. 10
https://scholar.smu.edu/datasciencereview/vol1/iss2/10
within the field need to be address in a situation by situation basis. All securityservices come with high responsibility in the ethics of handling information.
9 Conclusions and Future Areas of Research
In this paper, we introduce our approach to detect anomalies in the data centerapplication traffic using Jaccard Similarity Coefficient and Clustering technique.The traffic behavior is estimated to be very similar. In a data center, the ap-plication traffic is expected to be well behaved with large similarities. Our ex-periments show results, given a finite number of servers and applications, thetraffic is expected to have more similarities than dissimilarities. The experimentresults show that we can effectively detect anomalies in the data center applica-tion traffic. Our experiments resulted in the understanding that larger the dataset more effective the training model, and better the anomaly detection for datacenter application traffic.
Many interesting aspects of our approach still remain to be explored, andcomparisons with other available machine learning methods. Further refinementto our approach could be conducted using comparisons to unstructured andunlabeled data used in natural language processing algorithms.
Acknowledgements
We wish to thank Dr. Ratinder Paul Singh Ahuja, CEO of ShieldX NetworksInc. for research suggestions and making the data center application server datasets available to us. Invaluable review feedback from Dr. Daniel Engels helpedus improve the work.
15
Bhasin et al.: Data Center Application Security
Published by SMU Scholar, 2018
References
1. Ying Cao. Osiris: a malware behavior capturing system implemented at virtualmachine monitor layer. 2013.
2. Chandrika Palagiri. Network-based intrusion detection using neural networks. De-partment of Computer Science Rensselaer Polytechnic Institute Troy, New York,pages 12180–3590, 2002.
3. Leonid Portnoy, Eleazar Eskin, and Sal Stolfo. Intrusion detection with unlabeleddata using clustering. In In Proceedings of ACM CSS Workshop on Data MiningApplied to Security (DMSA-2001. Citeseer, 2001.
4. Wenjie Hu, Yihua Liao, and V Rao Vemuri. Robust support vector machines foranomaly detection in computer security. In ICMLA, pages 168–174, 2003.
5. Subutai Ahmad, Alexander Lavin, Scott Purdy, and Zuha Agha. Unsupervised real-time anomaly detection for streaming data. Neurocomputing, 262:134–147, 2017.
16
SMU Data Science Review, Vol. 1 [2018], No. 2, Art. 10
https://scholar.smu.edu/datasciencereview/vol1/iss2/10