data and computer communications lecture 2 data transmission
Post on 21-Dec-2015
227 views
TRANSCRIPT
Data and Computer Communications
Lecture 2Data Transmission
2
Terminology (1)TransmitterReceiverMedium
Guided mediume.g. twisted pair, optical fiber
Unguided mediume.g. air, water, vacuum
3
Terminology (2)Direct link
Transmission path between two devices No intermediate devices
Point-to-point Direct link Only 2 devices share link
Multi-point More than two devices share the link
4
Terminology (3)Simplex
One directione.g. Television
Half duplex Either direction, but only one way at a time
e.g. police radio
Full duplex Both directions at the same time
e.g. telephone
5
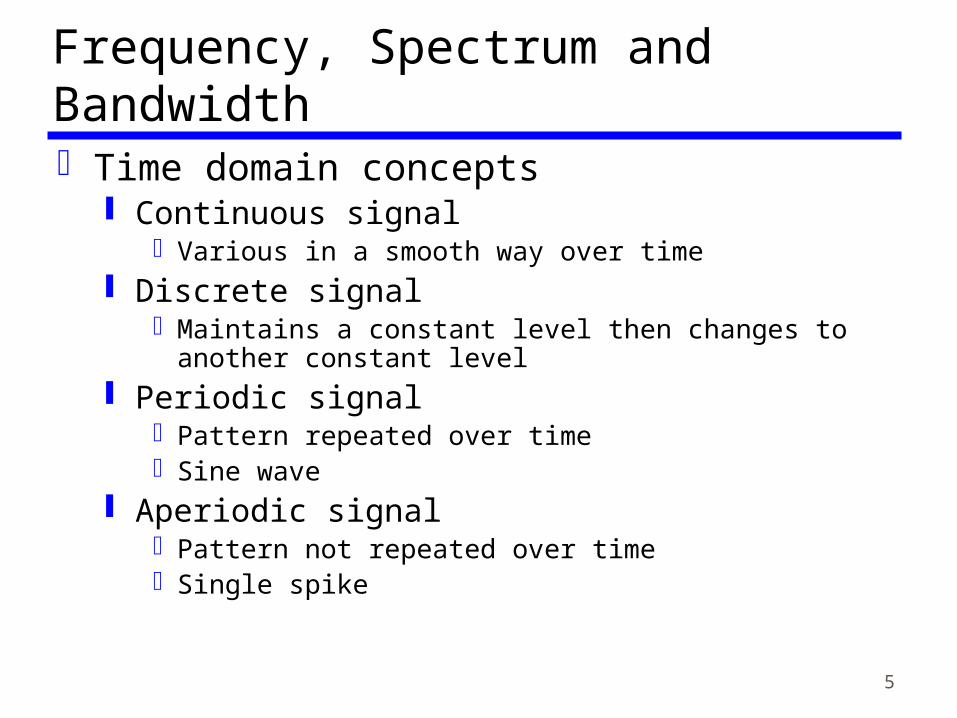
Frequency, Spectrum and BandwidthTime domain concepts
Continuous signalVarious in a smooth way over time
Discrete signalMaintains a constant level then changes to another
constant level Periodic signal
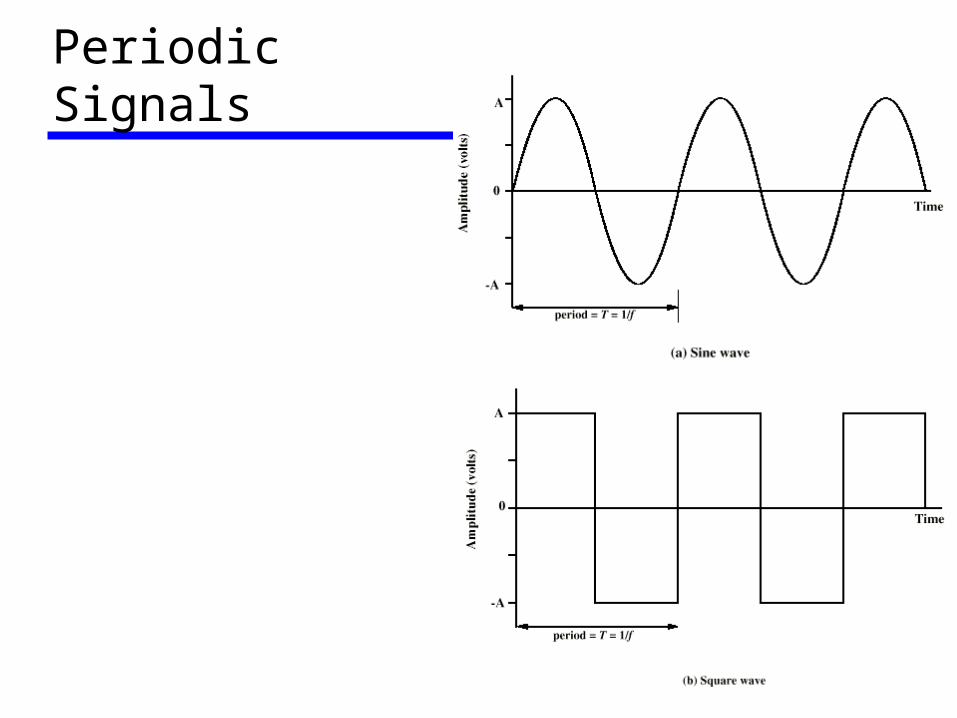
Pattern repeated over timeSine wave
Aperiodic signalPattern not repeated over timeSingle spike

6
Continuous & Discrete Signals
7
PeriodicSignals
8
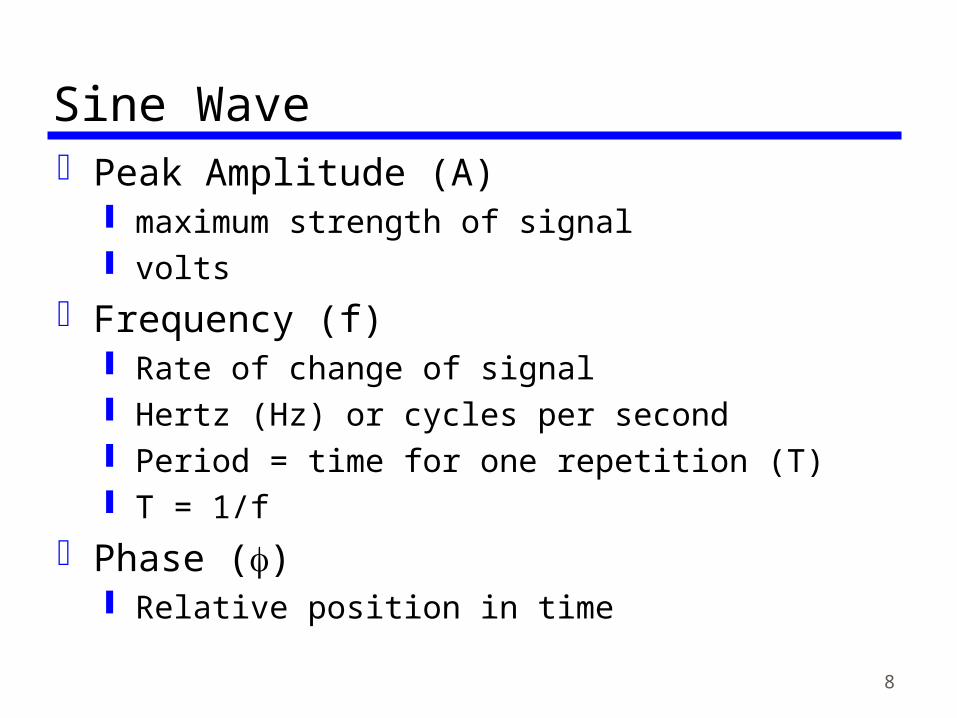
Sine WavePeak Amplitude (A)
maximum strength of signal volts
Frequency (f) Rate of change of signal Hertz (Hz) or cycles per second Period = time for one repetition (T) T = 1/f
Phase () Relative position in time

9
Varying Sine Waves

10
WavelengthDistance occupied by one cycleDistance between two points of
corresponding phase in two consecutive cycles
Assuming signal velocity v
= vT f = v c = 3*108 ms-1 (speed of light in free space)
11
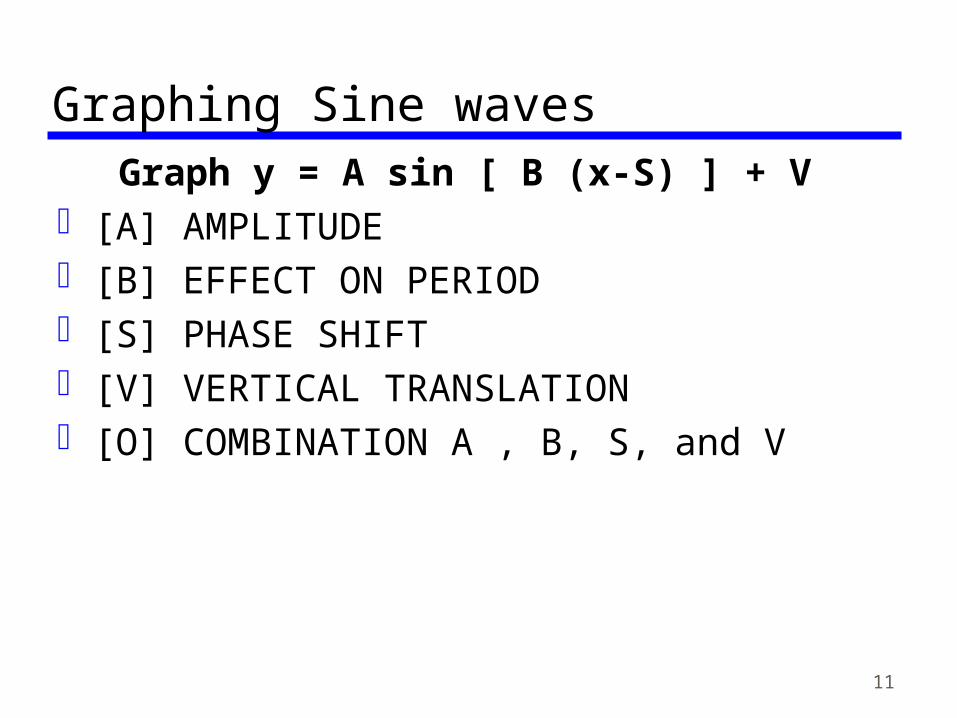
Graphing Sine wavesGraph y = A sin [ B (x-S) ] + V
[A] AMPLITUDE [B] EFFECT ON PERIOD [S] PHASE SHIFT [V] VERTICAL TRANSLATION [O] COMBINATION A , B, S, and V
12
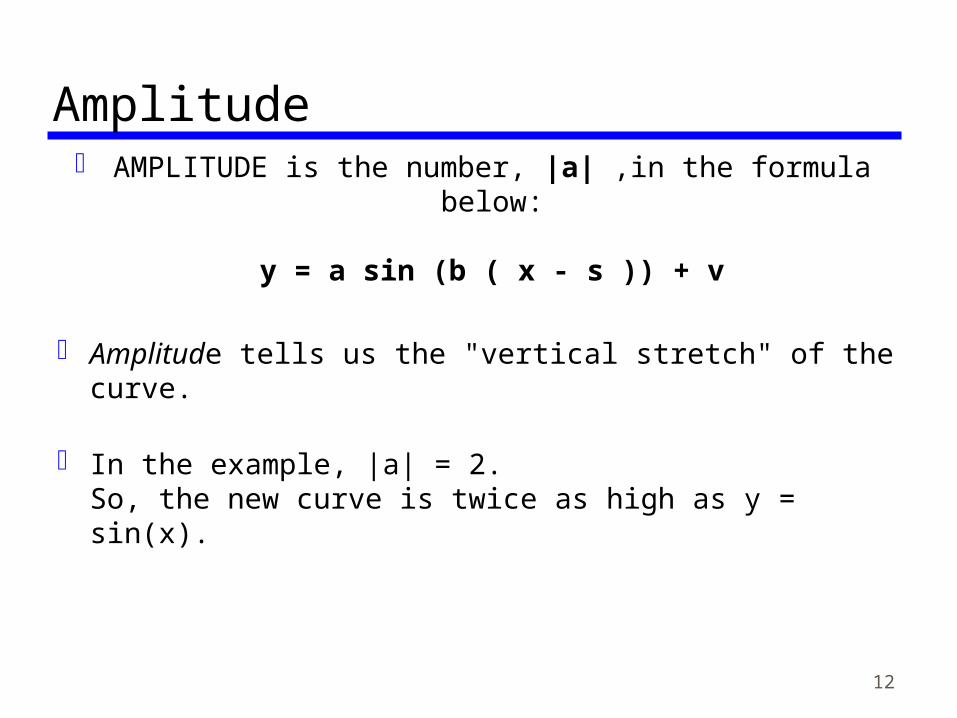
Amplitude AMPLITUDE is the number, |a| ,in the formula
below:
y = a sin (b ( x - s )) + v
Amplitude tells us the "vertical stretch" of the curve.
In the example, |a| = 2. So, the new curve is twice as high as y = sin(x).

13
Amplitude Example

14
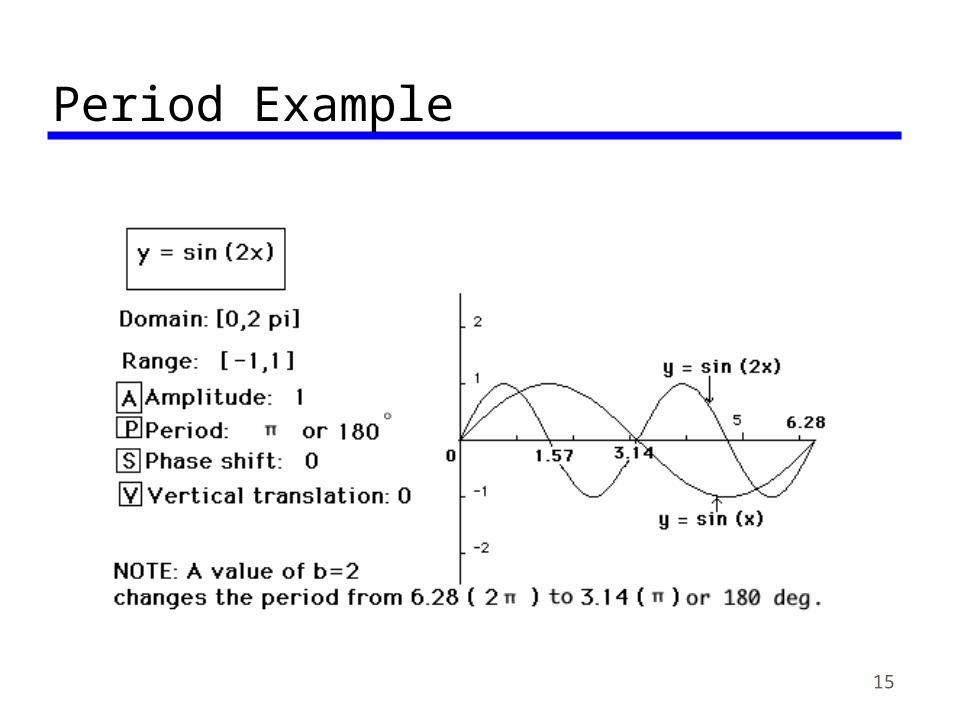
PeriodPERIOD is the number, (360 / b) or (2 pi / b) , from
the formula below:
y = a sin (b ( x - s )) + v
PERIOD tells us the "horizontal stretch" of the curve.
In this example, b = 2. So, the period of the new curve is (360 / 2 or 180 degrees.) In radians, it is (2 pi / 2) or ( pi ) radians.
15
Period Example
16
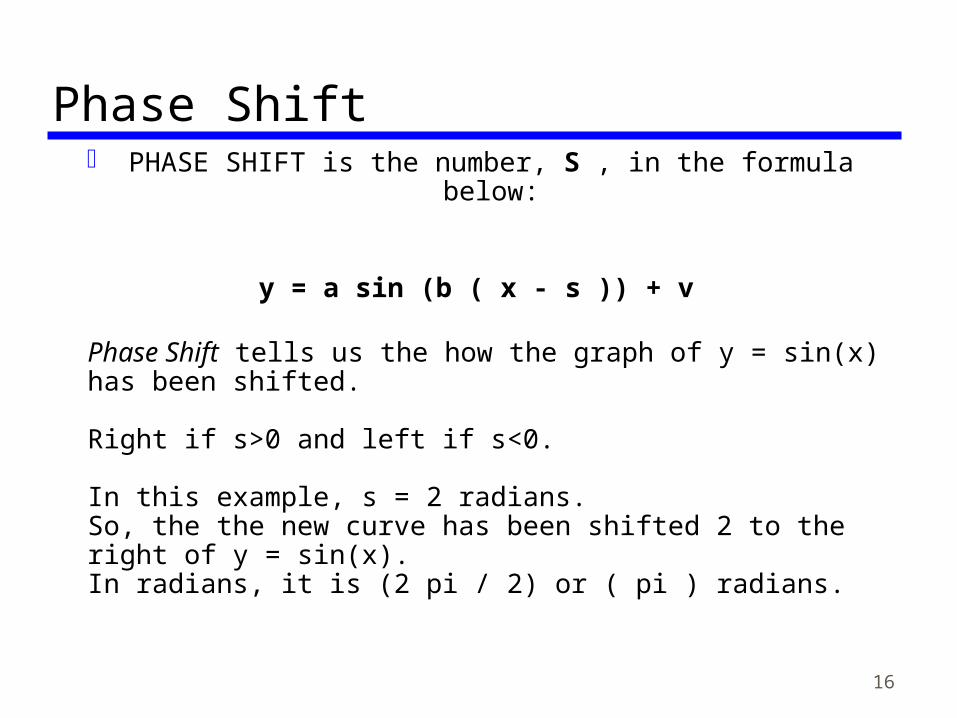
Phase Shift PHASE SHIFT is the number, S , in the formula below:
y = a sin (b ( x - s )) + v
Phase Shift tells us the how the graph of y = sin(x) has been shifted.
Right if s>0 and left if s<0.
In this example, s = 2 radians. So, the the new curve has been shifted 2 to the right of y = sin(x). In radians, it is (2 pi / 2) or ( pi ) radians.

17
Phase Shift Example
18
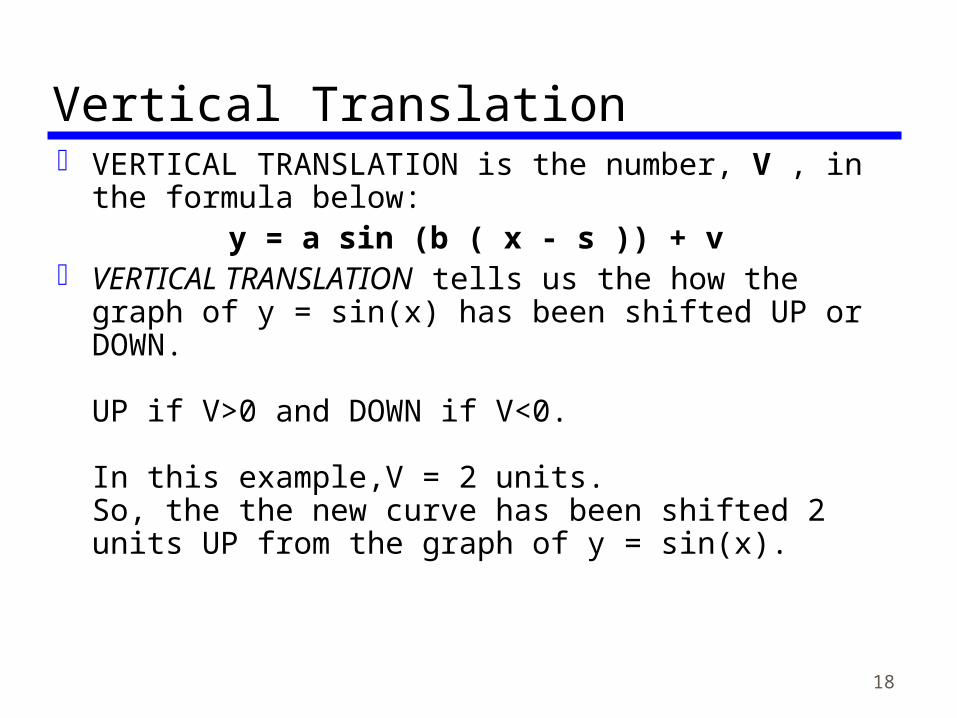
Vertical Translation VERTICAL TRANSLATION is the number, V , in the
formula below:y = a sin (b ( x - s )) + v
VERTICAL TRANSLATION tells us the how the graph of y = sin(x) has been shifted UP or DOWN.
UP if V>0 and DOWN if V<0.
In this example,V = 2 units. So, the the new curve has been shifted 2 units UP from the graph of y = sin(x).

19
Vertical Translation Example

20
Combinationy = a sin (b ( x - s )) + v
In the example a = 2, b = 3, s = 1.57 radians (or 90 degrees) , and v = -1.
So, the the new curve has been vertically stretched by a factor of 2.Its period had been horizontally shrunk from 2 pi (or 360 degrees) to (2 pi / 3) (or 120 degrees.)It has been horizontally shifted 1.57 radians (or pi/2 or 90 degrees) to the right.It has been vertically shifted 1 unit down from the graph of y = sin(x).

21
Combination example
22
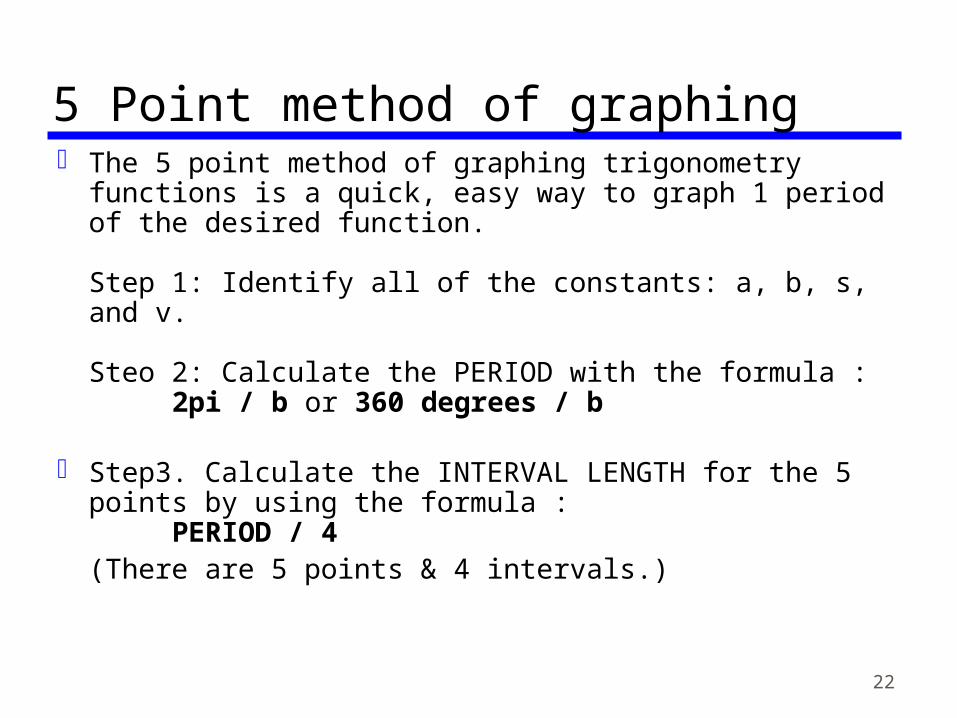
5 Point method of graphing The 5 point method of graphing trigonometry
functions is a quick, easy way to graph 1 period of the desired function.
Step 1: Identify all of the constants: a, b, s, and v.
Steo 2: Calculate the PERIOD with the formula : 2pi / b or 360 degrees / b
Step3. Calculate the INTERVAL LENGTH for the 5 points by using the formula :
PERIOD / 4 (There are 5 points & 4 intervals.)
23
5 Point method continued Step 4: Use the "s" value, the phase shift, to
calculate the endpoints of the new interval. The original graphing interval of y = sin(x) is [0, 360]. If s<>0, then the new interval is [ 0 + s, 360 + s ].
Step 5: Build a table starting with 0+s, the first point. The second point is obtained by adding the INTERVAL LENGTH to the first point and so on.
Step 6: Label the x and y axes with the appropriate values. Plot the 5 points as calculated from the table and connect the 5 points with a smooth curve.
24
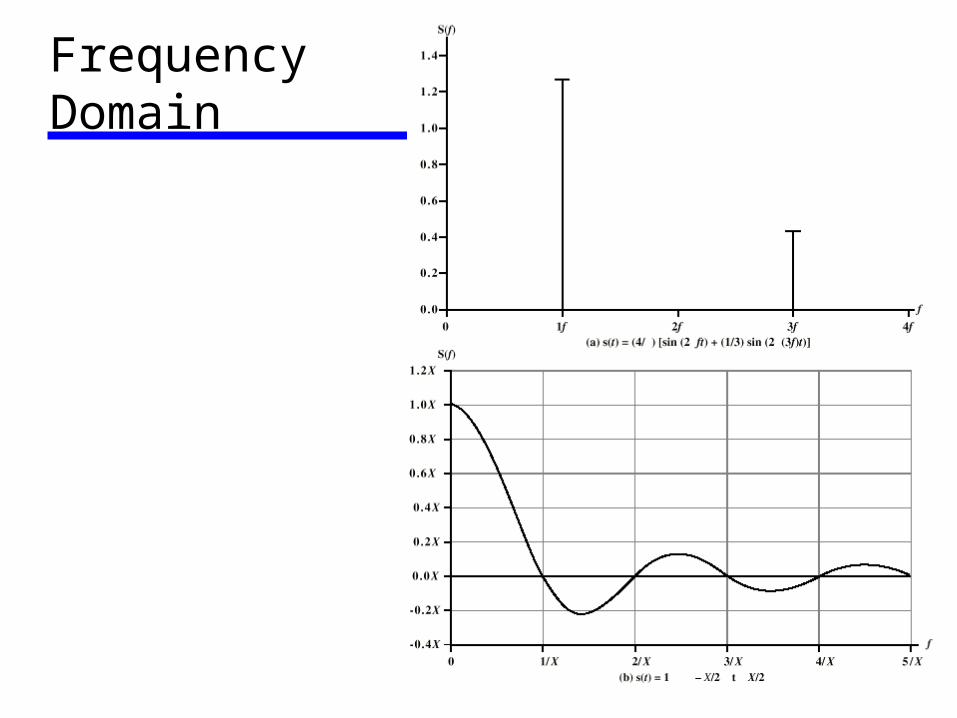
Frequency Domain ConceptsSignal usually made up of many
frequenciesComponents are sine wavesCan be shown (Fourier analysis) that any
signal is made up of component sine waves
Can plot frequency domain functions
25
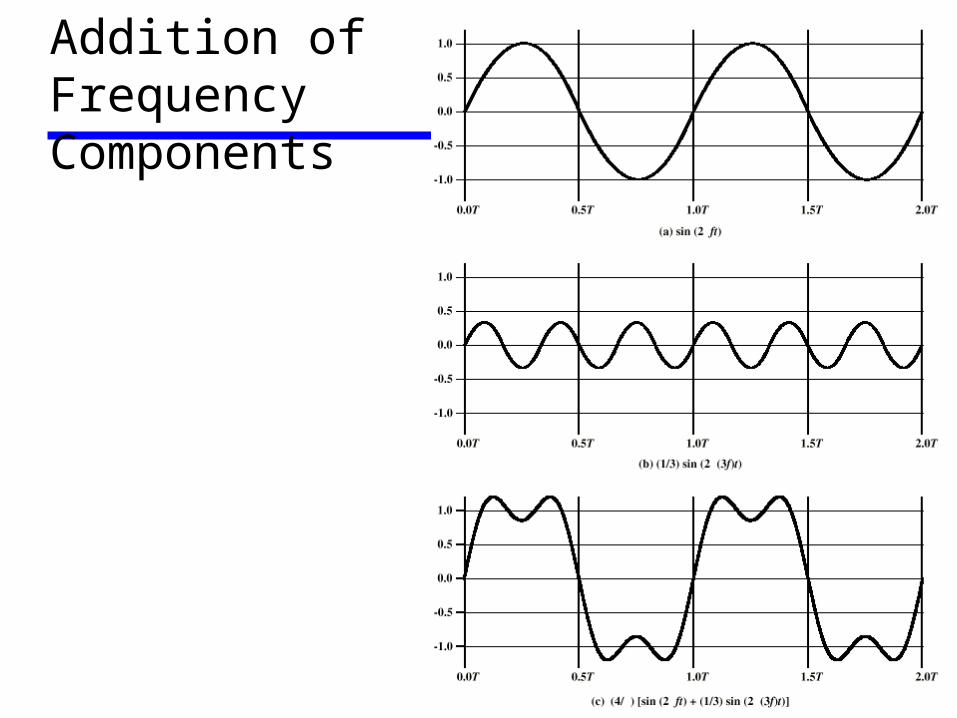
Addition of FrequencyComponents
26
FrequencyDomain

27
Spectrum & Bandwidth Spectrum
range of frequencies contained in signal
Absolute bandwidth width of spectrum
Effective bandwidth Often just bandwidth Narrow band of frequencies containing most of the
energy
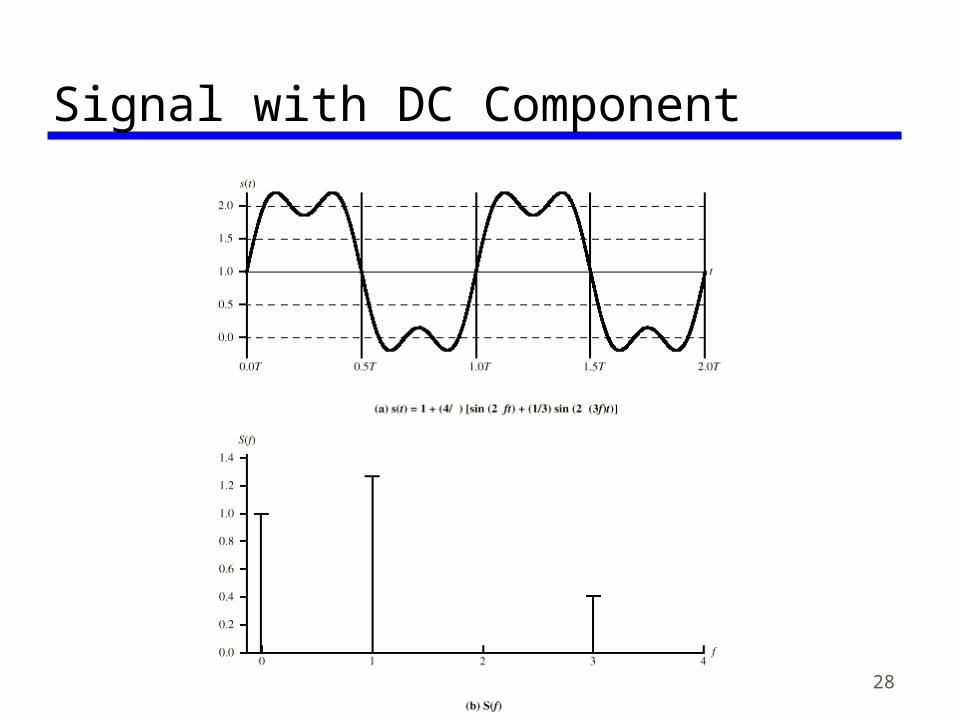
DC Component Component of zero frequency Causes vertical translation in signal Shows in frequency domain as a value at f=0
28
Signal with DC Component

29
Complex WaveformsWaveforms that are not sinusoidal in shape are called complex waveforms. There are many types:
Speech
Music Saw tooth Square wave
30
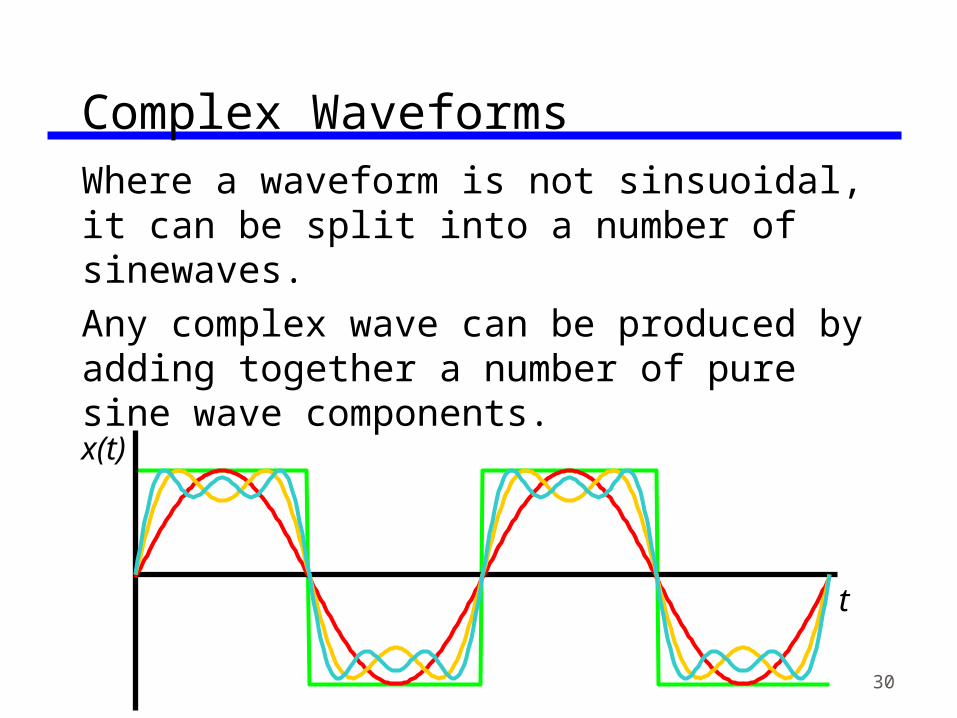
Complex WaveformsWhere a waveform is not sinsuoidal, it can be split into a number of sinewaves.Any complex wave can be produced by adding together a number of pure sine wave components.
x(t)
t

31
Fundamental Frequency
The sine wave components consist of the fundamental together with frequencies which are multiples :
The fundamental frequency 3 x fundamental, 4 x fundamental etc.
The fundamental is the wave that has the same frequency of the waveform being considered.
32
HarmonicsThese multiples of the fundamental are called harmonics. Twice the fundamental is known as the second harmonic. Three times the fundamental is known as the third harmonic.etc.
33
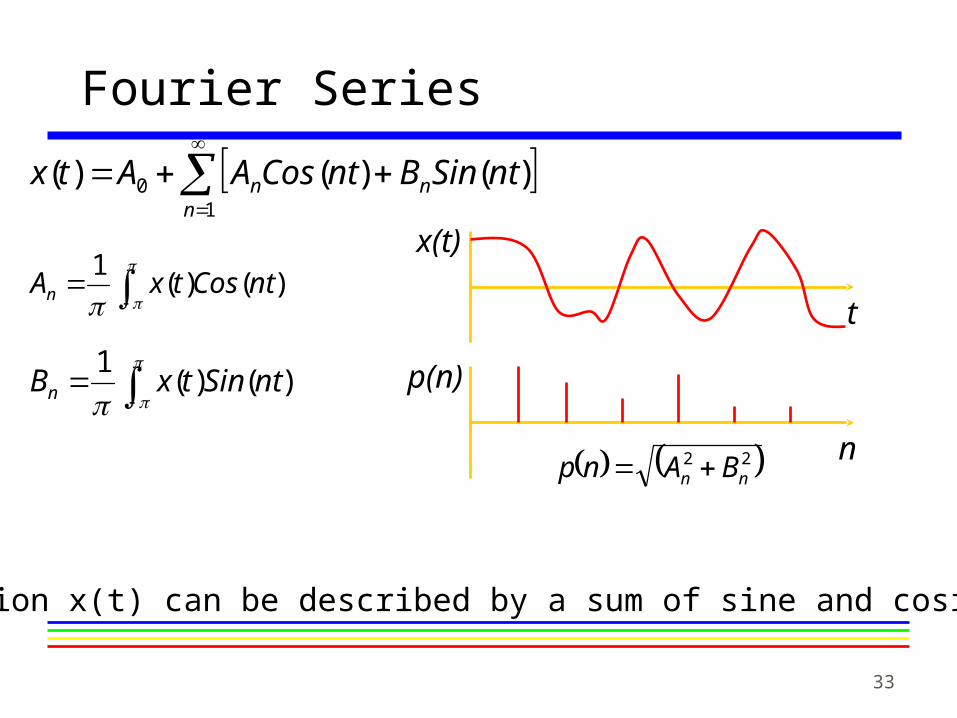
Fourier Series
)()(
1ntSintxBn
)()(
1ntCostxAn
1
0 )()()(n
nn ntSinBntCosAAtx
Any function x(t) can be described by a sum of sine and cosine terms.
x(t)
t
p(n)
n 22nn BAnp
34
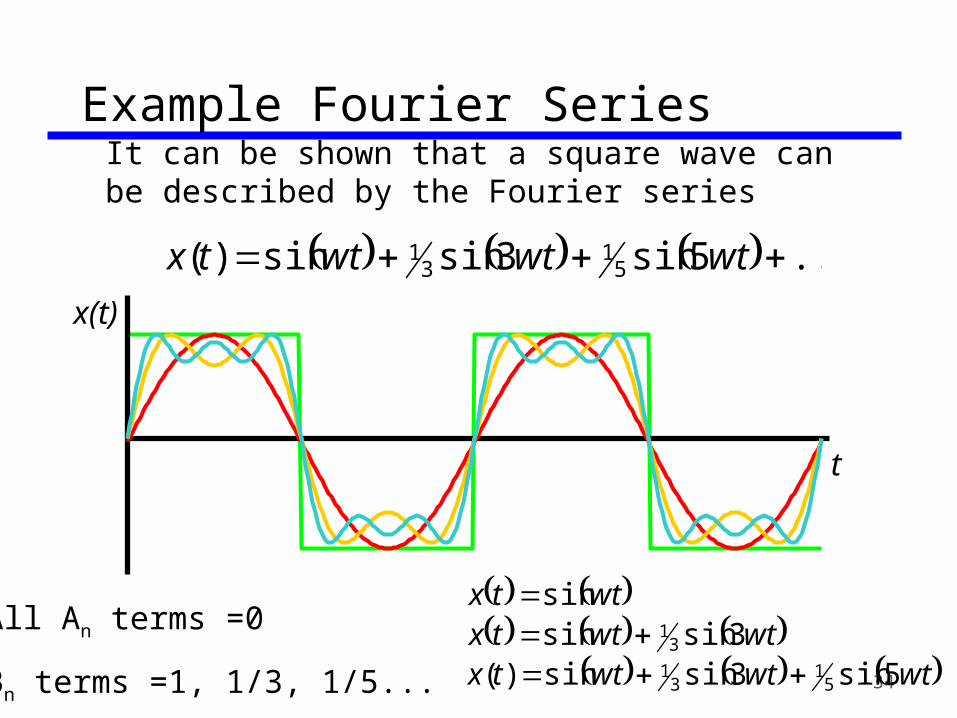
Example Fourier SeriesIt can be shown that a square wave can be described by the Fourier series
...5sin3sinsin)( 51
31 wtwtwttx
wttx sin wtwttx 3sinsin 3
1
x(t)
t
wtwtwttx 5sin3sinsin)( 51
31
All An terms =0
Bn terms =1, 1/3, 1/5...

35
Fourier Series
Fourier series notes extracted from site for Jeff waldockFourier series peoblems in exam.