data and analytics: assessment and student growth percentiles · language arts (ela) and math...
TRANSCRIPT

Assessment Analytics:Proficiency and Student GrowthOCTOBER 31, 2016

IntroductionsPresented by:
Learning and Teaching – Kathe Taylor, Assistant Superintendent & Marissa Rathbone, Director of Operations
With guidance and support provided by:
Title Programs – Paula Moore, Director; Reed Rawlings, Data Analyst
Office of Student and School Success (OSSS) – Serene Cook, Instructional Services, Assessment, and Professional Learning Coordinator
Student Information – Deb Came, Assistant Superintendent; Erica Ferrelli, Lance Sisco, and Ashley Colburn, Data Analysts
Data Governance – Tim Stensager, Director & Susan Canaga, Data Coaching Program Manager
DATE
OFFICE OF SUPERINTENDENT OF PUBLIC INSTRUCTION
2

Webinar Objectives• Define Proficiency and Student Growth Percentiles
• Walk through new data platform
• Explore ways to use performance indicator analytics
• Share ideas for a district’s next steps
10/31/2016
OFFICE OF SUPERINTENDENT OF PUBLIC INSTRUCTION
3

OSPI Vision
Every student ready for career, college, and life
10/31/2016 OFFICE OF SUPERINTENDENT OF PUBLIC INSTRUCTION 4
OSPI Mission
To provide funding, resources, tools, data and technical assistance that enable educators to ensure students succeed in our public schools, are prepared to access post-secondary training and education, and are equipped to thrive in their careers and lives.
10/31/2016 OFFICE OF SUPERINTENDENT OF PUBLIC INSTRUCTION 5

Measuring Success
10/31/2016 OFFICE OF SUPERINTENDENT OF PUBLIC INSTRUCTION 6
Measures of Success• Increase four- and five-year high school graduation rates• Increase enrollment and completion rates and decrease
remediation rates in post-secondary training and education
Performance Indicators We must help students:• Enter kindergarten with expected skills in all six areas identified by the
Washington Kindergarten Inventory of Developing Skills (WaKIDS).• Meet standard on the 3rd-, 8th-, and 11th-grade statewide English
language arts (ELA) and math assessments, and the 8th-grade statewide science assessment.
• Grow toward proficiency in ELA and math, as determined by Student Growth Percentiles, in 4th and 6th grades.
• Enroll in Algebra I/Integrated Math I by the end of 8th or 9th grade and earn high school credit.
• Enroll in college-level courses and earn dual credit.• Take the SAT and ACT and earn college-ready scores.• Access financial aid for post-secondary learning.
We must help students avoid:• 9th-grade course failure.• Suspensions and expulsions.• Chronic absenteeism.

Defining Assessment and Student Growth Percentiles
10/31/2016
OFFICE OF SUPERINTENDENT OF PUBLIC INSTRUCTION
7

What Do We Mean by Proficiency?
Proficiency = How well students perform on the state assessments
10/31/2016
OFFICE OF SUPERINTENDENT OF PUBLIC INSTRUCTION
8

What assessment data is included?Data from state assessments are available as:Smarter Balanced Assessments (SBA)◦ Math and ELA – Grades 3rd – 8th, 10th & 11th
End of Course (EOC) Exams◦Math (Algebra 1 or Geometry) & Biology
Measurements of Student Progress (MSP)◦ Science – Grades 5th & 8th
10/31/2016
OFFICE OF SUPERINTENDENT OF PUBLIC INSTRUCTION
9

What are Student Growth Percentiles?Describe a student’s growth compared only to other students with similar prior test scores; no other student characteristics are considered.
Allow us to:
• fairly compare students who enter school at different levels; and
• demonstrate a student’s growth and academic progress, regardless of proficiency.
10/31/2016
OFFICE OF SUPERINTENDENT OF PUBLIC INSTRUCTION
10

10/31/2016
OFFICE OF SUPERINTENDENT OF PUBLIC INSTRUCTION
11
Source: http://www.k12.wa.us/assessment/studentgrowth.aspx

SGP ResourcesDistricts receive individual student growth percentile data through the Washington Assessment Management System (WAMS). For a deeper understanding of SGP, visit the assessment web page.
10/31/2016
OFFICE OF SUPERINTENDENT OF PUBLIC INSTRUCTION
12

Student Growth Percentiles are Part of the Washington State Achievement Index
The Achievement Index is intended to: provide a fair and consistent measurement of Washington’s public schools. present a clear picture of how schools and districts are performing. demonstrate improvement over time and highlight closing achievement gaps.
https://eds.ospi.k12.wa.us/WAI/
https://eds.ospi.k12.wa.us/WAI/10/31/2016
OFFICE OF SUPERINTENDENT OF PUBLIC INSTRUCTION
13

Questions?
10/31/2016
OFFICE OF SUPERINTENDENT OF PUBLIC INSTRUCTION
14

Accessing the DataWHY THESE NEW PRESENTATIONS OF DATA ARE IMPORTANT
10/31/2016
OFFICE OF SUPERINTENDENT OF PUBLIC INSTRUCTION
15

How do proficiency analytics add value to what is already on the Report Card?• Report Card allows comparisons of proficiency:
• One student group at a time
• Proficiency analytics allow comparisons:• Across student groups
10/31/2016
OFFICE OF SUPERINTENDENT OF PUBLIC INSTRUCTION
16

What is the added value of performance indicator analytics compared to SGP Data and Charts?
• SGP charts display median SGPs relative to proficiency:• One student group at a time• One year at a time
• Performance Indicator analytics allow users to compare:• Across student subgroups• School or district growth relative to the growth of others regardless of
proficiency
10/31/2016
OFFICE OF SUPERINTENDENT OF PUBLIC INSTRUCTION
17

Why report assessment and SGP in this way?• Provides a user-friendly way to identify disparities between
student groups• Expands conversation beyond proficiency to include student
growth• Reveals places where achievement and growth are notable• Invites conversations about equity
10/31/2016
OFFICE OF SUPERINTENDENT OF PUBLIC INSTRUCTION
18

Accessing the DataHOW TO FIND THESE RESOURCES AND WHAT TO DO WITH THEM WHEN YOU GET THERE
10/31/2016
OFFICE OF SUPERINTENDENT OF PUBLIC INSTRUCTION
19

10/31/2016
OFFICE OF SUPERINTENDENT OF PUBLIC INSTRUCTION
20
Step 1
10/31/2016
OFFICE OF SUPERINTENDENT OF PUBLIC INSTRUCTION
21
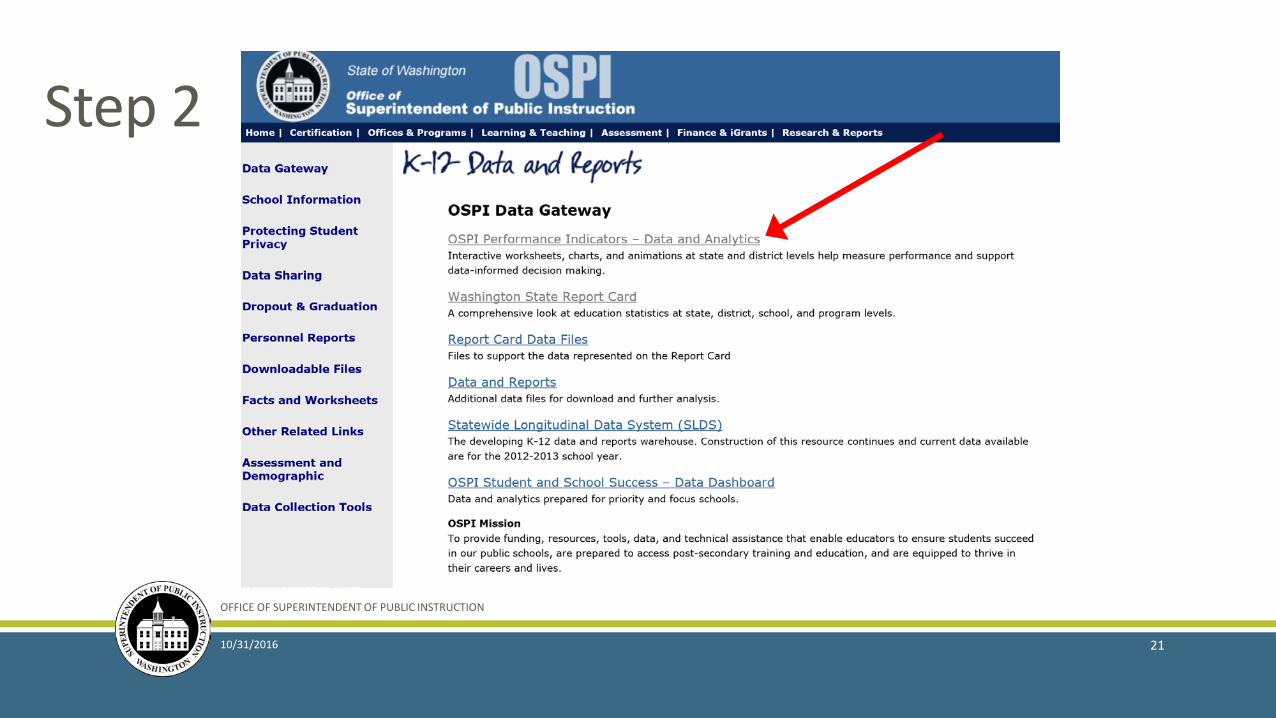
Step 2

10/31/2016
OFFICE OF SUPERINTENDENT OF PUBLIC INSTRUCTION
22
Step 3

10/31/2016
OFFICE OF SUPERINTENDENT OF PUBLIC INSTRUCTION
23
Assessment Analytic in TableauStep 4

What is Tableau?
10/31/2016
OFFICE OF SUPERINTENDENT OF PUBLIC INSTRUCTION
24

Actually…Tableau is a web-based tool that helps people see and understand their data. similar to Excel, but with greater flexibility works better across platforms and devices
10/31/2016
OFFICE OF SUPERINTENDENT OF PUBLIC INSTRUCTION
25

10/31/2016
OFFICE OF SUPERINTENDENT OF PUBLIC INSTRUCTION
26
Assessment Analytic in TableauStep 4

10/31/2016
OFFICE OF SUPERINTENDENT OF PUBLIC INSTRUCTION
27
Data Dashboard
10/31/2016
OFFICE OF SUPERINTENDENT OF PUBLIC INSTRUCTION
28
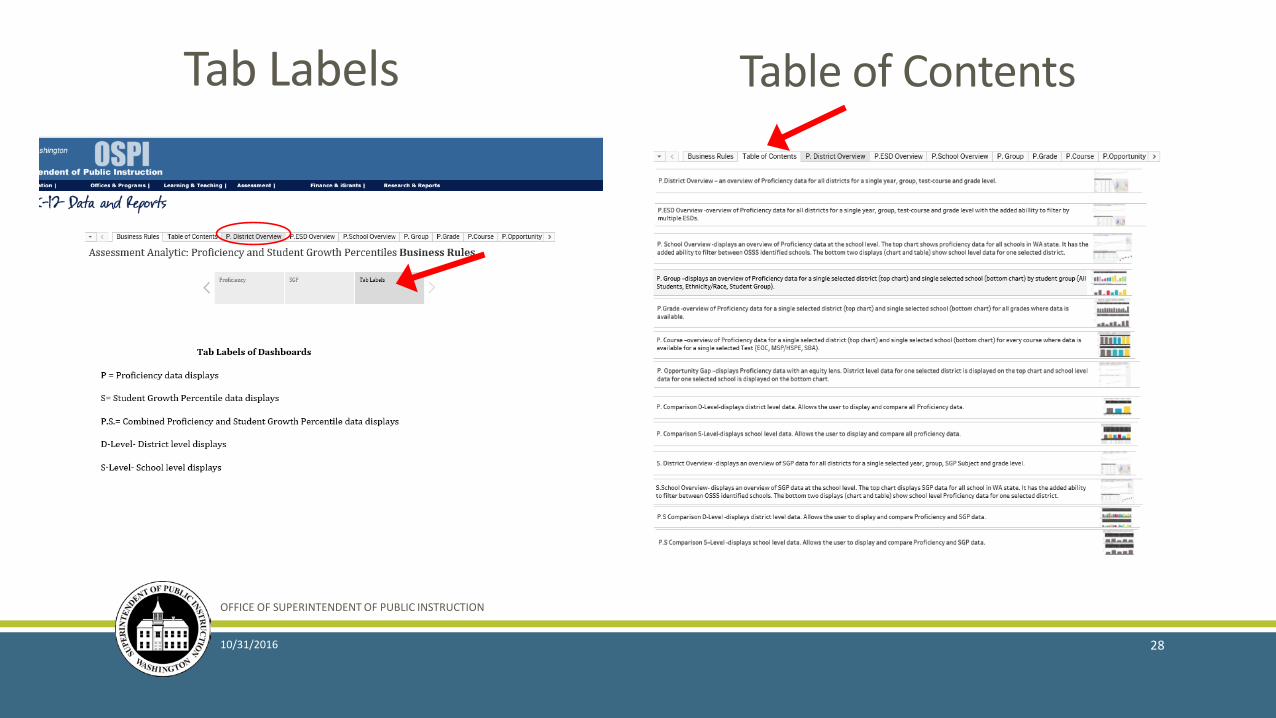
Tab Labels Table of Contents

10/31/2016
OFFICE OF SUPERINTENDENT OF PUBLIC INSTRUCTION
29
SGP Data (S) Proficiency + SGP (P.S.)

Go Live
10/31/2016
OFFICE OF SUPERINTENDENT OF PUBLIC INSTRUCTION
30

Questions?
10/31/2016
OFFICE OF SUPERINTENDENT OF PUBLIC INSTRUCTION
31

Data Highlights
10/31/2016
OFFICE OF SUPERINTENDENT OF PUBLIC INSTRUCTION
32

On the surface, what are these bar charts saying?
What stories might these data be telling?
How could your district use these data?
10/31/2016 OFFICE OF SUPERINTENDENT OF PUBLIC INSTRUCTION 33

10/31/2016 OFFICE OF SUPERINTENDENT OF PUBLIC INSTRUCTION 34
On the surface, what is this line graph saying?
What stories might this graph be telling?
How could your district this information? If this were your district, what would you want to explore?

10/31/2016 OFFICE OF SUPERINTENDENT OF PUBLIC INSTRUCTION 35
On the surface, what is this line graph saying?
What stories might this graph be telling?
How could your district this information?

For Further Discussion• When you look at your data, what results make you wonder, “hmmmmm…..”?
• What factors are affecting student performance, and how can your district impact them?
• What can you do to engage in conversations about these data in your district?• Who would you want to share this information with? Who should be part of the conversation?
• What would you want to learn from other districts that are getting better results?• What can you do to learn from another district? • What can the ESD do to help districts learn from each other?
• How can you use these new ways of looking at data to inform your district’s efforts to improve equity?
10/31/2016
OFFICE OF SUPERINTENDENT OF PUBLIC INSTRUCTION
36

Questions?
10/31/2016
OFFICE OF SUPERINTENDENT OF PUBLIC INSTRUCTION
37

For Technical Information
10/31/2016
OFFICE OF SUPERINTENDENT OF PUBLIC INSTRUCTION
38
Photo by Paola Kizette Cimenti | CC BY NC ND
Susan Canaga, Data Governance Program ManagerQuestions about access to data and today’s presentation [email protected] | 360-725-4473 Tim Stensager, Director of Performance ManagementQuestions about OSPI’s performance [email protected] | 360-725-6005Ashley Colburn, Data Analyst, Student InformationQuestions about SGP data and [email protected] | 360-725-4984Erica Ferrelli, Data Analyst, Student InformationQuestions about Tableau assessment [email protected] | 360-725-6226
http://bit.ly/Data-Reports

10/31/2016
OFFICE OF SUPERINTENDENT OF PUBLIC INSTRUCTION
39
For Program InformationKathe Taylor, Assistant Superintendent of Learning and TeachingQuestions about program [email protected] | 360-725-6417 Marissa Rathbone, Director of OperationsQuestions about program [email protected] | 360-725-4968 Serene Cook, Instructional Services, Assessment, and Professional Learning CoordinatorQuestions about OSSS [email protected] | 253-310-1414Reed Rawlings, Research AnalystQuestions about Title I [email protected] | 360-725-6226
http://bit.ly/Data-Reports

Except where otherwise noted, this work by the Office of Superintendent of Public Instruction is licensed under a Creative
Commons 4.0 International License.
10/31/2016
OFFICE OF SUPERINTENDENT OF PUBLIC INSTRUCTION
40