data analytics & key performance measures€¦ · data analytics & key performance measures...
TRANSCRIPT

©2015 RSM US LLP. All Rights Reserved. ©2015 RSM US LLP. All Rights Reserved.
DATA ANALYTICS & KEY PERFORMANCE MEASURES
May 16,2017

©2015 RSM US LLP. All Rights Reserved.
Your speakers
2
Mike D’Agostino Manager mike.d’[email protected] 913.302.3368 Mike is RSM’s national Business Intelligence lead for higher education. He specializes in Business Intelligence, Data Warehousing, and Database Administration. He has participated in the architecture and development of many custom data warehousing and business analytic solutions.

©2015 RSM US LLP. All Rights Reserved.
RSM overview
On October 26, 2015 McGladrey LLP changed its name to RSM US LLP and united with fellow firms in its global network under the common brand – RSM
3
Our focus is to serve every client, every day, to the
best of our ability.
Our Firm
RSM US LLP is the leading provider of audit, tax and
consulting services focused on the middle market,
with more than 9,000 people in 86 offices
nationwide. We are a global CPA with more than
38,300 people in over 120 countries.
For 90 years, RSM has served as the first-choice to
middle-market leaders. Our core values—respect,
integrity, teamwork, excellence and stewardship—
are the foundation of how we interact with clients and
each other. We take pride in being accessible to our
clients and proactive with our counsel.

©2015 RSM US LLP. All Rights Reserved.
Attendee Introductions
4
Name
Job title
Experience with Business Intelligence tools
High, Medium, Low/None

©2015 RSM US LLP. All Rights Reserved.
Agenda
• Situation and problem - 30
• Technology landscape – 35
• Implement an analytic platform – 45
• Keys to success - 20
• Case studies/demos - 40
• BI Trends – 10
• Questions and Answers – 10
5

©2015 RSM US LLP. All Rights Reserved.
Audience Question # 1
• How are the reports you use created?
− BI tool
− Auto generated static report
− Manually created in Excel/Access
6

©2015 RSM US LLP. All Rights Reserved. ©2015 RSM US LLP. All Rights Reserved.
SITUATION AND PROBLEM

©2015 RSM US LLP. All Rights Reserved.
Business Intelligence vs. Data Warehousing vs. Decision Support vs…
8

©2015 RSM US LLP. All Rights Reserved.
Making Sense of it all
9
Business intelligence is about empowering organizations to truly
leverage their data as an organizational asset to foster innovation,
drive organizational excellence and create competitive advantage
©2015 RSM US LLP. All Rights Reserved.
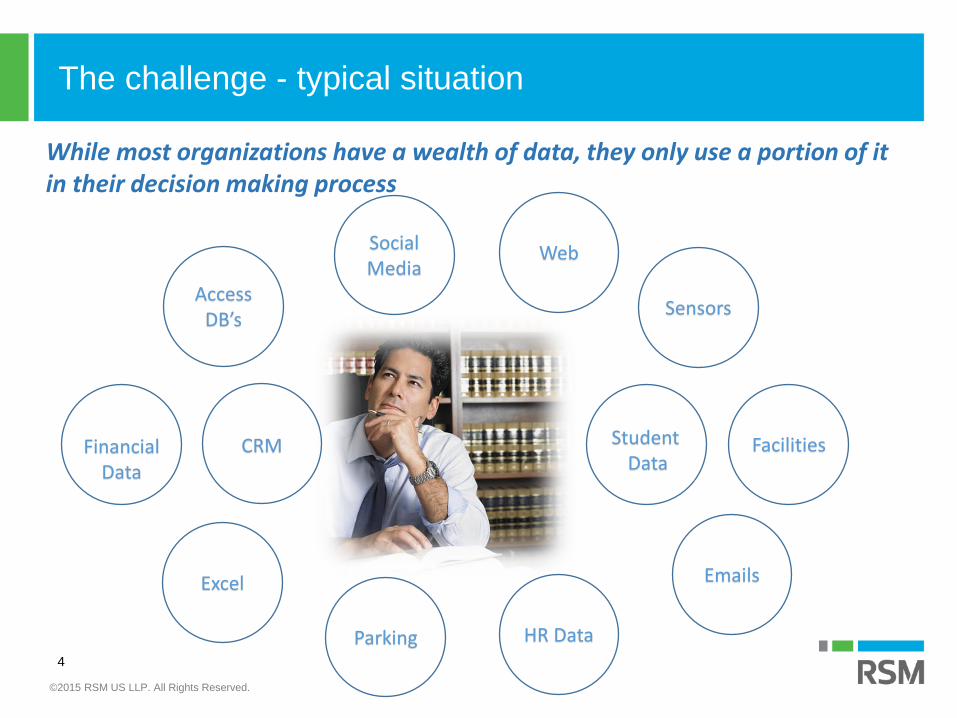
The challenge - typical situation
While most organizations have a wealth of data, they only use a portion of it in their decision making process
Social Media
Emails
Financial Data
Access DB’s
Sensors
Excel
Parking
Web
Facilities
HR Data
CRM Student Data
4

©2015 RSM US LLP. All Rights Reserved.
The challenge - typical situation
Many do not have the ability to effectively and efficiently transform their raw data into actionable information

©2015 RSM US LLP. All Rights Reserved.
The challenge – the impact
The result of a disjointed data eco-system can have a significant negative impact on organizations
Conflicting answers to the same question
Different definitions for the same data element or calculation
Timing differences
Data quality issues
Less than optimal decision-making
Inefficient operations
Lost productivity
Unsatisfied customers
6
A silo’d data environment can lead to and result in

©2015 RSM US LLP. All Rights Reserved.
The challenge - indictors
13
Transaction systems not integrated
New software implementation
Current reporting not “actionable” (not timely)
Reporting and analysis requires a significant manual effort
Known data integrity issues
Conflicting reporting
Failed or stalled analytics initiatives
There are certain indicators that business intelligence solutions can be beneficial to an organization

©2015 RSM US LLP. All Rights Reserved.
The challenge
Timely
Relevant Accurate Actionable

©2015 RSM US LLP. All Rights Reserved.
15
• State funding has decreased significantly
• The US government is scaling back funding for university-based research programs
• Declining traditional enrollments
• Shift in modality
• Net tuition rates are rising as both need and merit aid programs diminish and families are left with a larger fraction of the bill
• Limited ability to scale (up/down) the cost of instruction
Situation
• Higher Education decision makers are being forced to evaluate the efficiency and cost structure of their institution to cope with the industry’s changing landscape
Problem
The challenge – higher education
©2015 RSM US LLP. All Rights Reserved.
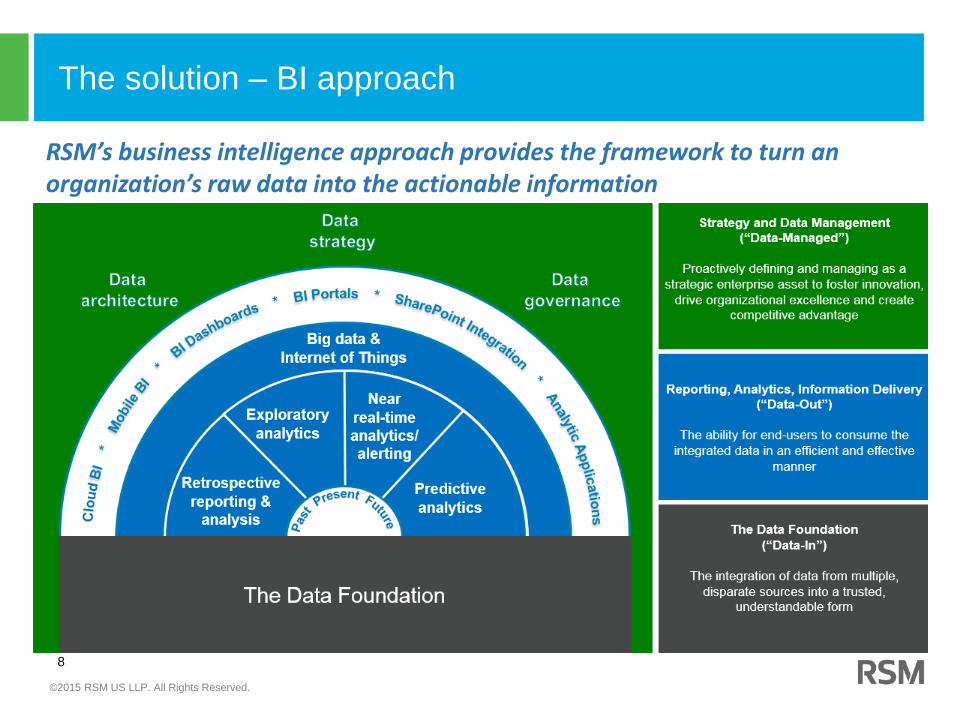
The solution – BI approach
RSM’s business intelligence approach provides the framework to turn an organization’s raw data into the actionable information
8

©2015 RSM US LLP. All Rights Reserved.
Data In – Data foundation
17
Transforming your organization requires a trusted analytics base
The approach to building a solid data foundation centers
− Extract the data from the authoritative source
− Transform the data from disparate sources into an integrated view that
is easily understood by the data consumers
− Load the data into a structured data model

©2015 RSM US LLP. All Rights Reserved.
Data Out – reporting, analytics and information delivery
18
Driving organizational excellence, competitive advantage and
proactive decision making
The approach to building a solid data foundation centers
− Determining the focus of the reporting and analytics required to
support your business goals
− Understanding the preferred information delivery methods of
your data consumers
− Selecting the appropriate enabling technology that balances
your required capabilities with total cost of ownership

©2015 RSM US LLP. All Rights Reserved.
Data managed – strategy and data management
19
Managing your data as a strategic asset for competitive advantage
and organizational excellence
Leveraging organizational data for a
competitive advantage and
organizational excellence centers on
three main concepts
• Defining a data strategy
• Establishing a pragmatic data
governance framework
• Implementing a flexible data and
technology architecture

©2015 RSM US LLP. All Rights Reserved.
The solution – BI approach
9

©2015 RSM US LLP. All Rights Reserved. ©2015 RSM US LLP. All Rights Reserved.
TECHNOLOGY LANDSCAPE

©2015 RSM US LLP. All Rights Reserved.
Gartner Magic Quadrant
22

©2015 RSM US LLP. All Rights Reserved.
Tableau
• Highly interactive and intuitive visual-based
exploration
• Customer experience and operations
• Advanced analytics
• Flexible deployment options
− Tableau Online
− Tableau on-premises
23

©2015 RSM US LLP. All Rights Reserved.
Tableau - Video
24

©2015 RSM US LLP. All Rights Reserved.
Qlik
• BI Leader for 7 years in a Row
• In-memory engine and associative data
model
• Multiple products:
− QlikView
− QlikSense
− Nprinting
25
©2015 RSM US LLP. All Rights Reserved.
Qlik – QlikSense Video
26

©2015 RSM US LLP. All Rights Reserved.
Qlik – NPrinting Video
27

©2015 RSM US LLP. All Rights Reserved.
Power BI
• Continued investment
• Ease of use plus complex analysis
• Active community
• Advanced analytics
• Price ($9.99 per user/mo)
28

©2015 RSM US LLP. All Rights Reserved.
Power BI - Video
29

©2015 RSM US LLP. All Rights Reserved.
Power BI - Video
30

©2015 RSM US LLP. All Rights Reserved.
How to Choose
• Requirements, Requirements, Requirements
• Leverage existing investigates
• Determine technology skill sets
31

©2015 RSM US LLP. All Rights Reserved. ©2015 RSM US LLP. All Rights Reserved.
IMPLEMENT AN ANALYTIC PLATFORM

©2015 RSM US LLP. All Rights Reserved.
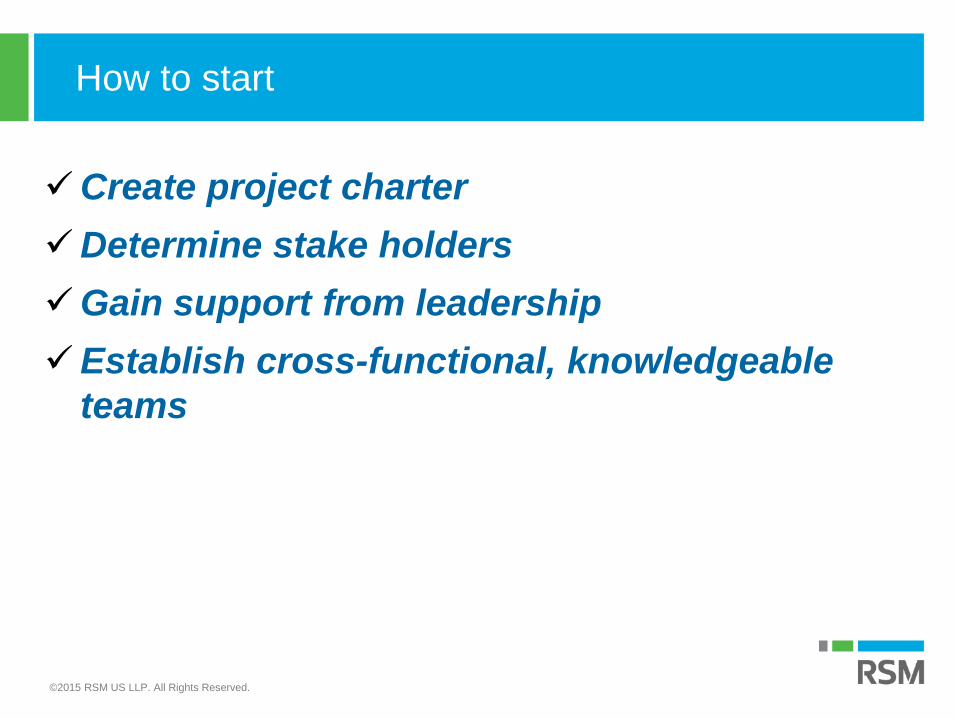
How to start
33
©2015 RSM US LLP. All Rights Reserved.
Create project charter
Determine stake holders
Gain support from leadership
Establish cross-functional, knowledgeable
teams
How to start

©2015 RSM US LLP. All Rights Reserved.
How to start
35
Ac
tivit
ies
Discovery Phase Analysis Phase Design Phase
• Interview key reporting and process
owners
• Review existing documentation
• Review reporting requirements
• Review existing reports
• Review existing key performance
measures
• Analyze data collected and determine
key elements
• Analyze origins of data
• Assess technology used within existing
processes
• Assess current mix of manual versus
systematic processes
• Evaluate gaps in current reporting
requirements
• Evaluate gaps in key performance
measures
• Analyze integration of additional
reporting processes
• Translate the requirements into a
conceptual model
• Framework development
De
live
rab
les
• Discovery summary document
o Key / common data elements of
reports
o Key reporting definitions
• Requirements summary document
o KPI/Measure template
o Security
o Technology/tools
o Refresh schedule
• Data Model
• Implementation plan
Ex
ec
uti
on
Project and Change Management
Design Analysis Discovery KPI Reporting

©2015 RSM US LLP. All Rights Reserved.
Activity – KPI/Measure matrix
36
• Complete 3-5 KPI/Measure lines on the template
• All columns in RED are mandatory

©2015 RSM US LLP. All Rights Reserved.
Activity - Example
37
Academic Gross Margin
Student Type (Rate) X Credit Hours
Gross Tuition
- Institutional Aid - Refunds + Course Fees
Net Revenue
- Instructor cost by section - Non-instructor variable direct costs - Other OpEx (fixed direct costs)
Academic Department Costs
Academic Department Gross Margin

©2015 RSM US LLP. All Rights Reserved.
Activity - Example
38
Registrar Human Resources Finance & Acctg
Course and Student
Instructional Compensation
General Ledger/ Finance
Net Revenue
Financial Aid
Institutional Student Aid
Direct Cost Indirect Cost

©2015 RSM US LLP. All Rights Reserved.
Activity - Example
• Margins by:
− Program
− Department
− Course
− Section
− Instructor
− Instructor-type
− Student
− Student-type
− Modality
• Establishes benchmark for year-to-year improvements
• Supports what-if scenario analysis
− Changes in tuition rate
− Growth / declines in student counts
− Efficiency changes (e.g. changing assumption on faculty workload)
39
©2015 RSM US LLP. All Rights Reserved.
Table Talk
40

©2015 RSM US LLP. All Rights Reserved. ©2015 RSM US LLP. All Rights Reserved.
KEYS TO SUCCESS

©2015 RSM US LLP. All Rights Reserved.
Keys to success - model your data
42
Would anyone build a house without
a blueprint?
• Numerous aspects to consider
• Structure:
• Foundation, framing,
roofing, siding, etc.
• Utilities:
• Plumbing, electrical, gas,
etc.
• Finishing:
• Walls surfaces, fixtures,
lighting, appliances, etc.
• Just give a spreadsheet to the
builder?

©2015 RSM US LLP. All Rights Reserved.
Keys to success - model your data
43

©2015 RSM US LLP. All Rights Reserved.
Keys to success - data quality
• # 1 reason for project failures
• 2 types of data quality:
1. Technical data quality
• Null values, data type mismatches, etc.
• A payroll date field contains “Mike D”
2. Business data quality
• Every GL record must contain a department code
• Every course must contain an instructor
44

©2015 RSM US LLP. All Rights Reserved.
Keys to success - data governance
45

©2015 RSM US LLP. All Rights Reserved.
Keys to success - data governance
Data governance focuses on managing data as a strategic asset
27

©2015 RSM US LLP. All Rights Reserved.
Keys to success - data governance
Effective data governance requires well defined goals and objectives, supported by the right people, processes and technologies
28

©2015 RSM US LLP. All Rights Reserved.
Keys to success
• Leadership buy-in
• Business project not IT
• Phased approach
• Actionable
• Dedicated liaison to oversee project success
48

©2015 RSM US LLP. All Rights Reserved. ©2015 RSM US LLP. All Rights Reserved.
CASE STUDIES

©2015 RSM US LLP. All Rights Reserved.
Example 1
10
Data Integration: Example 1
Eastern Iowa Community College needed access to advanced analytics that
focus on student and course information. Key performance indicators include:
• Section analysis
• Student success
• Snapshot reporting
Notes
o Integration:
o Data refreshed on a nightly basis
o Includes extensive logging and automatic notifications
o Load Processing:
o Data stored in a database and excel files
o Include “snapshots” of the data
o Business Rule Application
o Remedial indicators
o Enrolled in previous and next term indicators

©2015 RSM US LLP. All Rights Reserved.
Example 2
• https://vimeo.com/27060669
51

©2015 RSM US LLP. All Rights Reserved.
Example 2
10
Data Integration: Example 1
Higher Education organization needed a data foundation that integrated Finance/Budget,
Payroll, HR and manually maintained data. Key performance indicators include:
• Budget to actual
• Payroll to position budget
• HR analysis Notes
o Integration:
o Loads data from a data base, csv files and excel files
o Integrates with SharePoint for manually maintained data entry
o Business Rule Application:
o Data entry error reports
o Data De-Duplication:
o 3 different ID for same person. School, State, Payroll
o Preventive Data Quality:
o Business Data Quality: Identifies GL transactions that contain invalid
combination of codes (Account, Department, Fund)
o Technical Data Quality: Only load records with valid dates

©2015 RSM US LLP. All Rights Reserved. ©2015 RSM US LLP. All Rights Reserved.
BI TRENDS

©2015 RSM US LLP. All Rights Reserved.
BI trends
54
©2015 RSM US LLP. All Rights Reserved.
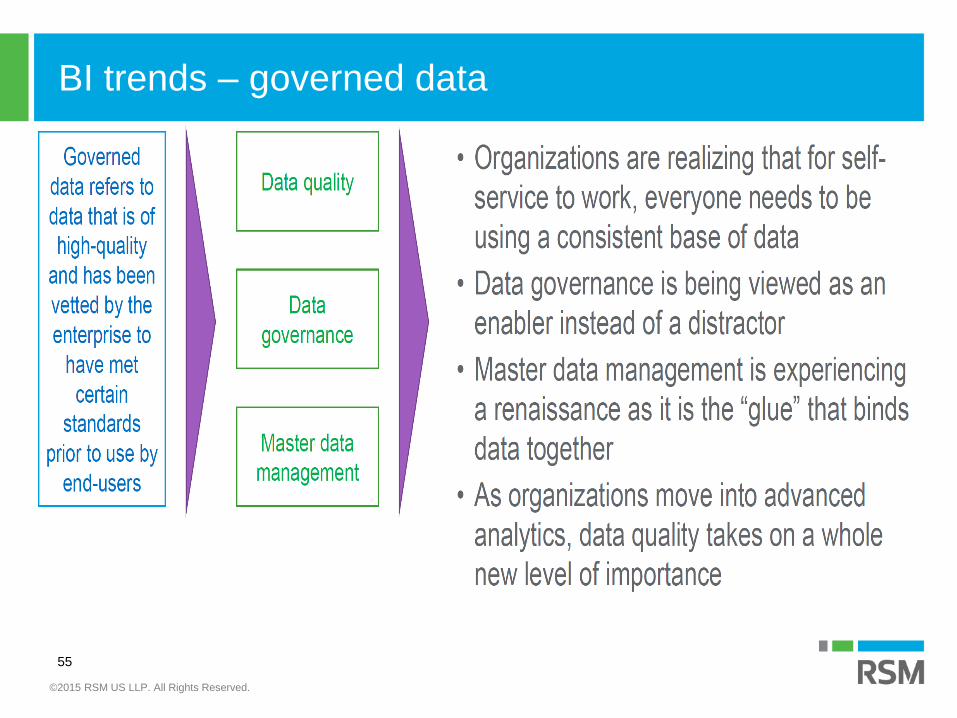
BI trends – governed data
55

©2015 RSM US LLP. All Rights Reserved.
BI trends – cloud
56

©2015 RSM US LLP. All Rights Reserved.
BI trends – advanced analytics
57
©2015 RSM US LLP. All Rights Reserved.
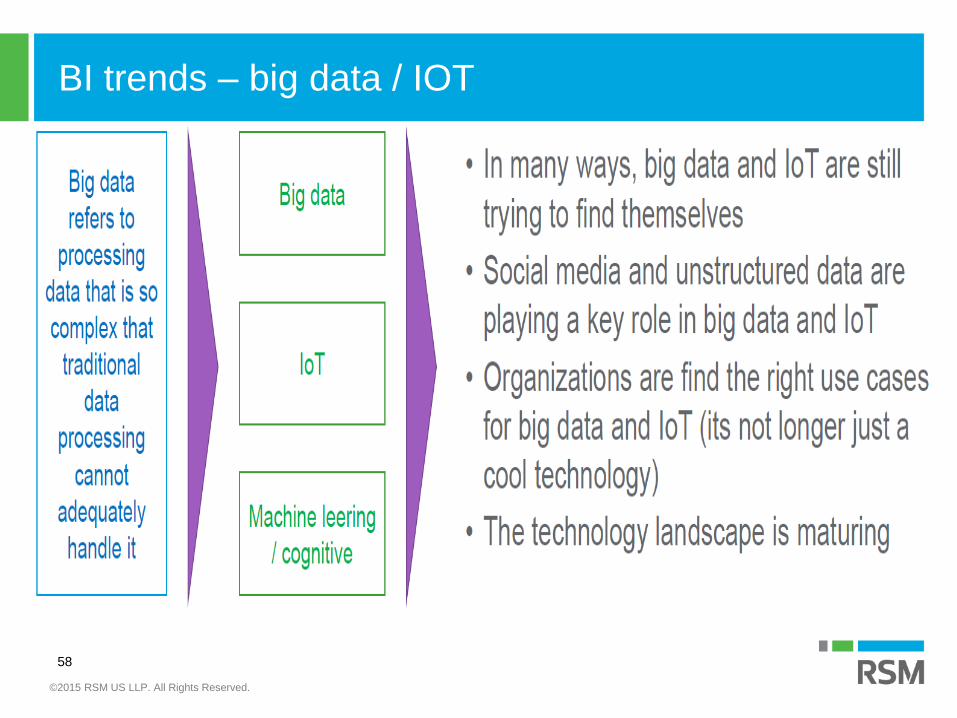
BI trends – big data / IOT
58
©2015 RSM US LLP. All Rights Reserved. ©2016 RSM US LLP. All Rights Reserved.
59

©2015 RSM US LLP. All Rights Reserved.
This document contains general information, may be based on authorities that are subject to change, and is not a substitute for professional
advice or services. This document does not constitute audit, tax, consulting, business, financial, investment, legal or other professional
advice, and you should consult a qualified professional advisor before taking any action based on the information herein. RSM US LLP, its
affiliates and related entities are not responsible for any loss resulting from or relating to reliance on this document by any person. Internal
Revenue Service rules require us to inform you that this communication may be deemed a solicitation to provide tax services. This
communication is being sent to individuals who have subscribed to receive it or who we believe would have an interest in the topics
discussed.
RSM US LLP is a limited liability partnership and the U.S. member firm of RSM International, a global network of independent audit, tax and
consulting firms. The member firms of RSM International collaborate to provide services to global clients, but are separate and distinct legal
entities that cannot obligate each other. Each member firm is responsible only for its own acts and omissions, and not those of any other
party. Visit rsmus.com/aboutus for more information regarding RSM US LLP and RSM International.
RSM® and the RSM logo are registered trademarks of RSM International Association. The power of being understood® is a registered
trademark of RSM US LLP.
© 2016 RSM US LLP. All Rights Reserved.
RSM US LLP
4801 Main St Ste 400
Kansas City MO 64112-2543
816.751.4055
+1 800 274 3978
www.rsmus.com