data analysis and interpretations -...
TRANSCRIPT
DATA ANALYSIS AND INTERPRETATIONS
93
Data collected in this study has been analysed in this chapter and the results have
been discussed regarding the innovative HRM practices, the level of implementation of these
practices, and impact of these practices on employee productivity. The challenging areas of
innovative HRM where the banks are lagging behind have also been revealed in this chapter.
4.1 INNOVATIVE HRM PRACTICES ADOPTED IN PUBLIC AS WELL AS
PRIVATE SECTOR BANKS OF INDIA
The very first objective of the study was to identify the innovative HRM practices
adopted in public and private sector banks of India. After an extensive survey of the literature
and from the responses of the interviews, a list of forty nine innovative HRM practices was
shortlisted under seven heads. These innovative HRM practices have been found in the Indian
Banking sector. All the banks under the study are employing these innovative HRM practices
related to recruitment & selection, training and development, performance management,
compensation management, career development, employee motivation and employee
security.
4.1.1 Innovative Recruitment & Selection Practices
This factor includes all the innovative HR practices which aim at attracting maximum
number of highly talented applicants and selecting the best to achieve competitiveness (Khan,
2010). The nine innovative HRM practices identified under this head were well defined
R&S, selection according to service attitude, holding on policy, availability of bank
communities on social networking sites, checking the profile of candidates on these sites,
selection of professionals just like MBAs, CAs, etc., written exam for R&S, result oriented
policy of R&S, and formal induction of new candidates. These innovative Recruitment and
selection practices have been explained below:
4.1.1.1 Well defined R&S
The respondents of the present study told that one of the major innovative
HRM practices under this head is that there is a well defined recruitment and
selection policy in the banks. This means that everyone is clear about the
recruitment and selection procedure of the banks so that transparency can be
DATA ANALYSIS AND INTERPRETATIONS
94
maintained by the HR department. Earlier, in a few types of banks, there was a
pattern of recruiting people through employee referrals only. But now a days, a
pre defined policy of hiring people is available in banks. Kundu and Malhan
(2009) have also identified this HR practice in one of their studies on service
sector.
4.1.1.2 Selection according to service attitude
Banks are giving due weightage to the service attitude and competence in the
selection procedure. This policy is being adopted by the HR department of the
banks keeping in mind the fact that employees with positive service attitude
will work more efficiently and increase the business ultimately.
4.1.1.3 Holding on policy
One of the major problems that the bank employees were facing in earlier
times was that if they left the organisation due to any work pressure or other
reason, then they were not stopped or hold on by any employer. But now, even
the regional or circle managers of the banks use a “Retention” policy for the
employees so that they may not leave the bank quickly. In this policy, they try
to hold on their employees by solving their issues at regional levels only.
4.1.1.4 Availability of bank communities on social networking sites,
Availability of bank communities on social networking sites is found to be
another innovation in the recruitment process. Popularity of the social
networking sites has forced all the sectors to have this facility enabling the
members of the community to seek the necessary information and to be in
touch with each other.
4.1.1.5 Checking the profile of candidates on these sites
These days, the banks have started using social networking sites for the
purpose of recruitments. With the help of these communities, the HR
department checks the candidate‟s profile on social networking sites to decide
the candidature for the job. All the personal and social information is available
on these sites, with the help of which, cross checking can be done easily.
DATA ANALYSIS AND INTERPRETATIONS
95
4.1.1.6 Selection of professionals.
Banks have also started selecting professionally qualified personnel, e.g.
MBAs, CAs, Agricultural officers etc. for different posts. Earlier, only private
sector banks were employing such professionals for their various departments,
but now, public sector banks have also started using this practice. For example,
advertisements can be seen in the employment newsletters for recruiting the
specialist officers, IT officers, credit managers, and finance managers etc. for
different levels in the State bank of India or even other public sector banks.
This has solved major problems of banks regarding lack of professionally
trained employees in different departments. Moreover, need for giving special
training for such employees has also been reduced to a certain level.
4.1.1.7 Written examination for R&S
There is a policy of written examination in all types of banks for selection of
each level of employees. Earlier the employees were required to appear in the
written examinations only at the entrance level. But now, the provisions have
been changed and they have to take written tests for the higher levels and
internal recruitment also. Moreover, private banks used to recruit their
employees through interviews or campus placements. But now a days, they
have also started conducting written examination for checking the exact
competence and psychology of the candidate.
4.1.1.8 Result oriented policy of R&S
Now a days, the HR department of banks has also started formulating a result
oriented recruitment and selection policy for their banks. This policy helps
them to keep only those employees who are increasing the bank‟s profit and
firing out or demoting the other ones. Even the public sector banks also don‟t
give promotions to those whose past records in terms or branch business are
very poor.
4.1.1.9 Formal induction of new candidates
There has been a formal induction orientation and familiarization process so as
to help new recruits understand the organisation. This also makes the starters
to be comfortable with the work environment of the organisation. Garvey
DATA ANALYSIS AND INTERPRETATIONS
96
(2001), Gomez-Mejia et al. (2003) and Cisco (2006) also argued that without
excellent induction, the execution of organizational strategy may vacillate.
4.1.2 Innovative Training & Development Practices
This factor incorporates all such practices that generate tangible outcome (improved
productivity, quality of products and services, and resource optimization), and intangible
results in terms of enhanced self esteem, high morale, and satisfaction of employees due to
acquisition of additional knowledge, skills, and abilities (Khan, 2010). Executive
development practices have also been considered under this variable. Researchers have
concluded that investment in training yields strategic advantage to the organizations (Kundu,
2000; Bitner & Zeithmal, 2004; Pitkanen 2007 and Blair and Sisakhti, 2007). There are two
situations in which the importance of training is realized or firms will invest in current
employees‟ human capital development through training programs: if it is difficult for firms
to attract talents (Ulrich, Zenger & Smallwood, 1999); and if firms experience low
productivity improvement (Schultz, 1960). Test of trainees, job rotation, customised
training, continuous training need assessment, regular training, encouragement to apply
training learning, and arrangement of special projects are the seven innovative Training
and Development practices found in the present study:
4.1.2.1 Test of trainees
Use of written examination for selecting employees for training is one of the
major innovations mentioned by most of the respondents of the present study.
This helps the employees to be free from any kind of biasness.
4.1.2.2 Job rotation
There is also a provision of job rotation for giving the employees proper
exposure of different departments. With job rotation, an employee is given an
opportunity to perform different jobs, which enriches his skills, experience and
ability to perform different jobs. However, the jobs offered under job rotation
are more or less of the same nature. As a result, he will be skilled to a new job
which is more or less similar to his earlier job. In HDFC Bank, all employees
are involved in the Job Rotation Schedule. In HDFC Bank, the staffs get
rotated in every 6 months and the officers get rotated in every 3 years.
DATA ANALYSIS AND INTERPRETATIONS
97
However, flexibility and due consideration is given to those employees who
have physical difficulty. For such employees, there is no job rotation for
example: Deaf and Dumb. Job rotation is positively associated with
continuous improvement on problem-solving skills that enhances employee
human capital (Marler, 1998).
4.1.2.3 Customised training
Special and separate/customised training programs have also been designed
for different levels of employees in the banks. State bank of India is practising
this practice for more than one and a half decades. Other banks are also
following this innovative HR practice. However, the frequency might be low
in their cases.
4.1.2.4 Continuous training need assessment
In some of the banks, continuous training need assessment of employees by
the HR department is also practised. With the help of continuous training need
assessment, only those employees are sent for the training, who are actually in
the need of the training. Aggarwala (2003) has also explored this innovative
practice in one of her studies.
4.1.2.5 Regular training
One of the major problems, which were earlier found in the banking sector,
was that the training intervals were very high. Even the employees were
trained only once in a decade or even in the entire job life. But now,
innovations in HRM have called for the need for regular training for the bank
employees too. The employees of a few banks are now sent on yearly basis for
training so that they can have their work related doubts resolved and can
groom themselves regularly.
4.1.2.6 Encouragement to apply training learning
Employees are also being encouraged to apply the techniques learnt in their
training program. They are given a chance to apply the information acquired
by them during the training practically so that they may not forget it ever.
DATA ANALYSIS AND INTERPRETATIONS
98
4.1.2.7 Arrangement of special projects
To make the learning effective, some banks have the practice of selecting the
staff for special project teams meant for bank‟s effectiveness. Private sector
banks like HDFC and YES bank are sending their employees for special
projects training so that they can get some specialised skills and knowledge.
4.1.3 Innovative Performance Management practices
Performance is defined as the record of outcomes produced on a specified job
function or activity during a specified time period (Bernardin and Russell 1993). This
category of HR practices includes the new practices related to goal achievement in an
efficient manner and their appraisals. Appraising is a general process of facilitating
interpersonal relationship between employees and managers through performance related
discussions to analyze matching up of employees‟ performance with organizational goals
(Wilson & Western, 2000). Job assessment related practices have also been categorised under
this head. In the present study, six innovative HRM practices related to Performance
Management were found which are: Formation of performance matrix, goal review based
appraisal, appraisal on fair objective data, 360 degree performance appraisal, option to
challenge the appraisal and full awareness of the performance appraisal policy.
4.1.3.1 Formation of performance matrix
The very common innovative HR practice of performance management has
been that the performance matrix or some other competency mapping models
being used for employee‟s performance reviews. All private sector banks
under the study are following this innovation in the performance management
practices for a long time. This has enhanced the performance as well as the
morale of their employees.
4.1.3.2 Goal review based appraisal
The respondents under the study also disclosed that goal reviews and
competency review systems, the two common methods, are being used for
appraising the performance of employees. This helps to match the
performance of the employees with the earlier set goals of the individuals and
organisations.
DATA ANALYSIS AND INTERPRETATIONS
99
4.1.3.3 Appraisal on fair objective data
In this study, it was found that the employees are being assessed for their fair
objective data. These data may relate to their deposits, advances, NPAs, or
profit per employee. These objective and fair data helps the employers to
appraise the employees without any biasness and good performers are
benefitted from this.
4.1.3.4 360 degree performance appraisal
Another innovation is that they are reviewing the performance from multiple
sources e.g. superiors, juniors, peers etc., i.e., 360 degree performance review
system, which was not prevalent earlier, is being implemented in most of the
banks. The same practice has also been discussed by Aggarwala (2003) in her
study on innovative HRM practices.
4.1.3.5 Option to challenge the appraisal
These days, the employees of a few banks have the power to challenge their
appraisal done by the HR department or by their superiors, if they disagree on
some issue. But for this, they need to represent to the higher levels with solid
proofs and logics. A few banks have a modified policy of discussing the
performance appraisals with their employees. Ukko et al. (2007) found that
performance oriented discussions between employees and managers are
directly related to organizational performance.
4.1.3.6 Full awareness of the performance appraisal policy
Moreover, there is a complete awareness of the Performance Appraisal policy
of HR department among all the staff members so that they are well aware of
what they have done and what they should not have done. Bernardin and
Russel (1993) and Landy & Far (1980) have also favoured this innovation in
their studies mentioning that wider communication of performance appraisal
policies within organizational is essential to make employees clear about their
specific role expected as contribution in organizational performance. Effective
managers need to incorporate performance review and feedback as part of
their day-to-day communications with employees (Webb, 2004).
DATA ANALYSIS AND INTERPRETATIONS
100
4.1.4 Innovative Compensation Management Practices
Compensation is all forms of financial returns and tangible services and benefits
employees receive as part of an employment relationship (Milkovich and Newman 1999).
This variable comprises of all innovations in the practices linked to payment and
remuneration of the employees. This variable plays a major role in the employee
development and retention as the financial incentives are the best motivating factors for them.
An effective set of choices about compensation systems plays a major role in determining
firm performance (Dreher and Dougherty 2005). Abbasi and Hollman (2000) in their study
have identified lack of recognition and lack of competitive compensation systems as some
reasons for employee turnover in the organization. Announcing special incentive to the
talented employees, special increments on regular basis, special festival advance, and
customised perks have been four innovations under this head found during the present study.
4.1.4.1 Announcing special incentive to the talented employees
Special incentives are given to talented employees to encourage better
performance. Using incentive compensation to stimulate better performance
and provide promotion opportunities through an internal labour market
increases satisfaction and self-actualization (Harel & Tzafrir, 2001). The same
has been confirmed by Gerhart & Milkovich (1992) in one of their studies.
4.1.4.2 Special increments on regular basis
One major innovative practice of compensation has been identified that is
there has been a provision of special increments for better performance of the
employees. This gives the employees an enough salary growth. Park et al.
(1994) and Trevor et al. (1997) found that salary growth had a pronounced
effect on turnover. Particularly, salary growth effects on turnover were
greatest for high performers, that is, high salary growth significantly reduced
turnover of high performing employees.
4.1.4.3 Special festival advance
These days, the HR department has also started one new scheme of providing
special festival advances to the bank employees on either discounted rates or
DATA ANALYSIS AND INTERPRETATIONS
101
without any interest so that they can fulfil their family requirements on the
festivals without bearing any special burden. The HR personnel of these banks
are of the view that, due to provision of this scheme, the employees are
demanding fewer leaves in the festive season. This helps them in managing
their staff effectively.
4.1.4.4 Customised perks
In last couple of years, the perks have also been customised to the individual
needs. This practice is gaining popularity in other Indian organisations too
(Aggarwala, 2003). Banks under the study are also using this innovative HR
practice as per the responses of the experts.
4.1.5 Innovative Career Development Practices
Those innovative HRM practices which include both organizational actions and
individual efforts aimed at setting career goals, formulating and implementing strategies and
monitoring the results are categorised under this head (Greenhaus 1987). These help the
employees to groom themselves and manage their careers. Verburg et al. (2007) have
identified career development itself as an ideal innovative HRM practice in one of their
researches. Availability of educational opportunities at workplace, easy approval to the job
applications, preference to seniority in promotions, promoting on the basis of merit, and
providing faster promotions are the five innovative Career Development related innovative
practices.
4.1.5.1 Availability of educational opportunities at workplace
Education related opportunities are being provided at the work place for the
career enhancement of the bank employees. This has increased their
dedication towards work in their present organisations. Moreover, they feel
that their management is concerned about their career development and
enhancement. This enhances their morale for work.
4.1.5.2 Easy approval to the job applications
This study identified that one latest innovation in the career development of
employees is that the applications sent for the career opportunities outside the
DATA ANALYSIS AND INTERPRETATIONS
102
bank are being approved by the HR department and regional managers
quickly. Earlier the top management, especially of Public sector banks, were
either verbally denying the approval of such applications or delaying the
process, to discourage the employees from applying outside the bank. But now
a days, these applications are easily approved so that employees can think of
their career development.
4.1.5.3 Preference to seniority in promotions
Seniority is given proper weightage in the promotion decisions in banking
sector. Even transfers on promotions are also affected by the seniority. E.g.
Central bank of India has a promotion provision to give favourable and closest
transfer to the employees who are senior among others in the promotion
process.
4.1.5.4 Promoting on the basis of merit
Banks are also organising written tests and interviews for the promotion
process so that merit can be one of the criteria for promotions. A well-planned
career development system along with internal advancement opportunities
based on merit, results in high motivation among employees, which has an
impact on firm performance (Milkovich and Boudreau, 1998).
4.1.5.5 Providing faster promotions
Fast track promotion process is also one common innovative practice
identified in the study. Earlier the employees had to wait for years to get
promotions. But these days, they get faster promotions, even in two to three
years. This helps them to develop their career in their own bank and they don‟t
even think of leaving the bank for getting better opportunity outside in other
banks or organisations.
4.1.6 Innovative Employee Motivation Practices
The effectiveness of skilled employees will be limited if they are not motivated to
perform their jobs (Delaney and Huselid, 1996). This factor of HR practices includes all those
innovations relating to motivation of the employees through new ways. This also includes the
DATA ANALYSIS AND INTERPRETATIONS
103
innovative HRM practices related to retention, team building, etc. In the present
investigation, eleven innovative motivation practices have been identified. Accordingly, the
employees can be motivated in the new ways by using music at work place, providing day
care centres, work autonomy, making available ESOPs, providing loans at discounted
rates, giving an option of flexible working hours, approving leave applications easily,
organising stress management programs, encouraging team building attitude, giving best
employee awards, arranging family get-togethers.
4.1.6.1 Using music at work place
Use of music at workplace, to improve the performance, is one major
innovation found in the study. State bank of India has introduced the concept
of playing light music in its branches so that a calm and soothing environment
can be provided to the employees as well as the customers. Other banks too
have started following this practice.
4.1.6.2 Providing day care centres
There is an arrangement of day care centres in the surveyed banks for the
children of employees, so that they have no difficulty in maintaining work life
balance. In these day care centres, they can drop their children while they are
at work. This won‟t even divert their minds towards their family while
working. Young mothers remain satisfied when their little ones are not far
away from them. This definitely raises the efficiency of the women
employees.
4.1.6.3 Work autonomy
In the last few years, greater work autonomy is also being provided to the
bank employees. This helps them to work according to their best possible
capability without any interference and they try to give their best. This is a
kind of brain storming exercise through which the employers can get best out
of the minds of their employees.
4.1.6.4 Making available ESOPs
Availability of Employee Stock Option Plans is a practice which has been
innovated in the banking sector for a last few years so that the employees feel
DATA ANALYSIS AND INTERPRETATIONS
104
that they are also the owners of the banks. This feeling makes the employees
more loyal to their organisation.
4.1.6.5 Providing loans at discounted rates
Availability of loans and advances at discounted rates to all the employees is
also another common innovative HRM practice leading to motivation of the
employees. They can get loans on simple interest for getting vehicles,
constructing house or even educating their wards. This helps the employees
financially and motivates them to increase their efficiency.
4.1.6.6 Giving an option of flexible working hours
Some of the banks are also providing flexible working hours to enhance the
productivity of employees. Banking hours are generally common everywhere,
but a few banks have started giving an option of flexible working hours in two
different shifts so that the employees can work according to their comfort.
This practice was also identified by Kundu & Malhan (2009) in one of their
studies. Bame (1993) found that employee turnover was lower when
employees had shorter work hours and were given a choice of work schedules,
even though their workload was higher. He concluded that firms that provide
flexible work schedules to their employees had the advantage of reducing
employee turnover.
4.1.6.7 Approving leave applications easily
These days, there is an easy availability of leave on demand in case of urgency
which was the common HR issue among the bank employees. However, this
practice prevails in a few banks only. Keeping in mind the benefits of this
innovative practice, other banks have also started this practice for motivating
and retaining their employees in their organisations.
4.1.6.8 Organising stress management programs
Arrangement of stress management programmes, art of living classes, yoga
sessions etc. are distinct innovations which have not been there in the banking
system earlier. These practices are the best boosters and relaxers for the bank
employees who are mostly under work pressure.
DATA ANALYSIS AND INTERPRETATIONS
105
4.1.6.9 Encouraging team building attitude
By encouraging team building attitude in the employees, the HR department of
banks has started a new practice of motivating them. They work in teams and
learn new skills. This increases their confidence and hence they feel more
motivated.
4.1.6.10 Giving best employee awards
Announcement of best employee awards was a common practice in the private
sector banks, but these days, the public sector banks have also started the same
practice to motivate their employees. A few banks have recently introduced
the practice of writing the best employee‟s name on the display board in the
regional centres or even in the branches of their banks. Better-motivated
employees lead to higher individual achievement and improved organizational
performance (Huselid, 1995; Pfeffer, 1994; Delaney et al., 1989).
4.1.6.11 Arranging family get-togethers
Family get-togethers have become so common in the banking sector that the
employees working there feel closer to each other. These informal family get-
togethers help them to be relaxed for some time. Even, a few of the
respondents were of the view point that with the help of these family get-
togethers, they can live their social lives easily among their own colleagues.
4.1.7 Innovative Employee Security Practices
The practices which make the employee feel highly secured in his present job are the
best suited for this category. These practices when implemented through new ways may help
an employee to feel most satisfied in his job. A total of seven Innovative Employee Security
practices found in the present study were provision of sabbatical leaves (part time leave from
bank with 50% or less salary in case of crisis), sufficient retirement benefits, option of
voluntary retirement, insurance of dependents, security to the employee that he would be
last to leave the organisation if some uneven happens, proper grievances procedures, full
support from the regional or central office.
DATA ANALYSIS AND INTERPRETATIONS
106
4.1.7.1 Provision of sabbatical leaves
One innovative practice adopted by the HR department of the banks is that
there is a provision of “sabbatical leaves” (part time leave from bank with
50% or less salary in case of crisis) for employees. This helps in reducing the
employee turnover rate in the banks. Infosys started giving sabbatical leaves
to its employees in India so that they may get job security. This was followed
by HDFC bank and then the others also started using this HRM practice.
4.1.7.2 Sufficient retirement benefits
Providing proper retirement benefits is one other innovative practice revealed
by the HR employees under the study. Unlike earlier days, now the employees
get enough gratuities, pension and other retirement benefits which can secure
their rest of the life after leaving the job.
4.1.7.3 Option of voluntary retirement
Another innovation explored under this study was that for last few years, VRS
has also become common in banking sector. Now, the employees of the banks
can also enjoy the benefits of this scheme if they need earlier retirements from
their work. This doesn‟t interrupt their other retirement benefits.
4.1.7.4 Insurance of dependents
Banks also give the facility of dependent‟s insurance which gives a sense of
security in the minds of employees for their family too. This motivates them
by satisfying their social as well as security needs.
4.1.7.5 Job security
Earlier the bank employees were even asked to leave the bank in case of any
default being made by the employees. But now, their genuine grounds are
taken in to notice and they are ensured for the job security, even in the private
sector too. This gives surety to an employee that he would be the last one to be
asked to leave the organisation if any financial problem arises. It has been
argued that the provision of job security encourages employees to work
harder. Ichniowski and his associates also noted, "Workers will only expend

DATA ANALYSIS AND INTERPRETATIONS
107
extra effort. . . if they expect. . . a lower probability of future layoffs" (1994:
10).
4.1.7.6 Proper grievances procedures
There is a provision of written as well as operational grievances procedures.
The existence of the formal mechanism of dispute resolution reduces
employees' fear of being unfairly treated and increases their perception of
equitable treatment resulting in a more dedicated workforce and better
performance (Arthur, 1992).
4.1.7.7 Full support from the regional or central office
The HR department as well as the controlling office is supporting the
employees on the genuine grounds. This full support from the top level
enhances the feeling of security and motivation among the employees and they
work harder. Firth et al. (2004) found that emotional support from supervisors
and self-esteem mediated the impact of stressors on stress reactions, job
satisfaction, commitment to the organization and intention to quit.
.
DATA ANALYSIS AND INTERPRETATIONS
108
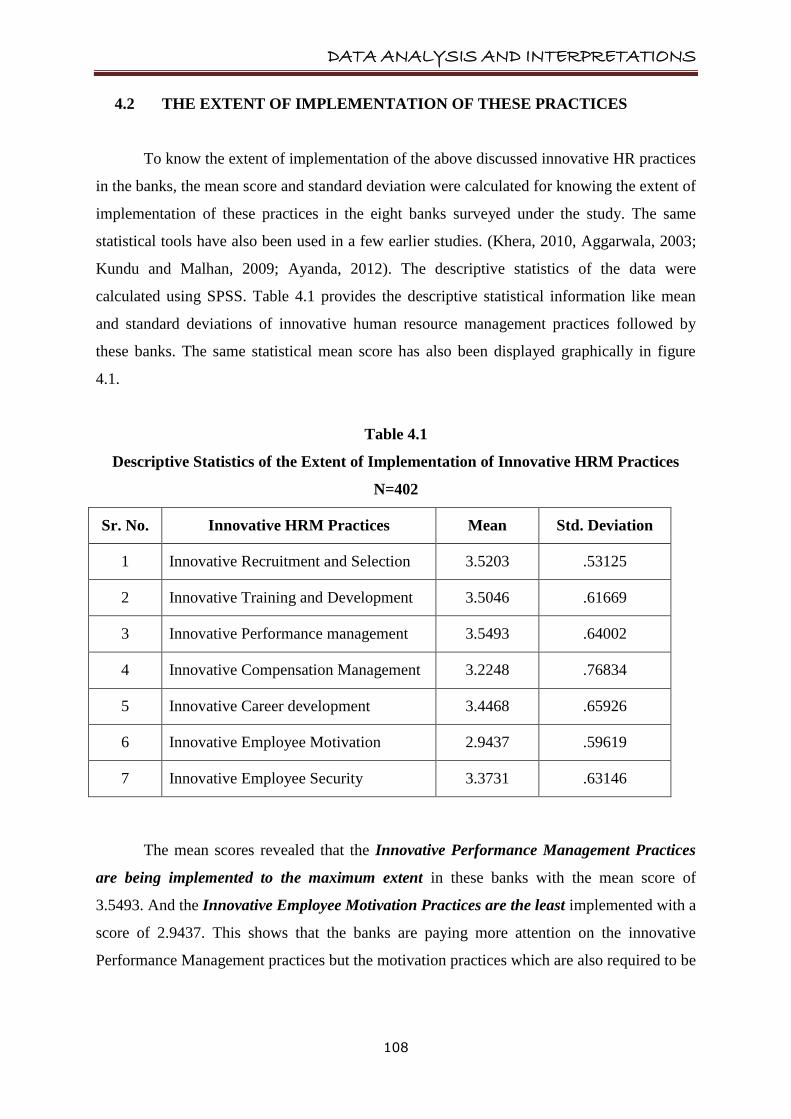
4.2 THE EXTENT OF IMPLEMENTATION OF THESE PRACTICES
To know the extent of implementation of the above discussed innovative HR practices
in the banks, the mean score and standard deviation were calculated for knowing the extent of
implementation of these practices in the eight banks surveyed under the study. The same
statistical tools have also been used in a few earlier studies. (Khera, 2010, Aggarwala, 2003;
Kundu and Malhan, 2009; Ayanda, 2012). The descriptive statistics of the data were
calculated using SPSS. Table 4.1 provides the descriptive statistical information like mean
and standard deviations of innovative human resource management practices followed by
these banks. The same statistical mean score has also been displayed graphically in figure
4.1.
Table 4.1
Descriptive Statistics of the Extent of Implementation of Innovative HRM Practices
N=402
Sr. No. Innovative HRM Practices Mean Std. Deviation
1 Innovative Recruitment and Selection 3.5203 .53125
2 Innovative Training and Development 3.5046 .61669
3 Innovative Performance management 3.5493 .64002
4 Innovative Compensation Management 3.2248 .76834
5 Innovative Career development 3.4468 .65926
6 Innovative Employee Motivation 2.9437 .59619
7 Innovative Employee Security 3.3731 .63146
The mean scores revealed that the Innovative Performance Management Practices
are being implemented to the maximum extent in these banks with the mean score of
3.5493. And the Innovative Employee Motivation Practices are the least implemented with a
score of 2.9437. This shows that the banks are paying more attention on the innovative
Performance Management practices but the motivation practices which are also required to be
DATA ANALYSIS AND INTERPRETATIONS
109
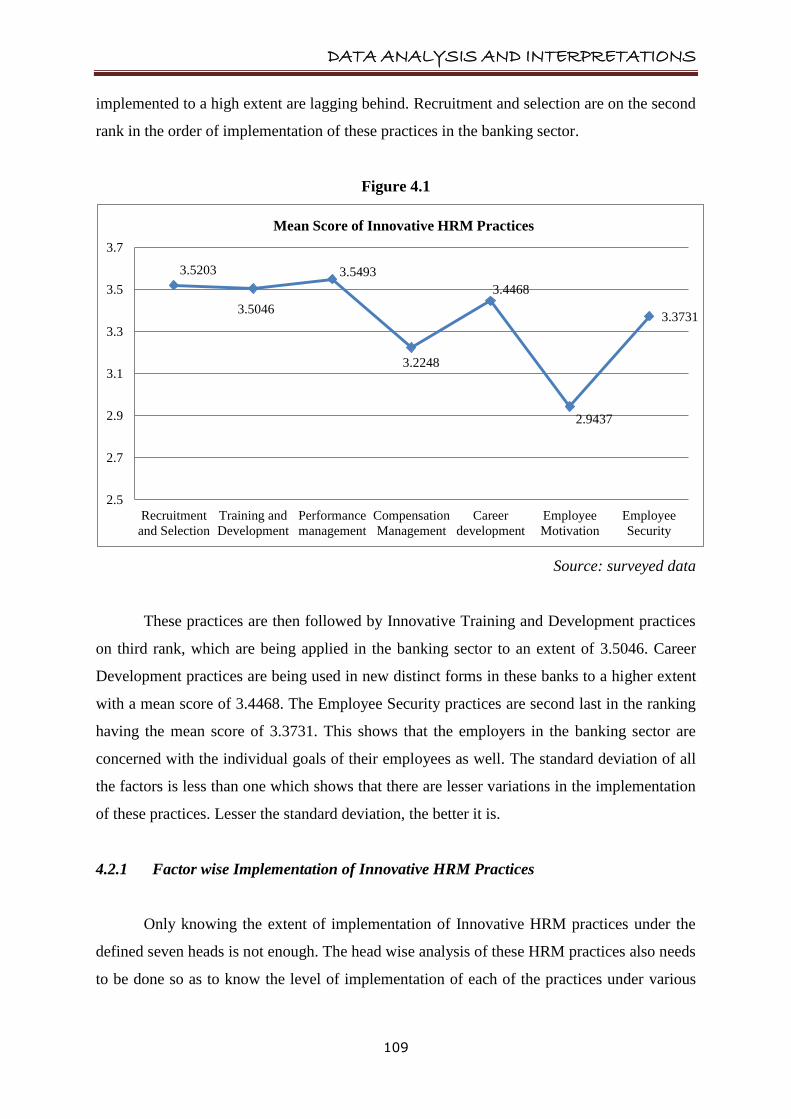
implemented to a high extent are lagging behind. Recruitment and selection are on the second
rank in the order of implementation of these practices in the banking sector.
Figure 4.1
Source: surveyed data
These practices are then followed by Innovative Training and Development practices
on third rank, which are being applied in the banking sector to an extent of 3.5046. Career
Development practices are being used in new distinct forms in these banks to a higher extent
with a mean score of 3.4468. The Employee Security practices are second last in the ranking
having the mean score of 3.3731. This shows that the employers in the banking sector are
concerned with the individual goals of their employees as well. The standard deviation of all
the factors is less than one which shows that there are lesser variations in the implementation
of these practices. Lesser the standard deviation, the better it is.
4.2.1 Factor wise Implementation of Innovative HRM Practices
Only knowing the extent of implementation of Innovative HRM practices under the
defined seven heads is not enough. The head wise analysis of these HRM practices also needs
to be done so as to know the level of implementation of each of the practices under various
3.5203
3.5046
3.5493
3.2248
3.4468
2.9437
3.3731
2.5
2.7
2.9
3.1
3.3
3.5
3.7
Recruitment
and Selection
Training and
Development
Performance
management
Compensation
Management
Career
development
Employee
Motivation
Employee
Security
Mean Score of Innovative HRM Practices
DATA ANALYSIS AND INTERPRETATIONS
110
heads. For this purpose, descriptive statistics of all forty nine innovative practices have been
conceded.
4.2.1.1 Innovative Recruitment and Selection Practices
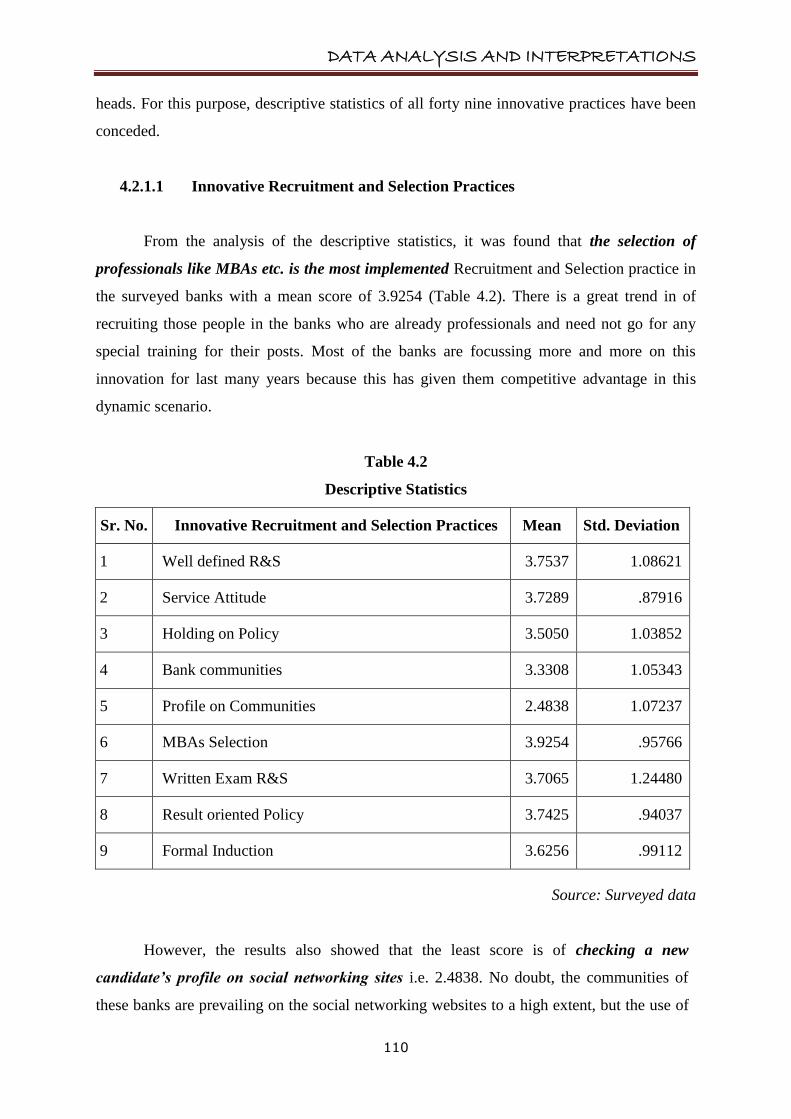
From the analysis of the descriptive statistics, it was found that the selection of
professionals like MBAs etc. is the most implemented Recruitment and Selection practice in
the surveyed banks with a mean score of 3.9254 (Table 4.2). There is a great trend in of
recruiting those people in the banks who are already professionals and need not go for any
special training for their posts. Most of the banks are focussing more and more on this
innovation for last many years because this has given them competitive advantage in this
dynamic scenario.
Table 4.2
Descriptive Statistics
Sr. No. Innovative Recruitment and Selection Practices Mean Std. Deviation
1 Well defined R&S 3.7537 1.08621
2 Service Attitude 3.7289 .87916
3 Holding on Policy 3.5050 1.03852
4 Bank communities 3.3308 1.05343
5 Profile on Communities 2.4838 1.07237
6 MBAs Selection 3.9254 .95766
7 Written Exam R&S 3.7065 1.24480
8 Result oriented Policy 3.7425 .94037
9 Formal Induction 3.6256 .99112
Source: Surveyed data
However, the results also showed that the least score is of checking a new
candidate’s profile on social networking sites i.e. 2.4838. No doubt, the communities of
these banks are prevailing on the social networking websites to a high extent, but the use of
DATA ANALYSIS AND INTERPRETATIONS
111
checking the candidate‟s profile on these sites is still occasional. Moreover, there is a great
variance in the results as the standard deviation of many of these practices is more than or
near to one. All other innovative practices under this head like formal induction, well
defined policy, written exam, etc. are being implemented to high extent as shown in the
figure 4.2.
Figure 4.2
Source: Surveyed data
4.2.1.2 Innovative Training and Development Practices
Innovations in training and development have been considered to be very important
in the reviewed literature (Aggarwala, 2003; Kundu, 2000; Bitner & Zeithmal, 2004;
Pitkanen 2007 and Blair and Sisakhti, 2007). But, it is also important to know which of
these innovations under this head is being implemented to highest extent and which to the
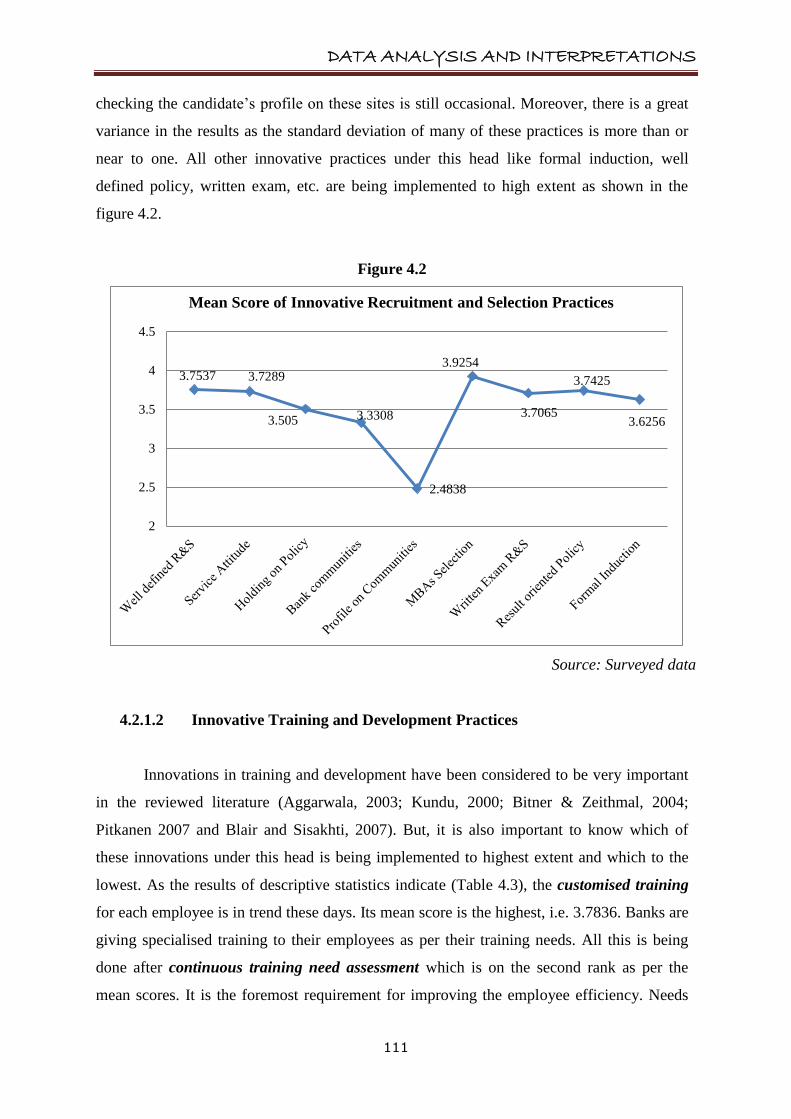
lowest. As the results of descriptive statistics indicate (Table 4.3), the customised training
for each employee is in trend these days. Its mean score is the highest, i.e. 3.7836. Banks are
giving specialised training to their employees as per their training needs. All this is being
done after continuous training need assessment which is on the second rank as per the
mean scores. It is the foremost requirement for improving the employee efficiency. Needs
3.7537 3.7289
3.505 3.3308
2.4838
3.9254
3.7065
3.7425
3.6256
2
2.5
3
3.5
4
4.5
Mean Score of Innovative Recruitment and Selection Practices
DATA ANALYSIS AND INTERPRETATIONS
112
based training has also been said to be important in the earlier researches (Kundu, 2000;
Bitner & Zeithmal, 2001; Aggarwala, 2003; Kundu & Malhan, 2009).
Table 4.3
Descriptive Statistics
N=402
Sr. No. Innovative Training and Development Practices Mean Std. Deviation
1 Trainee test 3.3694 1.36887
2 Job rotation 3.5336 1.09953
3 Customised Training 3.7836 .85796
4 Continuous Training 3.3943 1.00219
5 Regular training 3.4975 .96121
6 Encouragement Apply 3.7152 .87375
7 Special projects 3.2388 1.02473
Source: Surveyed data
Figure 4.3
Source: Surveyed data
3.3694
3.5336
3.7836
3.3943
3.4975
3.7152
3.2388
2.9
3
3.1
3.2
3.3
3.4
3.5
3.6
3.7
3.8
3.9
Mean Score of Innovative Training and Development Practices
DATA ANALYSIS AND INTERPRETATIONS
113
Tendency of sending the employees for special projects of training is still low with a
mean score of 3.2388 as compared to other innovations under this variable. This may be
because of the reason that the main focus of Indian banks is still on giving training through
the old methods as those are acceptable at all levels of these organisations. The mean score
for the innovative practice of conducting written tests of the trainees before sending them for
the training is also very low. Probably this may be due to the fact that only a few banks have
started this practice.
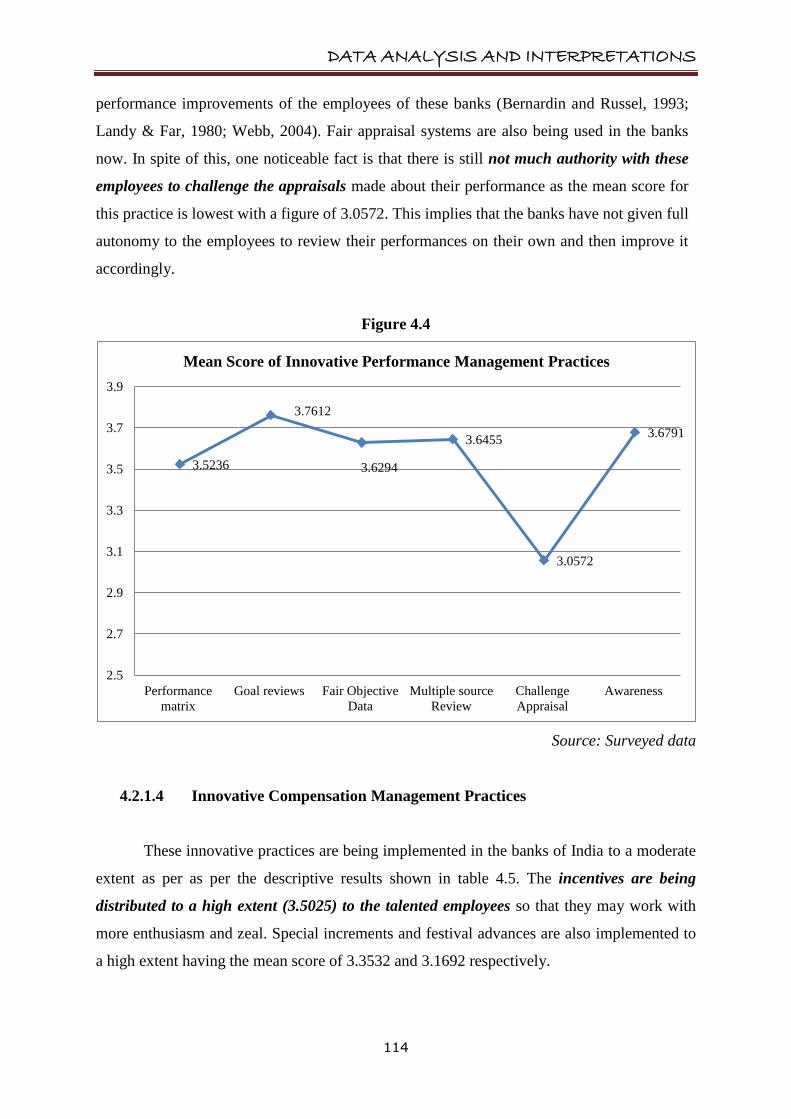
4.2.1.3 Innovative Performance Management Practices
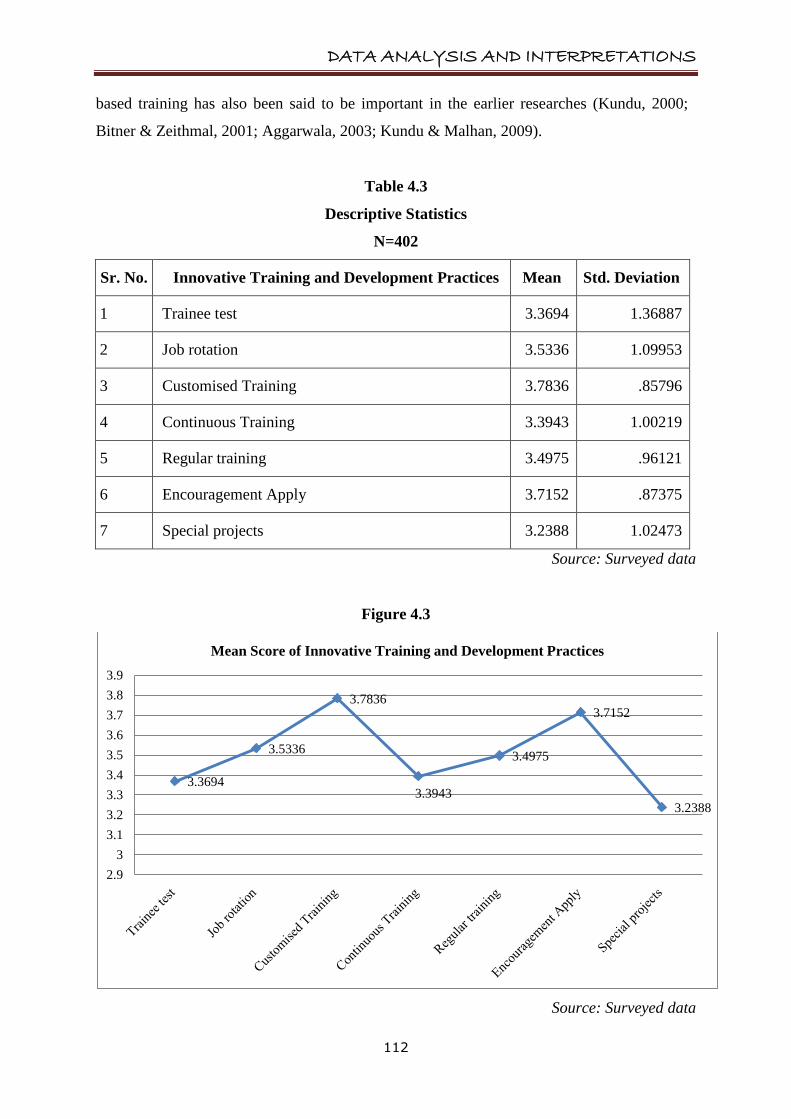
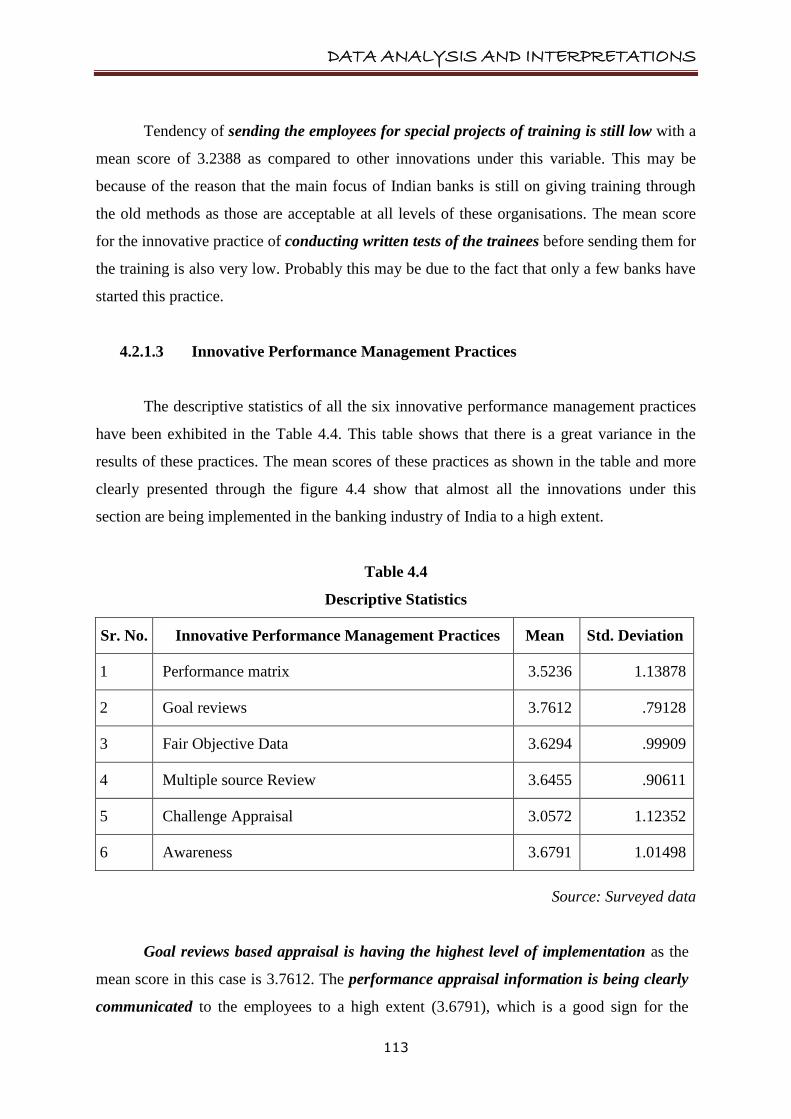
The descriptive statistics of all the six innovative performance management practices
have been exhibited in the Table 4.4. This table shows that there is a great variance in the
results of these practices. The mean scores of these practices as shown in the table and more
clearly presented through the figure 4.4 show that almost all the innovations under this
section are being implemented in the banking industry of India to a high extent.
Table 4.4
Descriptive Statistics
Sr. No. Innovative Performance Management Practices Mean Std. Deviation
1 Performance matrix 3.5236 1.13878
2 Goal reviews 3.7612 .79128
3 Fair Objective Data 3.6294 .99909
4 Multiple source Review 3.6455 .90611
5 Challenge Appraisal 3.0572 1.12352
6 Awareness 3.6791 1.01498
Source: Surveyed data
Goal reviews based appraisal is having the highest level of implementation as the
mean score in this case is 3.7612. The performance appraisal information is being clearly
communicated to the employees to a high extent (3.6791), which is a good sign for the
DATA ANALYSIS AND INTERPRETATIONS
114
performance improvements of the employees of these banks (Bernardin and Russel, 1993;
Landy & Far, 1980; Webb, 2004). Fair appraisal systems are also being used in the banks
now. In spite of this, one noticeable fact is that there is still not much authority with these
employees to challenge the appraisals made about their performance as the mean score for
this practice is lowest with a figure of 3.0572. This implies that the banks have not given full
autonomy to the employees to review their performances on their own and then improve it
accordingly.
Figure 4.4
Source: Surveyed data
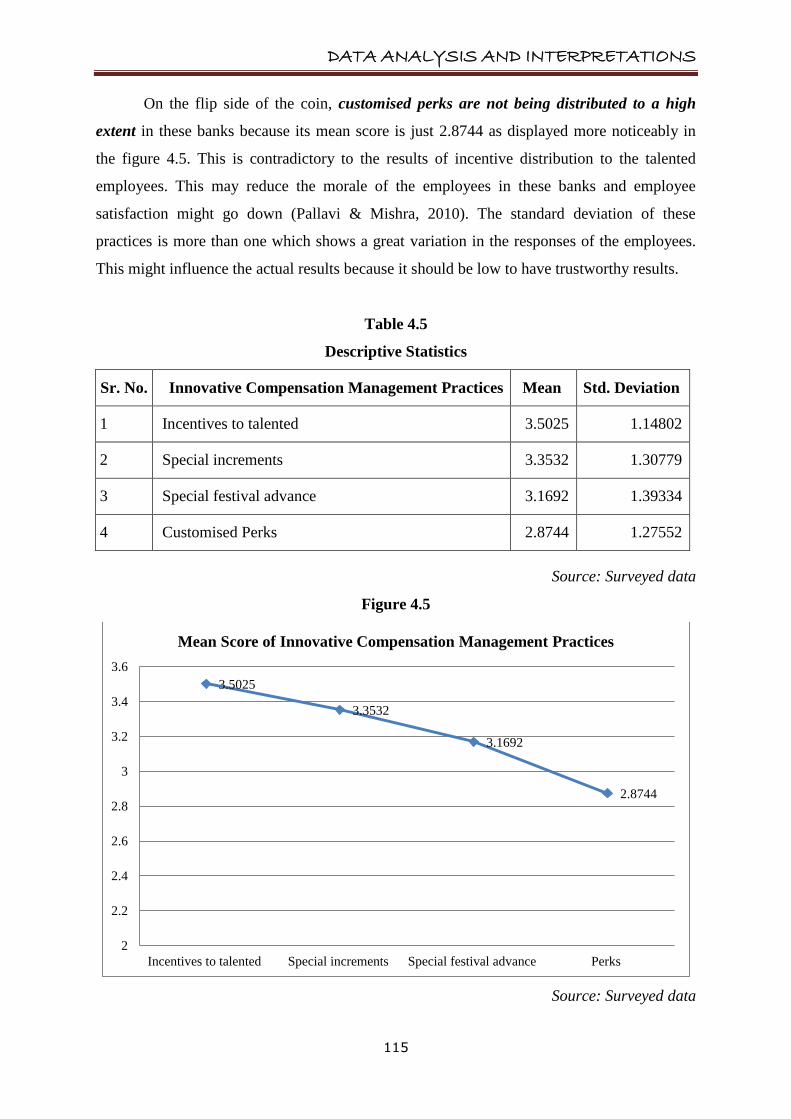
4.2.1.4 Innovative Compensation Management Practices
These innovative practices are being implemented in the banks of India to a moderate
extent as per as per the descriptive results shown in table 4.5. The incentives are being
distributed to a high extent (3.5025) to the talented employees so that they may work with
more enthusiasm and zeal. Special increments and festival advances are also implemented to
a high extent having the mean score of 3.3532 and 3.1692 respectively.
3.5236
3.7612
3.6294
3.6455
3.0572
3.6791
2.5
2.7
2.9
3.1
3.3
3.5
3.7
3.9
Performance
matrix
Goal reviews Fair Objective
Data
Multiple source
Review
Challenge
Appraisal
Awareness
Mean Score of Innovative Performance Management Practices
DATA ANALYSIS AND INTERPRETATIONS
115
On the flip side of the coin, customised perks are not being distributed to a high
extent in these banks because its mean score is just 2.8744 as displayed more noticeably in
the figure 4.5. This is contradictory to the results of incentive distribution to the talented
employees. This may reduce the morale of the employees in these banks and employee
satisfaction might go down (Pallavi & Mishra, 2010). The standard deviation of these
practices is more than one which shows a great variation in the responses of the employees.
This might influence the actual results because it should be low to have trustworthy results.
Table 4.5
Descriptive Statistics
Sr. No. Innovative Compensation Management Practices Mean Std. Deviation
1 Incentives to talented 3.5025 1.14802
2 Special increments 3.3532 1.30779
3 Special festival advance 3.1692 1.39334
4 Customised Perks 2.8744 1.27552
Source: Surveyed data
Figure 4.5
Source: Surveyed data
3.5025
3.3532
3.1692
2.8744
2
2.2
2.4
2.6
2.8
3
3.2
3.4
3.6
Incentives to talented Special increments Special festival advance Perks
Mean Score of Innovative Compensation Management Practices
DATA ANALYSIS AND INTERPRETATIONS
116
4.2.1.5 Innovative Career Development Practices
For the enhancement of the career of the employees, these banks have started using
innovations in a last few years. All the innovative career development practices are being
used in the banks under the study to a high extent (Table 4.6). Seniority and Merit based
promotions are the most implemented practices as their mean score are 3.5672 and 3.5410
respectively. These banks are also giving faster promotions which were not available in the
banking sector earlier.
Table 4.6
Descriptive Statistics
Sr. No. Innovative Career Development Practices Mean Std. Deviation
1 Educational opportunities 3.4005 1.06347
2 Easy approval 3.1878 1.06353
3 Seniority promotion 3.5672 .93849
4 Faster promotions 3.4913 1.01266
5 Merit promotion 3.5410 1.10154
Source: Surveyed data
Moreover, a lot of internal educational opportunities are also being provided in these
banks. In spite of this, 3.1878 is the mean score of another practice which shows that the level
of implementation of easy approvals of the applications of the employees for outside exams
is not very high. This might be because of the fear of losing employees if they get selected
anywhere else. A more comprehensive picture of these results has been demonstrated through
figure 4.6.

DATA ANALYSIS AND INTERPRETATIONS
117
Figure 4.6
Source: Surveyed data
4.2.1.6 Innovative Employee Motivation Practices
The descriptive data results of these practices as shown in table 4.7 exhibit that some
of these practices namely discounted rates on the loans (3.8383), easy leave sanctions
(3.6331), development of team building attitude (3.5908), best employee awards (3.3794)
and greater work autonomy (3.1555) are being implemented to a great extent. Day care
centres are the foremost need of the women employees but the extent of implementing this
innovative practice in these banks is very low with a mean score of 1.8507. Even they need
flexible working hours so that they can make a work life balance. But the banks are still not
doing much effort to implement these improved motivational practices.
Figure 4.7 is portraying a clear picture of these results. Furthermore, there is a great
pressure on any kind of employee when he/she works for a long time. To release this pressure
and make the employees more comfortable, stress management programs, family get-
togethers and use of music at the work place are the best ways. But, the analysis of results
showed that the extent of application of these practices in the banks is in the range of
occasionally to moderate.
3.4005
3.1878
3.5672
3.4913
3.541
2.9
3
3.1
3.2
3.3
3.4
3.5
3.6
Educational
opportunities
Easy approval Seniority promotion Faster promotions Merit promotion
Mean Score of Innovative Career Development Practices

DATA ANALYSIS AND INTERPRETATIONS
118
Table 4.7
Descriptive Statistics
Sr. No. Innovative Employee Motivation Practices Mean Std. Deviation
1 Music use 2.1903 1.13732
2 Day Care Centres 1.8507 1.11557
3 Work Autonomy 3.1555 .95083
4 ESOPs 2.9378 1.15392
5 Discounted Rates 3.8383 1.15667
6 Flexible working 2.7400 1.35209
7 Easy leave 3.6331 1.04468
8 Stress mgt 2.6866 1.15884
9 Team building 3.5908 1.00428
10 Best employee 3.3794 1.31403
11 Family GTs 2.3781 1.11611
Source: Surveyed data
Figure 4.7
Source: Surveyed data
2.1903
1.8507
3.1555
2.9378
3.8383
2.74
3.6331
2.6866
3.5908
3.3794
2.3781
1.5
2
2.5
3
3.5
4
Mean Scores of Innovative Employee Motivation Practices
DATA ANALYSIS AND INTERPRETATIONS
119
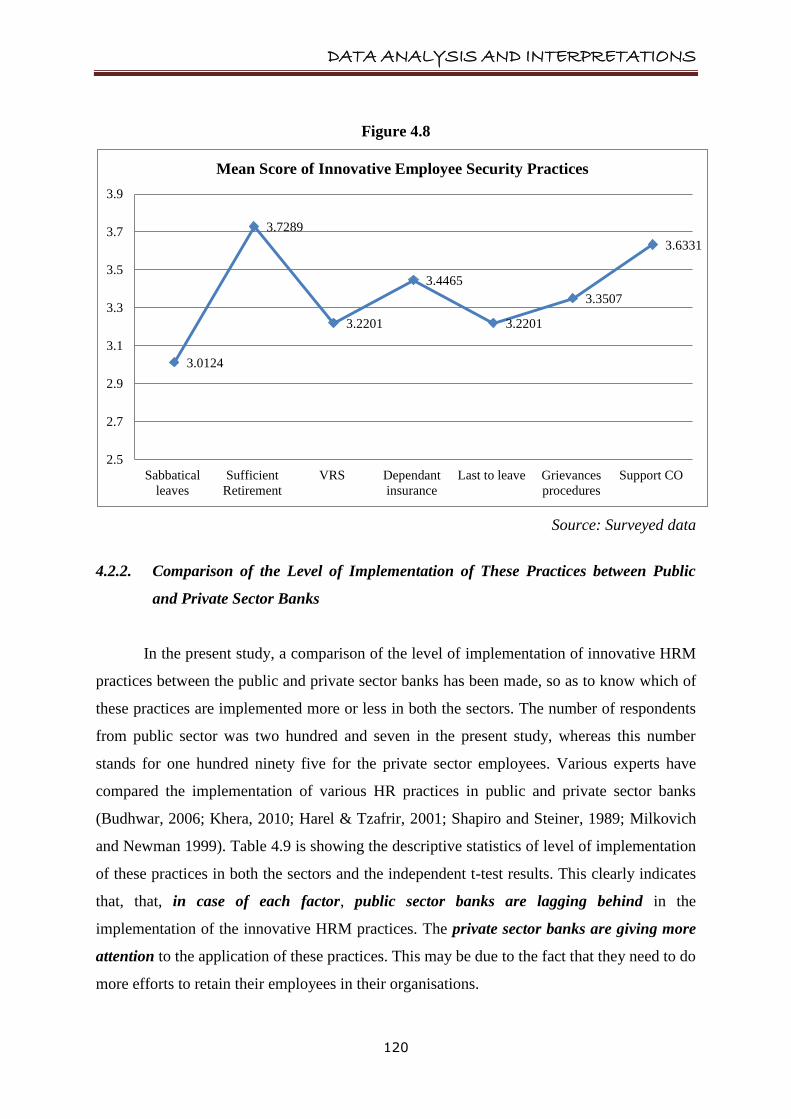
4.2.1.7 Innovative Employee Security Practices
The descriptive results of seven innovative employee security practices have been
displayed in the table 4.8. The results indicate this clearly that all these new practices related
to the employee security are being applied in the banking sector to a high extent.
Table 4.8
Descriptive Statistics
Sr. No. Innovative Employee Security Practices Mean Std. Deviation
1 Sabbatical leaves 3.0124 1.19375
2 Sufficient Retirement benefits 3.7289 1.05633
3 VRS 3.2201 1.14069
4 Dependant‟s insurance 3.4465 1.28399
5 Last to leave 3.2201 1.28367
6 Grievances procedures 3.3507 1.04696
7 Support from Central office 3.6331 1.15033
Source: Surveyed data
The level of implementation is found to be highest in case of practice of sufficient
retirement benefits, followed by support from central office, dependent‟s insurance and
grievance procedures respectively. Employees are being supported by the central offices
(3.6331) when they are stuck up in problem. One more observable fact is that the practice of
giving sabbatical leaves to the employees in these banks has been adopted up to a high
extent. Its mean score is the lowest among the all innovative practices of this factor i.e.
3.0124. However, VRS and last to leave practices are implemented more than the above said
practices. It was also found during the survey that many of the employees were unaware
about this practice. Further, a high degree of variance is shown through the results of the
standard deviation of these practices. This again shows that the responses for these practices
vary more when checked statistically.
DATA ANALYSIS AND INTERPRETATIONS
120
Figure 4.8
Source: Surveyed data
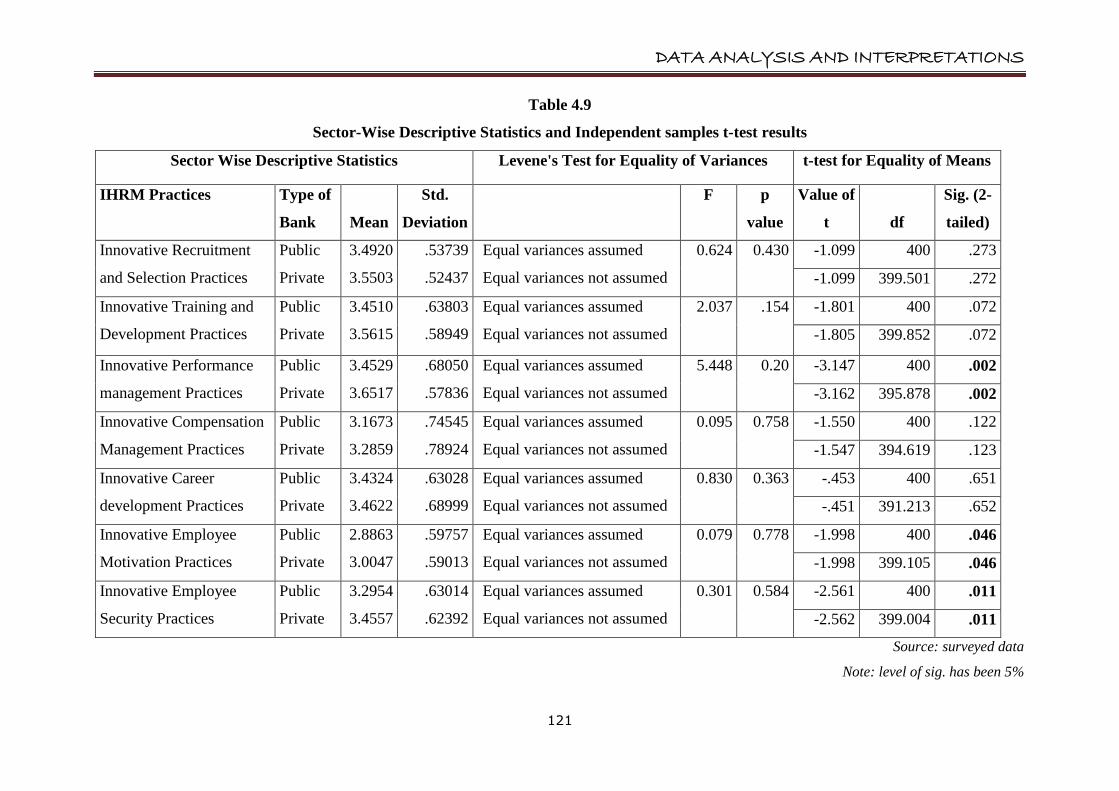
4.2.2. Comparison of the Level of Implementation of These Practices between Public
and Private Sector Banks
In the present study, a comparison of the level of implementation of innovative HRM
practices between the public and private sector banks has been made, so as to know which of
these practices are implemented more or less in both the sectors. The number of respondents
from public sector was two hundred and seven in the present study, whereas this number
stands for one hundred ninety five for the private sector employees. Various experts have
compared the implementation of various HR practices in public and private sector banks
(Budhwar, 2006; Khera, 2010; Harel & Tzafrir, 2001; Shapiro and Steiner, 1989; Milkovich
and Newman 1999). Table 4.9 is showing the descriptive statistics of level of implementation
of these practices in both the sectors and the independent t-test results. This clearly indicates
that, that, in case of each factor, public sector banks are lagging behind in the
implementation of the innovative HRM practices. The private sector banks are giving more
attention to the application of these practices. This may be due to the fact that they need to do
more efforts to retain their employees in their organisations.
3.0124
3.7289
3.2201
3.4465
3.2201
3.3507
3.6331
2.5
2.7
2.9
3.1
3.3
3.5
3.7
3.9
Sabbatical
leaves
Sufficient
Retirement
VRS Dependant
insurance
Last to leave Grievances
procedures
Support CO
Mean Score of Innovative Employee Security Practices
DATA ANALYSIS AND INTERPRETATIONS
121
Table 4.9
Sector-Wise Descriptive Statistics and Independent samples t-test results
Sector Wise Descriptive Statistics Levene's Test for Equality of Variances t-test for Equality of Means
IHRM Practices Type of
Bank Mean
Std.
Deviation
F p
value
Value of
t df
Sig. (2-
tailed)
Innovative Recruitment
and Selection Practices
Public
Private
3.4920
3.5503
.53739
.52437
Equal variances assumed
Equal variances not assumed
0.624 0.430 -1.099 400 .273
-1.099 399.501 .272
Innovative Training and
Development Practices
Public
Private
3.4510
3.5615
.63803
.58949
Equal variances assumed
Equal variances not assumed
2.037 .154 -1.801 400 .072
-1.805 399.852 .072
Innovative Performance
management Practices
Public
Private
3.4529
3.6517
.68050
.57836
Equal variances assumed
Equal variances not assumed
5.448 0.20 -3.147 400 .002
-3.162 395.878 .002
Innovative Compensation
Management Practices
Public
Private
3.1673
3.2859
.74545
.78924
Equal variances assumed
Equal variances not assumed
0.095 0.758 -1.550 400 .122
-1.547 394.619 .123
Innovative Career
development Practices
Public
Private
3.4324
3.4622
.63028
.68999
Equal variances assumed
Equal variances not assumed
0.830 0.363 -.453 400 .651
-.451 391.213 .652
Innovative Employee
Motivation Practices
Public
Private
2.8863
3.0047
.59757
.59013
Equal variances assumed
Equal variances not assumed
0.079 0.778 -1.998 400 .046
-1.998 399.105 .046
Innovative Employee
Security Practices
Public
Private
3.2954
3.4557
.63014
.62392
Equal variances assumed
Equal variances not assumed
0.301 0.584 -2.561 400 .011
-2.562 399.004 .011
Source: surveyed data
Note: level of sig. has been 5%
DATA ANALYSIS AND INTERPRETATIONS
122
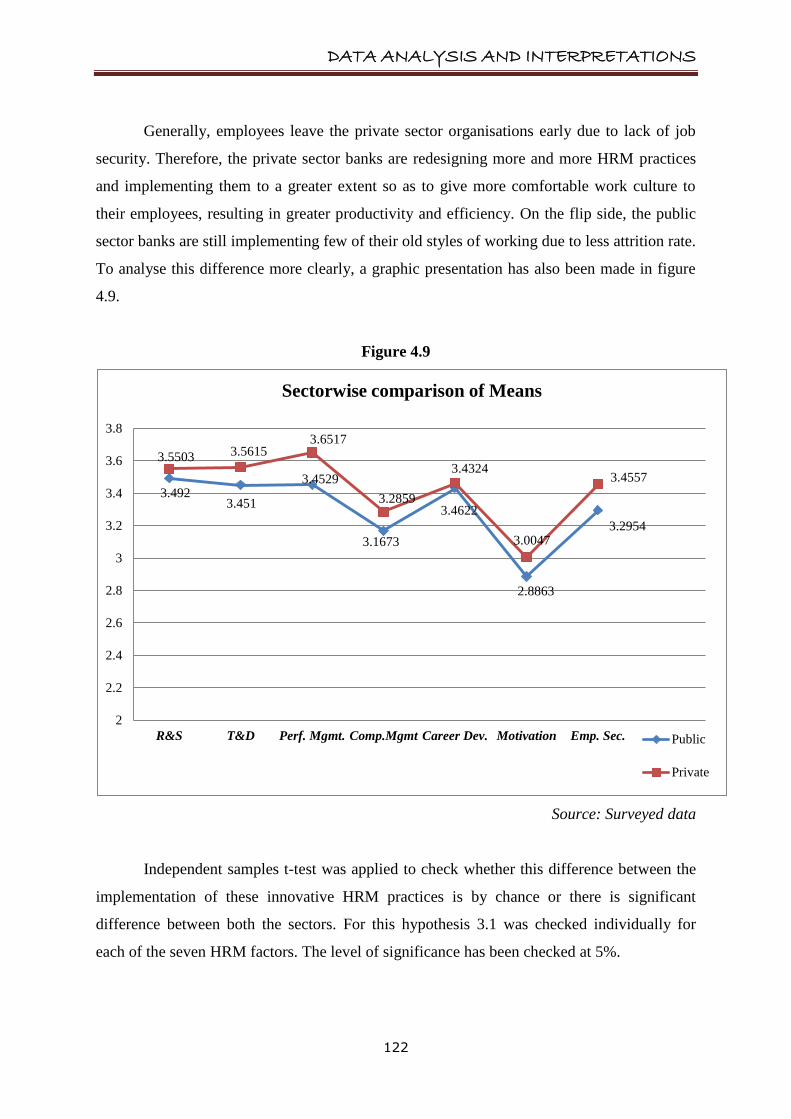
Generally, employees leave the private sector organisations early due to lack of job
security. Therefore, the private sector banks are redesigning more and more HRM practices
and implementing them to a greater extent so as to give more comfortable work culture to
their employees, resulting in greater productivity and efficiency. On the flip side, the public
sector banks are still implementing few of their old styles of working due to less attrition rate.
To analyse this difference more clearly, a graphic presentation has also been made in figure
4.9.
Figure 4.9
Source: Surveyed data
Independent samples t-test was applied to check whether this difference between the
implementation of these innovative HRM practices is by chance or there is significant
difference between both the sectors. For this hypothesis 3.1 was checked individually for
each of the seven HRM factors. The level of significance has been checked at 5%.
3.492 3.451
3.4529
3.1673
3.4324
2.8863
3.2954
3.5503 3.5615 3.6517
3.2859 3.4622
3.0047
3.4557
2
2.2
2.4
2.6
2.8
3
3.2
3.4
3.6
3.8
R&S T&D Perf. Mgmt. Comp.Mgmt Career Dev. Motivation Emp. Sec.
Sectorwise comparison of Means
Public
Private
DATA ANALYSIS AND INTERPRETATIONS
123
4.2.2.1 Comparison of the Level of Implementation of Innovative Recruitment and
Selection Practices between Public and Private Sector Banks
The results of t-test reveal that the p-value of this factor is more than 0.05.
Therefore, this difference exists by chance only. In other words, there is no
significant difference between the implementation of these practices among
Indian public and private sector banks, when tested statistically. However, the
minor difference in absolute figures as shown in table 4.9 might be due to some
non significant reasons just like common written test for recruitment and
selection of employees in public sector banks. Some other reason might be the
biasness among the responses of the employees.
4.2.2.2 Comparison of the Level of Implementation of Innovative Training and
Development Practices between Public and Private Sector Banks
The results of t-test clearly signify that the null hypothesis is again to be accepted
as the p-value of this innovative HRM practice is also more than 0.05. This
clearly dictates that there lies no significant difference between the
implementation of innovative Training and Development practices in the public
and private sector banks of India. The same results were concluded in some
earlier studies too (Boyne et al. 1999; Budhwar 2000; Harel and Tzafrir 2001;
Budhwar and Boyne 2004).
4.2.2.3 Comparison of the Level of Implementation of Innovative Performance
Management Practices between Public and Private Sector Banks
T-test results (Table 4.9) show that the significance value of innovative
performance management practices is less than 0.05. Therefore, the alternate
hypothesis will be accepted here, i.e. there is a significant difference between
the public and private sector banks in the implementation of the innovative
Performance Management practices. Budhwar and Boyne (2004) also proved
the same results in their study. This implies that the private sector banks are
following more innovations in the performance management practices in
comparison to the public sector banks.
DATA ANALYSIS AND INTERPRETATIONS
124
4.2.2.4 Comparison of the Level of Implementation of Innovative Compensation
Management Practices between Public and Private Sector Banks
As shown in the table 4.9, the p-value, of test of significance regarding the
difference of implementation of innovative compensation management practices
in public and private sector banks, is also more than 0.05. Thus, the null
hypothesis is accepted and there lies a difference by chance only if tested
statistically. Here, also the private sector banks have been implementing the
innovative compensation management practices more than public sector banks.
But this difference is not a statistically significant difference.
4.2.2.5 Comparison of the Level of Implementation of Innovative Career
Development Practices between Public and Private Sector Banks
The significant value of t-test, applied for testing the hypothesis, that there is no
significant difference in the implementation of innovative career development
practices in public and private sector banks, is also more than 0.05. This means
that the null hypothesis is again accepted here. Thus, there may be a minor
difference between the implementation of innovative career development
practices in public and private sector banks. But this difference is simply by
chance only as the statistical results of t-test reveal that both the banks are
applying these practices to an approximate same level.
4.2.2.6 Comparison of the Level of Implementation of Innovative Employee
Motivation Practices between Public and Private Sector Banks
The t-test results disclose that alternate hypothesis will be accepted for this factor
as the p-value is less than 0.05. Therefore, the difference between the
implementation of innovative employee motivation practices among both the
banks is significant statistically. This difference shows that the private sector
banks are motivating their employees with more innovative ideas so that they can
retain them in the long term. However, the public sector banks are lagging behind
significantly in this practice implementation also.

DATA ANALYSIS AND INTERPRETATIONS
125
4.2.2.7 Comparison of the Level of Implementation of Innovative Employee Security
Practices between Public and Private Sector Banks
The results of t-test reveal that there is a significant difference in the
implementation of innovative employee security practices also in the both types
of banks. This is because here also the p-value is less than 0.05. One of the major
reasons of this difference may be the fact that private sector banks are quicker in
responding to the changing and competitive environment. This has made them
adopt more innovations for providing employee security.
4.2.3 Inter-bank Comparison of the Level of Implementation of These Practices
A further comparison of the level of implementation has been made between all the
surveyed eight banks for each of the seven innovative HRM practices, so that a clear picture
can be displayed and analysed. Out of 402 respondents of this present study, 53 were of State
Bank of India, 52 of Punjab National Bank, 52 of Central Bank of India, 50 of Oriental Bank
of Commerce, 49 of ICICI Bank, 50 of HDFC bank, 48 of Axis bank and 48 of Yes Bank.
4.2.3.1 Inter-Bank Comparison of the Level of Implementation of Innovative
Recruitment and Selection Practices
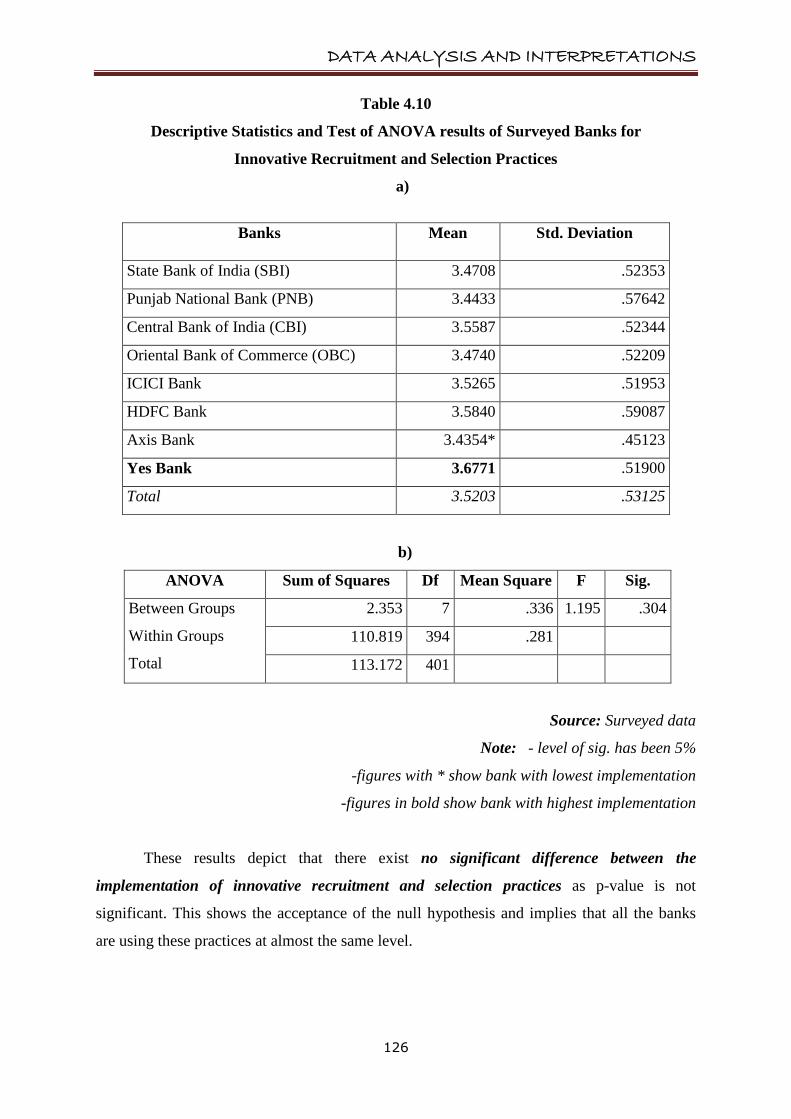
Table 4.10 explains the descriptive statistical and ANOVA test results of the surveyed
banks for innovative recruitment and selection practices. This table shows that although all
the eight banks are implementing the innovative recruitment and selection practices to more
than moderate extent but less than high extent, yet, the YES bank is implementing these
practices at the highest level with a mean score of 3.6771 when compared among all the eight
banks. However, the lowest scoring bank is the Axis bank whose mean score is 3.4354. There
is a difference among all the eight banks in the implementation of these innovations but to
check whether these results are significant or not, ANOVA test has been applied.
DATA ANALYSIS AND INTERPRETATIONS
126
Table 4.10
Descriptive Statistics and Test of ANOVA results of Surveyed Banks for
Innovative Recruitment and Selection Practices
a)
b)
ANOVA Sum of Squares Df Mean Square F Sig.
Between Groups
Within Groups
Total
2.353 7 .336 1.195 .304
110.819 394 .281
113.172 401
Source: Surveyed data
Note: - level of sig. has been 5%
-figures with * show bank with lowest implementation
-figures in bold show bank with highest implementation
These results depict that there exist no significant difference between the
implementation of innovative recruitment and selection practices as p-value is not
significant. This shows the acceptance of the null hypothesis and implies that all the banks
are using these practices at almost the same level.
Banks Mean Std. Deviation
State Bank of India (SBI) 3.4708 .52353
Punjab National Bank (PNB) 3.4433 .57642
Central Bank of India (CBI) 3.5587 .52344
Oriental Bank of Commerce (OBC) 3.4740 .52209
ICICI Bank 3.5265 .51953
HDFC Bank 3.5840 .59087
Axis Bank 3.4354* .45123
Yes Bank 3.6771 .51900
Total 3.5203 .53125
DATA ANALYSIS AND INTERPRETATIONS
127
4.2.3.2 Inter-Bank Comparison of the Level of Implementation of Innovative
Training and Development Practices
Table 4.11
Descriptive Statistics and Test of ANOVA results of Surveyed Banks for
Innovative Training and Development Practices
a)
b)
ANOVA Sum of Squares Df Mean Square F Sig.
Between Groups
Within Groups
Total
4.733 7 .676 1.803 .085
147.769 394 .375
152.502 401
Source: Surveyed data
Note: - level of sig. has been 5%
-figures with * show bank with lowest implementation
-figures in bold show bank with highest implementation
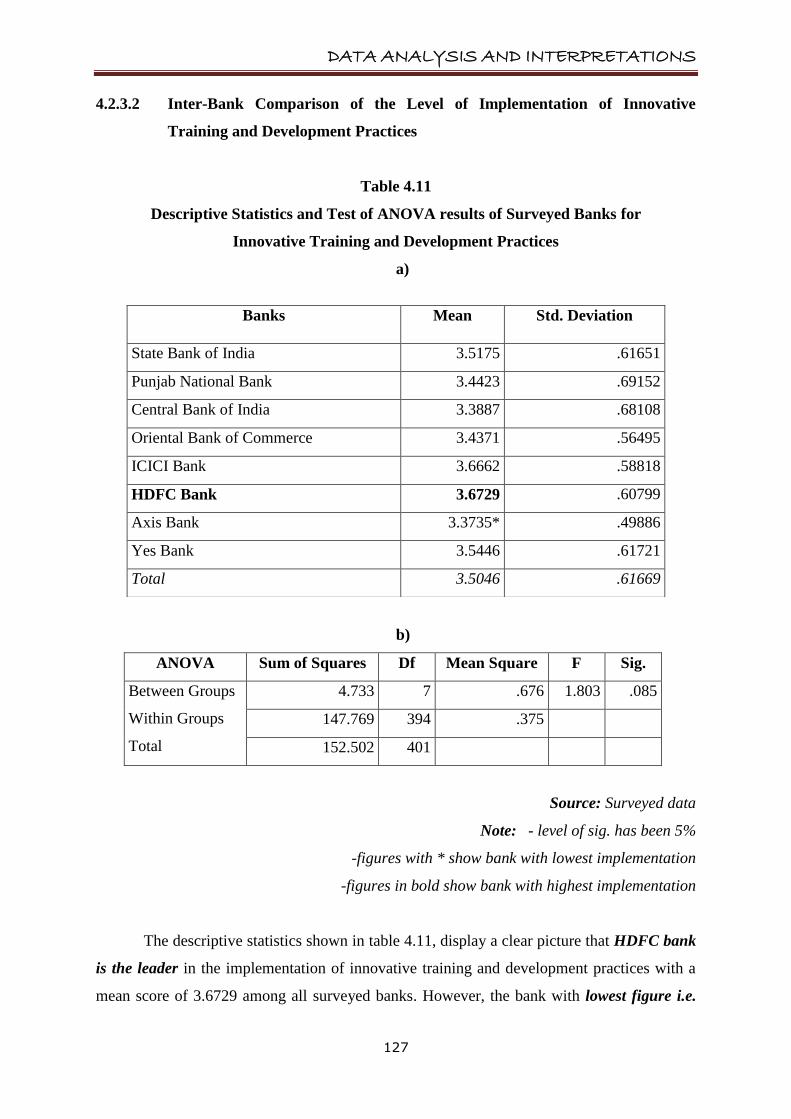
The descriptive statistics shown in table 4.11, display a clear picture that HDFC bank
is the leader in the implementation of innovative training and development practices with a
mean score of 3.6729 among all surveyed banks. However, the bank with lowest figure i.e.
Banks Mean Std. Deviation
State Bank of India 3.5175 .61651
Punjab National Bank 3.4423 .69152
Central Bank of India 3.3887 .68108
Oriental Bank of Commerce 3.4371 .56495
ICICI Bank 3.6662 .58818
HDFC Bank 3.6729 .60799
Axis Bank 3.3735* .49886
Yes Bank 3.5446 .61721
Total 3.5046 .61669
DATA ANALYSIS AND INTERPRETATIONS
128
3.3735 is Axis bank. Table reveals the differences in the mean scores of implementation of
this practice among all the eight banks. However, claiming that these differences are due to
some facts will be statistically wrong. Therefore, another hypothesis has been checked in this
study by applying ANOVA. The results of ANOVA table depict that the null hypothesis will
be accepted again as p-value is not significant. It means that the innovative training and
development practices are being implemented at same level among all the surveyed banks. If
some difference lies, then that may be due to chance only.
4.2.3.3 Inter-Bank Comparison of the Level of Implementation of Innovative
Performance Management Practices
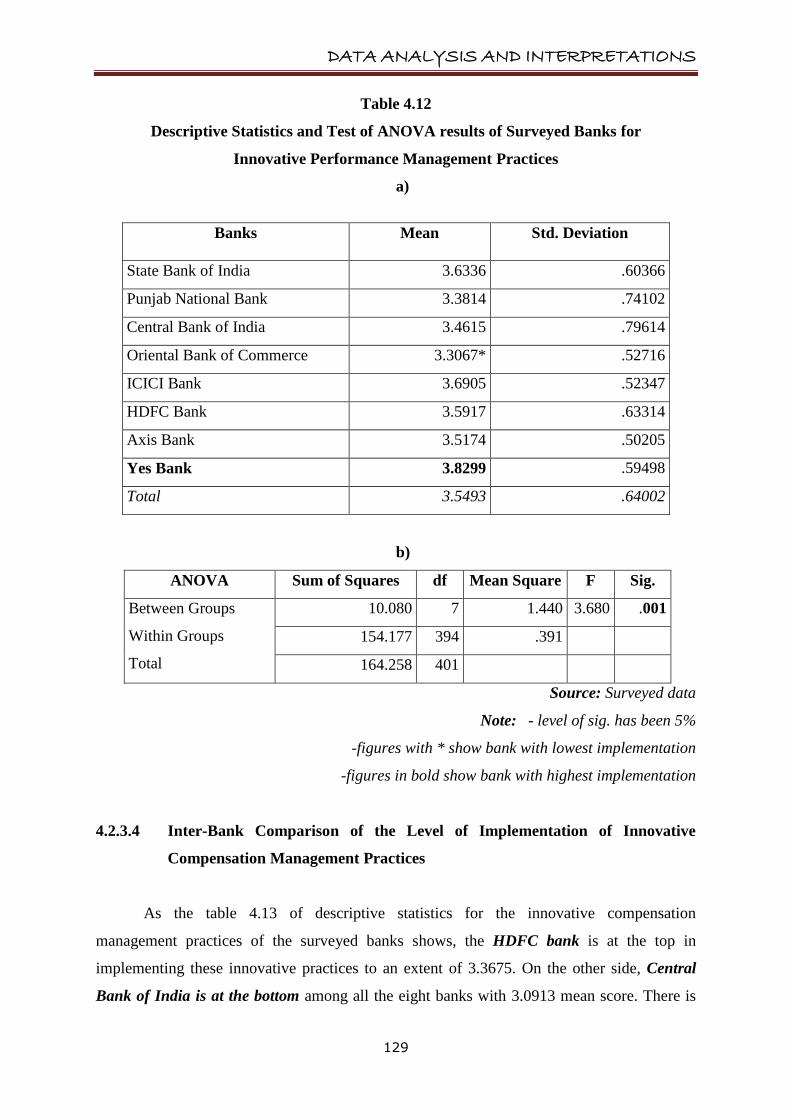
Table 4.12 (a) shows the mean scores and standard deviations of all the surveyed
banks for implementing these innovations. As per the results of this table, YES bank is
implementing these innovative practices to an extent of 3.8299 which is the highest score
among all eight banks. Oriental Bank of Commerce is the lowest in the race with a mean
score of 3.3067. There is variation in the level of implementation of these practices among all
the surveyed banks.
Despite the above results, it can‟t be said that there lies a significant difference among
all the surveyed banks in implementing innovative performance management practices until
and unless it is statistically proved by applying ANOVA. The results of ANOVA in the table
4.12 (b) show that the p-value is less than 0.05. This proposes the acceptance of alternate
hypothesis, i.e. there is a significant difference in the level of implementation of innovative
performance management practices in all the eight banks. Therefore, the differences shown
in the descriptive statistics table are statistically proven. This may be because of the reason
that the all banks are not paying similar attention to the innovations in the appraisal criteria of
their employees. Traditional methods are still being used in some banks; which has been
confirmed in the earlier results of public private sector comparison of these practices.
DATA ANALYSIS AND INTERPRETATIONS
129
Table 4.12
Descriptive Statistics and Test of ANOVA results of Surveyed Banks for
Innovative Performance Management Practices
a)
b)
ANOVA Sum of Squares df Mean Square F Sig.
Between Groups
Within Groups
Total
10.080 7 1.440 3.680 .001
154.177 394 .391
164.258 401
Source: Surveyed data
Note: - level of sig. has been 5%
-figures with * show bank with lowest implementation
-figures in bold show bank with highest implementation
4.2.3.4 Inter-Bank Comparison of the Level of Implementation of Innovative
Compensation Management Practices
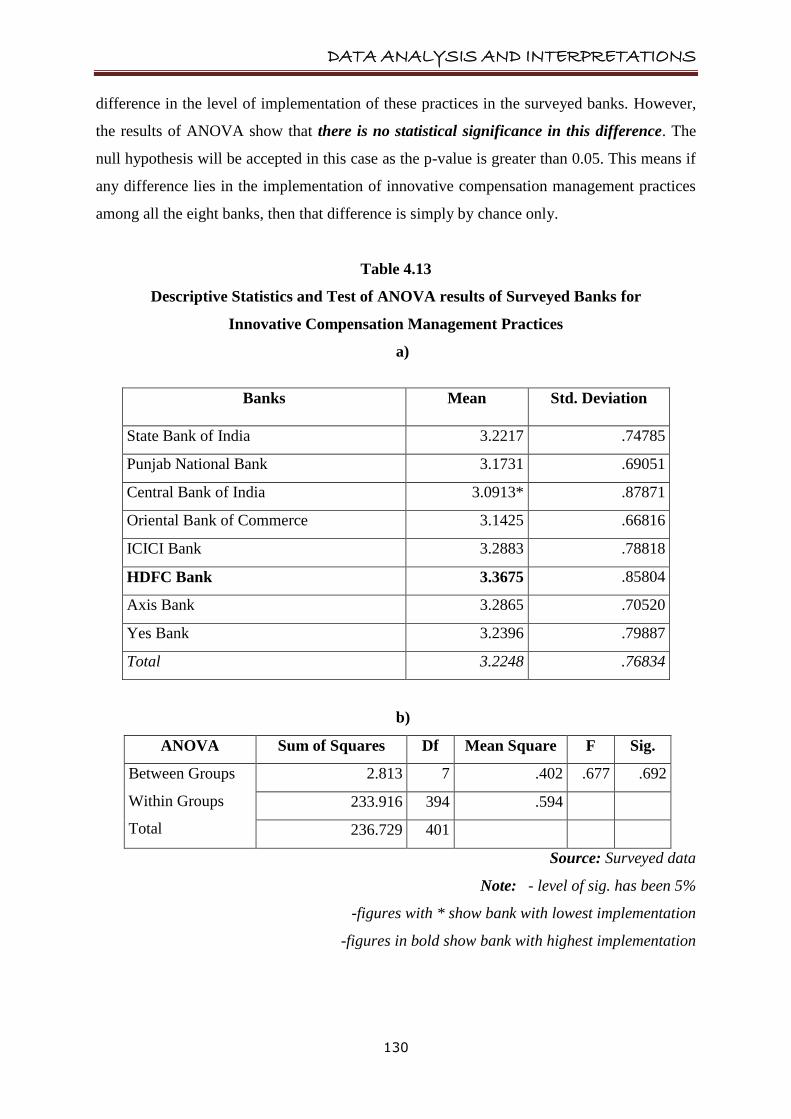
As the table 4.13 of descriptive statistics for the innovative compensation
management practices of the surveyed banks shows, the HDFC bank is at the top in
implementing these innovative practices to an extent of 3.3675. On the other side, Central
Bank of India is at the bottom among all the eight banks with 3.0913 mean score. There is
Banks Mean Std. Deviation
State Bank of India 3.6336 .60366
Punjab National Bank 3.3814 .74102
Central Bank of India 3.4615 .79614
Oriental Bank of Commerce 3.3067* .52716
ICICI Bank 3.6905 .52347
HDFC Bank 3.5917 .63314
Axis Bank 3.5174 .50205
Yes Bank 3.8299 .59498
Total 3.5493 .64002
DATA ANALYSIS AND INTERPRETATIONS
130
difference in the level of implementation of these practices in the surveyed banks. However,
the results of ANOVA show that there is no statistical significance in this difference. The
null hypothesis will be accepted in this case as the p-value is greater than 0.05. This means if
any difference lies in the implementation of innovative compensation management practices
among all the eight banks, then that difference is simply by chance only.
Table 4.13
Descriptive Statistics and Test of ANOVA results of Surveyed Banks for
Innovative Compensation Management Practices
a)
b)
ANOVA Sum of Squares Df Mean Square F Sig.
Between Groups
Within Groups
Total
2.813 7 .402 .677 .692
233.916 394 .594
236.729 401
Source: Surveyed data
Note: - level of sig. has been 5%
-figures with * show bank with lowest implementation
-figures in bold show bank with highest implementation
Banks Mean Std. Deviation
State Bank of India 3.2217 .74785
Punjab National Bank 3.1731 .69051
Central Bank of India 3.0913* .87871
Oriental Bank of Commerce 3.1425 .66816
ICICI Bank 3.2883 .78818
HDFC Bank 3.3675 .85804
Axis Bank 3.2865 .70520
Yes Bank 3.2396 .79887
Total 3.2248 .76834
DATA ANALYSIS AND INTERPRETATIONS
131
4.2.3.5 Inter-Bank Comparison of the Level of Implementation of Innovative Career
Development Practices
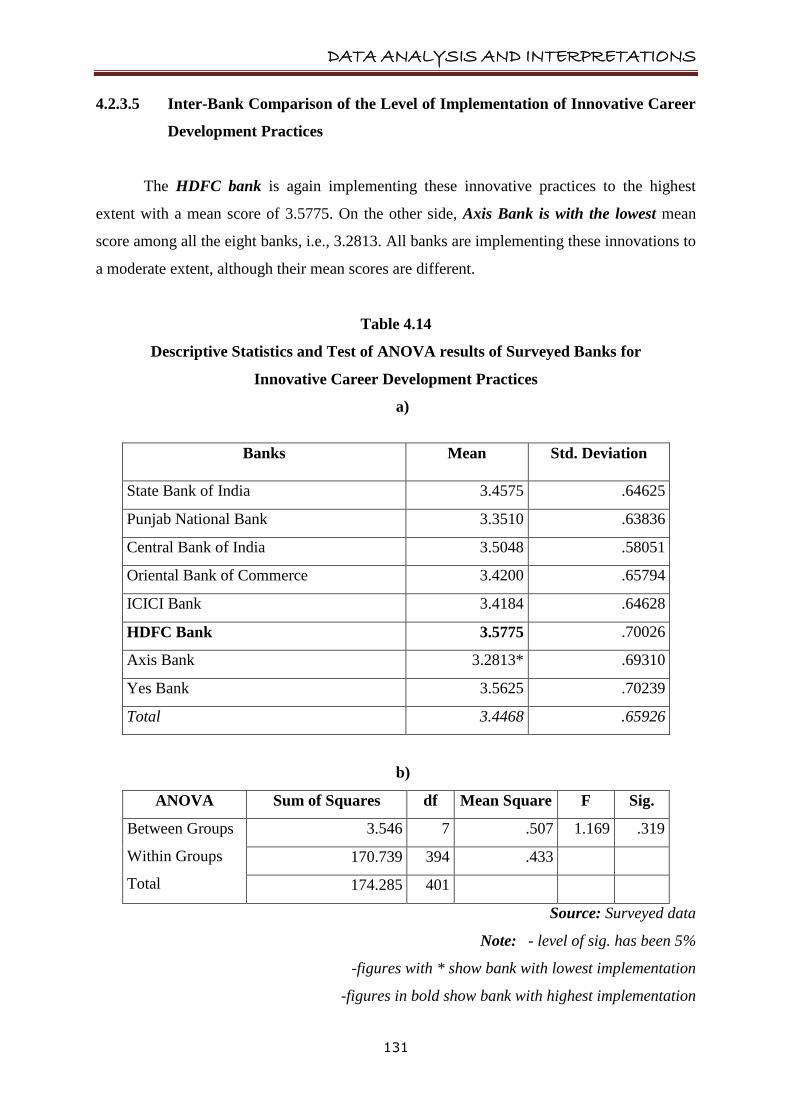
The HDFC bank is again implementing these innovative practices to the highest
extent with a mean score of 3.5775. On the other side, Axis Bank is with the lowest mean
score among all the eight banks, i.e., 3.2813. All banks are implementing these innovations to
a moderate extent, although their mean scores are different.
Table 4.14
Descriptive Statistics and Test of ANOVA results of Surveyed Banks for
Innovative Career Development Practices
a)
b)
ANOVA Sum of Squares df Mean Square F Sig.
Between Groups
Within Groups
Total
3.546 7 .507 1.169 .319
170.739 394 .433
174.285 401
Source: Surveyed data
Note: - level of sig. has been 5%
-figures with * show bank with lowest implementation
-figures in bold show bank with highest implementation
Banks Mean Std. Deviation
State Bank of India 3.4575 .64625
Punjab National Bank 3.3510 .63836
Central Bank of India 3.5048 .58051
Oriental Bank of Commerce 3.4200 .65794
ICICI Bank 3.4184 .64628
HDFC Bank 3.5775 .70026
Axis Bank 3.2813* .69310
Yes Bank 3.5625 .70239
Total 3.4468 .65926
DATA ANALYSIS AND INTERPRETATIONS
132
But concluding any difference among all these banks on the basis of mean scores will
not be appropriate. The ANOVA table signifies that the p-value is more than 0.05 which
means that the null hypothesis will be accepted again. Thus, in case of innovative career
development practices too, the level of implementation in all the eight banks is different by
chance only.
4.2.3.6 Inter-Bank Comparison of the Level of Implementation of Innovative
Employee Motivation Practices
Table 4.15
Descriptive Statistics and Test of ANOVA results of Surveyed Banks for
Innovative Employee Motivation Practices
a)
b)
ANOVA Sum of Squares Df Mean Square F Sig.
Between Groups
Within Groups
Total
4.497 7 .642 1.834 .079
138.034 394 .350
142.531 401
Source: Surveyed data
Note: - level of sig. has been 5%
-figures with * show bank with lowest implementation
-figures in bold show bank with highest implementation
Banks Mean Std. Deviation
State Bank of India 2.8834 .56538
Punjab National Bank 2.9633 .56680
Central Bank of India 2.8435 .74136
Oriental Bank of Commerce 2.8355* .49384
ICICI Bank 2.9610 .53847
HDFC Bank 3.1227 .66248
Axis Bank 2.8513 .42627
Yes Bank 3.0985 .66977
Total 2.9437 .59619

DATA ANALYSIS AND INTERPRETATIONS
133
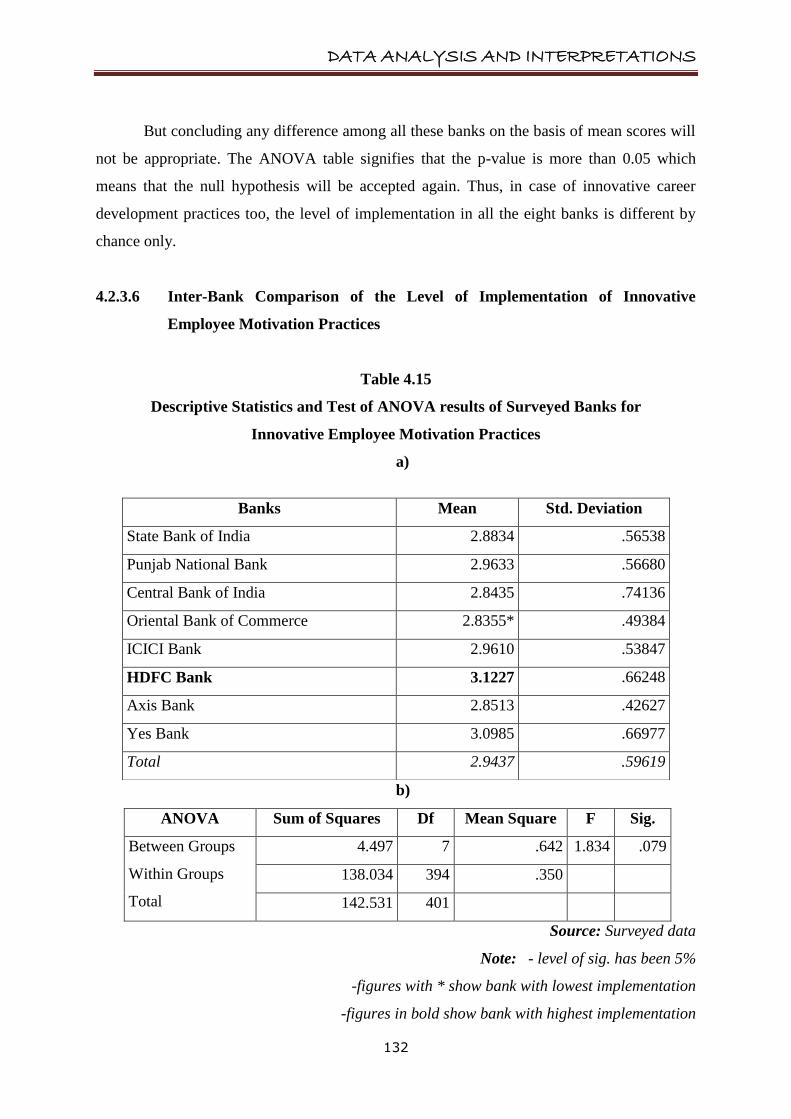
The level of implementation of innovative employee motivation practices has also
been checked with the help of the mean scores and ANOVA test. The descriptive statistics in
table 4.15 (a) clearly depicts that HDFC bank is the leader in the implementation of
innovative employee motivation practices with a mean score of 3.1227 among all eight banks
followed by YES bank having the mean score of 3.0985. However, the bank with the lowest
score is the Oriental Bank of Commerce. Difference in the mean scores is clear from the
table. Guest, 1997 proposed that performance at individual level depended upon high
motivation, possession of the necessary skills and abilities and an appropriate role and
understanding of that role. The motivation techniques can be used to retain employees and
improve job performance if combined with compensation techniques. Therefore, the banks
need to concentrate more on these practices for improving the employee performance. The
ANOVA results shown in the table 4.15 (b) convey that the p-value is more than 0.05.
Therefore, the differences in the level of implementation of the innovative employee
motivation practices shown by descriptive statistics were by chance only and there is no
statistical significance of these differences among the eight banks.
4.2.3.7 Inter-Bank Comparison of the Level of Implementation of Innovative
Employee Security Practices
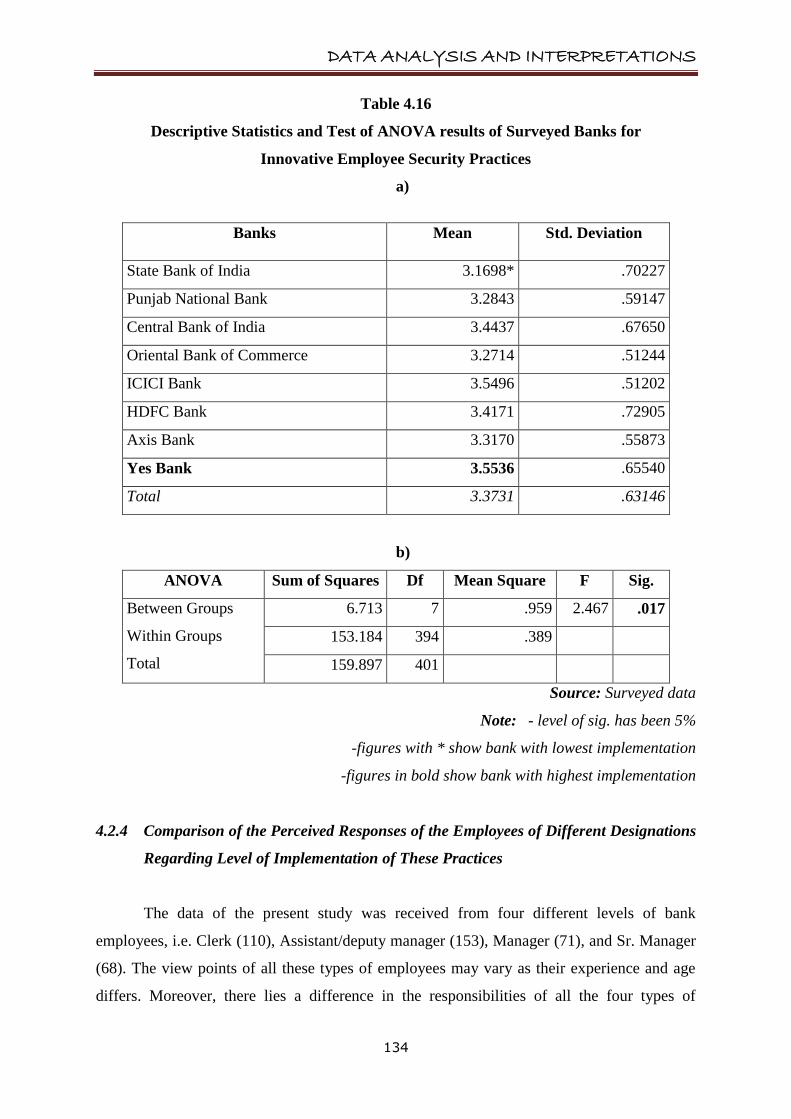
The descriptive scores of this factor (table 4.16) dictate that the YES bank is leading
with a mean score of 3.5536, while the no. 1 bank of India, the State bank of India is the
least scorer in adopting new and improved employee security practices in its bank whose
mean is 3.1698. For statistical analysis of this difference, ANOVA test has been applied.
ANOVA test results clarify that the p-value is significant. Therefore, the alternate hypothesis,
which claims that there is a significant difference between the implementation of employee
security practices among all eight banks, has been accepted. This means that the difference
shown by the mean scores of this factor is statistically proved. Thus, State Bank of India,
along with other public sector banks needs to concentrate more on the employee security
practices so that they can also compete in this dynamic environment.
DATA ANALYSIS AND INTERPRETATIONS
134
Table 4.16
Descriptive Statistics and Test of ANOVA results of Surveyed Banks for
Innovative Employee Security Practices
a)
b)
ANOVA Sum of Squares Df Mean Square F Sig.
Between Groups
Within Groups
Total
6.713 7 .959 2.467 .017
153.184 394 .389
159.897 401
Source: Surveyed data
Note: - level of sig. has been 5%
-figures with * show bank with lowest implementation
-figures in bold show bank with highest implementation
4.2.4 Comparison of the Perceived Responses of the Employees of Different Designations
Regarding Level of Implementation of These Practices
The data of the present study was received from four different levels of bank
employees, i.e. Clerk (110), Assistant/deputy manager (153), Manager (71), and Sr. Manager
(68). The view points of all these types of employees may vary as their experience and age
differs. Moreover, there lies a difference in the responsibilities of all the four types of
Banks Mean Std. Deviation
State Bank of India 3.1698* .70227
Punjab National Bank 3.2843 .59147
Central Bank of India 3.4437 .67650
Oriental Bank of Commerce 3.2714 .51244
ICICI Bank 3.5496 .51202
HDFC Bank 3.4171 .72905
Axis Bank 3.3170 .55873
Yes Bank 3.5536 .65540
Total 3.3731 .63146
DATA ANALYSIS AND INTERPRETATIONS
135
employees because of their scale and designation. This might lead to a variance in the
opinions of these employees regarding the implementation of these innovations in the HRM
practices in their banks. Therefore, a comparison has also been made between the viewpoints
of all these employees designation wise to have more clarity on the implementation. These
viewpoints have been compared for each of the seven innovative HR practices under this
study along with their hypothetical tests.
4.2.4.1 Perceived Responses of Different levels of employees for Innovative
Recruitment and Selection Practices:
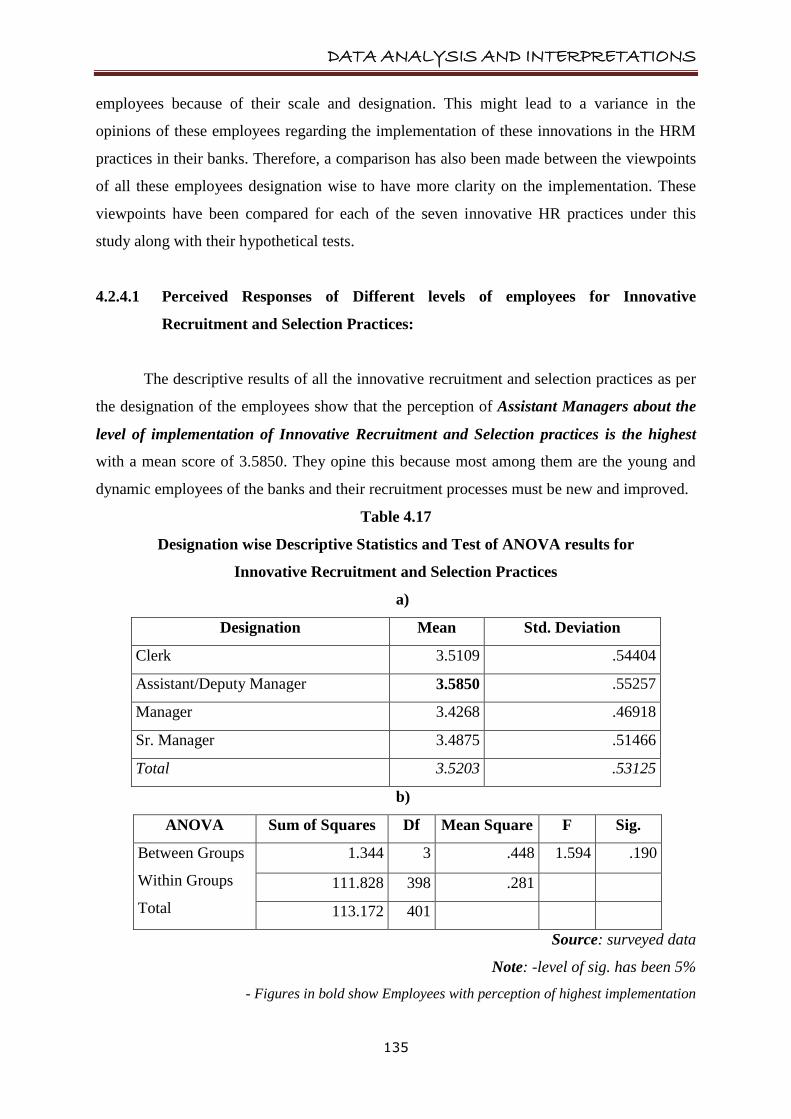
The descriptive results of all the innovative recruitment and selection practices as per
the designation of the employees show that the perception of Assistant Managers about the
level of implementation of Innovative Recruitment and Selection practices is the highest
with a mean score of 3.5850. They opine this because most among them are the young and
dynamic employees of the banks and their recruitment processes must be new and improved.
Table 4.17
Designation wise Descriptive Statistics and Test of ANOVA results for
Innovative Recruitment and Selection Practices
a)
Designation Mean Std. Deviation
Clerk 3.5109 .54404
Assistant/Deputy Manager 3.5850 .55257
Manager 3.4268 .46918
Sr. Manager 3.4875 .51466
Total 3.5203 .53125
b)
ANOVA Sum of Squares Df Mean Square F Sig.
Between Groups
Within Groups
Total
1.344 3 .448 1.594 .190
111.828 398 .281
113.172 401
Source: surveyed data
Note: -level of sig. has been 5%
- Figures in bold show Employees with perception of highest implementation
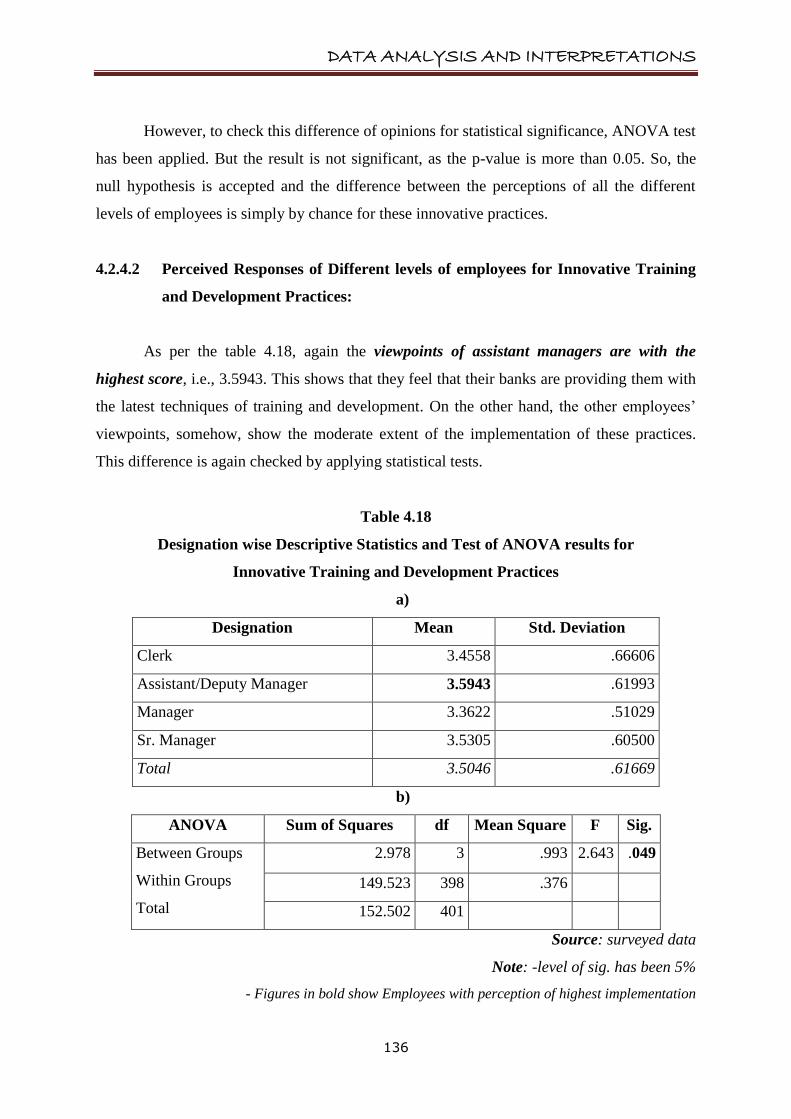
DATA ANALYSIS AND INTERPRETATIONS
136
However, to check this difference of opinions for statistical significance, ANOVA test
has been applied. But the result is not significant, as the p-value is more than 0.05. So, the
null hypothesis is accepted and the difference between the perceptions of all the different
levels of employees is simply by chance for these innovative practices.
4.2.4.2 Perceived Responses of Different levels of employees for Innovative Training
and Development Practices:
As per the table 4.18, again the viewpoints of assistant managers are with the
highest score, i.e., 3.5943. This shows that they feel that their banks are providing them with
the latest techniques of training and development. On the other hand, the other employees‟
viewpoints, somehow, show the moderate extent of the implementation of these practices.
This difference is again checked by applying statistical tests.
Table 4.18
Designation wise Descriptive Statistics and Test of ANOVA results for
Innovative Training and Development Practices
a)
Designation Mean Std. Deviation
Clerk 3.4558 .66606
Assistant/Deputy Manager 3.5943 .61993
Manager 3.3622 .51029
Sr. Manager 3.5305 .60500
Total 3.5046 .61669
b)
ANOVA Sum of Squares df Mean Square F Sig.
Between Groups
Within Groups
Total
2.978 3 .993 2.643 .049
149.523 398 .376
152.502 401
Source: surveyed data
Note: -level of sig. has been 5%
- Figures in bold show Employees with perception of highest implementation
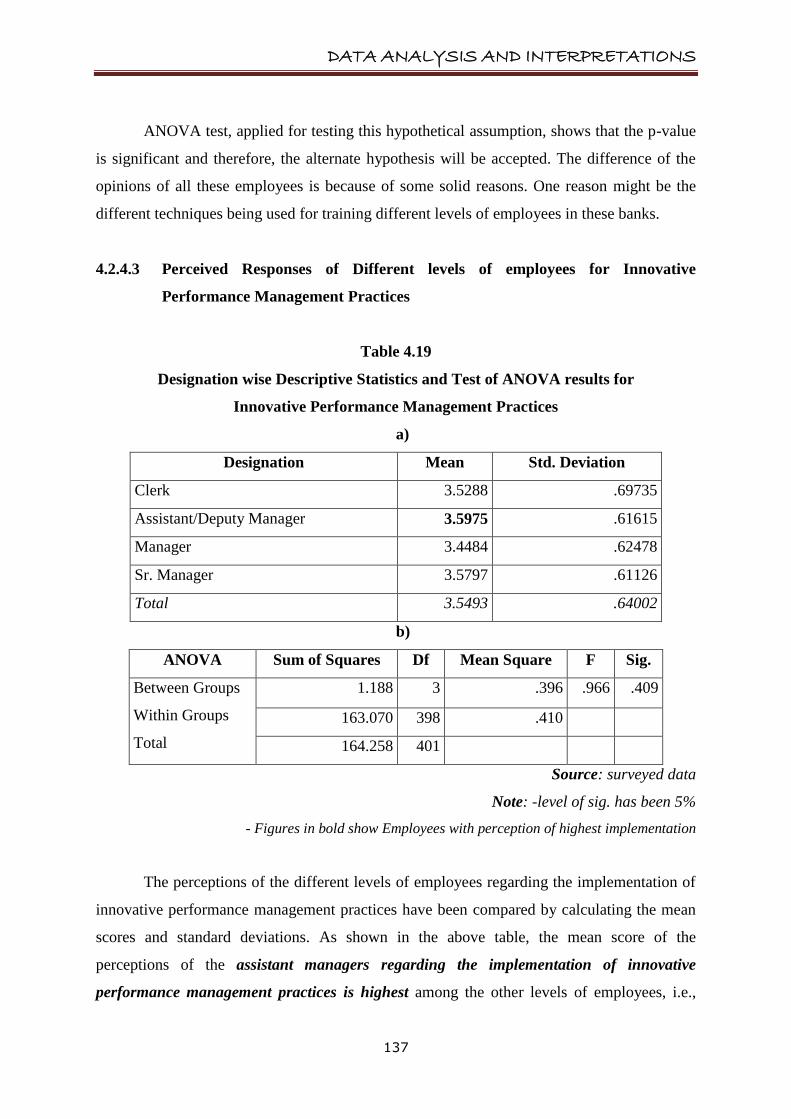
DATA ANALYSIS AND INTERPRETATIONS
137
ANOVA test, applied for testing this hypothetical assumption, shows that the p-value
is significant and therefore, the alternate hypothesis will be accepted. The difference of the
opinions of all these employees is because of some solid reasons. One reason might be the
different techniques being used for training different levels of employees in these banks.
4.2.4.3 Perceived Responses of Different levels of employees for Innovative
Performance Management Practices
Table 4.19
Designation wise Descriptive Statistics and Test of ANOVA results for
Innovative Performance Management Practices
a)
Designation Mean Std. Deviation
Clerk 3.5288 .69735
Assistant/Deputy Manager 3.5975 .61615
Manager 3.4484 .62478
Sr. Manager 3.5797 .61126
Total 3.5493 .64002
b)
ANOVA Sum of Squares Df Mean Square F Sig.
Between Groups
Within Groups
Total
1.188 3 .396 .966 .409
163.070 398 .410
164.258 401
Source: surveyed data
Note: -level of sig. has been 5%
- Figures in bold show Employees with perception of highest implementation
The perceptions of the different levels of employees regarding the implementation of
innovative performance management practices have been compared by calculating the mean
scores and standard deviations. As shown in the above table, the mean score of the
perceptions of the assistant managers regarding the implementation of innovative
performance management practices is highest among the other levels of employees, i.e.,
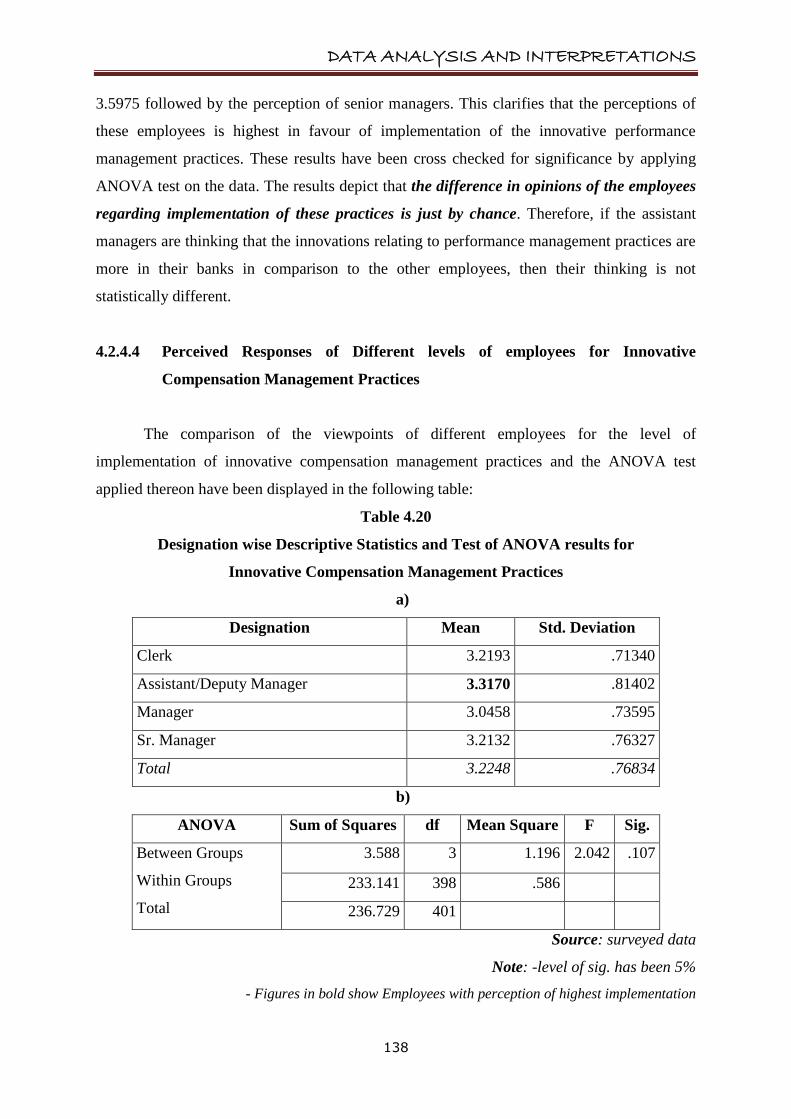
DATA ANALYSIS AND INTERPRETATIONS
138
3.5975 followed by the perception of senior managers. This clarifies that the perceptions of
these employees is highest in favour of implementation of the innovative performance
management practices. These results have been cross checked for significance by applying
ANOVA test on the data. The results depict that the difference in opinions of the employees
regarding implementation of these practices is just by chance. Therefore, if the assistant
managers are thinking that the innovations relating to performance management practices are
more in their banks in comparison to the other employees, then their thinking is not
statistically different.
4.2.4.4 Perceived Responses of Different levels of employees for Innovative
Compensation Management Practices
The comparison of the viewpoints of different employees for the level of
implementation of innovative compensation management practices and the ANOVA test
applied thereon have been displayed in the following table:
Table 4.20
Designation wise Descriptive Statistics and Test of ANOVA results for
Innovative Compensation Management Practices
a)
Designation Mean Std. Deviation
Clerk 3.2193 .71340
Assistant/Deputy Manager 3.3170 .81402
Manager 3.0458 .73595
Sr. Manager 3.2132 .76327
Total 3.2248 .76834
b)
ANOVA Sum of Squares df Mean Square F Sig.
Between Groups
Within Groups
Total
3.588 3 1.196 2.042 .107
233.141 398 .586
236.729 401
Source: surveyed data
Note: -level of sig. has been 5%
- Figures in bold show Employees with perception of highest implementation
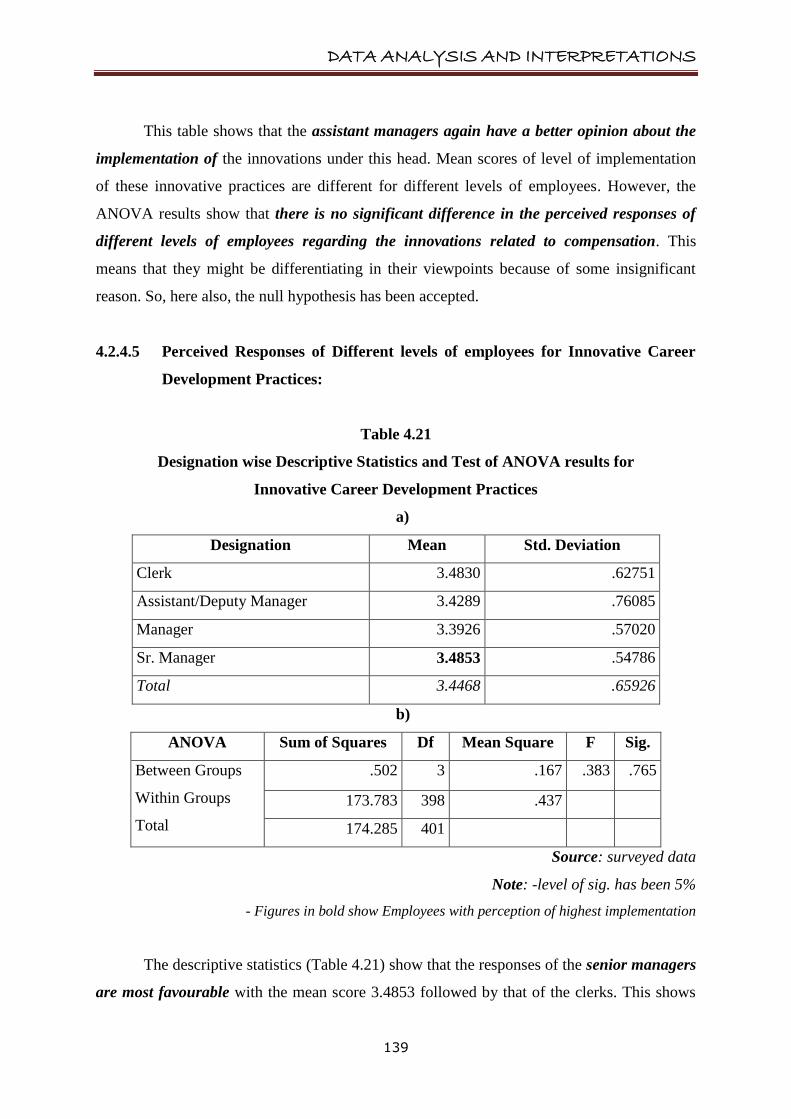
DATA ANALYSIS AND INTERPRETATIONS
139
This table shows that the assistant managers again have a better opinion about the
implementation of the innovations under this head. Mean scores of level of implementation
of these innovative practices are different for different levels of employees. However, the
ANOVA results show that there is no significant difference in the perceived responses of
different levels of employees regarding the innovations related to compensation. This
means that they might be differentiating in their viewpoints because of some insignificant
reason. So, here also, the null hypothesis has been accepted.
4.2.4.5 Perceived Responses of Different levels of employees for Innovative Career
Development Practices:
Table 4.21
Designation wise Descriptive Statistics and Test of ANOVA results for
Innovative Career Development Practices
a)
Designation Mean Std. Deviation
Clerk 3.4830 .62751
Assistant/Deputy Manager 3.4289 .76085
Manager 3.3926 .57020
Sr. Manager 3.4853 .54786
Total 3.4468 .65926
b)
ANOVA Sum of Squares Df Mean Square F Sig.
Between Groups
Within Groups
Total
.502 3 .167 .383 .765
173.783 398 .437
174.285 401
Source: surveyed data
Note: -level of sig. has been 5%
- Figures in bold show Employees with perception of highest implementation
The descriptive statistics (Table 4.21) show that the responses of the senior managers
are most favourable with the mean score 3.4853 followed by that of the clerks. This shows
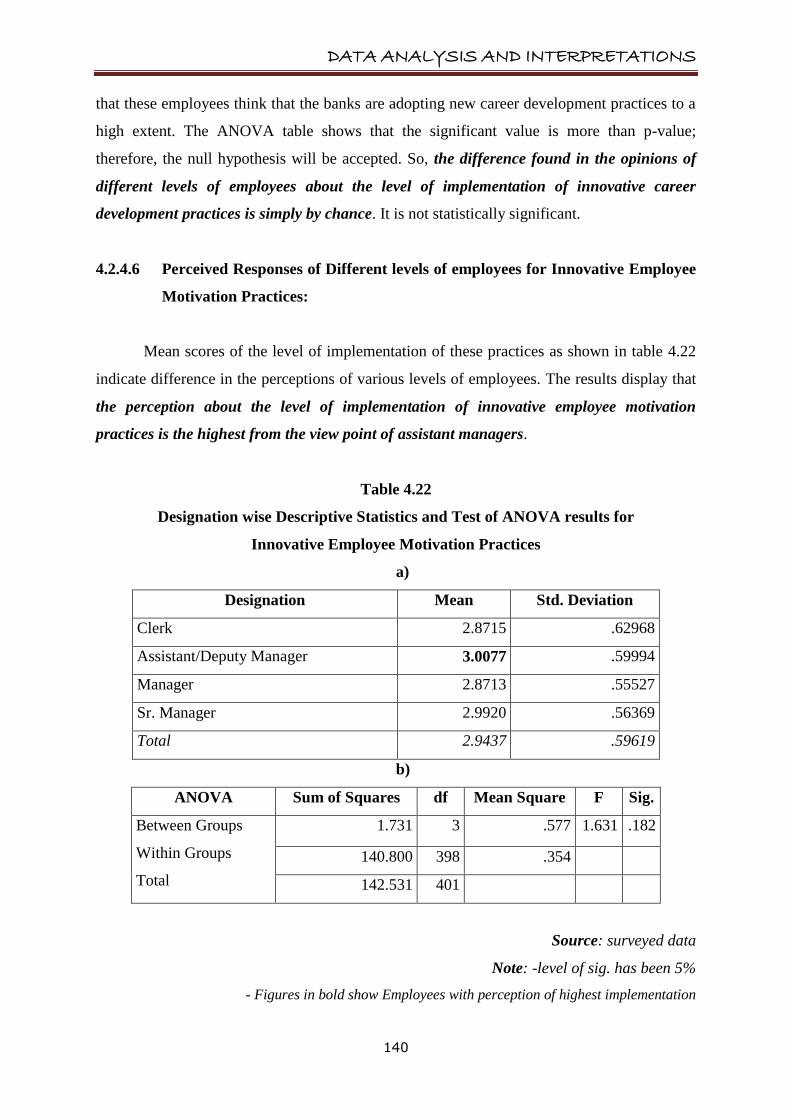
DATA ANALYSIS AND INTERPRETATIONS
140
that these employees think that the banks are adopting new career development practices to a
high extent. The ANOVA table shows that the significant value is more than p-value;
therefore, the null hypothesis will be accepted. So, the difference found in the opinions of
different levels of employees about the level of implementation of innovative career
development practices is simply by chance. It is not statistically significant.
4.2.4.6 Perceived Responses of Different levels of employees for Innovative Employee
Motivation Practices:
Mean scores of the level of implementation of these practices as shown in table 4.22
indicate difference in the perceptions of various levels of employees. The results display that
the perception about the level of implementation of innovative employee motivation
practices is the highest from the view point of assistant managers.
Table 4.22
Designation wise Descriptive Statistics and Test of ANOVA results for
Innovative Employee Motivation Practices
a)
Designation Mean Std. Deviation
Clerk 2.8715 .62968
Assistant/Deputy Manager 3.0077 .59994
Manager 2.8713 .55527
Sr. Manager 2.9920 .56369
Total 2.9437 .59619
b)
ANOVA Sum of Squares df Mean Square F Sig.
Between Groups
Within Groups
Total
1.731 3 .577 1.631 .182
140.800 398 .354
142.531 401
Source: surveyed data
Note: -level of sig. has been 5%
- Figures in bold show Employees with perception of highest implementation
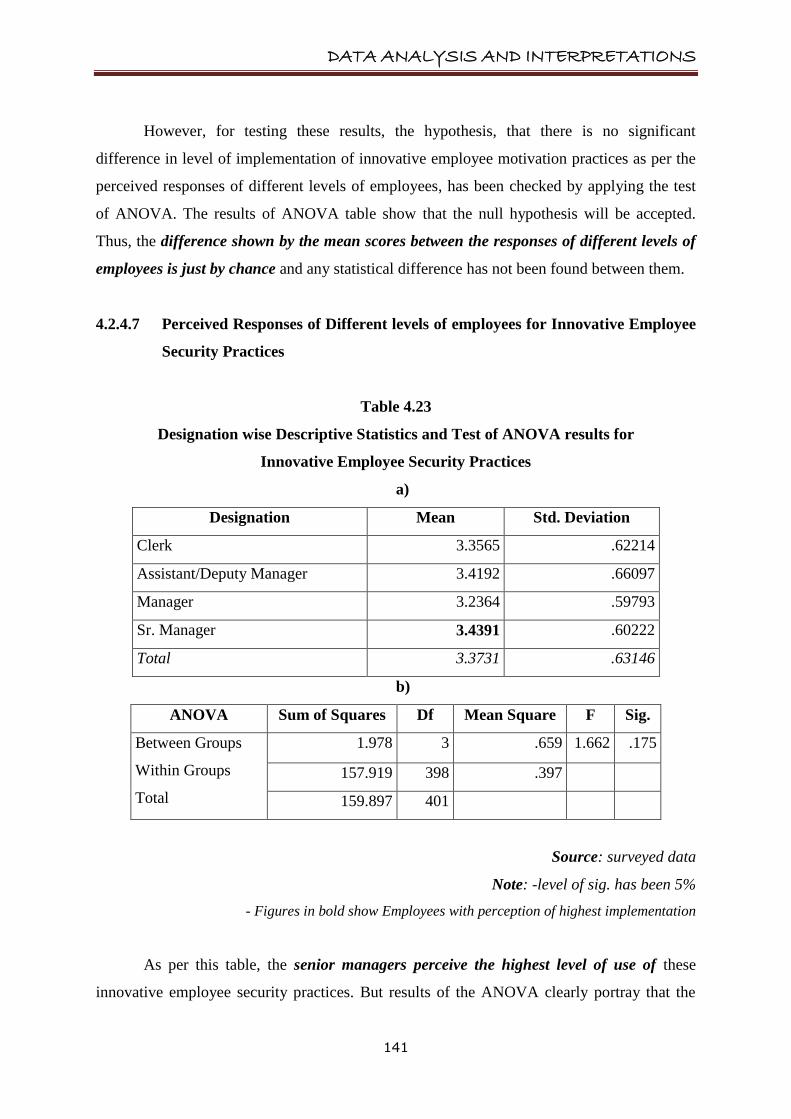
DATA ANALYSIS AND INTERPRETATIONS
141
However, for testing these results, the hypothesis, that there is no significant
difference in level of implementation of innovative employee motivation practices as per the
perceived responses of different levels of employees, has been checked by applying the test
of ANOVA. The results of ANOVA table show that the null hypothesis will be accepted.
Thus, the difference shown by the mean scores between the responses of different levels of
employees is just by chance and any statistical difference has not been found between them.
4.2.4.7 Perceived Responses of Different levels of employees for Innovative Employee
Security Practices
Table 4.23
Designation wise Descriptive Statistics and Test of ANOVA results for
Innovative Employee Security Practices
a)
Designation Mean Std. Deviation
Clerk 3.3565 .62214
Assistant/Deputy Manager 3.4192 .66097
Manager 3.2364 .59793
Sr. Manager 3.4391 .60222
Total 3.3731 .63146
b)
ANOVA Sum of Squares Df Mean Square F Sig.
Between Groups
Within Groups
Total
1.978 3 .659 1.662 .175
157.919 398 .397
159.897 401
Source: surveyed data
Note: -level of sig. has been 5%
- Figures in bold show Employees with perception of highest implementation
As per this table, the senior managers perceive the highest level of use of these
innovative employee security practices. But results of the ANOVA clearly portray that the
DATA ANALYSIS AND INTERPRETATIONS
142
differences in the opinions of different levels of employees is not statistically significant
because the p-value is again higher than 0.05. Therefore, the null hypothesis will be accepted.
4.2.5 Comparison of the Perceived Responses of the Graduate and Postgraduate
Employees Regarding Level of Implementation of These Practices
Education plays an important role in the developing the mindset of any employee
about its organisation. In the present study, the data was collected from only those employees
of the banks who are either graduates or post graduates. One of the major reasons behind this
was that it was found in the pilot testing that the employees, who were undergraduate, were
not taking the questionnaire seriously by saying that either they were not aware of the
policies or they were incapable of reading the questionnaire. Therefore, care was taken before
selecting the actual respondents of the study. Out of the total of 402 respondents, 277 were
post-graduates and 125 were graduates. Here, both the educated groups have been compared
for their viewpoints regarding the level of implementation of these innovative HRM practices
in their banks.
The descriptive results of the comparison of graduates and postgraduates and the
results of independent samples t test applied to check whether any difference in both the
opinions is significant or not, have been shown in table 4.24. The results of descriptive
statistics of both groups show that post graduates think that all these practices are being
implemented in their banks to a higher level. The mindset of graduates is different from that
of the post graduates in this regard. In case of career development related innovations, both
groups feel same for the level of implementation. Before discussing the reasons behind this,
we must first check statistically, whether these results are significantly different or the
difference exists simply by chance. For this, independent samples t-test has been applied. It is
obvious from the results that there exists no significant difference between the opinions of
both the group of employees regarding the implementation of all the HRM practices as p-
value is higher than 0.05 for each factor. If any difference exists then that is by chance only.
Both, the graduates as well as post graduates, feel same about the level of implementation of
these practices in their banks. However, the absolute difference which was found in the
descriptive statistics might be different because of the fact that the post graduate employees
are on the posts of Assistant manager or the higher one. That is why their perceptions about
the implementation level matches with that of the managerial level employees.

DATA ANALYSIS AND INTERPRETATIONS
143
Table 4.24
Education-Wise Descriptive Statistics and Independent samples t-test results
Education-Wise Descriptive Statistics Levene's Test for Equality of Variances t-test for Equality of Means
IHRM Practices Education
Level Mean
Std.
Deviation
F p
value
Value of
t df
Sig. (2-
tailed)
Innovative Recruitment
and Selection Practices
Post graduate
Graduate
3.5379
3.4812
.52140
.55258
Equal variances assumed
Equal variances not assumed
.248
.619
.991 400 .322
.969 227.178 .334
Innovative Training and
Development Practices
Post graduate
Graduate
3.5242
3.4611
.60892
.63387
Equal variances assumed
Equal variances not assumed
.000
.993
.949 400 .343
.935 230.801 .351
Innovative Performance
management Practices
Post graduate
Graduate
3.5737
3.4953
.63012
.66079
Equal variances assumed
Equal variances not assumed
.017
.898
1.137 400 .256
1.117 229.299 .265
Innovative Compensation
Management Practices
Post graduate
Graduate
3.2351
3.2020
.79560
.70671
Equal variances assumed
Equal variances not assumed
1.820
.178
.399 400 .690
.418 267.140 .676
Innovative Career
development Practices
Post graduate
Graduate
3.4468
3.4470
.64759
.68709
Equal variances assumed
Equal variances not assumed
.670
.413
-.004 400 .997
-.003 226.956 .997
Innovative Employee
Motivation Practices
Post graduate
Graduate
2.9806
2.8618
.59449
.59413
Equal variances assumed
Equal variances not assumed
.071
.790
1.855 400 .064
1.856 239.408 .065
Innovative Employee
Security Practices
Post graduate
Graduate
3.3816
3.3543
.64936
.59197
Equal variances assumed
Equal variances not assumed
1.607 .206 .402 400 .688
.416 260.692 .678
Source: surveyed data
Note: level of sig. has been 5%
DATA ANALYSIS AND INTERPRETATIONS
144
4.2.6 Comparison of the Perceived Responses of the Male and Female Employees
Regarding Level of Implementation of These Practices
To check the opinions of the different employees of the banks under the study, a
gender-wise comparison between the perceptions of the employees has also been made. In the
present study, out of 402 respondents, 308 respondents were male employees (76.6 percent)
and 94 were female employees which is 23.4 percent of the total number. Table 4.25 shows
the descriptive results of the responses and the t-test results when compared for male and
female employees. Mixed results have been found about the opinions of male and female
employees regarding the level of implementation of the innovative HRM practices in their
banks. As per the results, the male employees of the surveyed banks feel that innovative
recruitment & selection, training & development, motivation and employee security
practices are being implemented to a higher extent. On the other side, the female
employee‟s perceived viewpoints are higher in case of the other HR practices related
innovations, i.e., innovative practices related to performance management, compensation
management, and career development.
Again, independent sample t-test was applied for getting any significant difference
between the perceptions of the male and female employees of these banks. After analysing
the results of this test, it was found that the difference in the opinions of male and female
employees regarding the level of implementation of all HRM practices is not statistically
significant. The difference lies by chance or no significant reasons lie behind this difference
of opinions. Such differences need to be explored in some future researches.
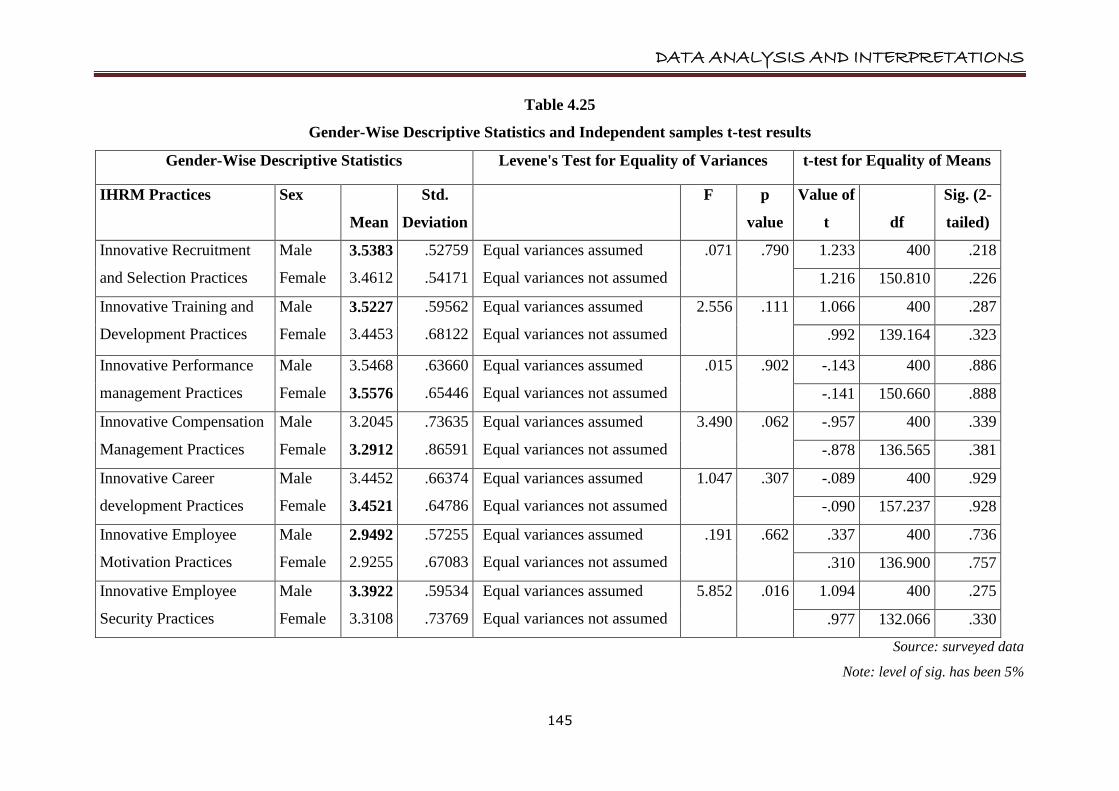
DATA ANALYSIS AND INTERPRETATIONS
145
Table 4.25
Gender-Wise Descriptive Statistics and Independent samples t-test results
Gender-Wise Descriptive Statistics Levene's Test for Equality of Variances t-test for Equality of Means
IHRM Practices Sex
Mean
Std.
Deviation
F p
value
Value of
t df
Sig. (2-
tailed)
Innovative Recruitment
and Selection Practices
Male
Female
3.5383
3.4612
.52759
.54171
Equal variances assumed
Equal variances not assumed
.071
.790
1.233 400 .218
1.216 150.810 .226
Innovative Training and
Development Practices
Male
Female
3.5227
3.4453
.59562
.68122
Equal variances assumed
Equal variances not assumed
2.556
.111
1.066 400 .287
.992 139.164 .323
Innovative Performance
management Practices
Male
Female
3.5468
3.5576
.63660
.65446
Equal variances assumed
Equal variances not assumed
.015
.902
-.143 400 .886
-.141 150.660 .888
Innovative Compensation
Management Practices
Male
Female
3.2045
3.2912
.73635
.86591
Equal variances assumed
Equal variances not assumed
3.490
.062
-.957 400 .339
-.878 136.565 .381
Innovative Career
development Practices
Male
Female
3.4452
3.4521
.66374
.64786
Equal variances assumed
Equal variances not assumed
1.047
.307
-.089 400 .929
-.090 157.237 .928
Innovative Employee
Motivation Practices
Male
Female
2.9492
2.9255
.57255
.67083
Equal variances assumed
Equal variances not assumed
.191
.662
.337 400 .736
.310 136.900 .757
Innovative Employee
Security Practices
Male
Female
3.3922
3.3108
.59534
.73769
Equal variances assumed
Equal variances not assumed
5.852 .016 1.094 400 .275
.977 132.066 .330
Source: surveyed data
Note: level of sig. has been 5%

DATA ANALYSIS AND INTERPRETATIONS
146
4.3 IMPACT OF INNOVATIVE HUMAN RESOURCE MANAGEMENT
PRACTICES ON EMPLOYEE PRODUCTIVITY
To know the impact of the seven innovative HRM practices on employee
productivity, ten statements under two heads named HR performance and financial
performance were asked in the second part of the questionnaire from the employees of the
banks. The responses of these statements were in two categories named „agree‟ or „disagree‟.
As the dependent variables, i.e. HR and financial performance were categorical and
independent variables were more than one, Discriminant analysis was used to find out the
relationship between the two. Similar binary and categorical variables based on perceptions
have been used in previous researches on HR practices and their effect on firm performance
(e.g. Delaney and Huselid, 1996; Lahteenmaki et al., 1998; Guthrie, 2001; Stavrou and
Brewster, 2005). The aim of the statistical analysis in DA is to combine the variable scores in
some way so that a single new composite variable, the Discriminant score, is produced. This
score can be further used for determining the relationship between the variables. The
Discriminant analysis was run three times. Firstly, HR performance was taken as dependent
variable, and then the dependency of financial performance was checked. At last the overall
employee productivity (average of both performance parameters) was taken as categorical
dependent variable for the analysis.
Therefore, three Discriminant equations have been explored through these analyses.
4.3.1 Discriminant Analysis for HR performance of Employees
For establishing the relationship between dependent variable (HR Performance) and
independent variables (seven Innovative HRM Practices), Discriminant analysis was used.
Discriminant analysis is particularly helpful when the dependent variable is categorical in
nature. In the present study, there were two categories of responses of the dependent variable
which were given values of 1 and 2. For the validation of Discriminant equation, 70 percent
of the data was chosen randomly and equation was formulated by it. The rest of the 30
percent data was used to cross check the results. The overall classifications results indicate
that 77.9 percent of the cases were correctly classified where as 71.1 percent of the
unselected cases were correctly classified. This overall predictive accuracy of the
Discriminant function is called the „hit ratio‟. The hit ratio should be higher to make the
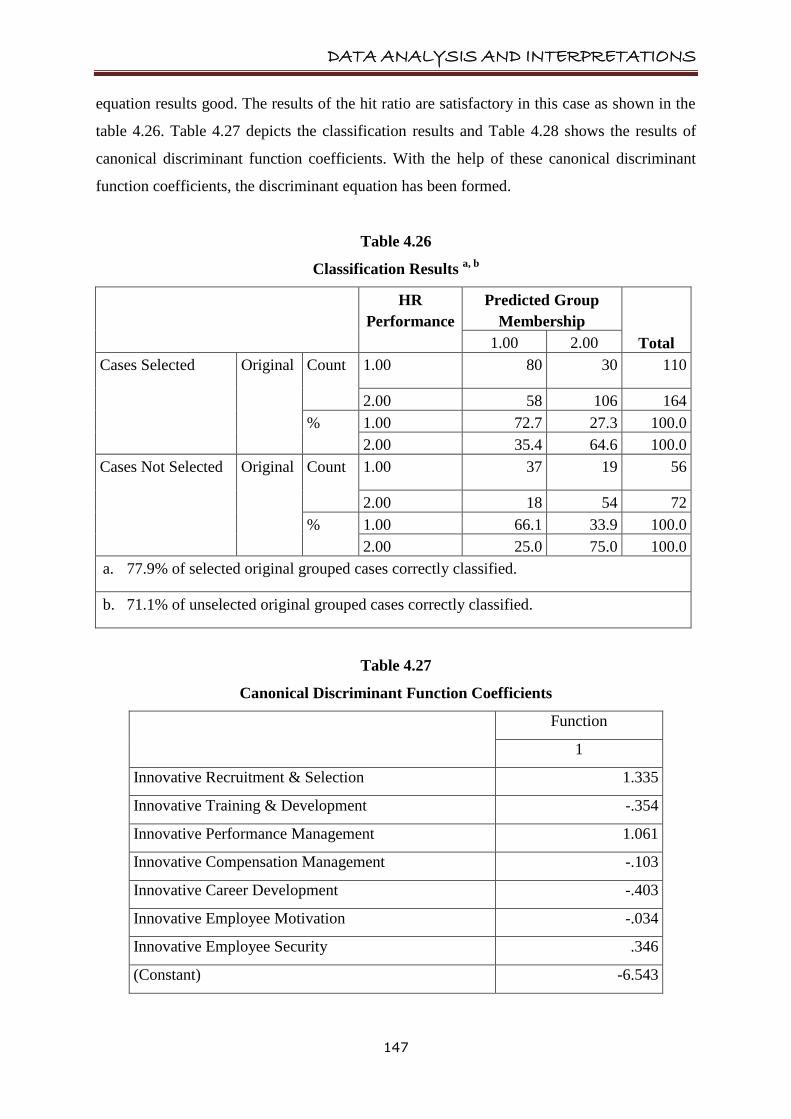
DATA ANALYSIS AND INTERPRETATIONS
147
equation results good. The results of the hit ratio are satisfactory in this case as shown in the
table 4.26. Table 4.27 depicts the classification results and Table 4.28 shows the results of
canonical discriminant function coefficients. With the help of these canonical discriminant
function coefficients, the discriminant equation has been formed.
Table 4.26
Classification Results a, b
HR
Performance
Predicted Group
Membership
Total 1.00 2.00
Cases Selected Original Count 1.00 80 30 110
2.00 58 106 164
% 1.00 72.7 27.3 100.0
2.00 35.4 64.6 100.0
Cases Not Selected Original Count 1.00 37 19 56
2.00 18 54 72
% 1.00 66.1 33.9 100.0
2.00 25.0 75.0 100.0
a. 77.9% of selected original grouped cases correctly classified.
b. 71.1% of unselected original grouped cases correctly classified.
Table 4.27
Canonical Discriminant Function Coefficients
Function
1
Innovative Recruitment & Selection 1.335
Innovative Training & Development -.354
Innovative Performance Management 1.061
Innovative Compensation Management -.103
Innovative Career Development -.403
Innovative Employee Motivation -.034
Innovative Employee Security .346
(Constant) -6.543
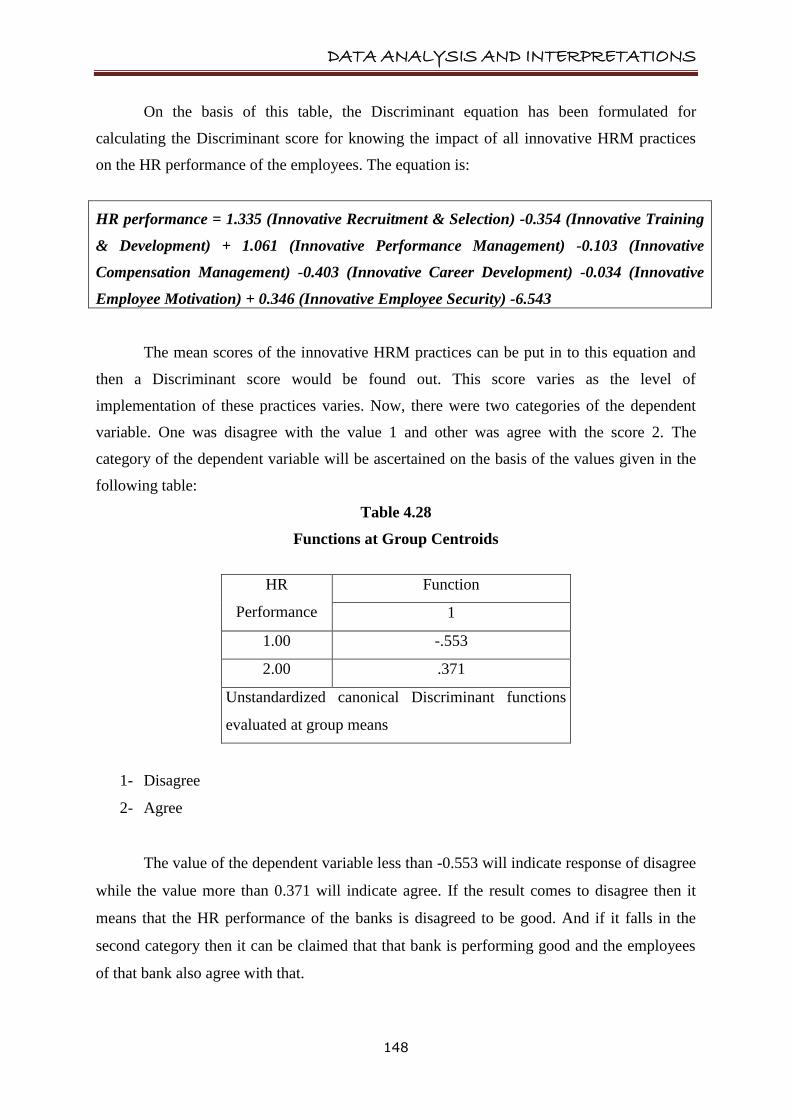
DATA ANALYSIS AND INTERPRETATIONS
148
On the basis of this table, the Discriminant equation has been formulated for
calculating the Discriminant score for knowing the impact of all innovative HRM practices
on the HR performance of the employees. The equation is:
HR performance = 1.335 (Innovative Recruitment & Selection) -0.354 (Innovative Training
& Development) + 1.061 (Innovative Performance Management) -0.103 (Innovative
Compensation Management) -0.403 (Innovative Career Development) -0.034 (Innovative
Employee Motivation) + 0.346 (Innovative Employee Security) -6.543
The mean scores of the innovative HRM practices can be put in to this equation and
then a Discriminant score would be found out. This score varies as the level of
implementation of these practices varies. Now, there were two categories of the dependent
variable. One was disagree with the value 1 and other was agree with the score 2. The
category of the dependent variable will be ascertained on the basis of the values given in the
following table:
Table 4.28
Functions at Group Centroids
HR
Performance
Function
1
1.00 -.553
2.00 .371
Unstandardized canonical Discriminant functions
evaluated at group means
1- Disagree
2- Agree
The value of the dependent variable less than -0.553 will indicate response of disagree
while the value more than 0.371 will indicate agree. If the result comes to disagree then it
means that the HR performance of the banks is disagreed to be good. And if it falls in the
second category then it can be claimed that that bank is performing good and the employees
of that bank also agree with that.
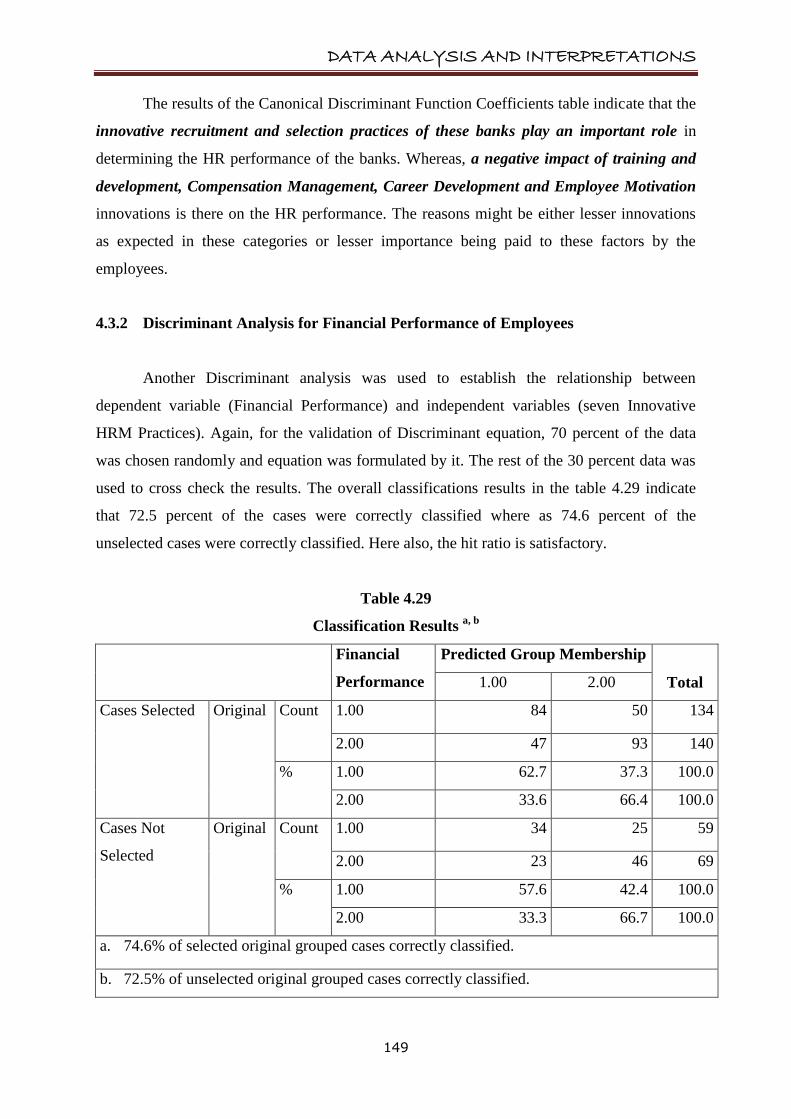
DATA ANALYSIS AND INTERPRETATIONS
149
The results of the Canonical Discriminant Function Coefficients table indicate that the
innovative recruitment and selection practices of these banks play an important role in
determining the HR performance of the banks. Whereas, a negative impact of training and
development, Compensation Management, Career Development and Employee Motivation
innovations is there on the HR performance. The reasons might be either lesser innovations
as expected in these categories or lesser importance being paid to these factors by the
employees.
4.3.2 Discriminant Analysis for Financial Performance of Employees
Another Discriminant analysis was used to establish the relationship between
dependent variable (Financial Performance) and independent variables (seven Innovative
HRM Practices). Again, for the validation of Discriminant equation, 70 percent of the data
was chosen randomly and equation was formulated by it. The rest of the 30 percent data was
used to cross check the results. The overall classifications results in the table 4.29 indicate
that 72.5 percent of the cases were correctly classified where as 74.6 percent of the
unselected cases were correctly classified. Here also, the hit ratio is satisfactory.
Table 4.29
Classification Results a, b
Financial
Performance
Predicted Group Membership
Total 1.00 2.00
Cases Selected Original Count 1.00 84 50 134
2.00 47 93 140
% 1.00 62.7 37.3 100.0
2.00 33.6 66.4 100.0
Cases Not
Selected
Original Count 1.00 34 25 59
2.00 23 46 69
% 1.00 57.6 42.4 100.0
2.00 33.3 66.7 100.0
a. 74.6% of selected original grouped cases correctly classified.
b. 72.5% of unselected original grouped cases correctly classified.
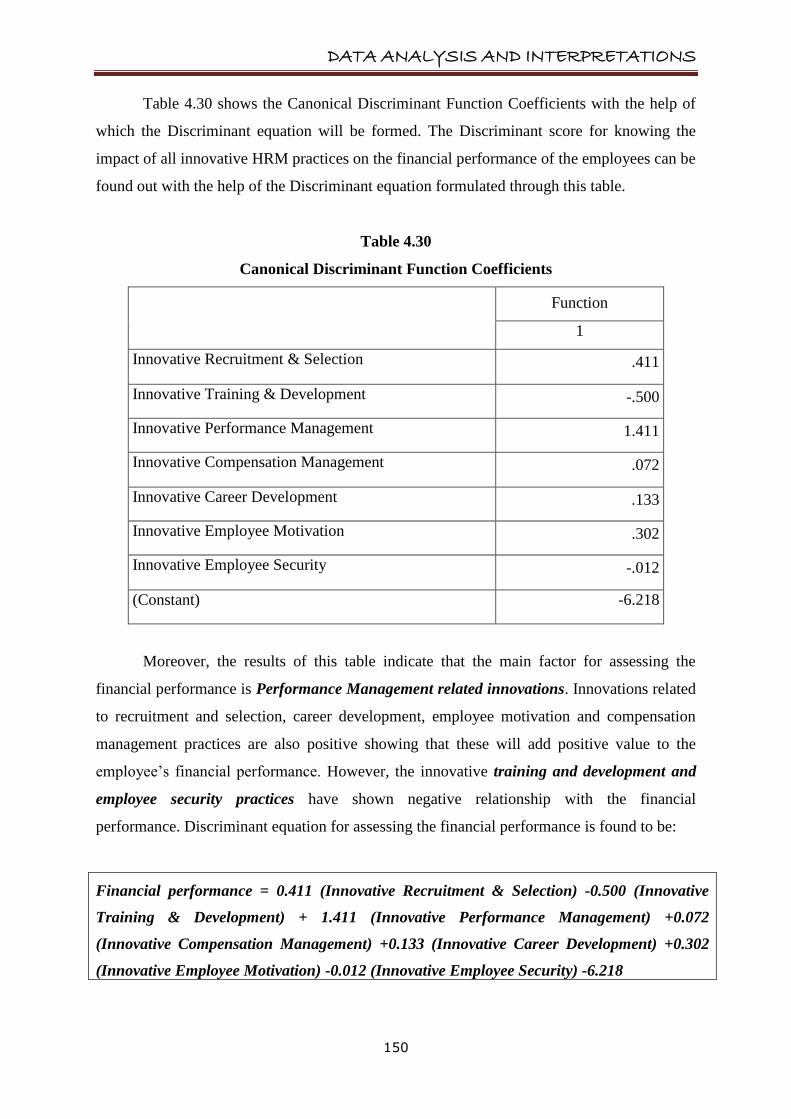
DATA ANALYSIS AND INTERPRETATIONS
150
Table 4.30 shows the Canonical Discriminant Function Coefficients with the help of
which the Discriminant equation will be formed. The Discriminant score for knowing the
impact of all innovative HRM practices on the financial performance of the employees can be
found out with the help of the Discriminant equation formulated through this table.
Table 4.30
Canonical Discriminant Function Coefficients
Function
1
Innovative Recruitment & Selection .411
Innovative Training & Development -.500
Innovative Performance Management 1.411
Innovative Compensation Management .072
Innovative Career Development .133
Innovative Employee Motivation .302
Innovative Employee Security -.012
(Constant) -6.218
Moreover, the results of this table indicate that the main factor for assessing the
financial performance is Performance Management related innovations. Innovations related
to recruitment and selection, career development, employee motivation and compensation
management practices are also positive showing that these will add positive value to the
employee‟s financial performance. However, the innovative training and development and
employee security practices have shown negative relationship with the financial
performance. Discriminant equation for assessing the financial performance is found to be:
Financial performance = 0.411 (Innovative Recruitment & Selection) -0.500 (Innovative
Training & Development) + 1.411 (Innovative Performance Management) +0.072
(Innovative Compensation Management) +0.133 (Innovative Career Development) +0.302
(Innovative Employee Motivation) -0.012 (Innovative Employee Security) -6.218
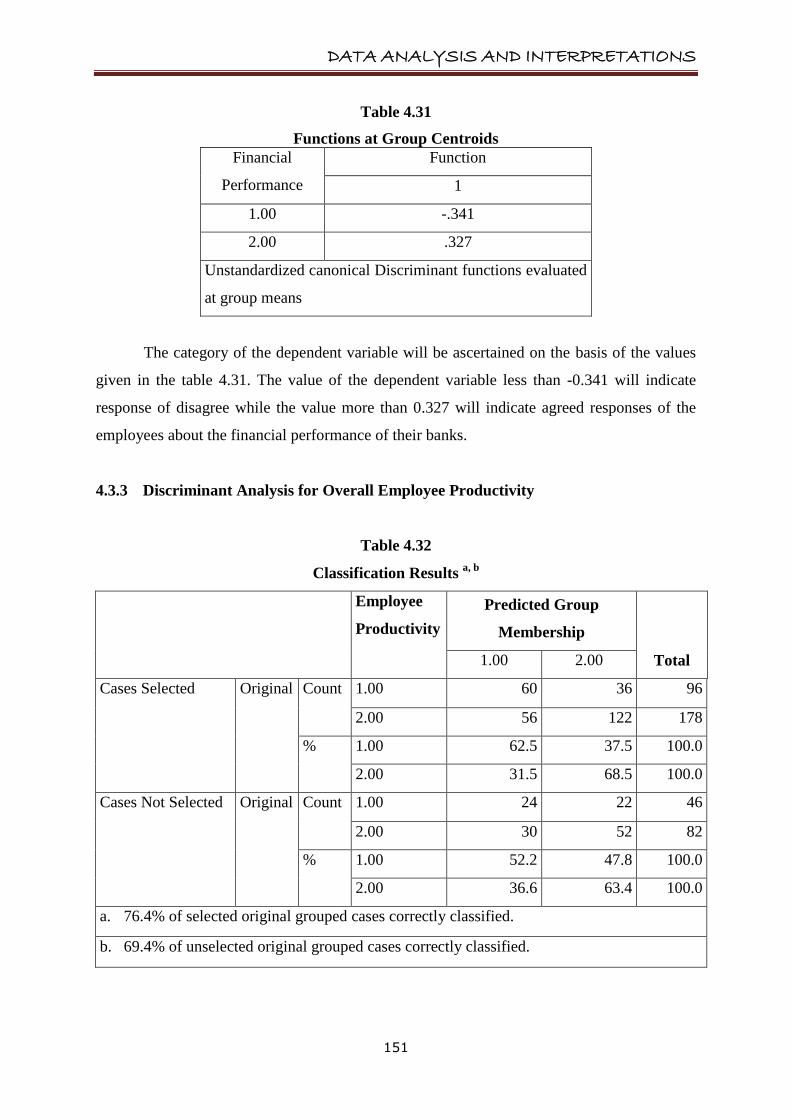
DATA ANALYSIS AND INTERPRETATIONS
151
Table 4.31
Functions at Group Centroids
Financial
Performance
Function
1
1.00 -.341
2.00 .327
Unstandardized canonical Discriminant functions evaluated
at group means
The category of the dependent variable will be ascertained on the basis of the values
given in the table 4.31. The value of the dependent variable less than -0.341 will indicate
response of disagree while the value more than 0.327 will indicate agreed responses of the
employees about the financial performance of their banks.
4.3.3 Discriminant Analysis for Overall Employee Productivity
Table 4.32
Classification Results a, b
Employee
Productivity
Predicted Group
Membership
Total 1.00 2.00
Cases Selected Original Count 1.00 60 36 96
2.00 56 122 178
% 1.00 62.5 37.5 100.0
2.00 31.5 68.5 100.0
Cases Not Selected Original Count 1.00 24 22 46
2.00 30 52 82
% 1.00 52.2 47.8 100.0
2.00 36.6 63.4 100.0
a. 76.4% of selected original grouped cases correctly classified.
b. 69.4% of unselected original grouped cases correctly classified.
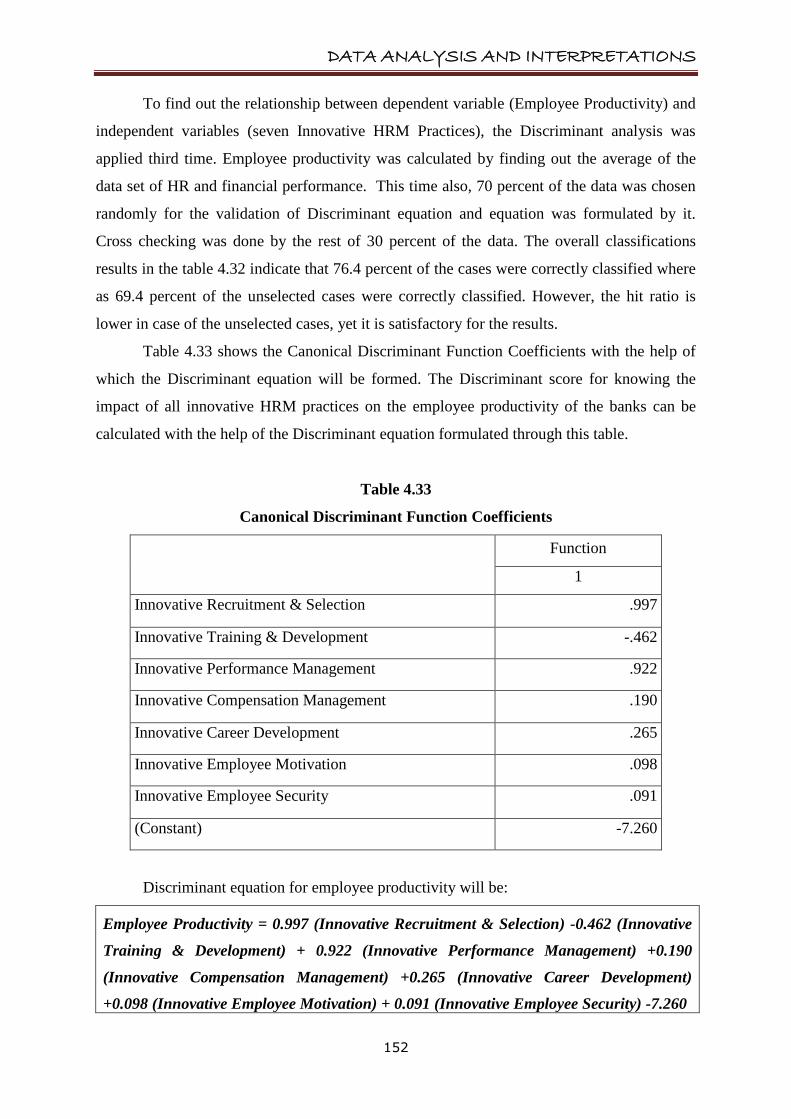
DATA ANALYSIS AND INTERPRETATIONS
152
To find out the relationship between dependent variable (Employee Productivity) and
independent variables (seven Innovative HRM Practices), the Discriminant analysis was
applied third time. Employee productivity was calculated by finding out the average of the
data set of HR and financial performance. This time also, 70 percent of the data was chosen
randomly for the validation of Discriminant equation and equation was formulated by it.
Cross checking was done by the rest of 30 percent of the data. The overall classifications
results in the table 4.32 indicate that 76.4 percent of the cases were correctly classified where
as 69.4 percent of the unselected cases were correctly classified. However, the hit ratio is
lower in case of the unselected cases, yet it is satisfactory for the results.
Table 4.33 shows the Canonical Discriminant Function Coefficients with the help of
which the Discriminant equation will be formed. The Discriminant score for knowing the
impact of all innovative HRM practices on the employee productivity of the banks can be
calculated with the help of the Discriminant equation formulated through this table.
Table 4.33
Canonical Discriminant Function Coefficients
Function
1
Innovative Recruitment & Selection .997
Innovative Training & Development -.462
Innovative Performance Management .922
Innovative Compensation Management .190
Innovative Career Development .265
Innovative Employee Motivation .098
Innovative Employee Security .091
(Constant) -7.260
Discriminant equation for employee productivity will be:
Employee Productivity = 0.997 (Innovative Recruitment & Selection) -0.462 (Innovative
Training & Development) + 0.922 (Innovative Performance Management) +0.190
(Innovative Compensation Management) +0.265 (Innovative Career Development)
+0.098 (Innovative Employee Motivation) + 0.091 (Innovative Employee Security) -7.260
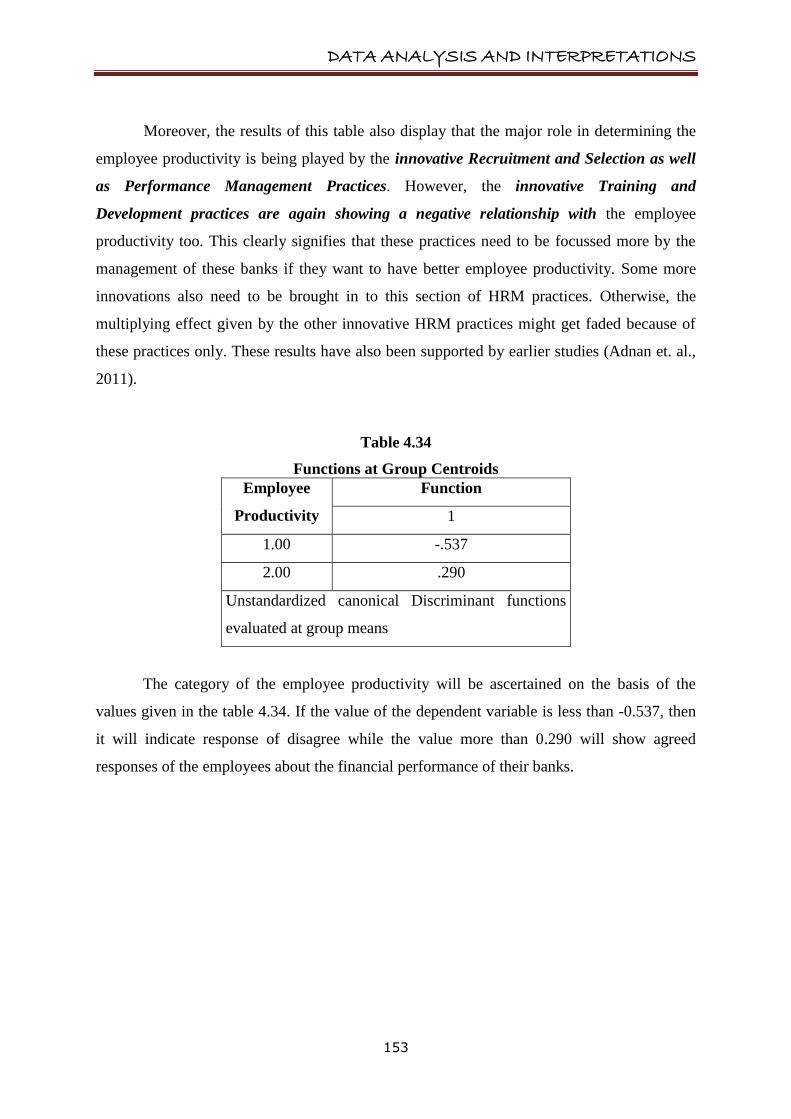
DATA ANALYSIS AND INTERPRETATIONS
153
Moreover, the results of this table also display that the major role in determining the
employee productivity is being played by the innovative Recruitment and Selection as well
as Performance Management Practices. However, the innovative Training and
Development practices are again showing a negative relationship with the employee
productivity too. This clearly signifies that these practices need to be focussed more by the
management of these banks if they want to have better employee productivity. Some more
innovations also need to be brought in to this section of HRM practices. Otherwise, the
multiplying effect given by the other innovative HRM practices might get faded because of
these practices only. These results have also been supported by earlier studies (Adnan et. al.,
2011).
Table 4.34
Functions at Group Centroids
Employee
Productivity
Function
1
1.00 -.537
2.00 .290
Unstandardized canonical Discriminant functions
evaluated at group means
The category of the employee productivity will be ascertained on the basis of the
values given in the table 4.34. If the value of the dependent variable is less than -0.537, then
it will indicate response of disagree while the value more than 0.290 will show agreed
responses of the employees about the financial performance of their banks.

DATA ANALYSIS AND INTERPRETATIONS
154
4.4 CHALLENGING AREAS OF THE INNVOATIVE HRM WHERE BANKS
ARE LAGGING BEHIND
In the research instrument, one open ended question was also asked from the
employees of the banks under the study. It was about any innovation they want in their
bank‟s HR policies which are not being implemented there. Through the content analysis of
the responses of this question and an in-depth analysis of the extent of implementation of
prevailing innovative HRM practices, following challenging areas were found where the
banks lag behind and need to improve upon:
a. In most of the banks, whether public or private, targets are being given to the
employees. But these targets become a pressure on the employees, when these are
unachievable. Therefore, the employees should not be pressurized for impossible
targets and the personal goals of every employee should be taken care of with the
organisational goals.
b. Some skits or other management games should be there in the banks so that the
personal grooming of the employees can be done. In the support of this innovative
area, the results of the present study also focus where the stress management
programs need to be arranged with a greater frequency.
c. The recruitment and selection of the employees need to be improved more. There
should be diversity in the selection of the employees so that they can work with more
effectiveness.
d. No doubt the banks are giving discounted loans to the employees. Yet the amount of
loans and advances to staff is very low and cannot cater to the need of the employees.
Thus it should be increased and some more perks should be provided to the staff.
e. The HR information system has been found to be faded in many banks. Therefore,
some more transparencies are needed in it to make the employees more comfortable
with the HR policies and strategies.
DATA ANALYSIS AND INTERPRETATIONS
155
f. There is a great need to provide appropriate and comfortable postings to employees
which will enhance the overall productivity. Normally, in the banking sector,
especially in the public sector banks, employees are transferred to other regions of the
country which creates lots of hurdles in their personal as well as the professional lives.
This calls for the nearby postings of the employees to make them work without any
anxiety and family pressures.
g. A few banks, particularly the private sector banks are not giving faster promotions.
This lowers down the morale of the employees. The employees should be motivated
more by way of faster promotions inside their banks.
h. Staff welfare related issues need to be redesigned in a new manner so as to persuade
the employees more and more.
i. Top management can‟t work effectively until and unless the participation from the
lower managers is welcome. Thus, synergies must be developed between the top
management and the lower level employees.
j. Continuous and effective training is also call for the day. Therefore, the banks need
to concentrate on this challenging area of the innovative HRM for their betterment.