darr (darroch analysis with rank-reduction): a method for
TRANSCRIPT
1Santa Cruz Laboratory Contribution Number 116
DARR (Darroch Analysis with Rank-Reduction):
A method for analysis of stratified mark-recapture data
from small populations, with application to estimating
abundance of smolts from outmigrant trap data1
Eric P. Bjorkstedt
National Marine Fisheries Service
Southwest Fisheries Science Center
Santa Cruz/Tiburon Laboratory
3150 Paradise Drive
Tiburon, CA 94920
27 July 2000
Administrative Report SC-00-02

ii
“This report is used to ensure prompt dissemination of preliminary results, interim report,
and special studies to the scientific community. The material is not ready for formal
publication since the paper may be published in a modified form to include more recent
information or research results. Abstracting, citing, or reproduction of this information is
not allowed. Contact author if additional information is required."
ii
Abstract Temporally-stratified mark-recapture experiments are commonly used to estimate
the abundance of smolts during their seaward migration. These designs support rigorous
estimation of the probability that an individual migrating past a trap during a given period
will be captured conditional on that individual migrating during that period. These
estimates allow one to account for temporal variation in capture probability when
expanding counts of unmarked fish to estimate abundance. In small, coastal watersheds,
limits on the number of fish that can be marked in small, often depleted, populations
hinder the use of mark-recapture techniques. Also, marked fish may substantially delay
further migration which spreads recaptures over time—thus exacerbating difficulties in
analysis arising from low numbers of marked fish. I propose algorithms to adapt
Darroch’s (1961) analysis for temporally-stratified mark-recapture data for application
under these conditions. These algorithms attempt to compensate for small sample sizes
by applying simple rules to aggregate the data in such a way that permits valid estimation
of capture and migration probabilities while retaining as much information on temporal
variability as possible. A software application that implements these algorithms and
Darroch’s analysis for stratified mark-recapture data may be downloaded from the Santa
Cruz Laboratory web site (http://www.pfeg.noaa.gov/tib/index.htm).
iii
Contents
Introduction ............................................................................................................... 1
Stratified mark-recapture experiments: design, data, and Darroch’s analysis .. 4
Difficulties specific to small populations and populations
in coastal watersheds ......................................................................... 7
Adapting Darroch’s (1961) analysis for small populations
using rank-reduction.......................................................................... 9
Introduction to DARR ............................................................................................ 12
Obtaining and installing DARR ................................................................. 12
How to use DARR ....................................................................................... 12
Literature Cited ....................................................................................................... 19
Appendix A: Darroch’s (1961) analysis for stratified mark-
recapture data .............................................................................................. 20
Appendix B: Pooling algorithm and implications for model
estimation ..................................................................................................... 22
1
Introduction Estimates of smolt abundance provide a measure of productivity of salmonid
populations in freshwater habitats (Bradford et al. 1997). In some cases, such estimates
provide the basis for prediction of future adult abundance; in others, such estimates may
provide crucial data for evaluating the viability of a depleted population. In either case,
rigorous methods are needed to estimate smolt abundance in small populations.
Smolt abundances are typically estimated by using mark-recapture techniques to
estimate total abundance from the number of fish trapped during their seaward migration.
In a simple mark-recapture experiment a portion of a population is marked and released,
the population is resampled and the number of marked and unmarked individuals in the
second sample is counted. The probability that an individual fish will be captured—the
so-called “efficiency” of the trap—is estimated as the proportion of marked fish that are
recaptured, and the reciprocal of capture probability is used to expand the count of
unmarked individuals captured into an estimate of total abundance (cf. Seber 1982).
Analysis of data from mark-recapture experiments requires the following assumptions: 1)
marked and unmarked fish are well-mixed; 2) all individuals exposed to capture at a
given time have equal probability of being captured; 3) marks are not lost—that is, marks
are retained for the duration of the experiment; 4) marked individuals are unambiguously
identified; and 5) marked individuals experience negligible (or known) mortality.
Typically, outmigrating smolts are trapped as they migrate past a specific
location, so that captures are distributed over time. The probability that a smolt will be
captured is likely to vary over time as a function of changes in flow conditions, smolt
characteristics, time of year, or changes in trap operation (Schwarz and Dempson 1994,
Polos 1997). Temporally stratified mark-recapture designs allow researchers to account
for possible variation in capture probability.1 In a temporally stratified mark-recapture
1 Mark-recapture experiments may also be stratified in space. In a simple spatially stratified mark-
recapture experiment, individuals are marked and released at numerous locations and recaptured during one
subsequent resampling effort. Location-specific marks are used so that recaptured individuals may be
identified by location of release and location of recapture. The analysis discussed here is equally
applicable to temporally or spatially stratified mark-recapture data.
2
experiment, all individuals released during each of a series of non-overlapping periods2
(strata) bear the same distinct mark, so that upon recapture a marked individual can be
identified by the period during which it was released and period during which it was
recaptured. The resulting data allow estimation of 1) the probability that a marked
individual will be recaptured during a given period; and 2) the probability that an
individual released during a given period will be susceptible to capture during a given,
and possibly different, period. The importance of estimating both of these probabilities
will be discussed in greater detail below.
Methods for collecting and analyzing data from stratified mark-recapture
experiments have been reported in the literature and in many cases have been developed
to address the very problem of estimating smolt abundance. Some studies have used a
single type of mark throughout the sampling season and thus do not meet the
methodological requirements for fully resolving temporal structure in the mark-recapture
process. Such protocols require very restrictive assumptions, a “correction” for estimated
delays in resumed migration prior to analysis (Thedinga et al. 1994) or designs that
include a large reduction in temporal resolution of estimated capture probabilities to
ensure that groups of marked fish are indeed distinct (Carlson et al. 1998).
Other studies have collected stratified mark-recapture data at daily time scales. In
a study that is particularly germane to the work presented here, Dempson and Stansbury
(1991) applied the analysis derived by Darroch (1961) to data collected for a population
of Atlantic salmon (Salmo salar) and found that abundance estimates depend slightly on
how the data were pooled into larger strata before analysis. Schwarz and Dempson
(1994) attempt to avoid the issue of pooling data, which implicitly assumes that constant
conditions prevail over the length of any pooled period, by developing a model that
allows estimation of daily capture probabilities. To do so, they incorporate a separate
model to estimate and account for the interval between the time of release for fish marked
at an upstream trap and their arrival at a downstream trap. A benefit of this approach is
the ability to incorporate external variables, such as flow or water temperature, that may
2 In many cases, sampling periods correspond to weekly changes in the mark applied to newly captured
fish; however, sampling periods may be of any length, and do not all need to be the same length.
3
affect migration rates. In many ways, the latter analysis was similar to that developed by
MacDonald and Smith (1980) for estimating the abundance of smolts from daily mark-
recapture data from large population of sockeye salmon (Oncorhynchus nerka).
Derivation and analysis of the models reviewed in the previous paragraph depend
on approximations or assumptions that are strongly justified only for large sample sizes.
Statistical analysis of mark-recapture data collected in small populations is often
problematic because the contribution of sampling error in the data tends to be large for
small sample sizes. For example, mark-recapture experiments in small populations are
especially susceptible to the bane of all mark-recapture experiments: zero recaptures,
which leads to an estimate of infinite abundance. Temporally stratified designs further
contribute to small sample sizes by partitioning the population of marked fish among
distinct periods. Also, in some populations, particularly populations of coho salmon
(Oncorhynchus kisutch) and steelhead (O. mykiss) in coastal watersheds, marked fish
may delay resumption of downstream migration after release for four or more weeks3.
Such behaviors may exacerbate the effects of small sample sizes by spreading recaptures
from a group of marked fish over a time interval that may span multiple sampling
periods.
Given the necessity of estimating abundance in small salmonid populations, the
development of ways to adapt mark-recapture techniques to small populations is
extremely relevant. The first part of this paper proposes an approach to adapting
Darroch’s (1961) analysis for application to stratified mark-recapture data collected for a
small population. The proposed method comprises a series of algorithms that combine
strata to reduce the rank of the data. The method attempts to do so sufficiently to allow
estimation of valid capture probabilities while retaining as much of the information
contained in the data as possible. The second part of this paper is intended as a users’
manual for the accompanying software package (Darroch Analysis with Rank Reduction,
DARR version 1.0) which implements the analysis described below. A manuscript is in
3 Personal communications from Chris Howard, Simpson Timber Company, P.O.Box 68, Korbel, CA 95550 and Sean Gallagher, California Department of Fish and Game, 1031 S. Main, Suite A, Fort Bragg, CA 95437

4
preparation that develops the material presented here in a more rigorous fashion and
includes evaluation of the analytical method’s performance (Bjorkstedt in prep.).
Stratified mark-recapture experiments: design, data and Darroch’s analysis
Recall that in a temporally stratified mark-recapture experiment, recaptured fish
are identifiable 1) by the period in which they were marked and released4 and 2) by the
period in which they were recaptured. The data collected during such an experiment may
be arranged as
=
=
=
kk
k
k
kk r
rrrrr
m
mm
c
cc
�
��
�
�
��
0000
0,, 222
11211
2
1
2
1
Rmc (1)
where the jc are the numbers of new (unmarked) fish captured in each of k periods, the
im are the numbers of marked fish that are released during each period, and the ][ ijr=R
are the numbers of marked fish released during period i that are recaptured during period
j 5.
The probability that an individual marked and released during one period (say, the
ith period) will be recaptured during that or a later period (the jth period) is the joint
probability that 1) an individual released during period i will resume migration and be
susceptible to capture during period j (migration probability, ijθ ); and 2) that a fish will be
captured, given that it is susceptible to capture during period j (capture probability, jp ).
4 Assuming that unique marks are used for each mark group. Failing to do so does not change the
underlying structure of the data but has important implications for how the mark-recapture process is
perceived by the experimenter and analyst. For example, if a single type of mark is used, so that recaptured
fish can not be differentiated by the period in which they were released, any structure that exists above the
main diagonal of R is not observable. In this case, R has entries along the main diagonal that represent all
marked fish captured during each period (i.e., ∑= i ijjj rr ) and zeros elsewhere. 5 In contrast to temporally stratified data sets, recapture data collected with a spatially stratified design may
have non-zero entries below the main diagonal, as individuals are not restricted in the direction of
migration.
5
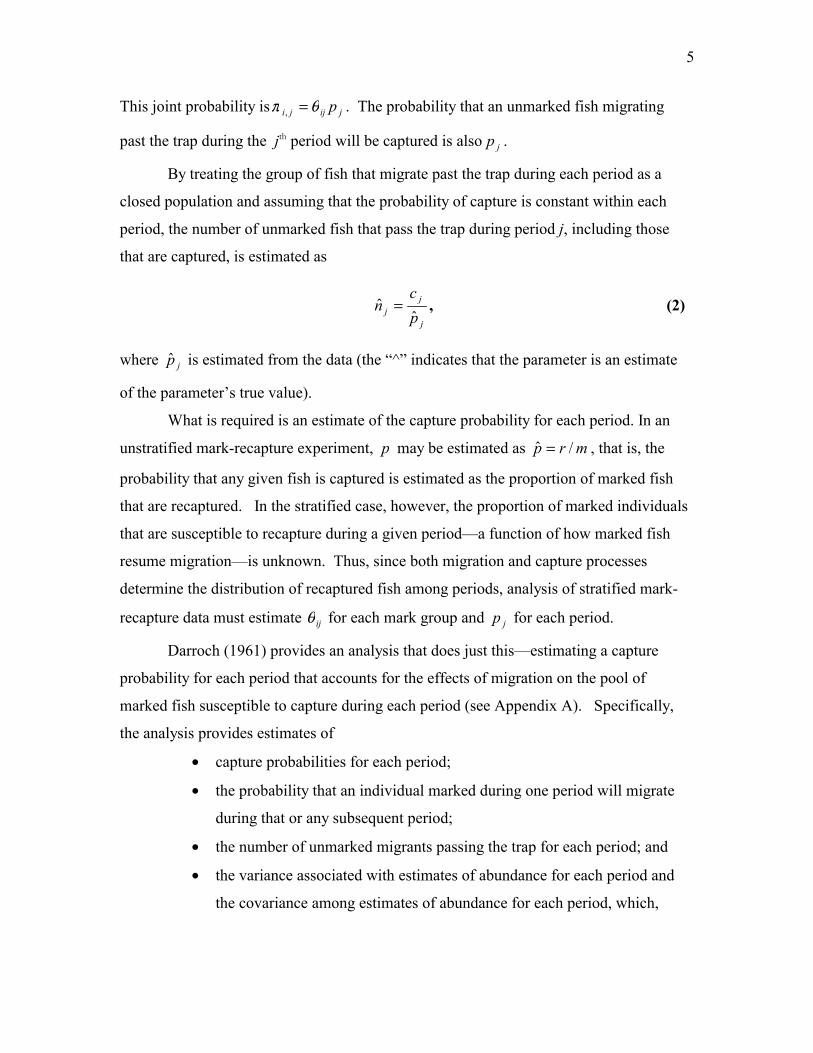
This joint probability is jijji pθπ =, . The probability that an unmarked fish migrating
past the trap during the jth period will be captured is also jp .
By treating the group of fish that migrate past the trap during each period as a
closed population and assuming that the probability of capture is constant within each
period, the number of unmarked fish that pass the trap during period j, including those
that are captured, is estimated as
j
jj p
cn
ˆˆ = , (2)
where jp is estimated from the data (the “^” indicates that the parameter is an estimate
of the parameter’s true value).
What is required is an estimate of the capture probability for each period. In an
unstratified mark-recapture experiment, p may be estimated as mrp /ˆ = , that is, the
probability that any given fish is captured is estimated as the proportion of marked fish
that are recaptured. In the stratified case, however, the proportion of marked individuals
that are susceptible to recapture during a given period—a function of how marked fish
resume migration—is unknown. Thus, since both migration and capture processes
determine the distribution of recaptured fish among periods, analysis of stratified mark-
recapture data must estimate ijθ for each mark group and jp for each period.
Darroch (1961) provides an analysis that does just this—estimating a capture
probability for each period that accounts for the effects of migration on the pool of
marked fish susceptible to capture during each period (see Appendix A). Specifically,
the analysis provides estimates of
• capture probabilities for each period;
• the probability that an individual marked during one period will migrate
during that or any subsequent period;
• the number of unmarked migrants passing the trap for each period; and
• the variance associated with estimates of abundance for each period and
the covariance among estimates of abundance for each period, which,
6
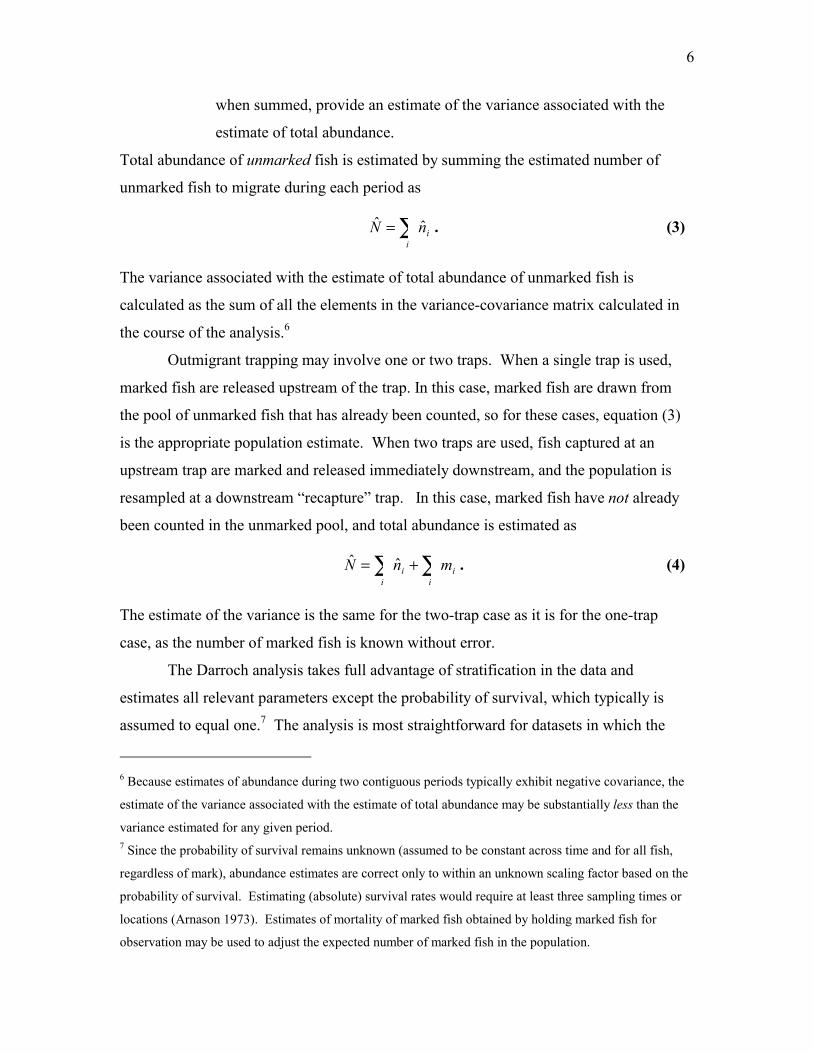
when summed, provide an estimate of the variance associated with the
estimate of total abundance.
Total abundance of unmarked fish is estimated by summing the estimated number of
unmarked fish to migrate during each period as
∑=i
inN ˆˆ . (3)
The variance associated with the estimate of total abundance of unmarked fish is
calculated as the sum of all the elements in the variance-covariance matrix calculated in
the course of the analysis.6
Outmigrant trapping may involve one or two traps. When a single trap is used,
marked fish are released upstream of the trap. In this case, marked fish are drawn from
the pool of unmarked fish that has already been counted, so for these cases, equation (3)
is the appropriate population estimate. When two traps are used, fish captured at an
upstream trap are marked and released immediately downstream, and the population is
resampled at a downstream “recapture” trap. In this case, marked fish have not already
been counted in the unmarked pool, and total abundance is estimated as
∑∑ +=i
ii
i mnN ˆˆ . (4)
The estimate of the variance is the same for the two-trap case as it is for the one-trap
case, as the number of marked fish is known without error.
The Darroch analysis takes full advantage of stratification in the data and
estimates all relevant parameters except the probability of survival, which typically is
assumed to equal one.7 The analysis is most straightforward for datasets in which the
6 Because estimates of abundance during two contiguous periods typically exhibit negative covariance, the
estimate of the variance associated with the estimate of total abundance may be substantially less than the
variance estimated for any given period. 7 Since the probability of survival remains unknown (assumed to be constant across time and for all fish,
regardless of mark), abundance estimates are correct only to within an unknown scaling factor based on the
probability of survival. Estimating (absolute) survival rates would require at least three sampling times or
locations (Arnason 1973). Estimates of mortality of marked fish obtained by holding marked fish for
observation may be used to adjust the expected number of marked fish in the population.
7
number of release strata equals that of capture strata so that the recapture matrix is square
( nn × ) and vectors of marked and captured fish are each n elements long, as in (1).8
Difficulties specific to small populations and populations in coastal watersheds
As for other mark-recapture analysis, Darroch’s method of analysis is based on
assumptions that are consistently met only for large sample sizes and may yield imprecise
or implausible9 estimates--or fail completely—when data include features commonly
observed when populations or sample sizes are small. As a minimum condition for use,
Darroch’s (1961) analysis requires that at least some marked individuals will resume
migration and be susceptible to recapture during the same period in which they were
released (i.e., 0≠iiθ , for all i). In a practical sense, this is known to be true if at least
one “immediate”10 recapture—an individual recaptured during the period in which it was
released—is observed for each mark group so that there are no zeros along the main
diagonal of R (that is, R is a non-singular matrix). Importantly, precision of estimates
improves and the sensitivity of the analysis to error in the data decreases as the
proportion of immediate recaptures increases (Darroch 1961).
The likelihood that random processes yield no (or very few) immediate recaptures
during a given period is inversely related to the number of marked fish that resume
migration during that period. Low numbers of marked fish susceptible to capture may
reflect low numbers of marked fish, especially near the beginning or end of the smolt run
or low probability that marked fish resume migration quickly. Low numbers of fish
susceptible to immediate recapture may occur simply due to synchronization between the
8 Darroch (1961) also provides more general theory for analyzing datasets with unequal numbers of release
strata and recapture strata. Such an analysis may be useful if, for example, survival of marked fish differs
substantially among distinct periods, each of which spans multiple contiguous periods. 9 Occasionally, error in the data may be sufficient to result in estimates of capture or migration probabilities
greater than one or less than zero. Assuming that violation of model assumptions is not to blame, such
implausible estimates arise from attempting to fit the model subject to constraints imposed by the data (e.g.,
fixed marginal distributions of recaptured individuals) and assumptions (e.g., that all fish migrating during
a given period experience the same probability of capture, regardless of mark group) when observations
from various mark-groups depart strongly from expected values due to sampling error. 10 “Immediate” in the temporally stratified context translates to “local” in the spatially stratified context.
8
development of marked populations over time and the stratification scheme imposed on
the system. For example, if most marked fish in a group are released early in a period,
and marked fish quickly resume migration, most individuals will be susceptible to
recapture during the period in which they were released. Conversely, if most marked fish
are released late in a period, or if marked fish delay migration for long periods, many,
perhaps most, individuals will be susceptible to recapture only during later periods.
Sample size issues also arise in the trade-off between temporal resolution
(duration of periods) and population size. Shorter periods allow greater resolution of
temporal variability in capture probability, and may be more likely to meet the
assumption that capture probability during a given period is constant. However, shorter
periods increase the likelihood that sample sizes in each period will be too small to
support precise estimates of capture and remigration probabilities, since fewer fish are
available for marking and recapture during each period11. This possibility especially
applies in small populations, which are likely to exhibit greater variation in the number of
migrants per day relative to the mean than are larger populations. Indeed, days on which
very few or no fish migrate are more likely in small populations than in large populations,
and fewer fish overall are expected to migrate on any given day.
As noted above, it is possible for Darroch’s analysis to yield implausible results.
For instance, attempting to fit the model subject to constraints imposed by the data (e.g.,
fixed marginal distributions of recaptured individuals) and assumptions (e.g., that all fish
migrating during a given period experience the same probability of capture, regardless of
mark group) may result in estimates of capture or migration probabilities greater than one
or less than zero. If violation of model assumptions is not to blame, then such results may
simply be a consequence of sampling error, which is expected to have a relatively greater
effect in small populations.
One way in which model assumptions may be violated is through releasing a new
group of fish that bear a previously used mark before all fish from the initial group
bearing that mark have resumed downstream migration. If this occurs, recaptures during
11 Stratified mark-recapture experiments using periods as short as one day have been used to estimate
abundance for large populations, such as runs of sockeye smolts that may exhibit peak daily runs in excess
of a million fish (e.g., Macdonald and Smith 1980).

9
one period may include individuals from the previous group to bear the same mark. In
extreme cases, it is possible for the number of recaptures attributed to a group to exceed
the number of marked individuals released in a group. Of course, in many real-world
applications that use a suite of marks, the effects of such spillover are likely to be minor
and very difficult to detect. In small coastal watersheds, however, some marked
individuals may not resume migration for periods longer than 4 weeks and capture
probabilities can exceed 70% for sustained periods, which may lead to violation of the
assumption that each mark group is independent of all other mark groups. In
experiments in which a single type of mark is applied to all fish released, recaptured fish
can not be differentiated by the period in which they were released. In the analysis of
such data it is difficult or impossible to determine the appropriate pool of marked fish to
use in estimating capture probabilities rigorously, and the analysis requires either the
restrictive assumption that all individuals recaptured during a given period are drawn
from the pool of individuals marked and released during that period, or adjustment of the
pool of marked fish by the analyst (cf. Thedinga et al. 1994). Experimental protocols
designed to ensure estimates of capture probability are not jeopardized by mixing of
marked fish released at different times by spacing releases widely (cf. Carlson et al.
1998) may use a single type of mark but incur the cost of much-reduced temporal
resolution of variability in capture probabilities. To take full advantage of stratified
mark-recapture designs and analysis, it is important to use a suite of unique marks
sufficient to minimize the potential for mixing of mark-groups during recapture.
Adapting Darroch’s (1961) analysis for small populations using rank-reduction
For many stratified mark-recapture datasets from small populations, direct
application of Darroch’s analysis may be impossible or ill advised due to high sensitivity
to error in the data. In many cases, however, it is possible to eliminate problematic
structures in the data by combining the strata that contain such structure with neighboring
strata, thereby reducing the rank12 of the data and producing a dataset amenable to
analysis. Reducing the rank of mark-recapture data by one involves combining columns
12 The rank of the data set is the number of linearly independent rows in the data.

10
and rows of R to convert an nn × matrix to an )1()1( −×− nn matrix and similarly
combining data in m and c to reduce these vectors from n to (n –1) elements.13
Iterating this process a sufficient number of times results in an unstratified dataset but
loses any information on temporal variation in capture probability contained in the
original data. In an attempt to retain as much of the information contained in the data as
possible, the method described below reduces the rank of stratified mark-recapture data
only as much as necessary to generate a dataset suitable for analysis.14
Choosing strata for “elimination” and iteratively reducing the rank of the data to
the degree necessary for analysis is accomplished by executing a sequence of three
algorithms to identify and adjust for strata that contain structures that hinder analysis.
First, all periods during which no immediate recaptures occur are pooled so that the
dataset satisfies the requirement that no zeros occur along the main diagonal of R. Of
course, sampling periods in which no marked fish are released and no fish are captured
may be excluded a priori from the dataset for the purposes of estimating abundance.
Second, the condition number15 of the recapture matrix is used to determine whether the
data include observations, such as strata with few immediate recaptures, that are likely to
compromise the accuracy and precision of the abundance estimate due to sensitivity of
the analysis to random error contained in such observations. If the condition of the
13 See Appendix B for discussion of the algorithm for combining strata and the implications for the
structure and assumptions of the model that is estimated from rank-reduced data. 14 The rank-reduction approach contrasts with analyses that determine which strata may be pooled a priori
through the use of goodness-of-fit tests to evaluate similarity in catch ratios among contiguous strata (cf.
Darroch 1961). In these cases, strata are combined only when the data support the hypothesis that the
underlying capture probabilities are similar between contiguous strata such that pooling data is consistent
with the original model. 15 The condition number of a matrix measures the sensitivity of the solution of a system of linear equations
described by the matrix to error in the data. The condition number provides an indication of the accuracy
of solutions involving matrix inversion. A small value indicates well-conditioned matrix for which
solutions are expected to be insensitive to error.
11
recapture matrix exceeds a threshold (here set at 20)16, condition is calculated for each
possible recapture matrix for which one period has been pooled and the case that yields
the minimum condition is retained. This algorithm is iterated until the condition
threshold is no longer exceeded. Third, the rank-reduced data are analyzed using
Darroch’s analysis, and the period for which the estimated capture probability falls the
farthest outside the interval from zero to one, if any such periods exist, is pooled with the
appropriate contiguous period. This algorithm is iterated until all capture probabilities
fall between zero and one, and the resulting, fully reduced data are retained for final
analysis.
Reducing the rank of mark-recapture data by combining strata has important
implications for the model that is fitted to the data and the set of assumptions required in
the analysis. For example, when data in two (or more) periods are pooled, the
assumption that capture probability is constant over the new (pooled) period overrides the
initial assumption that capture probabilities are constant during each individual period.
In a sense, reducing the rank of mark-recapture data leads to fitting ever simpler models,
with increasingly restrictive assumptions, to the data. The algorithms discussed above
attempt to do so to the minimum degree possible so as to retain as much information as
possible.
16 A threshold of 20 was selected in an attempt to maximize the total number of strata retained in the
analysis, while minimizing the number of strata that passed this criterion and yet were combined in the
subsequent step that used implausible results as the criterion for selecting strata for pooling.

12
Introduction to DARR DARR (Darroch Analysis with Rank Reduction) is a software application that
implements the algorithms and analysis described in this paper to stratified mark-
recapture data sets. The software was developed in MATLAB 5.3 (The MathWorks, Inc.
http://www.mathworks.com) and compiled into a standalone application for PC (32-bit
MS-DOS console application) using the MATLAB C/C++ Compiler Suite 2.0.2 and
Microsoft Visual C++ 6.0.
Obtaining and installing DARR
The latest version of DARR may be downloaded from the Santa Cruz/Tiburon
Laboratory web page at http://www.pfeg.noaa.gov/tib/index.htm. To install DARR, run
the self-extracting file (DARR_v1.0_zip.exe), and follow the prompts to choose (or
create) a folder where DARR will reside (it is not necessary to install DARR in the folder
in which mark-recapture data are stored). Running the self-extracting file loads the
DARR program (DARR_v1.0.exe), a suite of dynamically linked libraries (*.dll files), an
example data set in both Excel (“ExampleData.xls”) and text (“ExampleData.txt”) form.
No changes are made to the operating system’s registry, and uninstalling DARR is as
simple as deleting the installed files—for this reason it may be preferable to install
DARR in a folder separate from the mark-recapture data.
How to use DARR
Running DARR
Running DARR is as simple as clicking on the icon, or running the executable file
from “Run” on the Windows Toolbar. This will invoke an MS-DOS console window17
and immediately open an information/disclaimer window . Clicking on “OK” invokes
the DARR workspace (Figure 1).
17 Any messages returned from the program (including errors) will be displayed in this window, but for the
most part, this window may be ignored.
13
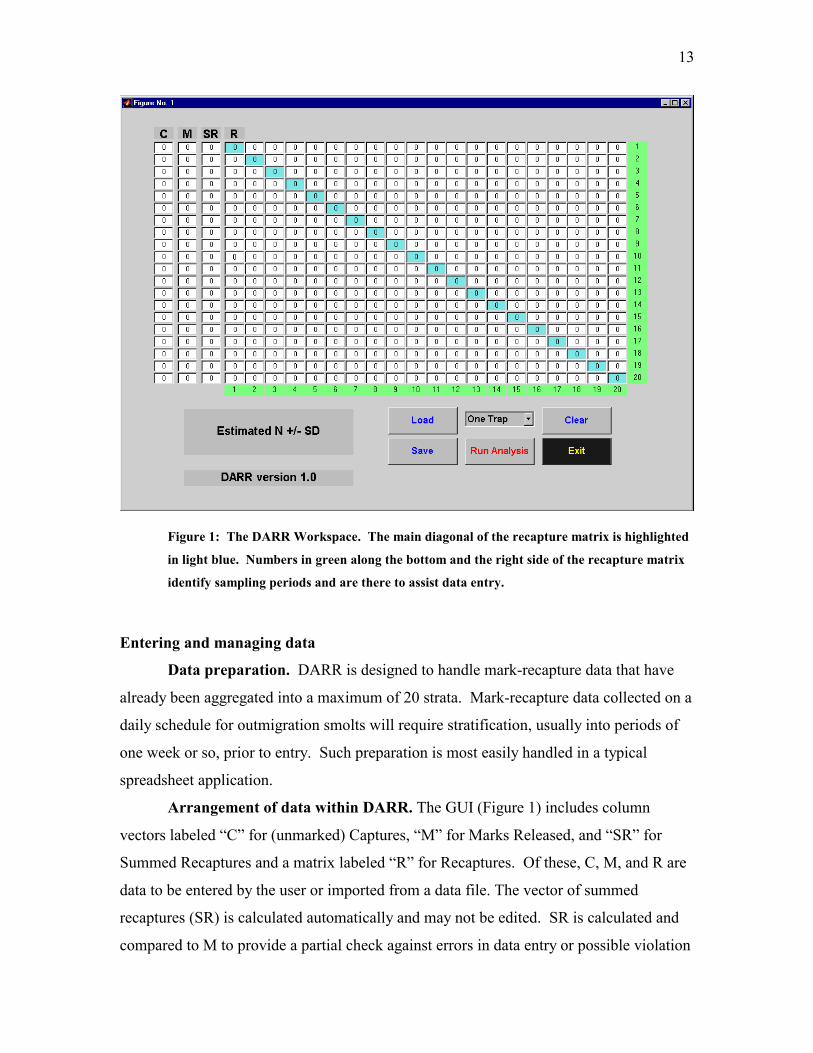
Figure 1: The DARR Workspace. The main diagonal of the recapture matrix is highlighted
in light blue. Numbers in green along the bottom and the right side of the recapture matrix
identify sampling periods and are there to assist data entry.
Entering and managing data
Data preparation. DARR is designed to handle mark-recapture data that have
already been aggregated into a maximum of 20 strata. Mark-recapture data collected on a
daily schedule for outmigration smolts will require stratification, usually into periods of
one week or so, prior to entry. Such preparation is most easily handled in a typical
spreadsheet application.
Arrangement of data within DARR. The GUI (Figure 1) includes column
vectors labeled “C” for (unmarked) Captures, “M” for Marks Released, and “SR” for
Summed Recaptures and a matrix labeled “R” for Recaptures. Of these, C, M, and R are
data to be entered by the user or imported from a data file. The vector of summed
recaptures (SR) is calculated automatically and may not be edited. SR is calculated and
compared to M to provide a partial check against errors in data entry or possible violation
14
of the assumption that mark groups do not include individuals from previous groups
bearing the same mark. If the total number of recaptures for a given mark group exceeds
the number of marked individuals released in that group, the appropriate element in SR
will turn bold and red as a warning.
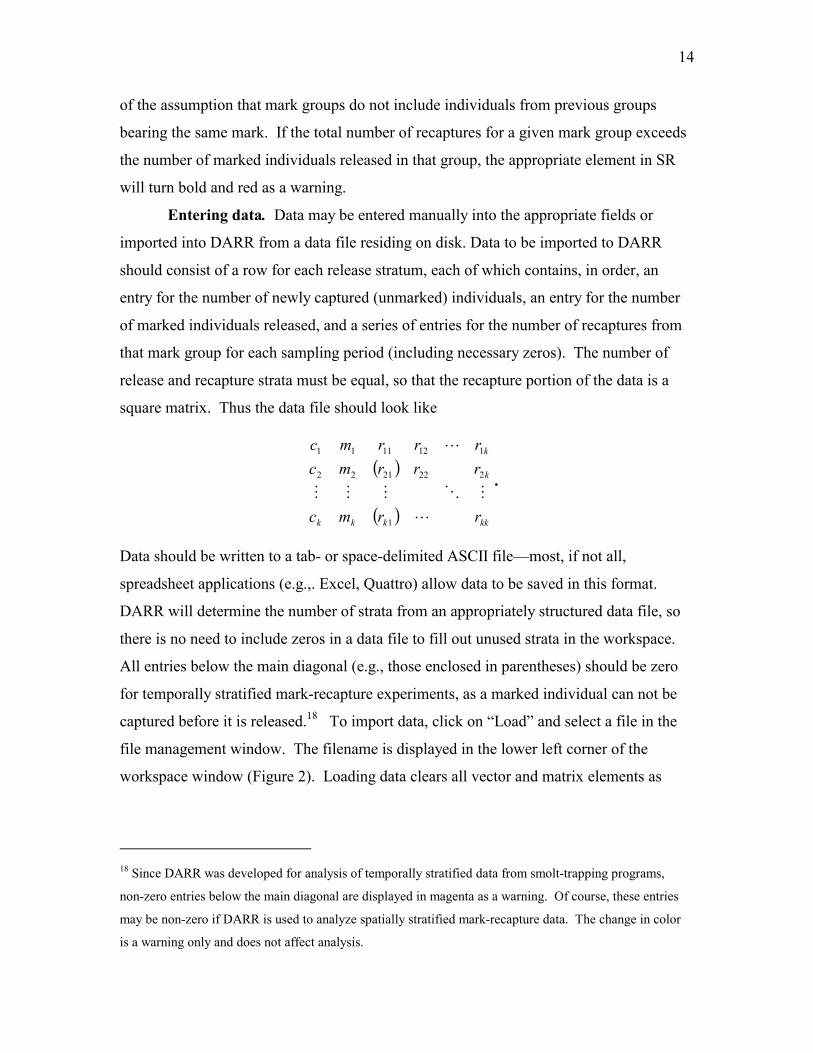
Entering data. Data may be entered manually into the appropriate fields or
imported into DARR from a data file residing on disk. Data to be imported to DARR
should consist of a row for each release stratum, each of which contains, in order, an
entry for the number of newly captured (unmarked) individuals, an entry for the number
of marked individuals released, and a series of entries for the number of recaptures from
that mark group for each sampling period (including necessary zeros). The number of
release and recapture strata must be equal, so that the recapture portion of the data is a
square matrix. Thus the data file should look like
( )
( ) kkkkk
k
k
rrmc
rrrmcrrrmc
�
�����
�
1
2222122
1121111
.
Data should be written to a tab- or space-delimited ASCII file—most, if not all,
spreadsheet applications (e.g.,. Excel, Quattro) allow data to be saved in this format.
DARR will determine the number of strata from an appropriately structured data file, so
there is no need to include zeros in a data file to fill out unused strata in the workspace.
All entries below the main diagonal (e.g., those enclosed in parentheses) should be zero
for temporally stratified mark-recapture experiments, as a marked individual can not be
captured before it is released.18 To import data, click on “Load” and select a file in the
file management window. The filename is displayed in the lower left corner of the
workspace window (Figure 2). Loading data clears all vector and matrix elements as
18 Since DARR was developed for analysis of temporally stratified data from smolt-trapping programs,
non-zero entries below the main diagonal are displayed in magenta as a warning. Of course, these entries
may be non-zero if DARR is used to analyze spatially stratified mark-recapture data. The change in color
is a warning only and does not affect analysis.
15
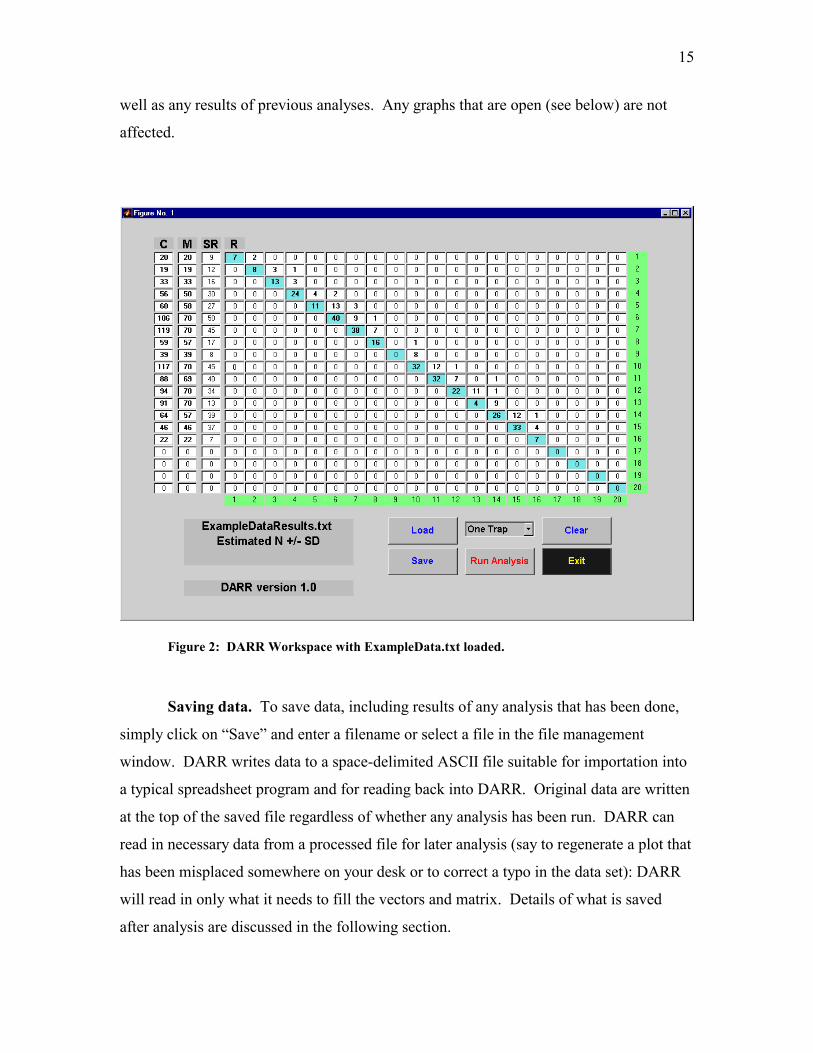
well as any results of previous analyses. Any graphs that are open (see below) are not
affected.
Figure 2: DARR Workspace with ExampleData.txt loaded.
Saving data. To save data, including results of any analysis that has been done,
simply click on “Save” and enter a filename or select a file in the file management
window. DARR writes data to a space-delimited ASCII file suitable for importation into
a typical spreadsheet program and for reading back into DARR. Original data are written
at the top of the saved file regardless of whether any analysis has been run. DARR can
read in necessary data from a processed file for later analysis (say to regenerate a plot that
has been misplaced somewhere on your desk or to correct a typo in the data set): DARR
will read in only what it needs to fill the vectors and matrix. Details of what is saved
after analysis are discussed in the following section.
16
Running analysis and generating output
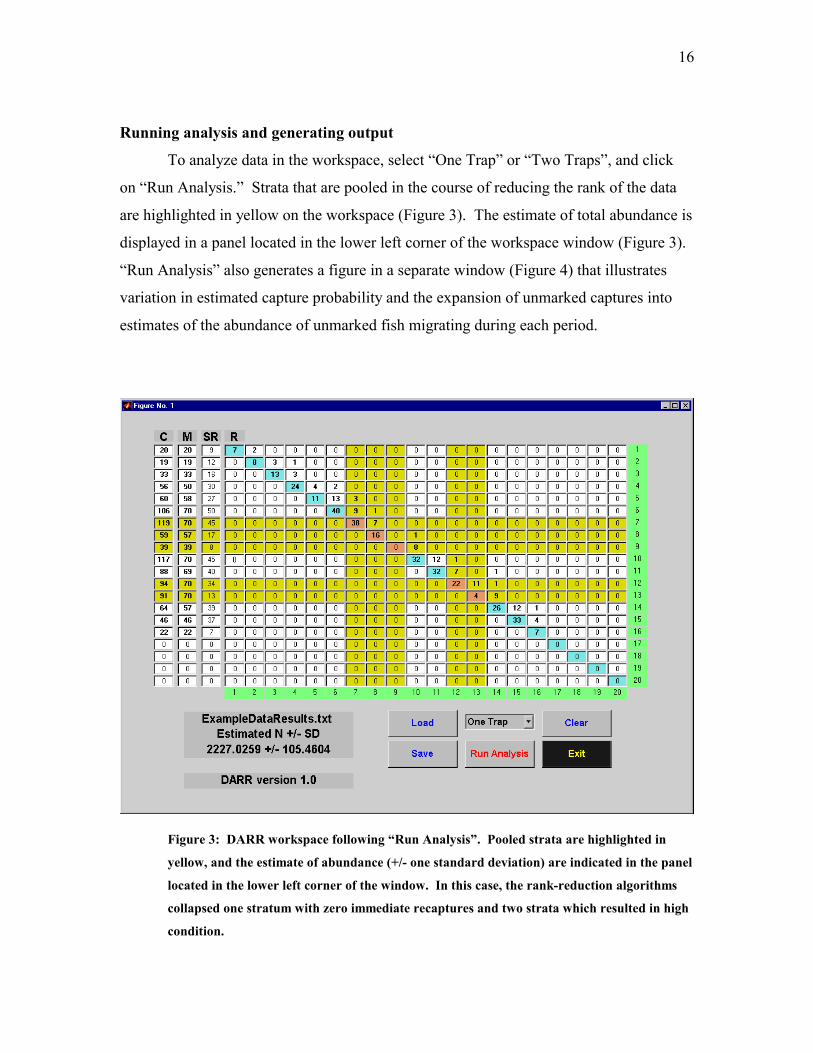
To analyze data in the workspace, select “One Trap” or “Two Traps”, and click
on “Run Analysis.” Strata that are pooled in the course of reducing the rank of the data
are highlighted in yellow on the workspace (Figure 3). The estimate of total abundance is
displayed in a panel located in the lower left corner of the workspace window (Figure 3).
“Run Analysis” also generates a figure in a separate window (Figure 4) that illustrates
variation in estimated capture probability and the expansion of unmarked captures into
estimates of the abundance of unmarked fish migrating during each period.
Figure 3: DARR workspace following “Run Analysis”. Pooled strata are highlighted in
yellow, and the estimate of abundance (+/- one standard deviation) are indicated in the panel
located in the lower left corner of the window. In this case, the rank-reduction algorithms
collapsed one stratum with zero immediate recaptures and two strata which resulted in high
condition.
17
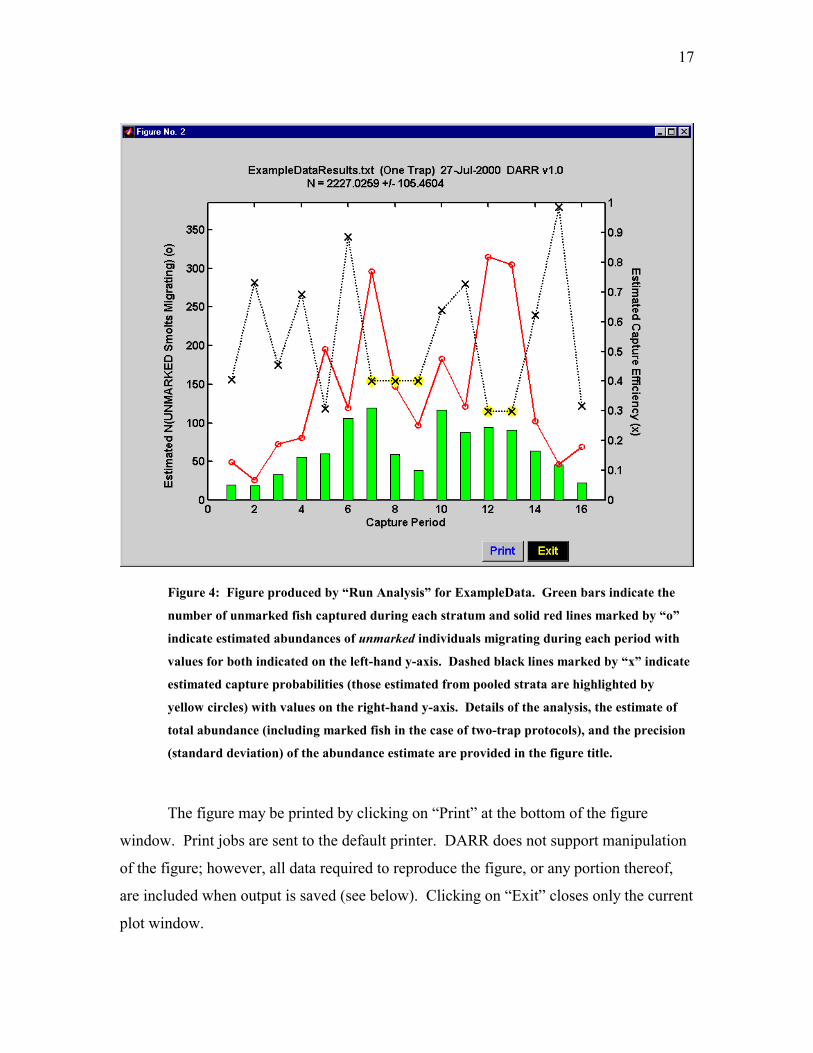
Figure 4: Figure produced by “Run Analysis” for ExampleData. Green bars indicate the
number of unmarked fish captured during each stratum and solid red lines marked by “o”
indicate estimated abundances of unmarked individuals migrating during each period with
values for both indicated on the left-hand y-axis. Dashed black lines marked by “x” indicate
estimated capture probabilities (those estimated from pooled strata are highlighted by
yellow circles) with values on the right-hand y-axis. Details of the analysis, the estimate of
total abundance (including marked fish in the case of two-trap protocols), and the precision
(standard deviation) of the abundance estimate are provided in the figure title.
The figure may be printed by clicking on “Print” at the bottom of the figure
window. Print jobs are sent to the default printer. DARR does not support manipulation
of the figure; however, all data required to reproduce the figure, or any portion thereof,
are included when output is saved (see below). Clicking on “Exit” closes only the current
plot window.

18
Numerous tidbits of information calculated in the course of analysis are included
when data are subsequently saved. These tidbits are (in the order in which they are
appended to the original data):
• the estimate of total abundance and standard deviation;
• estimated abundances and variances for each pooled stratum and the
number of original strata pooled into each remaining stratum;
• estimated abundance for each original stratum;
• the final rank-reduced data set, preceded by the number of original strata
pooled into each remaining stratum;
• capture probabilities for each pooled stratum;
• estimated remigration probabilities for the pooled strata;
• the variance-covariance matrix for estimates of abundance for each
stratum; and
• the data displayed in the figure in a tabular form suitable for reproducing
the plot using typical graphing applications.
The extended data file is formatted to allow easy importation into a typical spreadsheet as
a space-delimited ASCII file.
Printing data and results is best accomplished after importing saved data files into
a spreadsheet and formatting the data for easy reading. To print the workspace itself,
save an image of the workspace to the Windows Clipboard by 1) clicking on the
workspace to bring it forward and make it the active window, and 2) pressing Alt-[Print
Screen], and then paste the image (Ctrl-v) into a word processing or spreadsheet
application and follow that application’s printing instructions.
Clearing the workspace
Clicking on “Clear” will erase all data in the workspace. Figure windows are not
affected.
Exiting
Clicking on “Exit” will exit the workspace and automatically close all open
Figure windows and the MS-DOS window.
19
Literature Cited Arnason, A.N. (1973) The estimation of population size, migration rates and survival in a
stratified population. Researches on Population Ecology 15: 1-8.
Bradford, M.J, Taylor, G.C., Allan, J.A. (1997) Empirical review of coho salmon smolt
abundance and the prediction of smolt production at the regional level. Trans.
Am. Fish. Soc. 126: 49-64.
Carlson, S.R., Coggins Jr., L.G., Swanton, C.O. (1998) A simple stratified design for
mark-recapture estimation of salmon smolt abundance. Alaska Fishery Research
Bulletin. 5(2): 88-102.
Darroch, J.N. (1961) The two-sample capture-recapture census when tagging and
sampling are stratified. Biometrika 48: 241-260.
Dempson, J.N., Stansbury, D.E. (1991) Using partial counting fences and a two-sample
stratified design for mark-recapture estimation of an Atlantic salmon smolt
population. N. Am. J. Fish. Man. 11: 27-37.
MacDonald, P.D.M., Smith, H.D. (1980) Mark-recapture estimation of salmon smolt
runs. Biometrics 36: 401-417.
Polos, J.C. (1997) Estimation of the number of juvenile chinook salmon (Oncorhynchus
tshawytscha) migrating downstream from Blue Creek, California, 1989-1992.
M.S. Thesis. Humboldt State University. 105 pp.
Schwarz, C.J., Dempson, J.B. (1994) Mark-recapture estimation of a salmon smolt
population. Biometrics 50: 98-108.
Seber, G.A.F. (1982) The estimation of animal abundance and related parameters, 2nd
Edition. London: Griffith.
Thedinga, J.F., Murphy, M.L., Johnson, S.W., Lorenz, J.M., Koski, K.V. (1994)
Determination of smolt yield with rotary-screw traps in the Situk River, Alaska, to
predict effects of glacial flooding. North American Journal of Fisheries
Management 14: 837-851.

20
Appendix A: Darroch’s (1961) analysis for stratified mark-
recapture data This appendix provides a brief review of the calculations used to estimate
abundance from stratified mark-recapture data derived by Darroch (1961), expressed in
matrix notation following Seber (1982).
Darroch derived the analysis below by applying maximum likelihood to the
model which underlies data of the form (1)
( )
( )jjj
ijii
pncm, Binomial~
, lMultinomia~ πr (A.1)
where ir is the ith row of R and is assumed independent of other ir , im is the number of
marked fish released in the ith period, ijjji p θπ =, is the joint probability that a fish
marked in the ith period will migrate again past the trap during the jth period (with
probability ijθ ) and will be captured (with probability jp ), and jn is the total number of
unmarked fish that migrated past the trap during the jth period. This formulation
implicitly assumes complete survival across strata such that 1=∑ j ijθ , i.e., all marked
fish eventually migrate successfully.
For the simple case in which the recapture matrix is square, reciprocals of capture
probabilities, jj p/1=ρ are estimated as
mRρ 1ˆ −= , (A.2)
where 1−R is the matrix inverse of the recapture matrix. As in (3), the reciprocal of
estimated capture probability is used to expand counts of unmarked fish to estimates of
total abundance. Thus,
ρDn c ˆˆ = (A.3)
where jn are the estimated numbers of unmarked smolts to migrate past the trap in the jth
period, and xD indicates a matrix with elements x (in this case, c) arranged along the
diagonal and zeros elsewhere. Total abundance is then estimated as described in the text.
21
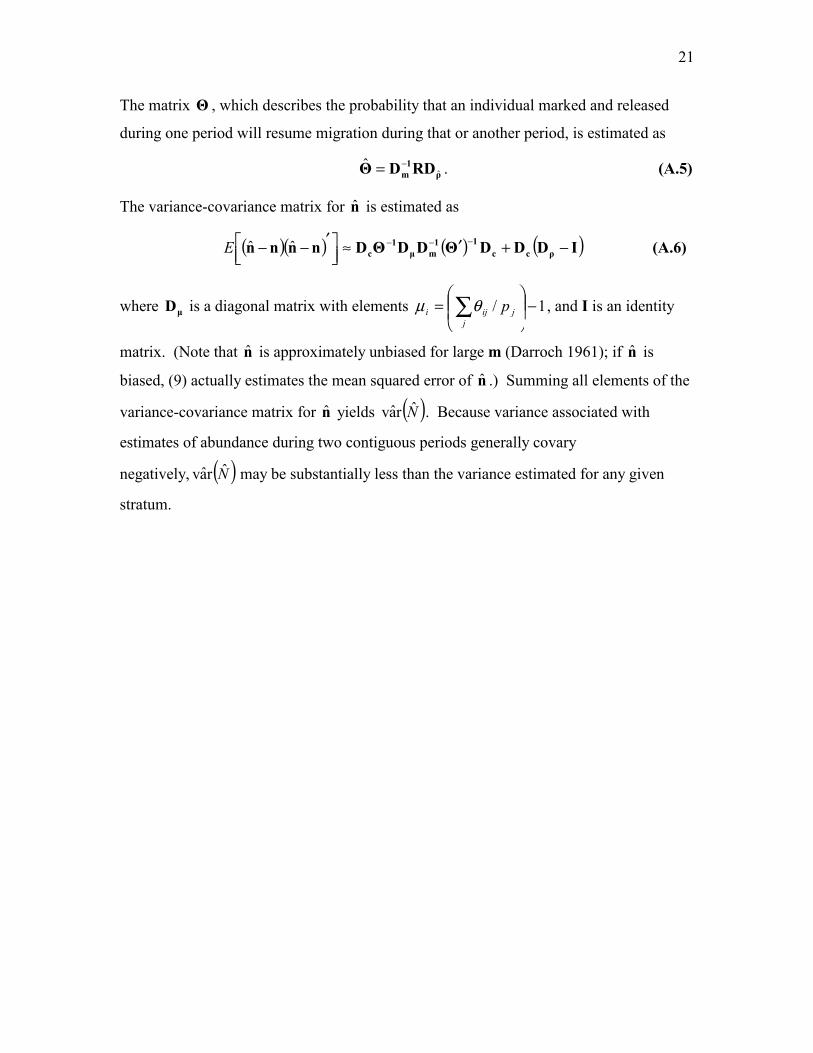
The matrix Θ , which describes the probability that an individual marked and released
during one period will resume migration during that or another period, is estimated as
ρ1
m RDDΘ ˆˆ −= . (A.5)
The variance-covariance matrix for n is estimated as
( )( ) ( ) ( )IDDDΘDDΘDnnnn ρcc11
mµ1
c −+′≈
′−− −−−ˆˆE (A.6)
where µD is a diagonal matrix with elements 1/ −
= ∑
jjiji pθµ , and I is an identity
matrix. (Note that n is approximately unbiased for large m (Darroch 1961); if n is
biased, (9) actually estimates the mean squared error of n .) Summing all elements of the
variance-covariance matrix for n yields ( )Nrav . Because variance associated with
estimates of abundance during two contiguous periods generally covary
negatively, ( )Nrav may be substantially less than the variance estimated for any given
stratum.
22
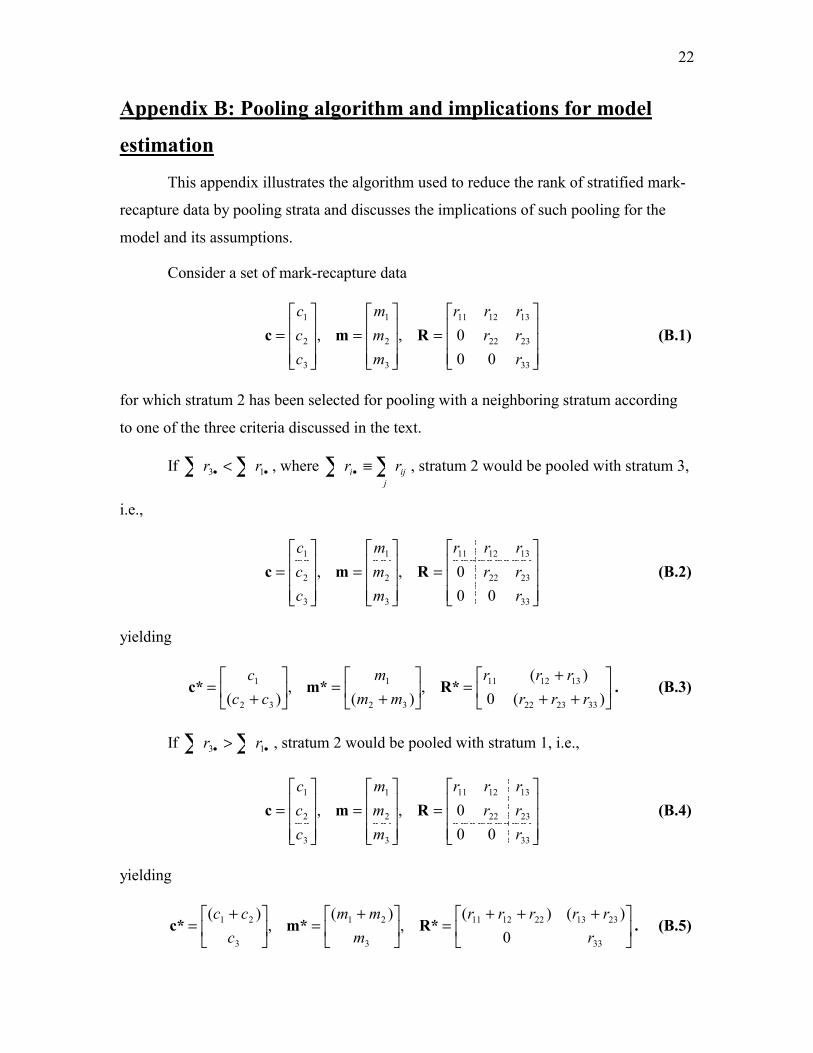
Appendix B: Pooling algorithm and implications for model
estimation
This appendix illustrates the algorithm used to reduce the rank of stratified mark-
recapture data by pooling strata and discusses the implications of such pooling for the
model and its assumptions.
Consider a set of mark-recapture data
=
=
=
33
2322
131211
3
2
1
3
2
1
000,,
rrrrrr
mmm
ccc
Rmc (B.1)
for which stratum 2 has been selected for pooling with a neighboring stratum according
to one of the three criteria discussed in the text.
If ∑∑ •• < 13 rr , where ∑∑ ≡•j
iji rr , stratum 2 would be pooled with stratum 3,
i.e.,
=
=
=
33
2322
131211
3
2
1
3
2
1
000,,
rrrrrr
mmm
ccc
Rmc (B.2)
yielding
++
+=
+
=
+
=)(0
)(,
)(,
)( 332322
131211
32
1
32
1
rrrrrr
mmm
ccc
R*m*c* . (B.3)
If ∑∑ •• > 13 rr , stratum 2 would be pooled with stratum 1, i.e.,
=
=
=
33
2322
131211
3
2
1
3
2
1
000,,
rrrrrr
mmm
ccc
Rmc (B.4)
yielding
+++=
+=
+=
33
2313221211
3
21
3
21
0)()(
,)(
,)(
rrrrrr
mmm
ccc
R*m*c* . (B.5)
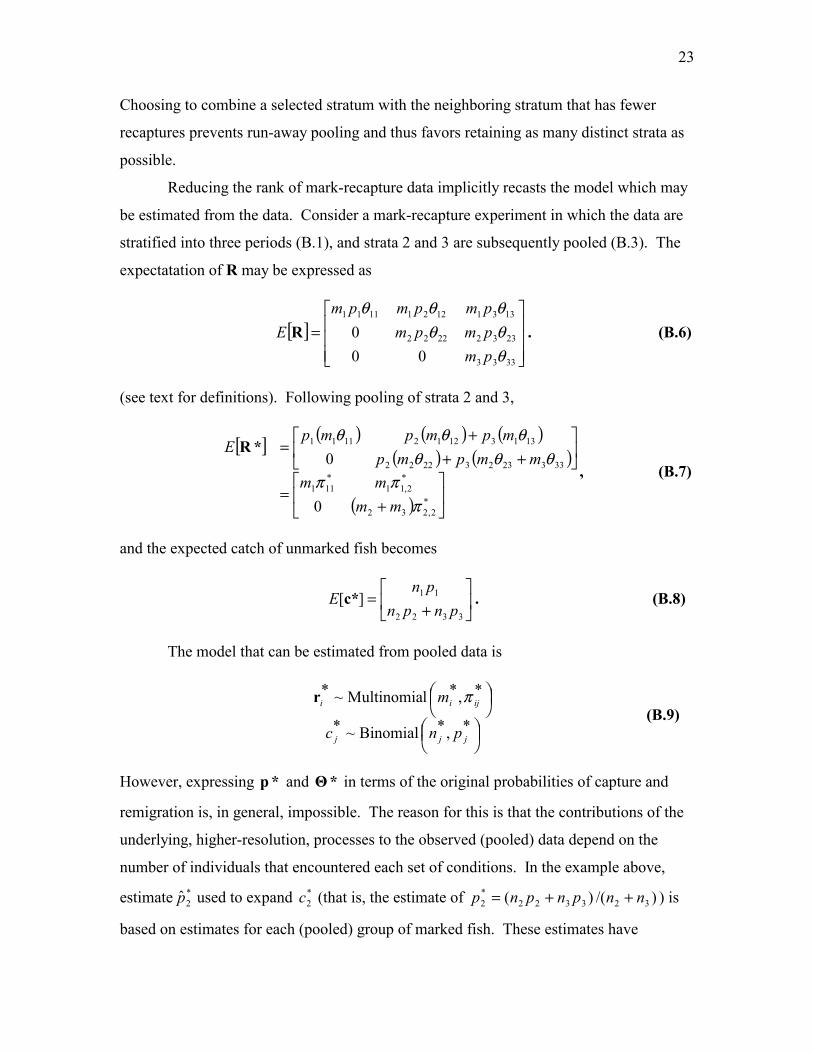
23
Choosing to combine a selected stratum with the neighboring stratum that has fewer
recaptures prevents run-away pooling and thus favors retaining as many distinct strata as
possible.
Reducing the rank of mark-recapture data implicitly recasts the model which may
be estimated from the data. Consider a mark-recapture experiment in which the data are
stratified into three periods (B.1), and strata 2 and 3 are subsequently pooled (B.3). The
expectatation of R may be expressed as
[ ]
=
3333
23322222
133112211111
000
θθθθθθ
pmpmpmpmpmpm
E R . (B.6)
(see text for definitions). Following pooling of strata 2 and 3,
[ ] ( ) ( ) ( )
( ) ( )
( )
+
=
++
+=
*2,232
*2,11
*111
33323232222
131312121111
0
0
πππ
θθθθθθ
mmmm
mmpmpmpmpmp
E *R, (B.7)
and the expected catch of unmarked fish becomes
+
=3322
11][pnpn
pnE c* . (B.8)
The model that can be estimated from pooled data is
*,* Binomial~*
*,* lMultinomia~*
jjj
ijii
pnc
m πr (B.9)
However, expressing *p and *Θ in terms of the original probabilities of capture and
remigration is, in general, impossible. The reason for this is that the contributions of the
underlying, higher-resolution, processes to the observed (pooled) data depend on the
number of individuals that encountered each set of conditions. In the example above,
estimate *2p used to expand *
2c (that is, the estimate of )/()( 323322*2 nnpnpnp ++= ) is
based on estimates for each (pooled) group of marked fish. These estimates have
24
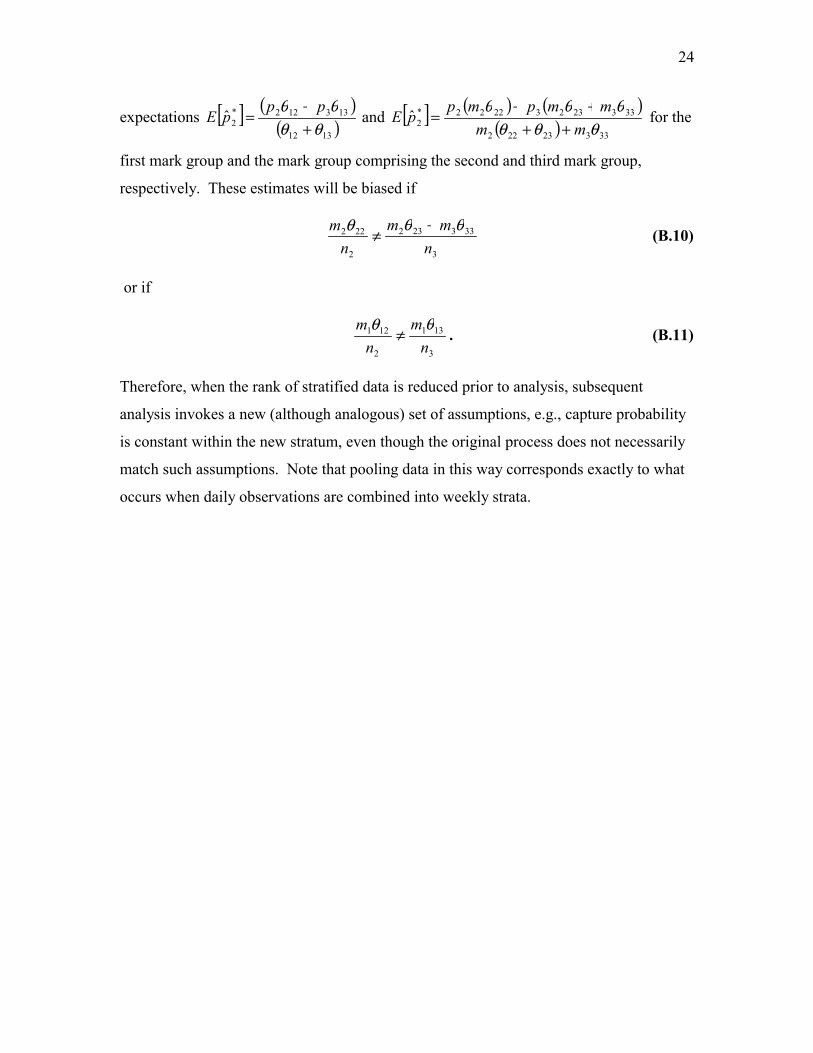
expectations [ ] ( )( )1312
133122*2ˆ
θθθθ
++
=pp
pE and [ ] ( ) ( )( ) 33323222
33323232222*2ˆ
θθθθθθ
mmmmpmp
pE++
++= for the
first mark group and the mark group comprising the second and third mark group,
respectively. These estimates will be biased if
3
333232
2
222
nmm
nm θθθ +
≠ (B.10)
or if
3
131
2
121
nm
nm θθ
≠ . (B.11)
Therefore, when the rank of stratified data is reduced prior to analysis, subsequent
analysis invokes a new (although analogous) set of assumptions, e.g., capture probability
is constant within the new stratum, even though the original process does not necessarily
match such assumptions. Note that pooling data in this way corresponds exactly to what
occurs when daily observations are combined into weekly strata.