daqua-mass: an iso 8000-61 based data quality management
TRANSCRIPT

sensors
Article
DAQUA-MASS: An ISO 8000-61 Based Data QualityManagement Methodology for Sensor Data
Ricardo Perez-Castillo 1,* , Ana G. Carretero 1, Ismael Caballero 1 , Moises Rodriguez 1,2 ,Mario Piattini 1,2, Alejandro Mate 3, Sunho Kim 4 and Dongwoo Lee 5
1 Information Technologies & Systems Institute (ITSI), University of Castilla-La Mancha, 13071 Ciudad Real,Spain; [email protected] (A.G.C.); [email protected] (I.C.);[email protected] (M.R.); [email protected] (M.P.)
2 AQC Lab, 13051 Ciudad Real, Spain3 Lucentia Lab, University of Alicante, 03690 San Vicente del Raspeig, Alicante, Spain; [email protected] Department of Industrial & Management Engineering, Myongji University, Seoul 449-728, Korea;
[email protected] GTOne, Seoul 07299, Korea; [email protected]* Correspondence: [email protected]; Tel.: +34-926295300
Received: 1 August 2018; Accepted: 12 September 2018; Published: 14 September 2018�����������������
Abstract: The Internet-of-Things (IoT) introduces several technical and managerial challenges whenit comes to the use of data generated and exchanged by and between various Smart, ConnectedProducts (SCPs) that are part of an IoT system (i.e., physical, intelligent devices with sensors andactuators). Added to the volume and the heterogeneous exchange and consumption of data, it isparamount to assure that data quality levels are maintained in every step of the data chain/lifecycle.Otherwise, the system may fail to meet its expected function. While Data Quality (DQ) is a maturefield, existing solutions are highly heterogeneous. Therefore, we propose that companies, developersand vendors should align their data quality management mechanisms and artefacts with well-knownbest practices and standards, as for example, those provided by ISO 8000-61. This standard enables aprocess-approach to data quality management, overcoming the difficulties of isolated data qualityactivities. This paper introduces DAQUA-MASS, a methodology based on ISO 8000-61 for dataquality management in sensor networks. The methodology consists of four steps according to thePlan-Do-Check-Act cycle by Deming.
Keywords: data quality; data quality management processes; ISO 8000-61; data quality in sensors;Internet-of-Things; IoT; Smart, Connected Products; SCPs
1. Introduction
“Our economy, society and survival aren’t based on ideas or information—they’re based onthings” [1]. This is one of the core foundations of the Internet-of-Things (IoT) as stated by Ashton,who coined the term. IoT is an emerging global internet-based information architecture facilitatingthe exchange of goods and services [2]. IoT systems are inherently built on data gathered fromheterogeneous sources in which the volume, variety and velocity of data generation, exchangingand processing are dramatically increasing [3]. Furthermore, there is a certain emergence of IoTsemantic-oriented vision which needs ways to represent and manipulate the vast amount of raw dataexpected to be generated from and exchanged between the “things” [4].
The vast amount of data in IoT environments, gathered from a global-scale deployment ofsmart-things, is the basis for making intelligent decisions and providing better services (e.g., smartmobility as presented in [5]). In other words, data represents the bridge that connects cyber and
Sensors 2018, 18, 3105; doi:10.3390/s18093105 www.mdpi.com/journal/sensors

Sensors 2018, 18, 3105 2 of 24
physical worlds. Despite of its tremendous relevance, if data are of inadequate quality, decisionsfrom both humans and other devices are likely to be unsound [6,7]. As a consequence, DataQuality (DQ) has become one of the key aspects in IoT [6,8–10]. In IoT, and in particular, Smart,Connected Products (SCPs), have concrete characteristics that favour the apparition of problems due toinadequate levels of data quality. Mühlhäuser [11] defines smart, connected products (SCPs) as “entities(tangible object, software, or service) designed and made for self-organized embedding into different(smart) environments in the course of its lifecycle, providing improved simplicity and opennessthrough improved connections”. While some of the SCP-related characteristics might be consideredomnipresent (i.e., uncertain, erroneous, noisy, distributed and voluminous), other characteristics aremore specific and highly dependent on the context and monitored phenomena (i.e., smooth variation,continuous, correlation, periodicity or Markovian behaviour) [6].
Also, outside of the IoT research area, DQ has been broadly studied during last years, and it hasbecome a mature research area capturing the growing interest of the industry due to the different typesof values that companies can extract from data [12]. This fact is reflected by the standardization effortslike ISO/IEC 25000 series addressing systems and software quality requirements and evaluation(SQuaRE) [13], or ISO 8000-60 series concerning the best practices in data quality managementprocesses. In order to assure adequate levels of data quality, it is necessary to produce and implementmethods, processes, and specific techniques for managing data concerns. We pose that such standardscan be tailored and used within the IoT context, not only bring benefits standardizing solutions andenabling a better communication between partners. Also, the number of problems and system failson the IoT environment is reduced, better decisions can be taken due to a better quality of data, allstakeholders are aligned and can take benefit of the advances on the standard used, and it is easier toapply data quality solutions in a global way because the heterogeneity is reduced.
Due to the youth of IoT, and despite DQ standards, frameworks, management techniques andtools proposed in the literature, DQ for IoT has not been yet widely studied. However, and prior to thisresearch line, it is possible to cite some works that had addressed some DQ concerns in sensor wirelessnetworks [8,14], or in data streaming [15,16] among other proposals [6]. However, these works havenot considered the management of DQ in a holistic way in line with existing DQ-related standards. Inour attempt to align the study of DQ in IoT to international standards, this paper provides practitionersand researchers with DAQUA-MASS, a methodology for managing data quality in SCP environments,which considers some of the DQ best practices for improving quality of data in SCP environmentsaligned to ISO 8000-61 [17]. Due to the intrinsic distributed nature of IoT systems, using such standardswill enable the various organizations to be aligned to the same foundations, and in the end, to work ina seamless way, what will undoubtedly improve the performance of the business processes.
The remainder of this paper is organized as follows: Section 2 presents the most challenging dataquality management concerns in the context of the SCP environments; Section 3 explores related work.Section 4 explains the data quality model in which our methodology is based on. Section 5 presents ourproposed methodology for managing data quality in SCP environments. Finally, Section 6 discussesconclusions and implications of this work.
2. Data Quality Challenges in SCP Environments
This section introduces some general ideas about Smart, Connected Products (SCPs) operations,as an essential part of IoT. In addition, some challenges related to DQ in SCP environments arealso introduced.
According to Cook et al. [18], a smart environment is a small world where all kinds of smartdevices are continuously working to make inhabitants’ lives more comfortable. According toMühlhäuser [11], SCP provides intelligent actions through improved connections by means ofcontext-awareness, semantic self-description, proactive behaviour, multimodal natural interfaces,AI planning, and machine learning.
Sensors 2018, 18, 3105 3 of 24
SCPs have three main core components: physical, smart, and connectivity components. Smartcomponents extend the capabilities and value of the physical components, while connectivity extendsthe capabilities and value of the smart components. This enables some smart components to existoutside the physical product itself, with a cycle of value improvement [19].
IoT and SCP can be confused in some contexts. However, IoT simply reflects the growing numberof SCPs and highlights the new opportunities they can represent. IoT, which can involve people orthings, is a mean for interchanging information. What makes SCPs essentially different is not theInternet, but the changing nature of the “things” [19]. A product that is smart and connected to thecloud could become part of an interconnected management solution; and companies can thereforeevolve from making products to offering more complex, higher-value services within a “system ofsystems” [20].
SCPs include processors, sensors, software and connectivity that allow data to be exchangedbetween the product and its environment. The data collected by sensors of these SCPs can be thenanalysed to inform decision-making, enable operational efficiencies and continuously improve theperformance of the product. This paper focuses on the data produced by such sensors, and howinadequate levels of data quality may affect the processing of the data, while smart and connectivityparts of SCPs are outside of the scope of this paper.
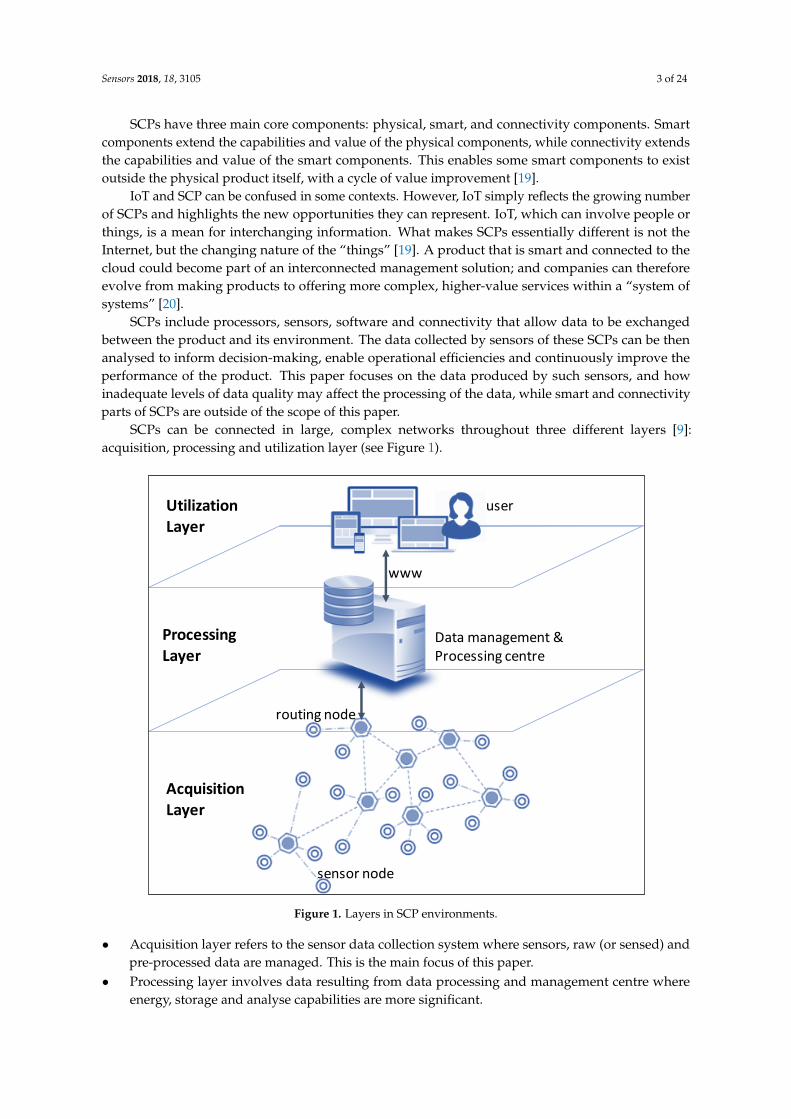
SCPs can be connected in large, complex networks throughout three different layers [9]:acquisition, processing and utilization layer (see Figure 1).
Sensors 2018, 18, x 3 of 24
the capabilities and value of the smart components. This enables some smart components to exist
outside the physical product itself, with a cycle of value improvement [19].
IoT and SCP can be confused in some contexts. However, IoT simply reflects the growing
number of SCPs and highlights the new opportunities they can represent. IoT, which can involve
people or things, is a mean for interchanging information. What makes SCPs essentially different is
not the Internet, but the changing nature of the “things” [19]. A product that is smart and connected
to the cloud could become part of an interconnected management solution; and companies can
therefore evolve from making products to offering more complex, higher-value services within a
“system of systems” [20].
SCPs include processors, sensors, software and connectivity that allow data to be exchanged
between the product and its environment. The data collected by sensors of these SCPs can be then
analysed to inform decision-making, enable operational efficiencies and continuously improve the
performance of the product. This paper focuses on the data produced by such sensors, and how
inadequate levels of data quality may affect the processing of the data, while smart and connectivity
parts of SCPs are outside of the scope of this paper.
SCPs can be connected in large, complex networks throughout three different layers [9]:
acquisition, processing and utilization layer (see Figure 1).
Figure 1. Layers in SCP environments.
Acquisition layer refers to the sensor data collection system where sensors, raw (or sensed) and
pre-processed data are managed. This is the main focus of this paper.
Processing layer involves data resulting from data processing and management centre where
energy, storage and analyse capabilities are more significant.
Utilization layer concerns delivered data (or post-processed data) exploited, for example, over a
GIS or combined with other services or applications.
As previously stated, the scope of the paper is limited to the data produced by SCPs’ sensors.
Hence, the proposal is mainly intended to be applied in the context of the acquisition layer.
sensor node
routing node
Data management &Processing centre
user
www
AcquisitionLayer
ProcessingLayer
UtilizationLayer
Figure 1. Layers in SCP environments.
• Acquisition layer refers to the sensor data collection system where sensors, raw (or sensed) andpre-processed data are managed. This is the main focus of this paper.
• Processing layer involves data resulting from data processing and management centre whereenergy, storage and analyse capabilities are more significant.
Sensors 2018, 18, 3105 4 of 24
• Utilization layer concerns delivered data (or post-processed data) exploited, for example, over aGIS or combined with other services or applications.
As previously stated, the scope of the paper is limited to the data produced by SCPs’ sensors.Hence, the proposal is mainly intended to be applied in the context of the acquisition layer.Nevertheless, the management of the data quality in sensors can impact on how data is processed(processing layer) and how data may be used later (utilization layer).
Networking and management of SCP operations can generate the business intelligence neededto deliver smart services. Smart services are delivered to or via smart objects that feature awarenessand connectivity [21]. SCP can carry out the following functions to support smart services [22]: status,diagnostics, upgrades, control and automation, profiling and behaviour tracking, replenishment andcommerce, location mapping and logistics, etc.
SCP operations enable new capabilities for companies, although also arising new problems andchallenges must be taken into account. On one hand, SCP operations require companies to build andsupport an entirely new technology infrastructure [19]. Technological layers in the new technologylandscape include new product hardware, embedded software, connectivity, a product cloud runningon remote servers, security tools, gateway for external information sources, and integration withenterprise business systems. On the other hand, SCP operations can provide competitive advantages,which are based on the operational effectiveness. Operation effectiveness requires to embrace bestpractices along the value chain, including up-to-date product technologies, the latest productionequipment, and state-of-the-art sales force methods, IT solutions, and so forth. Thus, SCP operationsalso creates new best practices across the value chain [19].
According to the different sources of data in these SCP environments, we can distinguish differenttypes of aggregated data:
• Sensor data: data that is generated by sensors and digitalized in a computer-readable format (forexample, the camera sensor readings).
• Device data: It is integrated by sensor data; observed metadata (metadata that characterizes thesensor data, e.g., timestamp of sensor data); and device meta data (metadata that characterizesthe device, e.g., device model, sensor model, manufacturer, etc.), so device data, for example, canbe data coming from the camera (device).
• General data: data related to/or coming from devices which has been modified or computed toderive different data plus business data (i.e., data for business use such as operation, maintenance,service, customers, etc.).
• IoT data: general data plus device data.
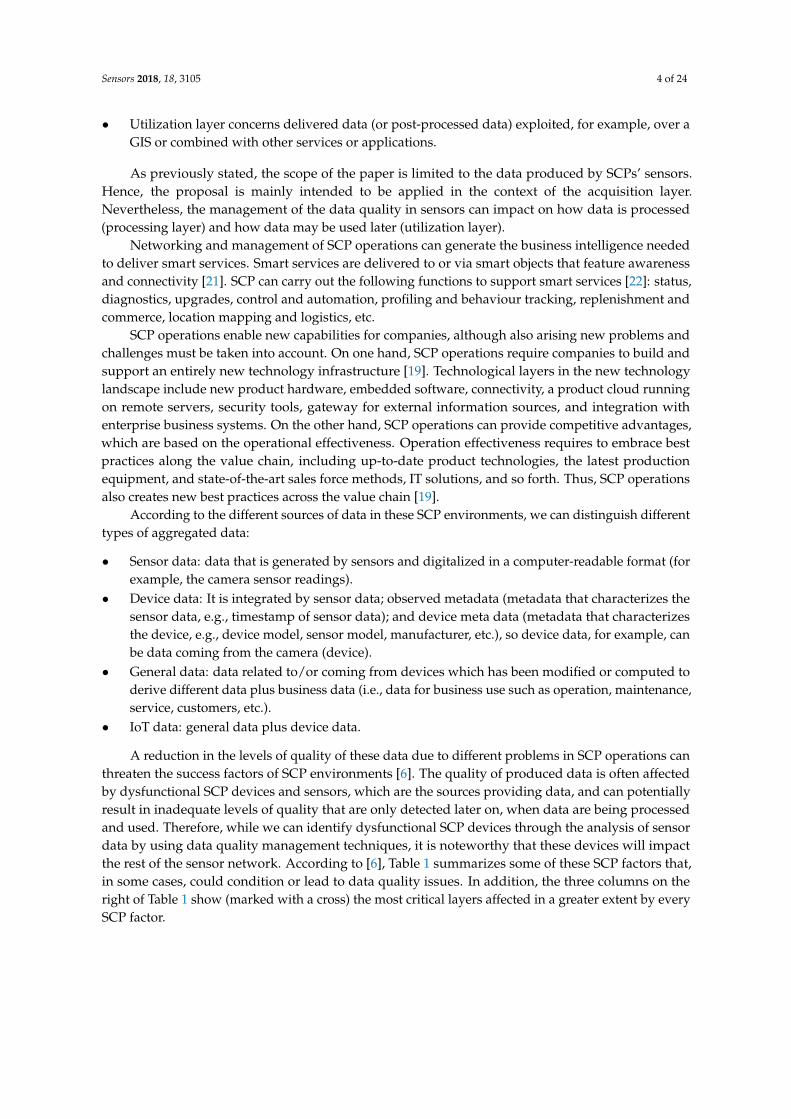
A reduction in the levels of quality of these data due to different problems in SCP operations canthreaten the success factors of SCP environments [6]. The quality of produced data is often affectedby dysfunctional SCP devices and sensors, which are the sources providing data, and can potentiallyresult in inadequate levels of quality that are only detected later on, when data are being processedand used. Therefore, while we can identify dysfunctional SCP devices through the analysis of sensordata by using data quality management techniques, it is noteworthy that these devices will impactthe rest of the sensor network. According to [6], Table 1 summarizes some of these SCP factors that,in some cases, could condition or lead to data quality issues. In addition, the three columns on theright of Table 1 show (marked with a cross) the most critical layers affected in a greater extent by everySCP factor.
Sensors 2018, 18, 3105 5 of 24
Table 1. SCP factors that can finally affect the levels of DQ according to [6].
SCP Factor Side Effect in Data Quality Acquisition Processing Utilization
Deployment ScaleSCPs are expected to be deployed on a global scale. This leads to a huge heterogeneityin data sources (not only computers but also daily objects). Also, the huge number ofdevices accumulates the chance of error occurrence.
X X
Resources constraints For example, computational and storage capabilities that do not allow complexoperations due, in turn, to the battery-power constraints among others. X X
Network Intermittent loss of connection in the IoT is recurrent. Things are only capable oftransmitting small-sized messages due to their scarce resources. X X
Sensors Embedded sensors may lack precision or suffer from loss of calibration or even lowaccuracy. Faulty sensors may also result in inconsistencies in data sensing. X
Environment
SCP devices will not be deployed only in tolerant and less aggressive environments. Tomonitor some phenomenon, sensors may be deployed in environments with extremeconditions. Data errors emerge when the sensor experiences the surroundingenvironment influences [23].
X X
Vandalism Things are generally defenceless from outside physical threats (both from humans andanimals). X X
Fail-dirty. A sensor node fails, but it keeps up reporting readings which are erroneous. It is acommon problem for SCP networks and an important source of outlier readings. X X
Privacy Privacy preservation processing, thus DQ could be intentionally reduced. X
Security vulnerability Sensor devices are vulnerable to attack, e.g., it is possible for a malicious entity to alterdata in an SCP device. X X
Data stream processing
Data gathered by smart things are sent in the form of streams to the back-end pervasiveapplications which make use of them. Some stream processing operators could affectquality of the underlying data [10].Other important factors are data granularity andvariety [24]. Granularity concerns interpolation and spatio-temporal density whilevariety refers to interoperability and dynamic semantics.
X X

Sensors 2018, 18, 3105 6 of 24
Tilak et al. [23] provide a taxonomy of sensor errors. These errors are directly related to differentdata quality problems in the acquisition layer. The mentioned taxonomy distinguishes the followingsix types of data sensors errors (see Table 2). Apart from errors in isolated SCP devices, there are othercommunication errors which can happen at SCP network level [23]. Table 3 summarizes the maintypes of communication errors: omission, crashes, delay and message corruption. The table shows theDQ issue derived by each problem, the root cause and possible solution.
Table 2. Sensors errors deriving DQ problems in SCP environments (adapted from [8]).
Error Description Example
Temporal delay error The observations are continuously producedwith a constant temporal deviation
Sensors 2018, 18, x FOR PEER REVIEW 6 of 24
Table 2. Sensors errors deriving DQ problems in SCP environments (adapted from [8]).
Error Description Example
Temporal delay
error
The observations are continuously produced with a constant temporal
deviation
Constant or offset
error
The observations continuously deviate from the expected value by a
constant offset.
Continuous varying
or drifting error
The deviation between the observations and the expected value is
continuously changing according to some continuous time-dependent
function (linear or non-linear).
Crash or jammed
error
The sensor stops providing any readings on its interface or gets jammed
and stuck in some incorrect value.
Trimming error
Data is correct for values within some interval but are modified for
values outside the interval. Beyond the interval, the data can be
trimmed or may vary proportionally.
Outliers error The observations occasionally deviate from the expected value, at
random points in the time domain.
Noise error The observations deviate from the expected value stochastically in the
value domain and permanently in the temporal domain.
Table 3. SCP Network Errors.
Sensor Fault DQ Problem Root Cause Solution
Omission faults Absence of values Missing sensor Network reliability,
retransmission
Crash faults
(fading/intermittent)
Inaccuracy/absence of
values
Environment
interference
Redundancy/estimating with
past values
Delay faults Inaccuracy Time domain Timeline solutions
Message corruption Integrity Communication Integrity validation
DQ characteristics to assess data quality in use within a specific context. This aspect considers
selected criteria to estimate the quality of raw sensor data at the acquisition and processing layer.
There are some DQ characteristics considered, which make it possible to estimate the quality on
data sources, their context of acquisition and their transmission to the data management and
processing. These DQ characteristics are accuracy and completeness according to ISO/IEC 25012
[25] and reliability and communication reliability as proposed in [9]. It is also related to the
utilization layer and includes availability regarding ISO/IEC 25012 [25] plus timeliness and
adequacy as defined in [9].
DQ Characteristics aimed at managing internal data quality. The main goal of managing internal
data quality is to avoid inconsistent data and maintain the temporality of sensor data at the
processing layer. These characteristics are consistency and currency according to ISO/IEC 25012
[25] and volatility as proposed in [9].
3. Related Work
The goal of this section is twofold. First, Section 3.1 presents some works related to the study of
data quality in sensor networks and SCP environments in general. Second, Section 3.2 introduces and
compares some data quality methodologies in order to draw the main contribution of the proposed
methodology.
Constant or offset error The observations continuously deviate fromthe expected value by a constant offset.
Sensors 2018, 18, x FOR PEER REVIEW 6 of 24
Table 2. Sensors errors deriving DQ problems in SCP environments (adapted from [8]).
Error Description Example
Temporal delay
error
The observations are continuously produced with a constant temporal
deviation
Constant or offset
error
The observations continuously deviate from the expected value by a
constant offset.
Continuous varying
or drifting error
The deviation between the observations and the expected value is
continuously changing according to some continuous time-dependent
function (linear or non-linear).
Crash or jammed
error
The sensor stops providing any readings on its interface or gets jammed
and stuck in some incorrect value.
Trimming error
Data is correct for values within some interval but are modified for
values outside the interval. Beyond the interval, the data can be
trimmed or may vary proportionally.
Outliers error The observations occasionally deviate from the expected value, at
random points in the time domain.
Noise error The observations deviate from the expected value stochastically in the
value domain and permanently in the temporal domain.
Table 3. SCP Network Errors.
Sensor Fault DQ Problem Root Cause Solution
Omission faults Absence of values Missing sensor Network reliability,
retransmission
Crash faults
(fading/intermittent)
Inaccuracy/absence of
values
Environment
interference
Redundancy/estimating with
past values
Delay faults Inaccuracy Time domain Timeline solutions
Message corruption Integrity Communication Integrity validation
DQ characteristics to assess data quality in use within a specific context. This aspect considers
selected criteria to estimate the quality of raw sensor data at the acquisition and processing layer.
There are some DQ characteristics considered, which make it possible to estimate the quality on
data sources, their context of acquisition and their transmission to the data management and
processing. These DQ characteristics are accuracy and completeness according to ISO/IEC 25012
[25] and reliability and communication reliability as proposed in [9]. It is also related to the
utilization layer and includes availability regarding ISO/IEC 25012 [25] plus timeliness and
adequacy as defined in [9].
DQ Characteristics aimed at managing internal data quality. The main goal of managing internal
data quality is to avoid inconsistent data and maintain the temporality of sensor data at the
processing layer. These characteristics are consistency and currency according to ISO/IEC 25012
[25] and volatility as proposed in [9].
3. Related Work
The goal of this section is twofold. First, Section 3.1 presents some works related to the study of
data quality in sensor networks and SCP environments in general. Second, Section 3.2 introduces and
compares some data quality methodologies in order to draw the main contribution of the proposed
methodology.
Continuous varying or driftingerror
The deviation between the observations andthe expected value is continuously changing
according to some continuoustime-dependent function (linear or
non-linear).
Sensors 2018, 18, x FOR PEER REVIEW 6 of 24
Table 2. Sensors errors deriving DQ problems in SCP environments (adapted from [8]).
Error Description Example
Temporal delay
error
The observations are continuously produced with a constant temporal
deviation
Constant or offset
error
The observations continuously deviate from the expected value by a
constant offset.
Continuous varying
or drifting error
The deviation between the observations and the expected value is
continuously changing according to some continuous time-dependent
function (linear or non-linear).
Crash or jammed
error
The sensor stops providing any readings on its interface or gets jammed
and stuck in some incorrect value.
Trimming error
Data is correct for values within some interval but are modified for
values outside the interval. Beyond the interval, the data can be
trimmed or may vary proportionally.
Outliers error The observations occasionally deviate from the expected value, at
random points in the time domain.
Noise error The observations deviate from the expected value stochastically in the
value domain and permanently in the temporal domain.
Table 3. SCP Network Errors.
Sensor Fault DQ Problem Root Cause Solution
Omission faults Absence of values Missing sensor Network reliability,
retransmission
Crash faults
(fading/intermittent)
Inaccuracy/absence of
values
Environment
interference
Redundancy/estimating with
past values
Delay faults Inaccuracy Time domain Timeline solutions
Message corruption Integrity Communication Integrity validation
DQ characteristics to assess data quality in use within a specific context. This aspect considers
selected criteria to estimate the quality of raw sensor data at the acquisition and processing layer.
There are some DQ characteristics considered, which make it possible to estimate the quality on
data sources, their context of acquisition and their transmission to the data management and
processing. These DQ characteristics are accuracy and completeness according to ISO/IEC 25012
[25] and reliability and communication reliability as proposed in [9]. It is also related to the
utilization layer and includes availability regarding ISO/IEC 25012 [25] plus timeliness and
adequacy as defined in [9].
DQ Characteristics aimed at managing internal data quality. The main goal of managing internal
data quality is to avoid inconsistent data and maintain the temporality of sensor data at the
processing layer. These characteristics are consistency and currency according to ISO/IEC 25012
[25] and volatility as proposed in [9].
3. Related Work
The goal of this section is twofold. First, Section 3.1 presents some works related to the study of
data quality in sensor networks and SCP environments in general. Second, Section 3.2 introduces and
compares some data quality methodologies in order to draw the main contribution of the proposed
methodology.
Crash or jammed errorThe sensor stops providing any readings on
its interface or gets jammed and stuck insome incorrect value.
Sensors 2018, 18, x FOR PEER REVIEW 6 of 24
Table 2. Sensors errors deriving DQ problems in SCP environments (adapted from [8]).
Error Description Example
Temporal delay
error
The observations are continuously produced with a constant temporal
deviation
Constant or offset
error
The observations continuously deviate from the expected value by a
constant offset.
Continuous varying
or drifting error
The deviation between the observations and the expected value is
continuously changing according to some continuous time-dependent
function (linear or non-linear).
Crash or jammed
error
The sensor stops providing any readings on its interface or gets jammed
and stuck in some incorrect value.
Trimming error
Data is correct for values within some interval but are modified for
values outside the interval. Beyond the interval, the data can be
trimmed or may vary proportionally.
Outliers error The observations occasionally deviate from the expected value, at
random points in the time domain.
Noise error The observations deviate from the expected value stochastically in the
value domain and permanently in the temporal domain.
Table 3. SCP Network Errors.
Sensor Fault DQ Problem Root Cause Solution
Omission faults Absence of values Missing sensor Network reliability,
retransmission
Crash faults
(fading/intermittent)
Inaccuracy/absence of
values
Environment
interference
Redundancy/estimating with
past values
Delay faults Inaccuracy Time domain Timeline solutions
Message corruption Integrity Communication Integrity validation
DQ characteristics to assess data quality in use within a specific context. This aspect considers
selected criteria to estimate the quality of raw sensor data at the acquisition and processing layer.
There are some DQ characteristics considered, which make it possible to estimate the quality on
data sources, their context of acquisition and their transmission to the data management and
processing. These DQ characteristics are accuracy and completeness according to ISO/IEC 25012
[25] and reliability and communication reliability as proposed in [9]. It is also related to the
utilization layer and includes availability regarding ISO/IEC 25012 [25] plus timeliness and
adequacy as defined in [9].
DQ Characteristics aimed at managing internal data quality. The main goal of managing internal
data quality is to avoid inconsistent data and maintain the temporality of sensor data at the
processing layer. These characteristics are consistency and currency according to ISO/IEC 25012
[25] and volatility as proposed in [9].
3. Related Work
The goal of this section is twofold. First, Section 3.1 presents some works related to the study of
data quality in sensor networks and SCP environments in general. Second, Section 3.2 introduces and
compares some data quality methodologies in order to draw the main contribution of the proposed
methodology.
Trimming error
Data is correct for values within someinterval but are modified for values outside
the interval. Beyond the interval, the data canbe trimmed or may vary proportionally.
Sensors 2018, 18, x FOR PEER REVIEW 6 of 24
Table 2. Sensors errors deriving DQ problems in SCP environments (adapted from [8]).
Error Description Example
Temporal delay
error
The observations are continuously produced with a constant temporal
deviation
Constant or offset
error
The observations continuously deviate from the expected value by a
constant offset.
Continuous varying
or drifting error
The deviation between the observations and the expected value is
continuously changing according to some continuous time-dependent
function (linear or non-linear).
Crash or jammed
error
The sensor stops providing any readings on its interface or gets jammed
and stuck in some incorrect value.
Trimming error
Data is correct for values within some interval but are modified for
values outside the interval. Beyond the interval, the data can be
trimmed or may vary proportionally.
Outliers error The observations occasionally deviate from the expected value, at
random points in the time domain.
Noise error The observations deviate from the expected value stochastically in the
value domain and permanently in the temporal domain.
Table 3. SCP Network Errors.
Sensor Fault DQ Problem Root Cause Solution
Omission faults Absence of values Missing sensor Network reliability,
retransmission
Crash faults
(fading/intermittent)
Inaccuracy/absence of
values
Environment
interference
Redundancy/estimating with
past values
Delay faults Inaccuracy Time domain Timeline solutions
Message corruption Integrity Communication Integrity validation
DQ characteristics to assess data quality in use within a specific context. This aspect considers
selected criteria to estimate the quality of raw sensor data at the acquisition and processing layer.
There are some DQ characteristics considered, which make it possible to estimate the quality on
data sources, their context of acquisition and their transmission to the data management and
processing. These DQ characteristics are accuracy and completeness according to ISO/IEC 25012
[25] and reliability and communication reliability as proposed in [9]. It is also related to the
utilization layer and includes availability regarding ISO/IEC 25012 [25] plus timeliness and
adequacy as defined in [9].
DQ Characteristics aimed at managing internal data quality. The main goal of managing internal
data quality is to avoid inconsistent data and maintain the temporality of sensor data at the
processing layer. These characteristics are consistency and currency according to ISO/IEC 25012
[25] and volatility as proposed in [9].
3. Related Work
The goal of this section is twofold. First, Section 3.1 presents some works related to the study of
data quality in sensor networks and SCP environments in general. Second, Section 3.2 introduces and
compares some data quality methodologies in order to draw the main contribution of the proposed
methodology.
Outliers errorThe observations occasionally deviate fromthe expected value, at random points in the
time domain.
Sensors 2018, 18, x FOR PEER REVIEW 6 of 24
Table 2. Sensors errors deriving DQ problems in SCP environments (adapted from [8]).
Error Description Example
Temporal delay
error
The observations are continuously produced with a constant temporal
deviation
Constant or offset
error
The observations continuously deviate from the expected value by a
constant offset.
Continuous varying
or drifting error
The deviation between the observations and the expected value is
continuously changing according to some continuous time-dependent
function (linear or non-linear).
Crash or jammed
error
The sensor stops providing any readings on its interface or gets jammed
and stuck in some incorrect value.
Trimming error
Data is correct for values within some interval but are modified for
values outside the interval. Beyond the interval, the data can be
trimmed or may vary proportionally.
Outliers error The observations occasionally deviate from the expected value, at
random points in the time domain.
Noise error The observations deviate from the expected value stochastically in the
value domain and permanently in the temporal domain.
Table 3. SCP Network Errors.
Sensor Fault DQ Problem Root Cause Solution
Omission faults Absence of values Missing sensor Network reliability,
retransmission
Crash faults
(fading/intermittent)
Inaccuracy/absence of
values
Environment
interference
Redundancy/estimating with
past values
Delay faults Inaccuracy Time domain Timeline solutions
Message corruption Integrity Communication Integrity validation
DQ characteristics to assess data quality in use within a specific context. This aspect considers
selected criteria to estimate the quality of raw sensor data at the acquisition and processing layer.
There are some DQ characteristics considered, which make it possible to estimate the quality on
data sources, their context of acquisition and their transmission to the data management and
processing. These DQ characteristics are accuracy and completeness according to ISO/IEC 25012
[25] and reliability and communication reliability as proposed in [9]. It is also related to the
utilization layer and includes availability regarding ISO/IEC 25012 [25] plus timeliness and
adequacy as defined in [9].
DQ Characteristics aimed at managing internal data quality. The main goal of managing internal
data quality is to avoid inconsistent data and maintain the temporality of sensor data at the
processing layer. These characteristics are consistency and currency according to ISO/IEC 25012
[25] and volatility as proposed in [9].
3. Related Work
The goal of this section is twofold. First, Section 3.1 presents some works related to the study of
data quality in sensor networks and SCP environments in general. Second, Section 3.2 introduces and
compares some data quality methodologies in order to draw the main contribution of the proposed
methodology.
Noise errorThe observations deviate from the expectedvalue stochastically in the value domain and
permanently in the temporal domain.
Sensors 2018, 18, x FOR PEER REVIEW 6 of 24
Table 2. Sensors errors deriving DQ problems in SCP environments (adapted from [8]).
Error Description Example
Temporal delay
error
The observations are continuously produced with a constant temporal
deviation
Constant or offset
error
The observations continuously deviate from the expected value by a
constant offset.
Continuous varying
or drifting error
The deviation between the observations and the expected value is
continuously changing according to some continuous time-dependent
function (linear or non-linear).
Crash or jammed
error
The sensor stops providing any readings on its interface or gets jammed
and stuck in some incorrect value.
Trimming error
Data is correct for values within some interval but are modified for
values outside the interval. Beyond the interval, the data can be
trimmed or may vary proportionally.
Outliers error The observations occasionally deviate from the expected value, at
random points in the time domain.
Noise error The observations deviate from the expected value stochastically in the
value domain and permanently in the temporal domain.
Table 3. SCP Network Errors.
Sensor Fault DQ Problem Root Cause Solution
Omission faults Absence of values Missing sensor Network reliability,
retransmission
Crash faults
(fading/intermittent)
Inaccuracy/absence of
values
Environment
interference
Redundancy/estimating with
past values
Delay faults Inaccuracy Time domain Timeline solutions
Message corruption Integrity Communication Integrity validation
DQ characteristics to assess data quality in use within a specific context. This aspect considers
selected criteria to estimate the quality of raw sensor data at the acquisition and processing layer.
There are some DQ characteristics considered, which make it possible to estimate the quality on
data sources, their context of acquisition and their transmission to the data management and
processing. These DQ characteristics are accuracy and completeness according to ISO/IEC 25012
[25] and reliability and communication reliability as proposed in [9]. It is also related to the
utilization layer and includes availability regarding ISO/IEC 25012 [25] plus timeliness and
adequacy as defined in [9].
DQ Characteristics aimed at managing internal data quality. The main goal of managing internal
data quality is to avoid inconsistent data and maintain the temporality of sensor data at the
processing layer. These characteristics are consistency and currency according to ISO/IEC 25012
[25] and volatility as proposed in [9].
3. Related Work
The goal of this section is twofold. First, Section 3.1 presents some works related to the study of
data quality in sensor networks and SCP environments in general. Second, Section 3.2 introduces and
compares some data quality methodologies in order to draw the main contribution of the proposed
methodology.
Table 3. SCP Network Errors.
Sensor Fault DQ Problem Root Cause Solution
Omission faults Absence of values Missing sensor Network reliability,retransmission
Crash faults(fading/intermittent)
Inaccuracy/absence ofvalues
Environmentinterference
Redundancy/estimatingwith past values
Delay faults Inaccuracy Time domain Timeline solutions
Message corruption Integrity Communication Integrity validation
All the mentioned SCP devices/sensor errors will lead to different DQ problems in the three layersdepicted in Figure 1. As previously mentioned, DQ problems can be represented as a degradation ofsome DQ characteristics that are especially important in different environments. Let us consider twogroups of data quality characteristics:
• DQ characteristics to assess data quality in use within a specific context. This aspect considersselected criteria to estimate the quality of raw sensor data at the acquisition and processing layer.

Sensors 2018, 18, 3105 7 of 24
There are some DQ characteristics considered, which make it possible to estimate the qualityon data sources, their context of acquisition and their transmission to the data managementand processing. These DQ characteristics are accuracy and completeness according to ISO/IEC25012 [25] and reliability and communication reliability as proposed in [9]. It is also related tothe utilization layer and includes availability regarding ISO/IEC 25012 [25] plus timeliness andadequacy as defined in [9].
• DQ Characteristics aimed at managing internal data quality. The main goal of managing internaldata quality is to avoid inconsistent data and maintain the temporality of sensor data at theprocessing layer. These characteristics are consistency and currency according to ISO/IEC25012 [25] and volatility as proposed in [9].
3. Related Work
The goal of this section is twofold. First, Section 3.1 presents some works related to the studyof data quality in sensor networks and SCP environments in general. Second, Section 3.2 introducesand compares some data quality methodologies in order to draw the main contribution of theproposed methodology.
3.1. Sensor Data Quality
There are some published works in the literature that address the concerns related to data qualitymanagement in SCP and IoT environments. Karkouch et al. [6] presented a state-of-the-art survey forDQ in IoT. This survey presents IoT-related factors endangering the DQ and their impact on variousDQ characteristics. Also, DQ problems manifestations are discussed (and their symptoms identified) aswell as their impact in the context of IoT. Gonçalo et al. in [8] provided a similar survey addressing theproblem of not being able to ensure desired DQ levels for dependable monitoring when using wirelesssensor networks. This work pays special attention to comprehension of which faults can affect sensors,how they can affect the quality of the information and how this quality can be improved and quantified.Gutiérrez Rodríguez and Servigne in [9] also analysed data errors in sensor networks, in particular inenvironmental monitoring systems. In this paper, authors address the problem of uncertainty of datacoming from sensors with an approach dedicated to providing environmental monitoring applicationsand users with data quality information. Badawy et al. [26] combined parametric and non-parametricsignal processing and machine learning algorithms for automating sensor data quality control, whichcan identify those parts of the sensor data that are sufficiently reliable for further analysis and discardsuseless data.
Another research subarea of DQ in sensor networks is the DQ management in sensor data streams.Klein et al. [10] presented a quality-driven load shedding approach that screens the data stream tofind and discard data items of minor quality. Thus, DQ of stream processing results is maximizedunder adverse conditions such as data overload. Campbell et al. [15] advocated for automated qualityassurance and quality control procedures based on graphical and statistical summaries for review andtrack the provenance of the data in environmental sensor streams.
Other works focus on data management from different viewpoints. For example,Al-Ruithe et al. [27] detailed roles, responsibilities and policies in the context of IoT-Cloud convergedenvironments and provide a generic framework for data governance and security. Similarly,Qin et al. [14] provided a data management perspective on large-scale sensor environmentsapplications posing non-functional requirements to meet the underlying timeliness, reliability andaccuracy needs in addition to the functional needs of data collection. Although all these approachesare interesting and provide a useful vision, they still do not address how to make available (e.g.,institutionalize) best practices in data quality management to the entire organization. Such approachhas been proven to be more efficient when it comes to create an organizational data quality culture.This vision is specifically important in the case of IoT, since the SCP operations can be executed across
Sensors 2018, 18, 3105 8 of 24
different networks belonging to different departments or even organizations. From our point of view,this is a critical aspect for IoT that must be covered in a holistic way.
3.2. Data Quality Methodologies Comparison
There are some methodologies that can be used as drivers for assessing and managing DQ.First, Lee et al. [28] proposed AIMQ as a methodology that encompasses a model of data quality,a questionnaire to measure DQ, and analysis techniques for interpreting the DQ measures. Thismethodology is mainly used to analyse the gap between an organization and best practices, as wellas to assess gaps between information systems professionals and data consumers. The applicationof this methodology is useful for determining the best area for DQ improvement activities. Thismethodology has not been widely used and in a greater extent it has been considered to be tootheorical and dependent on the domain. McGilvray [29] provides a practical approach for planningand managing information quality. In comparison with the methodology proposed by Lee et al.,McGilvray’s one provides a more pragmatic and practical approach to achieving the desired state ofDQ within an organization. However, this methodology is still dependent on the domain of application.ISO/TS 8000-150:2011 [30] “specifies fundamental principles of master data quality management, andrequirements for implementation, data exchange and provenance”. This standard constitutes aninformative framework that identifies processes for DQ management. This framework could be usedin conjunction with, or independently of, quality management systems standards, for example, ISO9001 [31].
Batini et al. [32] provided a literature review about different methodologies for data qualityassessment and improvement. Most of the methods and techniques included in such review cannot beconsidered as a DQ management methodologies since do not consider all the managerial concernsin a holistic manner. At the contrary, most of these methods are focused on DQ assessment orimprovement in isolation. Similar to the mentioned review, a most recent study developed by Woodallet al. [33] classified most recent DQ assessment and improvement methods. This work suffers the sameproblem than the work of Batini et al. Apart of these methodologies, there is a lack of comprehensivemethodologies for the assessment and improvement of DQ in the domain of SCP operations and theirunderlaying data.
The recent standard ISO 8000-61 [17] provides a set of standard guidelines for managing DQ in aholistic way, which can be tailored for different domains. However, its main purpose is not to serveas a methodology for DQ management per se, but it simply provides a process reference model. Inthis sense, the standard is more descriptive than operative, what makes it not usable out-of-the-box.Aligned with this standard, this paper proposes the DAQUA-MASS methodology to deal with DQin SCP environments. The main contribution of DAQUA-MASS methodology is that it takes thestandard best practices for depicting an operative way to manage DQ (as depicted in the processesof ISO 8000-61) and tailors these to the particular domain of SCP environments, and in particular, insensor-related data.
4. DAQUA-Model: A Data Quality Model
Reviewing the literature, it is possible to find that the concept of data quality has been defined indifferent ways. The widest used definitions are aligned with the concept of “fitness for use”. In [34], itis defined as: “Data Quality is data that is fit for use by data consumer. This means that usefulnessand usability are important aspects of quality”. Different stakeholders can have different perceptionsof what quality means for the same data [35]. It largely depends on the context in which data isused. Thus, DQ in IoT environments must be adequately managed considering the very nature ofthe IoT systems. Typically, to improve data quality, a Plan-Do-Check-Act (PDCA) cycle specificallytailored for the context of usage is followed. In this sense, we think that adopting the processes of ISO8000-61 which are deployed in the PDCA [36] order can largely help to provide a methodology formanaging data quality in IoT environments. At the core of the PDCA cycle for IoT environments is

Sensors 2018, 18, 3105 9 of 24
the identification of a Data Quality Model (DQModel) which, being composed of several data qualitycharacteristics suitable for the problem, is used to identify and represent the data quality requirementsrequired in the context. [9].
In our case, and according to our philosophy of aligning with international standards, theDQ Model proposed, is a specialization of the DQ Model introduced in ISO/IEC 25012 [25]. ThisDQ Model is widely accepted and used in the industry. Nevertheless, it has not been specificallydeveloped for considering SCP aspects. In fact, the scope section of such standard literally states thatit “does not include data produced by embedded devices or real time sensors that are not retainedfor further processing or historical purposes” [25]. Therefore, in order to complement the standard,we provide some orientation in this paper on how to specifically use ISO/IEC 25012 in the context ofSCP environments.
The DQ Model focuses on the quality of the data as part of an information system and definesquality characteristics for target data used by humans and systems (i.e., the data that the organizationdecides to analyse and validate through the model). This model categorizes quality attributes intofifteen characteristics and considers three perspectives: inherent, system-dependent and both jointly(see crosses in Table 4).
Table 4. DQ Characteristics in ISO/IEC 25012 that can be affected by sensor data errors.
DQ Characteristics
Inhe
rent
Syst
emD
epen
dent Temporal
DelayError
Constantor Offset
Error
ContinuousVarying/Drifting
Error
Crash orJammed
Error
TrimmingError
OutliersError
NoiseError
Sensors 2018, 18, x 9 of 24
In the following paragraphs, we introduce and summarize the fifteen DQ characteristics and, as
a main contribution in this part, we provide a vision on how these DQ characteristics are tailored for
SCPs operations. Along with the definitions, for the sake of the understandability an example is also
provided for each characteristic. These examples are specially provided for the interpretation of these
DQ characteristics in the acquisition layer, which is the scope of this paper. However, it has to be
noticed that all these DQ characteristics can be considered for all the SCP layers with different ways
of assessment and interpretation.
From the point of view of data quality management, it is quite important not to make the mistake
of confusing the readings of dysfunctional sensors with inadequate levels of data quality, even when
a dysfunctional sensor can produce data without having adequate levels of quality (i.e., not fitting
the purpose of the use of data): the reason for making this distinction is that fixing errors due to
dysfunctional sensors requires first fixing the sensors; on the other hand, if one can assure that the
root cause is not grounded on a dysfunctional sensor, but on the data itself, then, to fix data quality
errors, then data quality management techniques should be used since it should not be ignored what
data means. The description of the data quality characteristics can be found in the following
paragraphs:
Table 4. DQ Characteristics in ISO/IEC 25012 that can be affected by sensor data errors.
DQ
Characteristics
Inh
eren
t
Sy
stem
Dep
end
ent
Temporal
Delay
Error
Constant
or Offset
Error
Continuous
Varying/Drifting
Error
Crash or
Jammed
Error
Trimming
Error
Outliers
Error
Noise
Error
Accuracy x P S S P P
Completeness x P S S
Consistency x S P S S
Credibility x S S P S
Currentness x P S
Accessibility x x
Compliance x x
Confidentiality x x
Efficiency x x
Precision x x P S
Traceability x x S S
Understandability x x
Availability x S S
Portability x
Recoverability x S S
Accuracy. It is the degree to which data has attributes that correctly represent the true value of
the intended attribute of a concept or event in a specific context of use. In SCP environments, a
low degree of accuracy could be derived from devices that provide values that could differ from
the value on the real world. For example, a low degree of accuracy can be when a humidity
sensor reads a value of 30% and the real value is 50%. Low levels of accuracy could be directly
related to sensor errors such as constant or offset, outlier errors and noise errors. Also, accuracy
could be indirectly affected by continuous varying or drifting and trimming error (see Table 4).
Completeness. It is the degree to which subject data associated with an entity has values for all
expected attributes and related entity instances in a specific context of use. In SCP environments,
a low degree of completeness could be derived from devices that are reading and sending no
values. For example, a low degree of completeness can happen when the records of sensor data
Accuracy x P S S P PCompleteness x P S SConsistency x S P S SCredibility x S S P S
Currentness x P SAccessibility x xCompliance x x
Confidentiality x xEfficiency x xPrecision x x P S
Traceability x x S SUnderstandability x x
Availability x S SPortability x
Recoverability x S S
As part of the methodology, we propose the association of the DQ characteristics with some ofthe sensor data errors previously shown in Table 2. These relationships suggest that erroneous datagenerated due to some malfunctioning sensors could lead or affect some of the DQ characteristics. Wedistinguish these relationships in Table 4 with ‘P’ and ‘S’ respectively signifying that a sensor error canhave a primary or secondary impact in DQ characteristics. Primary means a direct (or more critical)effect while secondary is a collide (or less critical) impact.
In the following paragraphs, we introduce and summarize the fifteen DQ characteristics and,as a main contribution in this part, we provide a vision on how these DQ characteristics are tailoredfor SCPs operations. Along with the definitions, for the sake of the understandability an example isalso provided for each characteristic. These examples are specially provided for the interpretation ofthese DQ characteristics in the acquisition layer, which is the scope of this paper. However, it has to benoticed that all these DQ characteristics can be considered for all the SCP layers with different ways ofassessment and interpretation.
From the point of view of data quality management, it is quite important not to make the mistakeof confusing the readings of dysfunctional sensors with inadequate levels of data quality, even whena dysfunctional sensor can produce data without having adequate levels of quality (i.e., not fitting

Sensors 2018, 18, 3105 10 of 24
the purpose of the use of data): the reason for making this distinction is that fixing errors due todysfunctional sensors requires first fixing the sensors; on the other hand, if one can assure that the rootcause is not grounded on a dysfunctional sensor, but on the data itself, then, to fix data quality errors,then data quality management techniques should be used since it should not be ignored what datameans. The description of the data quality characteristics can be found in the following paragraphs:
• Accuracy. It is the degree to which data has attributes that correctly represent the true value of theintended attribute of a concept or event in a specific context of use. In SCP environments, a lowdegree of accuracy could be derived from devices that provide values that could differ from thevalue on the real world. For example, a low degree of accuracy can be when a humidity sensorreads a value of 30% and the real value is 50%. Low levels of accuracy could be directly related tosensor errors such as constant or offset, outlier errors and noise errors. Also, accuracy could beindirectly affected by continuous varying or drifting and trimming error (see Table 4).
• Completeness. It is the degree to which subject data associated with an entity has values for allexpected attributes and related entity instances in a specific context of use. In SCP environments,a low degree of completeness could be derived from devices that are reading and sending novalues. For example, a low degree of completeness can happen when the records of sensor datahave missing values. Low levels of completeness could be related directly to sensor errors such ascrash or jammed errors and indirectly, trimming and noise errors (see Table 4).
• Consistency. It represents the degree to which data has attributes that are free from contradictionand are coherent with other data in a specific context of use. It can be either or both among dataregarding one entity and across similar data for comparable entities. In SCP environments, a lowdegree of consistency could happen when two sensors produce contradictory data. For example,for proximity sensors that provide the relative distance to the sensor position, a consistencyproblem for a single sensor could be a negative distance value, while a consistency problembetween two sensors in the same position could be two different values. Thus, low levels ofconsistency could be related with continuous varying/drifting error and indirectly with constantor offset errors, trimming and noise error (see Table 4).
• Credibility. It is defined as the degree to which data has attributes that are regarded as true andbelievable by users in a specific context of use. In SCP environments, a low degree of credibilitycould be derived from a single sensor placed in someplace and the data cannot be validated byanother entity or even sensor. For example, a credibility issue could happen when a sensor whosedata is compared with another sensor placed near does not match. Low levels of credibility couldbe related directly to sensor errors such as outlier errors and indirectly with constant or offseterror, continuous varying/drifting error and noise error (see Table 4).
• Currentness. It is the degree to which data has attributes that are of the right age in a specificcontext of use. In SCP environments, a low degree of currentness could be derived from a sensorthat can be indicating past values as current value (see Table 4). For example, if an irrigationsensor produces a value that indicates that the field must be irrigated, it has been irrigated and thedata is not updated. The data indicates whether it is necessary irrigation, or it is already irrigated,so this would be data without sufficient currentness.
• Accessibility. It is the degree to which data can be accessed in a specific context of use, particularlyby people who need supporting technology or special configuration because of some disability. InSCP environments, a low degree of accessibility could be derived due to the necessary user is notallowed in the precise moment. For example, data produced by a specific sensor is unreachabledue to network issues.
• Compliance. It refers to the degree to which data has attributes that adhere to standards,conventions or regulations in force and similar rules relating to data quality in a specific contextof use. In SCP environments, a low degree of compliance could be derived from data sensor thatis not being using the standards formats established on the organization. For example, if the

Sensors 2018, 18, 3105 11 of 24
organization establishes that for distance sensors the unit for values is meters, and if some sensorsproduce values expressed in meters and other in miles these data have low compliance levels.
• Confidentiality. It is the degree to which data has attributes that ensure that it is only accessibleand interpretable by authorized users in a specific context of use. In SCP environments, a lowdegree of confidentiality could be derived from an inefficient security management of sensordata. For example, a confidentiality leak might happen when data produced by a sensor placed ina nuclear power plant can be freely accessed from external networks even when this data wasmarked as sensible and, therefore, confidential in order to prevent possible terrorist acts.
• Efficiency. It is the degree to which data has attributes that can be processed and provide theexpected levels of performance by using the appropriate amounts and types of resources in aspecific context of use. For example, a sensor send data about where is placed and send a codeand a description every time the sensor sends o stores a record, it has low efficiency because onlythe code is enough to know all about the place. In SCP environments, a low degree of efficiencycould be derived from the storage of duplicated data that could take more time and resources tosend or manipulate the data.
• Precision. It is the degree to which data has attributes that are exact or that provide discriminationin a specific context of use. In SCP environments, a low degree of precision could be derived fromdevices that are providing inexact values as in the next example. For example, sensor data thatstore weight with no decimals and it is required a minimum of three decimals. Low levels ofconsistency could be related directly with trimming errors, and indirectly with noise errors (seeTable 4).
• Traceability. The degree to which data has attributes that provide an audit trail of access to thedata and of any changes made to the data in a specific context of use. In SCP environments, a lowdegree of traceability could be derived from sensor data with no metadata. For example, data logscontain information about who has acceded to sensor data and operations made with them. Lowlevels of traceability could be related indirectly to crash or jammed errors as well as to temporaldelay errors (see Table 4).
• Understandability. The degree to which data has attributes that enable it to be read and interpretedby users, and are expressed in appropriate languages, symbols and units in a specific context ofuse. In SCP environments, a low degree of understandability could be derived from sensor datarepresented with codes instead of acronyms. For example, records of data about temperatureon a car has an attribute to know the place of the sensor in the car. This attribute can be storedas a code like “xkq1”, but if is stored as “GasolineTank” it is supposed to have a higher levelof understandability.
• Availability. The degree to which data has attributes that enable it to be retrieved by authorizedusers and/or applications in a specific context of use. In SCP environments, a low degree ofavailability could be derived from the insufficient resources of the system in which sensor data isstored. For example, to assure sensor data availability, sensor replication can be used to makeit available even if there is some issue on a sensor. Low levels of availability could be relatedindirectly with temporal delay error and crash or jammed errors (see Table 4).
• Portability. The degree to which data has attributes that enable it to be installed, replaced ormoved from one system to another preserving the existing quality in a specific context of use. Forexample, sensor data is going to be shared with a concrete system or even other organization ordepartment, data loss can occur. If this happens, for example, due to a data model mismatchingor a problem with the data format, the reason is directly related to portability of data. In SCPenvironments, a low degree of portability could be derived from sensor data that does not followa specific data model (see Table 4) or the format present some problems.
• Recoverability. The degree to which data has attributes that enable it to maintain and preservea specified level of operations and quality, even in the event of failure, in a specific context ofuse. In SCP environments, a low degree of recoverability could be derived from devices that
Sensors 2018, 18, 3105 12 of 24
does not have a mechanism failure tolerant or backup. For example, when a device has a failure,data stored in that device should be recoverable. Low levels of recoverability could be relatedindirectly with temporal delay error and crash or jammed errors (see Table 4).
Although our DQ Model considers initially all the DQ characteristics defined in ISO/IEC 25012,it could be necessary to customize the DQ characteristics chosen to adapt them into the specificSCP context. This customization might depend on the concrete organization and how it applies themethodology to specific SCP contexts. The customized model will conform the data quality model foran organization with a specific SCP environment.
5. DAQUA-MASS: A Data Quality Management Methodology for Data Sensors
This section presents DAQUA-MASS, an ISO 8000-61-based Data Quality Managementmethodology for data sensors. Steps provided in this methodology are based in some of the processesintroduced by ISO 8000-61 [17], which, as we previously said, gathers the best practices around dataquality management by means of a process approach. Each process in this standard is described bymeans of a purpose, the outcomes and the activities that are to be applied for the assurance of dataquality. Thus, this standard mainly covers: (1) fundamental principles of data quality management; (2)the structure of the data quality management process; (3) definitions of the lower level processes fordata quality management; (4) the relationship between data quality management and data governance;(5) implementation requirements. This standard is used along with ISO 8000-62 to assess and improvethe organizational maturity when it comes to data quality management. However, in this paper, weconsider the processes in ISO 8000-61 to rigorously depict DAQUA-MASS.
Steps of DAQUA-MASS are grouped in four phases according to the Plan-Do-Check-Act cycle, asit is done in 8000-61. PDCA is implicitly a closed loop, signifying that the process is iterative and lastphase of every iteration provides feedback on starting a new iteration. Many acknowledged models,such as the in IoT information fusion [37] or the JDL model [38], are all closed loops. By this way, theycan be self-improved to adjust the dynamic world to maximize the performance. The IoT is a dynamicsystem so, the data quality management is adapted to the changes in every loop of the methodology.Each loop serves to adapt to changes and new quality needs that may arise. The methodology isdesigned so that the complete cycle is iteratively executed depending on the goals, needs and resourcesof the organization. The PDCA cycle will contribute to more effective and efficient data quality andconsists of seven steps grouped in the following four phases:
• The plan phase establishes the strategy and the data quality improvement implementation planas necessary to deliver results in accordance with data requirements;
• In the do phase the data quality improvement implementation plan is executed;• During the check phase, it is conducted the monitorization of data quality and process
performance against the strategy and data requirements and report the results to validate theefficiency of the corrective actions; and finally
• The act phase takes actions to continually improve process performance.
Figure 2 summarizes the step flow throughout the four phases. Every step is defined with ageneral description and set of concrete activities. Following sections present all the methodologysteps grouped in the mentioned Plan-Do-Check-Act cycle. The definition for all the steps provides atable depicting all the expected input and output generated by each activity in the step as well as aRACIQ matrix (R—Responsible (works on); A—Accountable, C—Consulted; I—Informed; Q—QualityReviewer) which indicates the role of stakeholders involved in the activity.
We consider the following list of stakeholders to be involved in the application of this methodology.It should be notice that there are alternative, similar (even overlapped) role definitions in the context ofdata quality management and SCP environments. However, we consider these are the most commonand well-known stakeholders, and other that are not mentioned can be easily assimilated to one ofthe proposed.

Sensors 2018, 18, 3105 13 of 24
Sensors 2018, 18, x 12 of 24
and improve the organizational maturity when it comes to data quality management. However, in
this paper, we consider the processes in ISO 8000-61 to rigorously depict DAQUA-MASS.
Steps of DAQUA-MASS are grouped in four phases according to the Plan-Do-Check-Act cycle,
as it is done in 8000-61. PDCA is implicitly a closed loop, signifying that the process is iterative and
last phase of every iteration provides feedback on starting a new iteration. Many acknowledged
models, such as the in IoT information fusion [37] or the JDL model [38], are all closed loops. By this
way, they can be self-improved to adjust the dynamic world to maximize the performance. The IoT
is a dynamic system so, the data quality management is adapted to the changes in every loop of the
methodology. Each loop serves to adapt to changes and new quality needs that may arise. The
methodology is designed so that the complete cycle is iteratively executed depending on the goals,
needs and resources of the organization. The PDCA cycle will contribute to more effective and
efficient data quality and consists of seven steps grouped in the following four phases:
The plan phase establishes the strategy and the data quality improvement implementation plan
as necessary to deliver results in accordance with data requirements;
In the do phase the data quality improvement implementation plan is executed;
During the check phase, it is conducted the monitorization of data quality and process
performance against the strategy and data requirements and report the results to validate the
efficiency of the corrective actions; and finally
The act phase takes actions to continually improve process performance.
Figure 2 summarizes the step flow throughout the four phases. Every step is defined with a
general description and set of concrete activities. Following sections present all the methodology
steps grouped in the mentioned Plan-Do-Check-Act cycle. The definition for all the steps provides a
table depicting all the expected input and output generated by each activity in the step as well as a
RACIQ matrix (R—Responsible (works on); A—Accountable, C—Consulted; I—Informed; Q—
Quality Reviewer) which indicates the role of stakeholders involved in the activity.
Figure 2. Methodology DAQUA-MASS phases and steps.
We consider the following list of stakeholders to be involved in the application of this
methodology. It should be notice that there are alternative, similar (even overlapped) role definitions
in the context of data quality management and SCP environments. However, we consider these are
the most common and well-known stakeholders, and other that are not mentioned can be easily
assimilated to one of the proposed.
Figure 2. Methodology DAQUA-MASS phases and steps.
• Chief Information Officer (CIO). It is the most senior executive in an enterprise responsible for thetraditional information technology and computer systems that support enterprise goal.
• Chief Data Officer (CDO). It is a corporate officer responsible for enterprise wide data governanceand utilization of data as an asset, via data processing, analysis, data mining, information tradingand other means. CIO and CDO are at the executive level.
• Data Governance Manager (DGM). He or she is overseeing enterprise data governance programdevelopment and is responsible for architecting certain solutions and frameworks. It is at thestrategic level.
• Data Quality Steward for SCP domain (SCP DQ Steward). It is a DQ steward at tactical level forthe area of SCP environments by considering its implications in DQ.
• Data Quality Steward (DQ Steward). It is responsible for utilizing an organization’s data qualitygovernance processes to ensure fitness of data elements—both the content and metadata. Datastewards have a specialist role that incorporates processes, policies, guidelines and responsibilitiesfor administering organizations’ entire data in compliance with DQ policies and procedures. Thisis at operational level.
• SCP Technical Architect (SCP Arch). A SCP architect is a SCP (and in general IoT) expert whomakes high-level design choices and dictates technical standards, including SCP technologystandards, tools, and platforms.
5.1. The Plan Phase
The data quality planning phase establishes data requirements and objectives for data quality,creating plans to achieve the objectives and evaluating the performance of the plans. These plansbalance current data quality levels, cost, resources and capabilities across the organization for theassessment of data quality of sensor data. This phase is initiated based on needs and expectations ofstakeholders or the feedback of the process improvements performed during data quality improvement(the act phase). The expected result of the execution of this phase is the complete planification foradequately collect sensor data. This includes requirements management, definition of policies for data,devices lifecycle management, and it is important to highlight the definition of policies to retain theoriginal unmanipulated data and all versions of the input data. Table 5 summarizes inputs, outputsand responsibility distribution for this phase. Following, a description of the steps grounded on thecorresponding ISO 8000-61 process is introduced. At this point it is reminded that the scope of themethodology is on sensor data (see Figure 1).

Sensors 2018, 18, 3105 14 of 24
Table 5. Inputs, outputs and RACIQ matrix for the Plan phase. (R—Responsible (works on); A—Accountable, C—Consulted; I—Informed; Q—Quality Reviewer).
Step Act. Input Output CIO CDO DGM SCP DQ Steward DQ Steward SCP Arch
P1
P1-1 • List of prioritized data quality requirements• Perform analysis definition
• Specification of data lifecycle inSCP environments
I A C R
P1-2 • Specification of data lifecycle in SCP environments• Data Quality Policies for SCPs• Data Quality Procedures for SCPs
I A R R C
P1-3• Specification of data lifecycle in SCP environments• Data Quality Policies for SCPs• Data Quality Procedures for SCPs
• Meta-data specification I C AR C
P1-4 • Specification of data lifecycle in SCP environments• Stakeholders or any other experts opinion
• Data Quality Strategy• List of prioritized data
quality requirementsI A R R R C
P2
P2-1 • List of prioritized data quality requirements• Mechanisms for data monitoring
• Metrics list• Measurement plan
I A C R
P2-2• Metric list• Measurement plan• List of prioritized data quality requirements
• Implementation ofmeasurement methods
A Q Q R
P3
P3-1
• DQ Issues list• Data Quality Strategy• List of prioritized data quality requirements• Business process definition
• Root causes for DQ issues relatedwith SCP faults
• Report with the effects of DQ issueson business processes
I A R R RQ
P3-2• Data Quality Strategy• List of prioritized data quality requirements• Business process definition
• DQ risk catalogue I I A R R C
P3-3
• Root causes for DQ issues related with SCP faults• Report with the effects of DQ issues on business processes• Specification of data lifecycle in SCP environments• SCP node placement plan• SCP node replication plan
• Solution definition for mitigatingroot causes
I A R R RC
P3-4
• Data Quality Strategy• Business process definition• DQ risk catalogue• Specification of data lifecycle in SCP environments
• Improvement target list
P3-5
• Data Quality Strategy• List of prioritized data quality requirements• Report with the effects of DQ issues on business processes• DQ risk catalogue
• Data quality enhancement plan I Q A R R C

Sensors 2018, 18, 3105 15 of 24
5.1.1. P1. Characterization of the Current State of the Sensor Data Contexts
This first step is devoted to characterizing the current state of the SCP environments and all thespecific sensor data contexts. This step has the following activities:
• P1-1. Sensor and sensor data lifecycle management specification. The lifecycle of sensors [2]and sensor data [39] have to be defined so that it can be managed. For sensors, the lifecyclestarts when the device is obtained, and the last step is when it is necessary to replace o removethe sensor because it became useless. For sensor data, the lifecycle starts when sensors producethe data and ends when the data is eliminated. The end of the sensor data life cycle should notbe confused with the moment in which the data goes from being operational to historical data.Operational sensor data is used on a day-to-day basis, but when data is no longer useful on aday-to-day basis due to its age, these data is separated and stored in another database and becomeinto historical data. It is important to highlight that sensor and sensor data lifecycle is used tobetter contextualize the environment of the data.
• P1-2. Management of quality policies, standards and procedures for data quality management.Specify fundamental intentions and rules for data quality management. Ensure the data qualitypolicies, standards and procedures are appropriate for the data quality strategy, comply withdata requirements and establish the foundation for continual improvement of the effectivenessand efficiency of data quality management in all the key SCP operations. The purpose of dataquality policy/standards/procedures management is to capture rules that apply to performingdata quality control, data quality assurance, data quality improvement, data-related support andresource provision consistently. Before the implementation and definition of the complete plan, itshould be defined the policies, standards and procedures in order to define the implementationplan based on them.
• P1-3. Provision of sensor data and work specifications. Developing specifications that describecharacteristics of data and work instructions for smart connected products enables Data processingand data quality monitoring and control. To support the description of the provision of the sensordata work specifications some metadata must be provided. Metadata can help with one of thebiggest problems of SCP: interoperability. Interoperability refers to the ability for one or moresmart connected products to communicate and exchange [15].
• P1-4. Identification, prioritization and validation of sensor data requirements. Collect the needsand expectations related to sensor data from devices and stakeholders. Then, it is translated byidentification, prioritization and validation of data requirements. The purpose of RequirementsManagement is to establish the basis for creating or for refining a data quality strategy for SCPenvironments aligned to the needs and expectations of stakeholders. It is important to have welldefined and implemented good sensor data requirements to avoid problems since the start and tofacilitate the collection and integration of sensor data.
5.1.2. P2. Assessment of the Current State of the Levels of Data Quality
This step is aimed to evaluate the current state of the data quality levels in all the surroundingSCP environments. This step has the following activities:
• P2-1. Identification of the data quality characteristics representing quality requirements anddetermination and development of metrics and measurement methods. Develop or select themeasurement indicators, corresponding metrics and measurement methods used to measure thequality levels of data produced by devices during all the SCP operations.
• P2-2. Measurement and analysis of data quality levels. Measure the data quality levels byimplementing the measurement plans and determining the measurement results. This meansthe application of the measurement algorithms defined and developed on the previous step(P2-1). Such algorithms strongly depend on the IT infrastructure landscape of every organization.Thereby, every organization often develop their own algorithms or use commercial solutions
Sensors 2018, 18, 3105 16 of 24
which are compliant with their own infrastructure. Merino et al. [7] presents algorithms andmetrics for each data quality characteristic. After data quality levels have been measured, thesecan be quantitatively analysed to extract insights about the SCP environment being managed.As a result, a list of nonconformities can be elaborated in the next step, with which to makeinformed decisions.
5.1.3. P3. Data Quality Enhancement Plan Definition
Data Quality implementation planning identifies the resources and sequencing by which toperform DQ control, DQ Assurance, DQ Improvement, data-related support and resource provisionacross the organization. At this point, after the collection of sensor data requirements and the definitionof standards and policies, it is important to configure the devices to implement the plan and placeeach node following a defined strategy. Optimal node placement allows to obtain the optimal valuethrough data. This step considers the following activities:
• P3-1. Analysis of root causes of data nonconformities. Analysing the root causes of each dataquality issue and assess the effect of the issue on business processes. The purpose of root causeanalysis and solution development of non-solved data quality non-conformities is to establish,in accordance with the data quality strategy and with the priorities identified by Data QualityAssurance, the basis on which to perform data cleansing and/or process improvement for datanonconformity prevention.
• P3-2. Data quality risk assessment. Identify risks throughout the data life cycle, analyse the impactif each risk was to occur and determine risk priorities to establish the basis for monitoring andcontrol of processes and data. The purpose of data quality monitoring and control is, by followingapplicable work instructions, to identify and respond when Data Processing fails to deliver datathat meet the requirements in the corresponding data specification. It allows to control what ishappening on data or even on the SCP environment. For example, with the control of sensor dataquality, it is possible to identify certain issues on devices. Data is often the most important thingto protect, because although the direct cost of losing it may be small compared with researchdata or intellectual property. If a sensor is not functioning any more due to some reason, it canbe replaced, but if a data loss is produced is very difficult to recover it or even impossible torecover. This can bring not only a data loss but can also be the root cause of other problems. Inconclusion, data quality risks should be identified in order to avoid them. As Karkouch et al.highlight in [6], the main factors affecting DQ in SCP or IoT environments are: deployment scale,resources constraints, network, sensors (as physical devices), environment, vandalism, fail-dirty,privacy preservation, security vulnerability and data stream processing.
• P3-3. Development of improvement solutions to eliminate the root causes. Propose solutions toeliminate the root causes and prevent recurrence of nonconformities. Evaluate the feasibility ofthe proposed improvements through cost benefit analysis.
• P3-4. Definition of improvement targets. The purpose of this activity is to analyse possibleimprovements areas according to the business processes, risk catalogue and the data qualitystrategy; and then it selects those that are more aligned with the data quality strategy and/or areable to lead to greater data quality enhancement regarding previous detected risks. Specific areasor sub-nets of devices in the organization’s SCP environments could also serve as a criterion todetermine specific improvement targets.
• P3-5. Establishment of the data quality enhancement plan. Define the scope and target of dataquality and prepare detailed implementation plans, defining and allocating the resources needed.
5.2. The Do Phase
This phase consists of the data quality control that is carried out based on the implementationplan established in data quality planning (see the Plan phase). The phase, when completed, delivers
Sensors 2018, 18, 3105 17 of 24
data that meet the specified requirements. This phase involves creating, using and updating dataaccording to specified work instructions and monitoring quality by checking whether the data conformto predetermined specifications.
In this phase, it is important to address aspects such as the provision of complete metadata, the useof flags to convey information about data, the documentation of all sensor data processing, monitoringand control of data, maintain appropriate levels of human inspection, perform range, domain andslope checks, implement an automated alert system for sensor network issues or automate sensor dataquality procedures. Table 6 summarizes inputs, outputs and responsibility distribution for this phase.
D1. Execution of the Data Quality Improvement Plan
The purpose of Provision of Data Specifications and Work Instructions is to establish the basis onwhich to perform Data Processing and Data Quality Monitoring and Control, taking account of theoutcomes of the Data Quality Planning, the Data-Related Support and the Resource Provision processes.Having the plan obtained for the first phase, the first step is to provide data and work specification tocollect data from devices on the defined way. This step considers the following activities:
• D1-1. Establish flags to convey information about the sensor data. Flags or qualifiers conveyinformation about individual data values, typically using codes that are stored in a separate fieldto correspond with each value. Flags can be highly specific to individual studies and data sets orstandardized across all data.
• D1-2. Definition of the optimal node placement plan. It is a very challenging problem thathas been proven to be NP-hard (non-deterministic polynomial-time hardness) for most of theformulations of sensor deployment [40,41]. To tackle such complexity, several heuristics havebeen proposed to find sub-optimal solutions [42,43]. However, the context of these optimizationstrategies is mainly static in the sense that assessing the quality of candidate positions is based ona structural quality metric such as distance, network connectivity and/or basing the analysis ona fixed topology. Also, application-level interest can vary over time and the available networkresources may change as new nodes join the network, or as existing nodes run out of energy [44].Also, if we talk about node placement, node or sensor replication. Replicating data sensorsis important for purposes of high availability and disaster recovery. Also, replication of thisdata on cloud storage needs to be implemented efficiently. Archiving is one way to recover lostor damaged data in primary storage space, but replicas of data repositories that are updatedconcurrently with the primary repositories can be used for sensitive systems with strong dataavailability requirements. Replication can be demanding in terms of storage and may degradeperformance due to if a concurrent updates strategy is enforced.
• D1-3. Redesign the software or hardware that includes sensors to eliminate root causes. Itis an alternative process to the optimal re-placements of sensors. For example, redesign andreimplement a fragment of a SCP’s firmware could improve fault tolerance.
• D1-4. Data Cleansing. The purpose of Data Cleansing is to ensure, in response to the results ofroot cause analysis and solution development, the organization can access data sets that containno nonconformities capable of causing unacceptable disruption to the effectiveness and efficiencyof decision making using those data. Also, the nonconformities are corrected implementingdeveloped solutions and make a record of the corrections.
• D1-5. Force an appropriate level of human inspection. If performed by trained and experiencedtechnicians, visual inspection is used to monitor the state of industrial equipment and to identifynecessary repairs. There are also technologies used to assist with fault recognition or even toautomate inspections. Shop floor workers are made responsible for basic maintenance includingcleaning machines, visual inspection and initial detection of machine degradation.
• D1-6. Implement an automated alert system to warn about potential sensor data quality issues.Having only human inspection can be a complex task for maintenance staff. It is necessary to

Sensors 2018, 18, 3105 18 of 24
implement a system in which some key indicators are constantly reading if the sensors statusis correct or not. If a sensor is not working properly, the root cause can be due to a hardware,network or software failure and affects to data quality. Furthermore, an automated data qualityprocedure might identify anomalous spikes in the data and flag them. Even though, it is almostalways necessary the human supervision, intervention and inspection as stated in [45,46]; theinclusion of automated quality is often an improvement, because it ensures consistency andreduces human bias. Automated data quality procedures are also more efficient at handling thevast quantities of data that are being generated by streaming sensor networks and reduces theamount of human inspection required.
• D1-7. Schedule sensor maintenance to minimize data quality issues. Sensors require routinemaintenance and scheduled calibration that, in some cases, can be done only by the manufacturer.Ideally, maintenance and repairs are scheduled to minimize data loss (e.g., snow-depth sensorsrepaired during the summer) or staggered in such a way that data from a nearby sensor can beused to fill gaps. In cases in which unscheduled maintenance is required, stocking replacementparts on site ensures that any part of the network can be replaced immediately.
5.3. The Check Phase
The check phase consists of the data quality assurance, which measures data quality levels andthe methodology steps performance related to data nonconformities or other issues that have arisen asa result of the data quality planning (see the Plan phase) or the data quality control (see the Do phase).This measurement provides evidence by which to evaluate the impact of any identified poor levels ofdata quality on the effectiveness and efficiency of business processes. On this phase is important toaddress aspects like schedule sensor maintenance and repairs to minimize data loss, measurement andevaluation of sensor data quality. Table 7 summarizes inputs, outputs and responsibility distributionfor this phase.
5.3.1. C1. Testing the Efficiency of the Corrective Actions
The purpose of Measurement of Data Quality is the Provision of Measurement Criteria, to generateinput for the Evaluation of Measurement Results. This step considers the following activities:
• C1-1. Monitoring and control of the enhanced data. According to the identified risk priorities,monitor and measure conformity of data to the applicable specification. Monitoring andmeasuring takes place either at intervals or continuously and in accordance with applicable workinstructions. This work instructions can be: perform range checks on numerical data, performdomain checks on categorical data and perform slope and persistence checks on continuous datastreams. If data nonconformities are found, then correct the data when viable and distribute tostakeholders a record of the viability and degree of success for each corrective action.
• C1-2. Definition of an interstice comparison plan. Create policies for comparing data with datafrom related sensors. If no replicate sensors exist, interstice comparisons are useful, whereby datafrom one location are compared with data from nearby identical sensors.

Sensors 2018, 18, 3105 19 of 24
Table 6. Inputs, outputs and RACIQ matrix for the Do phase. (R—Responsible (works on); A—Accountable, C—Consulted; I—Informed; Q—Quality Reviewer).
Step Act. Input Output CIO CDO DGM SCP DQ Steward DQ Steward SCP Arch
D1
D1-1 • Meta-data specification• Specification of data lifecycle in SCP environments
• Sensor flags specification A Q R
D1-2 • Specification of data lifecycle in SCP environments• SCP node placement plan update• SCP node replication plan update
I A Q R
• Root causes for DQ issues related with SCP faults• Specification of data lifecycle in SCP environments
• SCP hardware updates• SCP software updates
I A Q R
D1-3
• Root causes for DQ issues related with SCP faults• Report with the effects of DQ issues on business processes• SCP node placement plan• SCP node replication plan
• Implementation of datacleansing mechanisms
I AQ R C
D1-4 • Data quality enhancement plan• DQ risk catalogue• Mechanisms for data monitoring
• Human inspection plan I A Q R C
D1-5 • Automated alert system I CQ
AR
D1-6
• Root causes for DQ issues related with SCP faults• Report with the effects of DQ issues on business processes• Specification of data lifecycle in SCP environments• SCP node placement plan• SCP node replication plan
• Sensor maintenance plan I A Q R
Table 7. Inputs, outputs and RACIQ matrix for the Check phase. (R—Responsible (works on); A—Accountable, C—Consulted; I—Informed; Q—Quality Reviewer).
Step Act. Input Output CIO CDO DGM SCP DQ Steward DQ Steward SCP Arch
C1
C1-1• Data quality enhancement plan• List of prioritized data quality requirements• DQ risk catalogue
• Mechanisms for datamonitoring update
• DQ control mechanisms updateI A R R R
C1-2 • Specification of data lifecycle in SCP environments• SCP node placement and replication plan
• Interstice comparison plan I A Q R
C2 C2-1• Data Quality Strategy• DQ risk catalogue• Implementation of measurement methods
• DQ Issues list I I A R Q

Sensors 2018, 18, 3105 20 of 24
5.3.2. C2. Review of Data Quality Issues
The purpose of Review of Data Quality Issues is to identify the starting point for deciding tomeasure data quality levels and process performance with the potential to generate opportunities toimprove data quality. The results of measurement and evaluation of data quality are analysed andpossible issues are identified. This step considers the following activities:
• C2-1. Issue analysis. Review non-solved nonconformities arising from Data Processing to identifythose that are possibly connected to the reported issue that has triggered the need for Data QualityAssurance. This review creates a set of related nonconformities. This set is the basis for furtherinvestigation through the measurement of data quality levels in SCP environments. Respond tothe reporting of unresolved data nonconformities from within Data Quality Control, indicationsof the recurrence of types of nonconformity or other issues raised against the results of DataQuality Planning or Data Quality Control.
5.4. The Act Phase
The Act phase consists of the data quality improvement that involves analysing the root causes ofdata quality issues based on the assessment results derived from data quality assurance (see the Checkphase). To prevent future data nonconformities, the steps in this phase try to correct all the existingnonconformities and also transforms SCP operations as appropriate. On this phase, it is importantto address aspects as analysis of root causes of sensor data problems, management of sensor dataproblems, correction and prevention, make available ready access to replacement parts and anticipatecommon repairs and maintain inventory replacement parts. Table 8 summarizes inputs, outputs andresponsibility distribution for this phase.
Table 8. Inputs, outputs and RACIQ matrix for the Act phase. (R—Responsible (works on);A—Accountable, C—Consulted; I—Informed; Q—Quality Reviewer).
Step Act. Input Output CIO
CD
O
DG
M
SCP
DQ
Stew
ard
DQ
Stew
ard
SCP
Arc
h
A1
A1-1
• Sensor maintenance plan• SCP node placement plan• SCP node replication plan• Root causes for DQ issues
related with SCP faults• Report with the effects of DQ
issues on business processes• Specification of data lifecycle
in SCP environments
• Sensor calibration plan• Replacement ready
access strategy• Sensor maintenance plan
I A C R
A1-2 • Device replacement plan I A C R
A1. Data Quality Issues Prevention
The purpose of Data Quality issues prevention results of Root Cause Analysis and SolutionDevelopment is to increase the extent to which the organization achieves a systematic and systemicapproach to achieving data quality. This step tries to prevent issues on devices or, for example, to avoiddata loss when it can be predicted the repair or the maintenance of devices of the SCP environment. Inorder to prevent the recurrence of each actual or the occurrence of each potential data nonconformityor similar data nonconformities by refining and applying guidelines, rules and procedures. To achievethis, the following activities should be conducted:
• A1-1. Make available ready access to replacement parts. Schedule routine calibration ofinstruments and sensors based on manufacturer specifications. Maintaining additional calibratedsensors of the same make/model can allow immediate replacement of sensors removed for

Sensors 2018, 18, 3105 21 of 24
calibration to avoid data loss. Otherwise, sensor calibrations can be scheduled at non-criticaltimes or staggered such that a nearby sensor can be used as a proxy to fill gaps.
• A1-2. Update the strategy for node replacement. Controlled replacement is often pursued foronly a selected subset of the employed nodes with the goal of structuring the network topologyin a way that achieves the desired application requirements. In addition to coverage, the nodes’positions affect numerous network performance metrics such as energy consumption, delay andthroughput. For example, large distances between nodes weaken the communication links, lowerthe throughput and increase energy consumption. Additionally, it can anticipate some commonrepairs and maintain inventory replacement parts. This means that sensors could be replacedbefore failure where sensor lifetimes are known or can be estimated.
6. Conclusions
In this paper, we have tackled the challenges of data quality problems in SCP environments. Manyresearch and standardization efforts have been made in the DQ area over the last years, and someinteresting results have been already transferred to IoT as well. However, the approaches presented inthe literature have two main drawbacks. On the one hand, these proposals do not take into account thenature of SCP environments and the concrete factors that affect the way in which DQ must be treated insuch context. On the other hand, these approaches do not consider existing DQ management standardsthat have not been tailored yet for IoT and, more specifically, to SCP contexts. Given the importance ofinstitutionalizing best practices in SCP for DQ management, we consider it of paramount importanceto provide practitioners and organizations with techniques aligned with standards, reducing theiradaptation efforts and favouring systematic and holistic approaches to the problem. As a maincontribution, we have provided in this paper a Data Quality Management Methodology for SensorData, named DAQUA-MASS, based on ISO 8000-61. The methodology is structured according to thePDCA Cycle of continuous improvement. The methodology is composed by 7 steps divided in severalactivities. Input and output products are already identified for each activity in the methodology. It isnoteworthy to highlight the identification of the various roles involved in the management of dataquality in sensor data.
So, the data quality model along with the methodology offer a unique framework to enabledesigners of IoT projects including sensor networks and practitioners in charge of exploiting IoTsystems to assure that the business processes working over these systems can manage data withadequate levels of quality. Once discarded data quality problems or identified data quality problemsroot causes, it will be easier to focus the attention exclusively on sensor networks of IoT systems.Working aligned to international open standards will enable organizations to speak the same languageand devote the required efforts only to the proper working of the IoT systems, preventing to be awareof some other data quality concerns.
Future research lines are planned to be primarily focused on the empirical validation of thismethodology. It will be used by different organization in various SCP environments in order toensure its applicability in large scale. The mentioned case studies will allow us to provide differentspecializations of the data quality model (or recommendation on how to tailor it) to differentorganization depending on the domain. In parallel, other future research lines are in accordancewith some limitations of the scope considered in this paper. Thus, it is expected to be considered dataquality management issues and its implications in the processing and utilization layers apart fromthe acquisition layer (see Figure 1). While simplified data analysis is being performed at the devicesin the acquisition layer to control the device, most of analysis, diagnosis and improvement of sensordata are being performed in the processing layer. This will force to manage sensor data together withgeneral-purpose data to achieve a holistic data quality management in the processing layer.

Sensors 2018, 18, 3105 22 of 24
Author Contributions: Conceptualization, R.P.-C. and I.C.; Investigation, R.P.-C., A.G.C. and I.C.;Writing-Original Draft Preparation, R.P.-C., A.G.C. and I.C.; Writing-Review & Editing, R.P.-C., A.G.C.; I.C.;M.R., M.P., A.M., S.K. and D.L.; Supervision, I.C. and M.P.; Project Administration, R.P.-C. and I.C.; FundingAcquisition, I.C., M.P., S.K., D.L.
Funding: This work was primarily funded by DQIoT project (Eureka program, E!11737; and CDTI(Centro Para el Desarrollo Tecnológico Industrial), INNO-20171086). Additionally, this work was partiallyfunded by SEQUOIA project (TIN2015-63502-C3-1-R and TIN2015-63502-C3-3-R) (MINECO/FEDER); GEMASBPLY/17/180501/000293, Consejería de Educación, Cultura y Deporte de la Dirección General de Universidades,Investigación e Innovación de la JCCM); ECD project (Evaluación y Certificación de la Calidad de Datos)(PTQ-16-08504) (Torres Quevedo Program, MINECO). Finally, it was also supported through a grant to RicardoPérez-Castillo enjoys from JCCM within the initiatives for talent retention and return in line with RIS3 goals.
Conflicts of Interest: The authors declare no conflict of interest.
References
1. Ashton, K. That ‘internet of things’ thing. RFID J. 2009, 22, 97–114.2. Weber, R.H. Internet of things–governance quo vadis? Comput. Law Secur. Rev. 2013, 29, 341–347. [CrossRef]3. Hassanein, H.S.; Oteafy, S.M. Big Sensed Data Challenges in the Internet of Things. In Proceedings of the
13th International Conference on Distributed Computing in Sensor Systems (DCOSS), Ottawa, ON, Canada,5–7 June 2017.
4. Atzori, L.; Iera, A.; Morabito, G. The internet of things: A survey. Comput. Netw. 2010, 54, 2787–2805.[CrossRef]
5. Zhang, W.; Zhang, Z.; Chao, H.C. Cooperative fog computing for dealing with big data in the internetof vehicles: Architecture and hierarchical resource management. IEEE Commun. Mag. 2017, 55, 60–67.[CrossRef]
6. Karkouch, A.; Mousannif, H.; Al Moatassime, H.; Noel, T. Data quality in internet of things: A state-of-the-artsurvey. J. Netw. Comput. Appl. 2016, 73, 57–81. [CrossRef]
7. Merino, J.; Caballero, I.; Rivas, B.; Serrano, M.; Piattini, M. A data quality in use model for big data.Future Gener. Comput. Syst. 2016, 63, 123–130. [CrossRef]
8. Jesus, G.; Casimiro, A.; Oliveira, A. A Survey on Data Quality for Dependable Monitoring in Wireless SensorNetworks. Sensors 2017, 17, 2010. [CrossRef] [PubMed]
9. Rodríguez, C.C.G.; Servigne, S. Managing Sensor Data Uncertainty: A Data Quality Approach. Int. J. Agric.Environ. Inf. Syst. 2014, 4, 35–54. [CrossRef]
10. Klein, A.; Hackenbroich, G.; Lehner, W. How to Screen a Data Stream-Quality-Driven Load Shedding inSensor Data Streams. 2009. Available online: http://mitiq.mit.edu/ICIQ/Documents/IQ%20Conference%202009/Papers/3-A.pdf (accessed on 13 September 2018).
11. Mühlhäuser, M. Smart products: An introduction. In Proceedings of the European Conference on AmbientIntelligence, Darmstadt, Germany, 7–10 November 2007; Springer: Berlin, Germany, 2007; pp. 158–164.
12. Laney, D.B. Infonomics: How to Monetize, Manage, and Measure Information as an Asset for Competitive Advantage;Routledge: London, UK, 2017.
13. ISO/IEC. ISO/IEC 25000:2014. Systems and Software Engineering—Systems and Software QualityRequirements and Evaluation (SQuaRE)—Guide to SQuaRE. 2014. Available online: https://www.iso.org/standard/64764.html (accessed on 13 September 2018).
14. Qin, Z.; Han, Q.; Mehrotra, S.; Venkatasubramanian, N. Quality-aware sensor data management. In The Artof Wireless Sensor Networks; Springer: Berlin/Heidelberg, Germany, 2014; pp. 429–464.
15. Campbell, J.L.; Rustad, L.E.; Porter, J.H.; Taylor, J.R.; Dereszynski, E.W.; Shanley, J.B.; Gries, C.; Henshaw, D.L.;Martin, M.E.; Sheldon, W.M. Quantity is nothing without quality: Automated QA/QC for streamingenvironmental sensor data. Bioscience 2013, 63, 574–585. [CrossRef]
16. Klein, A.; Lehner, W. Representing data quality in sensor data streaming environments. J. Date Inf. Qual.2009, 1, 10. [CrossRef]
17. ISO. ISO 8000-61: Data Quality—Part 61: Data Quality Management: Process Reference Model. 2016.Available online: https://www.iso.org/standard/63086.html (accessed on 13 September 2018).
18. Cook, D.; Das, S.K. Smart Environments: Technology, Protocols and Applications; John Wiley Sons: Hoboken, NJ,USA, 2004.

Sensors 2018, 18, 3105 23 of 24
19. Porter, M.E.; Heppelmann, J.E. How smart, connected products are transforming competition. Harvard Bus.Rev. 2014, 92, 64–88.
20. Ostrower, D. Smart Connected Products: Killing Industries, Boosting Innovation. 2014. Available online:https://www.wired.com/insights/2014/11/smart-connected-products (accessed on 13 September 2018).
21. Wuenderlich, N.V.; Heinonen, K.; Ostrom, A.L.; Patricio, L.; Sousa, R.; Voss, C.; Lemmink, J.G. “Futurizing”smart service: implications for service researchers and managers. J. Serv. Mark. 2015, 29, 442–447. [CrossRef]
22. Allmendinger, G.; Lombreglia, R. Four strategies for the age of smart services. Harvard Bus. Rev. 2005, 83,131.
23. Tilak, S.; Abu-Ghazaleh, N.B.; Heinzelman, W. A taxonomy of wireless micro-sensor network models. ACMSIGMOBILE Mob. Comput. Commun. Rev. 2002, 6, 28–36. [CrossRef]
24. Barnaghi, P.; Bermudez-Edo, M.; Tönjes, R. Challenges for quality of data in smart cities. J. Date Inf. Qual.2015, 6, 6. [CrossRef]
25. ISO/IEC. ISO/IEC 25012: Software Engineering-Software Product Quality Requierements and Evaluation(SQuaRE)—Data Quality Model. 2008. Available online: https://www.iso.org/standard/35736.html(accessed on 13 September 2018).
26. Badawy, R.; Raykov, Y.P.; Evers, L.J.; Bloem, B.R.; Faber, M.J.; Zhan, A.; Claes, K.; Little, M.A. AutomatedQuality Control for Sensor Based Symptom Measurement Performed Outside the Lab. Sensors 2018, 18, 1215.[CrossRef] [PubMed]
27. Al-Ruithe, M.; Mthunzi, S.; Benkhelifa, E. Data governance for security in IoT & cloud convergedenvironments. In Proceedings of the 2016 IEEE/ACS 13th International Conference of Computer Systemsand Applications (AICCSA), Agadir, Morocco, 29 November–2 December 2016.
28. Lee, Y.W.; Strong, D.M.; Kahn, B.K.; Wang, R.Y. AIMQ: A methodology for information quality assessment.Inf. Manag. 2002, 40, 133–146. [CrossRef]
29. McGilvray, D. Executing Data Quality Projects: Ten Steps to Quality Data and Trusted Information (TM); Elsevier:Burlington, VT, USA, 2008.
30. ISO. ISO/TS 8000-150:2011 Data Quality—Part 150: Master Data: Quality Management Framework. 2011.Available online: https://www.iso.org/standard/54579.html (accessed on 13 September 2018).
31. ISO. ISO 9001:2015 Quality Management Systems—Requirements, in ISO 9000 Family—Quality Management.2015. Available online: https://www.iso.org/standard/62085.html (accessed on 13 September 2018).
32. Batini, C.; Cappiello, C.; Francalanci, C.; Maurino, A. Methodologies for data quality assessment andimprovement. ACM Comput. Surv. 2009, 41, 16. [CrossRef]
33. Woodall, P.; Oberhofer, M.; Borek, A. A classification of data quality assessment and improvement methods.Int. J. Inf. Qual. 2014, 3, 298–321. [CrossRef]
34. Strong, D.M.; Lee, Y.W.; Wang, R.Y. Data quality in context. Commun. ACM 1997, 40, 103–110. [CrossRef]35. Wang, R.Y. A product perspective on total data quality management. Commun. ACM 1998, 41, 58–65.
[CrossRef]36. Srivannaboon, S. Achieving competitive advantage through the use of project management under the
plan-do-check-act concept. J. Gen. Manag. 2009, 34, 1–20.37. Chen, P.Y.; Cheng, S.M.; Chen, K.C. Information fusion to defend intentional attack in internet of things.
IEEE Internet Things J. 2014, 1, 337–348. [CrossRef]38. Blasch, E.; Steinberg, A.; Das, S.; Llinas, J.; Chong, C.; Kessler, O.; Waltz, E.; White, F. Revisiting the JDL
model for information Exploitation. In Proceedings of the 16th International Conference on InformationFusion (FUSION), Istanbul, Turkey, 9–12 July 2013.
39. Pastorello, G.Z., Jr. Managing the Lifecycle of Sensor Data: From Production to Consumption. 2008. Availableonline: https://lis-unicamp.github.io/wp-content/uploads/2014/09/tese_GZPastorelloJr.pdf (accessed on13 September 2018).
40. Cerpa, A.; Estrin, D. ASCENT: Adaptive self-configuring sensor networks topologies. IEEE Trans. Mob.Comput. 2004, 3, 272–285. [CrossRef]
41. Cheng, X.; Du, D.Z.; Wang, L.; Xu, B. Relay sensor placement in wireless sensor networks. Wirel. Netw. 2008,14, 347–355. [CrossRef]
42. Dhillon, S.S.; Chakrabarty, K. Sensor placement for effective coverage and surveillance in distributed sensornetworks. In Proceedings of the 2003 IEEE Wireless Communications and Networking, New Orleans, LA,USA, 16–20 March 2003.

Sensors 2018, 18, 3105 24 of 24
43. Pan, J.; Cai, L.; Hou, Y.T.; Shi, Y.; Shen, S.X. Optimal Base-Station Locations in Two-Tiered Wireless SensorNetworks. IEEE Trans. Mob. Comput. 2005, 4, 458–473. [CrossRef]
44. Wu, J.; Yang, S. SMART: A scan-based movement-assisted sensor deployment method in wireless sensornetworks. IEEE INFOCOM 2005, 4, 2313.
45. Peppler, R.A.; Long, C.; Sisterson, D.; Turner, D.; Bahrmann, C.; Christensen, S.W.; Doty, K.; Eagan, R.;Halter, T.; Iveyh, M. An overview of ARM Program Climate Research Facility data quality assurance. OpenAtmos. Sci. J. 2008, 2, 192–216. [CrossRef]
46. Fiebrich, C.A.; Grimsley, D.L.; McPherson, R.A.; Kesler, K.A.; Essenberg, G.R. The value of routine site visitsin managing and maintaining quality data from the Oklahoma Mesonet. J. Atmos. Ocean. Technol. 2006, 23,406–416. [CrossRef]
© 2018 by the authors. Licensee MDPI, Basel, Switzerland. This article is an open accessarticle distributed under the terms and conditions of the Creative Commons Attribution(CC BY) license (http://creativecommons.org/licenses/by/4.0/).