danish fisheries: management, fleet structure and economic
TRANSCRIPT
Danish fisheries: Management, fleet structure and economic performance
Jesper Levring Andersen
(FOI Udredning) 2012 / 2
FOI Commissioned Work 2012 / 2
(FOI Udredning 2012 / 2)
Danish fisheries: Management, fleet structure and economic performance
Forfatter: Jesper Levring Andersen Prepared according to the agreement on public sector services between the Institute of Food and Resource Economics and the Ministry of Food, Agriculture and Fisheries.
Institute of Food and Resource Economics
University of Copenhagen
Rolighedsvej 25
DK-1958 Frederiksberg
www.foi.life.ku.dk/English

T H E F A C U L T Y O F L I F E S C I E N C E
U N I V E R S I T Y O F C O P E N H A G E N
1 March 2012
Danish fisheries Management, fleet structure and
economic performance By Associate Professor Jesper Levring Andersen
Institute of Food and Resource Economics University of Copenhagen
Rolighedsvej 25 1958 Frederiksberg C
Introduction In the last decade, the Danish management system has, under the CFP, undergone considerable changes, which to a large extent have been undertaken with involvement of stakeholders from the fishing communi-ties. The capacity of the Danish fishing fleet was intensively regulated before the introduction of individual property rights in 2003. The fleet capacity regulations have been strictly enforced and the capacity levels have been well below the EU reference levels for many years. However, problems with overcapacity and poor economic performance due to a regulation of quotas allowing all registered fishermen to enter any fishery managed by rations led to a government decision in 2001 to enter into a management using Trans-ferable Fishing Concessions (TFC). The Danish TFC management has obtained interest from many parties having an interest in fisheries man-agement. This short note intends to give some basic facts and figures about the development in Danish fisheries from 2000 to 2010. The Danish Management system The first step towards a Danish regulatory system primarily based on Transferable Fishing Concessions was initiated for the pelagic and industrial fleets 1st January 2003. Initially herring was regulated by Individual Transferable Quotas (ITQ’s), but later also mackerel and a range of industrial species (used to produce fishmeal and fish oil) were regulated by ITQ’s. The ITQ’s were allocated using the grandfathering method, where the rights were given free of charge to fishermen, using 2000-2002 as reference years. The pelagic and industrial vessels catch relatively cheap fish and are thus more dependent on efficient han-dling of large amounts of fish than the demersal fleet. The fishery for demersal species was regulated by individual fishing rights from 1st January 2007. Individual vessel quota shares (VQS) for the 28 most important quotas were distributed to all vessels with a level of activity generating more than € 30,000 of gross earnings each year in the reference period 2003-2005. Us-

PAGE 2 OF 11
ing the grandfathering method, VQS were allocated to each vessel based on landings in the reference peri-od 2003-2005. Initially the VQS could only be transferred together with the vessel to another vessel, but this restriction was abolished after two years. A VQS vessel can join a coastal fisheries scheme under the condition that the vessel is less than 17 meters and at least 80% of its fishing trips are shorter than three days. An additional quota share of cod and sole was allocated as a premium for vessels participating in the coastal fisheries scheme. The coastal vessels can buy quota shares from vessels over 17 meters, while vessels above 17 meters cannot buy from the coastal vessels. The less active – typically small scale vessels with gross earnings below € 30,000 in the reference period continued to be managed with a ration system with a fixed share of the national quotas for their segment. The total quota allocated to the group of less active vessels is calculated as share of these vessels fishery in the reference period (2003-2005). A Fish Fund with flexible quota shares for the individual stocks was also established to support the devel-opment in the fishery. Rules with regard to ownership, concentration of rights and requirements for active participation in the fishery were also a part of the regulation. The Danish management system prioritises high flexibility. Vessels can transfer shares permanently typical-ly in the context of fleet adaptation, but can also lease limited amounts of fish within the quota year typi-cally to address the daily need for quota adaptations. Furthermore, fishermen can form a pool with other vessels within which the annual vessel quotas can be transferred freely, given that the fishermen comply with the requirement of being an active fisherman earning at least 60% of his income from active fishing. A number of fisheries for mussels and brown shrimp are regulated separately with entry-licenses. Some vessels only catch non-quota species and are accordingly not restricted by EU quotas. Finally, inactive ves-sels are placed separately. There can be various reasons for vessels to be inactive rather than being scrapped. For example until 2009, in order to be eligible for days at sea in relation to the North Sea cod re-covery plan. The days at sea could then be transferred to active vessels. Based on the above, each vessel in the Danish fishing fleet can be placed in one of the boxes displayed in Figure 1 showing the structure of the Danish management system.
PAGE 3 OF 11
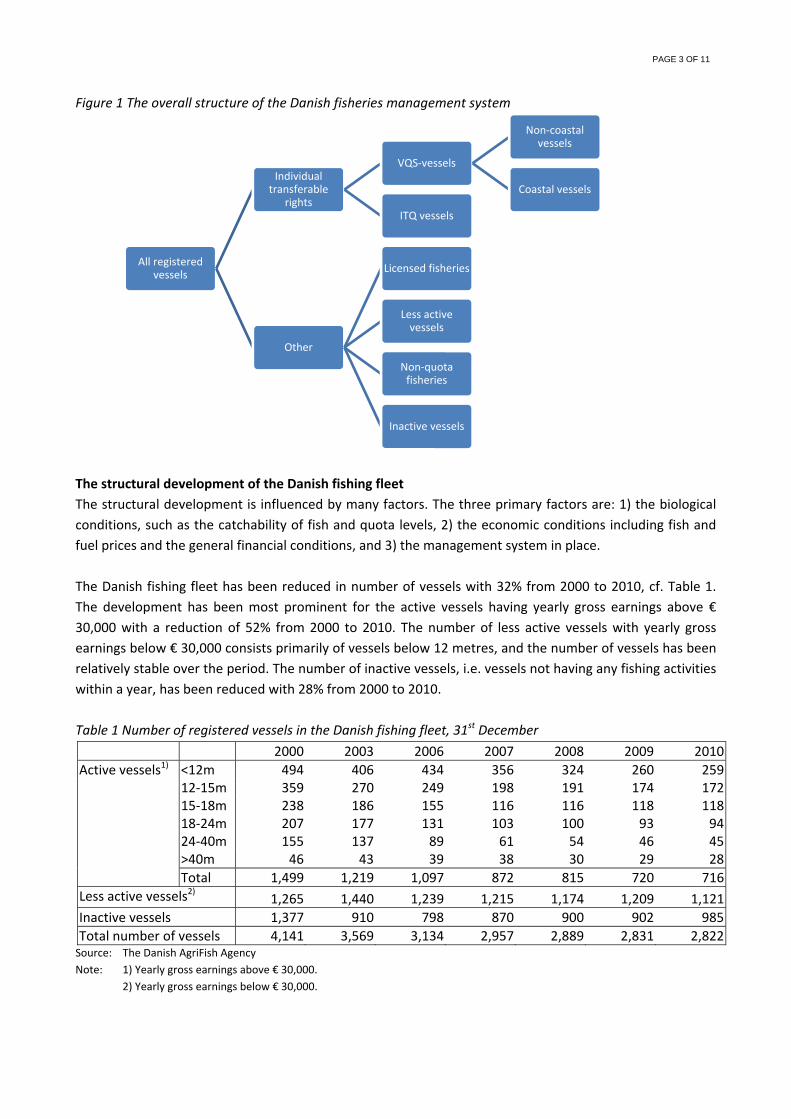
Figure 1 The overall structure of the Danish fisheries management system
The structural development of the Danish fishing fleet The structural development is influenced by many factors. The three primary factors are: 1) the biological conditions, such as the catchability of fish and quota levels, 2) the economic conditions including fish and fuel prices and the general financial conditions, and 3) the management system in place. The Danish fishing fleet has been reduced in number of vessels with 32% from 2000 to 2010, cf. Table 1. The development has been most prominent for the active vessels having yearly gross earnings above € 30,000 with a reduction of 52% from 2000 to 2010. The number of less active vessels with yearly gross earnings below € 30,000 consists primarily of vessels below 12 metres, and the number of vessels has been relatively stable over the period. The number of inactive vessels, i.e. vessels not having any fishing activities within a year, has been reduced with 28% from 2000 to 2010. Table 1 Number of registered vessels in the Danish fishing fleet, 31st December 2000 2003 2006 2007 2008 2009 2010Active vessels1) <12m 494 406 434 356 324 260 259
12-15m 359 270 249 198 191 174 17215-18m 238 186 155 116 116 118 118
18-24m 207 177 131 103 100 93 94 24-40m 155 137 89 61 54 46 45 >40m 46 43 39 38 30 29 28 Total 1,499 1,219 1,097 872 815 720 716Less active vessels2) 1,265 1,440 1,239 1,215 1,174 1,209 1,121Inactive vessels 1,377 910 798 870 900 902 985Total number of vessels 4,141 3,569 3,134 2,957 2,889 2,831 2,822
Source: The Danish AgriFish Agency Note: 1) Yearly gross earnings above € 30,000. 2) Yearly gross earnings below € 30,000.
All registered vessels
Individual transferable
rights
VQS-vessels
Non-coastal vessels
Coastal vessels
ITQ vessels
Other
Licensed fisheries
Less active vessels
Non-quota fisheries
Inactive vessels

PAGE 4 OF 11
The active vessels below 24 metres obtain the primary part of their income from catching demersal species. For the active vessels between 24 and 40 metres, their income is more equally distributed between demer-sal and pelagic species. Finally, the active vessels above 40 metres obtain almost entirely their income from catching pelagic and industrial species, where the latter are used to produce fish meal and fish oil. The in-come for less active vessels originates on average primarily from demersal species. These catch composi-tions have been reasonably stable within the last decade. The development in capacity, measured in tonnage (GT), is shown in Table 2. The registered capacity has been reduced from 111,120 GT in 2000 to 66,000 GT in 2010, equal to 41%. As the reduction is done on a voluntary basis, some of the inactive and potential capacity may be activated if for instance changes in quo-tas or economy make it economically profitable. Table 2 Tonnage of registered vessels in the Danish fishing fleet (GT), 31st December 2000 2003 2006 2007 2008 2009 2010Active vessels1) <12m 3,671 3,044 3,196 2,730 2,533 2,140 2,178
12-15m 7,421 5,425 4,921 3,968 3,829 3,514 3,49015-18m 10,395 8,068 6,497 4,918 5,257 5,643 5,66418-24m 17,957 15,334 10,625 8,563 8,481 8,411 8,875
24-40m 36,685 33,966 21,707 15,331 13,618 12,042 11,968 >40m 28,272 27,061 29,674 29,934 24,438 26,798 26,714 Total 104,400 92,897 76,620 65,444 58,155 58,547 58,888Less active vessels2) 4,404 4,332 3,525 3,911 3,241 4,164 3,860Inactive vessels 2,316 1,536 5,577 7,114 11,628 5,038 3,252Total for registered vessels 111,120 98,765 85,722 76,469 73,024 67,749 66,000Unutilized tonnage that can be inserted 4,941 7,977 11,671 20,268 21,618Total tonnage 111,120 98,765 90,663 84,446 84,695 88,017 87,618
Source: The Danish AgriFish Agency. Note: 1) Yearly gross earnings above € 30,000. 2) Yearly gross earnings below € 30,000.
For the active vessels, the average tonnage per vessel has increased from 70 GT in 2000 to 81 GT in 2010. For the vessels below 15 metres, the increase has been modest, but for the vessels above 15 metres, the increase has been more pronounced, especially for those above 40 metres, which on average has gone from 615 GT in 2000 to 954 GT in 2010. The corresponding yearly average change in vessel number and tonnage for the period prior to and after the introduction of the vessel quota shares on 1st January 2007 is given in Table 3.

PAGE 5 OF 11
Table 3 Average yearly change in vessel numbers and tonnage (%)
Number of vessels Tonnage Change 2000-2006 Change 2006-2010 Change 2000-2006 Change 2006-2010
Active vessels1) <12m -2.0 -10.0 -2.2 -8.0 12-15m -5.2 -7.8 -5.7 -7.3 15-18m -5.8 -6.0 -6.2 -3.3
18-24m -6.2 -7.0 -6.8 -4.0 24-40m -7.2 -12.3 -6.8 -11.3 >40m -2.5 -7.0 0.8 -2.5 Total -4.5 -8.8 -4.5 -5.8 Less active vessels2) -0.3 -2.5 -3.3 2.5 Inactive vessels -7.0 5.8 23.5 -10.5 Total number of vessels -4.0 -2.5 -3.8 -5.8
Note: 1) Yearly gross earnings above € 30,000. 2) Yearly gross earnings below € 30,000.
The average age of a vessel in the Danish fishing fleet is displayed in Table 4. For the active vessels, the age has been stable around 30 years in the period from 2000 to 2010. For the less active vessels and inactive vessels, the average age has gone up. Table 4 Average age of the registered vessels in the Danish fishing fleet, 31st December
2000 2003 2006 2007 2008 2009 2010 Active vessels1) 30 30 31 30 30 30 30 Less active vessels2) 25 25 26 27 27 27 28 Inactive vessels 24 26 29 29 30 31 32 Average age 27 27 28 28 29 29 30
Source: The Danish AgriFish Agency. Note: 1) Yearly gross earnings above € 30,000. 2) Yearly gross earnings below € 30,000.
The average tonnage age, calculated for each year at their individual vessel tonnage times vessel age divid-ed with total tonnage, to a higher extend gives a weighted measure, which includes the renewal process that has been initiated, especially for the larger vessels. The average tonnage age is shown in Table 5, and it is observed that the average tonnage age for the active vessels have been reduced from 26 in 2000 to 24 in 2006 and then further reduced to 21 in 2010. Table 5 Average tonnage age of the registered vessels in the Danish fishing fleet, 31st December
2000 2003 2006 2007 2008 2009 2010 Active vessels1) 26 26 24 23 24 21 21Less active vessels2) 29 30 32 31 31 32 32Inactive vessels 33 31 18 24 21 27 29Average tonnage age 27 27 24 24 23 23 24
Note: 1) Yearly gross earnings above € 30,000. 2) Yearly gross earnings below € 30,000.

PAGE 6 OF 11
Developments in landings The total landings in live weight from vessels being active at the end of the year have been reduced from 1.5 million tons in 2000 to 0.8 million tons in in 2010, cf. Table 6. In absolute figures, this was primarily due to reduced pelagic landings, but in relative figures the demersal landings have been reduced more. Table 6 Landings in live weight by Danish fishing vessels active 31st December (1,000 tons) 2000 2001 2002 2003 2004 2005 2006 2007 2008 2009 2010
P e l a g i
c3)
Active ves-sels1)
<12m 3 1 2 3 5 5 5 3 2 2 112-15m 16 23 14 15 19 29 21 15 12 13 1915-18m 42 55 35 34 43 39 27 18 16 25 2918-24m 71 85 85 48 57 55 45 31 28 33 3924-40m 666 628 580 352 307 210 178 101 110 101 72>40m 496 440 478 369 406 387 413 339 368 439 516Total 1,295 1,232 1,195 819 837 724 689 507 535 613 676
Less active vessels2) 1 0 0 0 0 1 0 0 0 0 0Total Pelagic 1,295 1,233 1,195 819 837 725 690 507 535 614 676
D e m e r s a l3)
Active ves-sels1)
<12m 64 61 55 52 51 37 29 28 25 25 1812-15m 60 61 53 48 50 36 27 25 26 24 2015-18m 46 53 47 37 40 37 38 38 22 22 2418-24m 32 32 30 28 26 22 22 18 19 19 2024-40m 27 27 30 27 35 36 24 16 19 20 20
>40m 4 4 4 4 6 6 7 7 6 7 7 Total 233 238 220 196 208 174 146 132 117 117 109Less active vessels2) 4 4 4 4 3 3 3 3 3 3 3Total Demersal 237 242 224 200 212 177 149 135 119 120 112
Total live weight 1,532 1,475 1,419 1,020 1,048 903 839 642 654 734 788Source: The Danish AgriFish Agency Note: 1) Yearly gross earnings above € 30,000. 2) Yearly gross earnings below € 30,000. 3) Includes all pelagic/demersal species, not only the TCF managed.
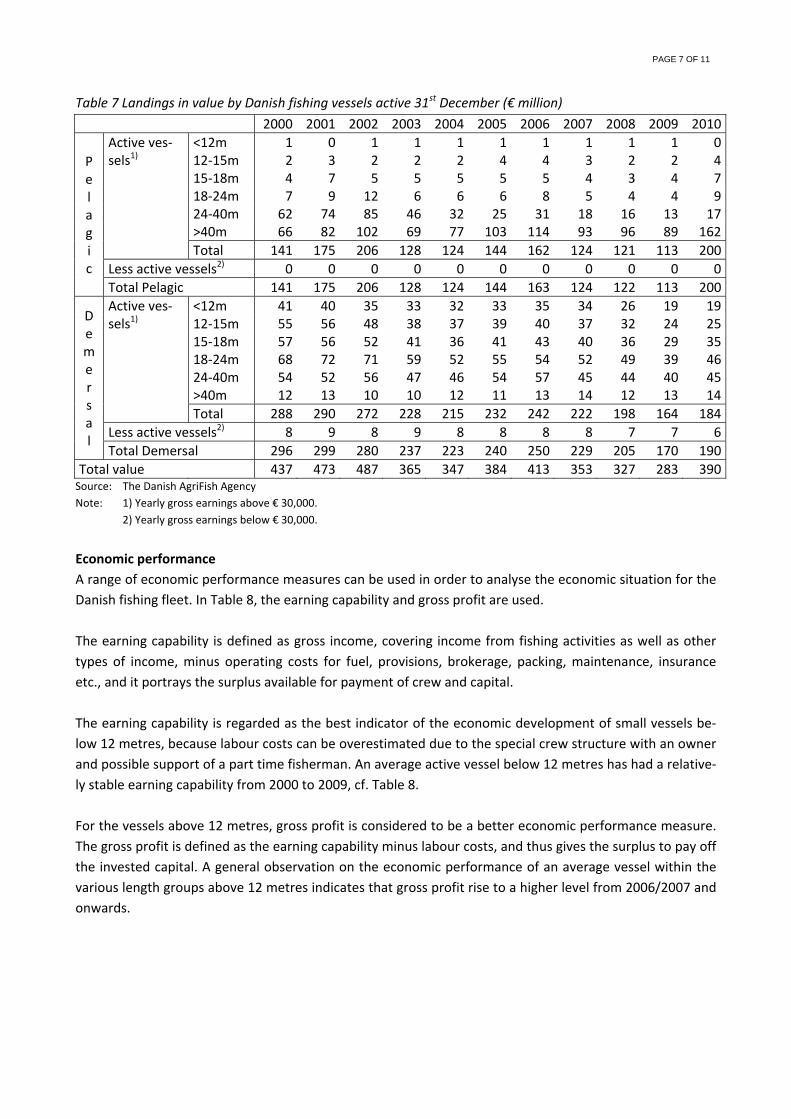
The value of landings has not developed in the same direction as the live weight landings. The total landing value has decreased from € 437 million in 2000 to € 390 million in 2010, cf. Table 7. This lower reduction in value compared to live weight can either be due to an increased price of the landed fish and/or a change in the distribution of the landed fish towards more valuable fish.
PAGE 7 OF 11
Table 7 Landings in value by Danish fishing vessels active 31st December (€ million) 2000 2001 2002 2003 2004 2005 2006 2007 2008 2009 2010
P e l a g i c
Active ves-sels1)
<12m 1 0 1 1 1 1 1 1 1 1 012-15m 2 3 2 2 2 4 4 3 2 2 415-18m 4 7 5 5 5 5 5 4 3 4 718-24m 7 9 12 6 6 6 8 5 4 4 924-40m 62 74 85 46 32 25 31 18 16 13 17
>40m 66 82 102 69 77 103 114 93 96 89 162 Total 141 175 206 128 124 144 162 124 121 113 200Less active vessels2) 0 0 0 0 0 0 0 0 0 0 0Total Pelagic 141 175 206 128 124 144 163 124 122 113 200
D e m e r s a l
Active ves-sels1)
<12m 41 40 35 33 32 33 35 34 26 19 1912-15m 55 56 48 38 37 39 40 37 32 24 2515-18m 57 56 52 41 36 41 43 40 36 29 3518-24m 68 72 71 59 52 55 54 52 49 39 4624-40m 54 52 56 47 46 54 57 45 44 40 45>40m 12 13 10 10 12 11 13 14 12 13 14Total 288 290 272 228 215 232 242 222 198 164 184
Less active vessels2) 8 9 8 9 8 8 8 8 7 7 6Total Demersal 296 299 280 237 223 240 250 229 205 170 190
Total value 437 473 487 365 347 384 413 353 327 283 390Source: The Danish AgriFish Agency Note: 1) Yearly gross earnings above € 30,000. 2) Yearly gross earnings below € 30,000.
Economic performance A range of economic performance measures can be used in order to analyse the economic situation for the Danish fishing fleet. In Table 8, the earning capability and gross profit are used. The earning capability is defined as gross income, covering income from fishing activities as well as other types of income, minus operating costs for fuel, provisions, brokerage, packing, maintenance, insurance etc., and it portrays the surplus available for payment of crew and capital. The earning capability is regarded as the best indicator of the economic development of small vessels be-low 12 metres, because labour costs can be overestimated due to the special crew structure with an owner and possible support of a part time fisherman. An average active vessel below 12 metres has had a relative-ly stable earning capability from 2000 to 2009, cf. Table 8. For the vessels above 12 metres, gross profit is considered to be a better economic performance measure. The gross profit is defined as the earning capability minus labour costs, and thus gives the surplus to pay off the invested capital. A general observation on the economic performance of an average vessel within the various length groups above 12 metres indicates that gross profit rise to a higher level from 2006/2007 and onwards.

PAGE 8 OF 11
Table 8 Key economic indicators for an average active vessel (€ 1,000) 2000 2001 2002 2003 2004 2005 2006 2007 2008 2009 <12 m Gross income 71 74 75 79 67 75 81 93 88 74
Operating costs 28 28 29 31 29 33 33 40 44 40Earning capability 43 46 45 48 38 43 48 53 44 35Labour costs 55 53 52 55 48 46 50 53 55 50
Gross profit -12 -7 -7 -7 -11 -3 -3 0 -12 -1512-15 m Gross income 152 158 150 147 134 157 184 206 200 159
Operating costs 62 61 59 61 58 68 77 88 94 82Earning capability 90 98 90 86 76 89 107 118 107 78Labour costs 86 90 84 87 77 82 87 84 87 76
Gross profit 4 7 7 -1 -1 7 20 35 20 215-18 m Gross income 271 267 260 230 231 270 315 370 329 299
Operating costs 109 103 101 99 104 110 121 146 148 137Earning capability 163 164 159 131 126 160 194 224 181 162Labour costs 137 135 129 122 124 134 145 161 143 131
Gross profit 26 29 30 9 2 26 48 63 38 3118-24 m Gross income 375 374 408 393 335 395 487 584 593 495
Operating costs 159 148 154 167 162 179 208 230 275 224Earning capability 216 226 255 226 173 216 279 353 318 271Labour costs 180 171 188 191 155 180 202 223 217 198Gross profit 36 55 66 35 17 36 77 130 101 73
24-40 m Gross income 818 919 1,023 739 679 799 1,111 1,106 1,200 1,188Operating costs 432 425 422 395 392 446 538 553 648 572Earning capability 386 494 600 343 288 353 573 553 552 617Labour costs 273 317 350 259 244 274 340 325 368 375
Gross profit 114 177 251 84 43 79 234 228 184 242>40 m Gross income 1,447 1,915 2,391 1,667 1,816 2,757 3,222 2,622 3,605 3,259
Operating costs 726 752 798 771 844 1,005 1,095 934 1,249 1,111Earning capability 720 1,163 1,593 897 973 1,752 2,127 1,688 2,357 2,148Labour costs 419 560 699 480 519 673 762 619 767 753
Gross profit 301 603 894 417 454 1,079 1,366 1,068 1,590 1,395Source: The Danish Fishery Account Statistics, Statistics Denmark. Note: Includes only active vessels with a value of landings above a yearly threshold.
Investments The average yearly investments in fishery assets such as vessel, hull, engines, winches, electronics, fishing gear etc. are shown in Table 9. Comparing the period before 2006 with the period after, a shift is generally observed towards a higher level of investments. For the vessels above 40 metres, this shift becomes evi-dent already from 2004.

PAGE 9 OF 11
Table 9 Investments in fishery assets for an average active vessel (€ 1,000) 2000 2001 2002 2003 2004 2005 2006 2007 2008 2009 <12m 10 10 9 11 7 11 9 6 20 14 12-15m 19 15 19 13 15 9 60 36 43 7 15-18m 26 14 2 35 22 17 40 144 161 46 18-24m 60 54 43 69 11 21 66 119 138 187 24-40m 182 141 118 73 64 54 232 432 60 407 >40m 520 214 356 892 2,122 2,317 2,403 1,972 1,906 775
Source: The Danish Fishery Account Statistics, Statistics Denmark. Note: Includes only active vessels with a value of landings above a yearly threshold.
Distribution of fishing rights The transferability of fishing rights became possible from 2003 for pelagic and from 2007 for demersal spe-cies. The transferability is possible at two levels: 1) as a permanent transfer of quota shares between ves-sels, or 2) as an in-year transfer (lease) of vessel quotas between vessels. The development in transfers of shares illustrates the longer term development in the fleet, and the devel-opment in the allocation of these is shown in Table 10. The demersal species are primarily caught by vessels below 40 metres, while the pelagic species are caught by the vessels above 40 metres. Inactive vessels also have some shares, which are leased to other vessels typically within pools. Inactive vessels also have trans-ferable quota shares. These are not transferred to other vessels due to various legal restrictions on transfer possibilities to avoid concentration as well as restrictions related to primarily the North Sea cod recovery plan. However, these inactive vessels must be owned by active fishermen. The vessels quotas allocated to these inactive vessels are transferred to other vessels, which land the fish. Table 10 Relative distribution of transferable quota shares (%), 31st December Demersal species Pelagic species
1/1-2007 2007 2008 2009 2010
1/1-2007 2007 2008 2009 2010
Active vessels1)
<12m 11 10 8 7 7 1 2 1 0 012-15m 15 12 12 11 11 6 4 2 3 3
15-18m 16 12 12 13 14 15 12 7 6 6 18-24m 19 17 17 19 20 8 7 6 5 5 24-40m 29 26 27 27 30 16 14 11 8 8 >40m 1 2 1 1 1 49 54 62 68 70
Total 91 79 77 79 82 96 93 89 90 93Less active vessels2) 2 4 3 5 6 1 3 1 2 2Inactive vessels 7 17 20 15 12 4 4 10 8 5
Source: The Danish AgriFish Agency. Note: 1) Yearly gross earnings above € 30,000. 2) Yearly gross earnings below € 30,000.
Table 10 shows the overall development in the allocation of vessel quota shares. As fishing vessels can swap and lease fish to other vessels, the distribution of quota share is not straight forward comparable with the distribution of live weight landings in Table 6. This discrepancy is furthermore enhanced by the possibil-ity of being member of a pool. Table 11 shows how many vessels are actually a member of a pool. Approx-imately two-thirds of the active vessels were members in 2010. The pools have been attractive for the fish-

PAGE 10 OF 11
ermen to join, because it increases their flexibility. The two largest pools had more than 250 members each in 2010. Table 11 Number of vessels being member of a pool, 31st December 1/1-2007 2007 2008 2009 2010 Active vessels1) <12m 142 123 135 129 135
12-15m 143 125 130 136 136 15-18m 114 89 88 94 94 18-24m 98 87 83 80 82
24-40m 84 71 52 45 42 >40m 39 41 22 22 21 Total 620 536 510 506 510 Less active vessels2) 32 51 51 107 102 Inactive vessels 22 79 105 107 93 Total number of vessels 674 666 666 720 705
Source: The Danish AgriFish Agency. Note: 1) Yearly gross earnings above € 30,000. 2) Yearly gross earnings below € 30,000.
Table 12 shows that around 80% of the quota shares are now related to vessels in a pool. There is no obli-gation to register in-year quota transfers taking place within a pool in the public databases. However, based on information from pool administrators, there is a considerable amount of transfers within the pools, thus giving rise to improved profitability and possibly reduced discards of the vessels. Table 12 Distribution of quota shares between vessels in and not in a pool, 31st December
1/1-2007 2007 2008 2009 2010In pools 66 81 80 80 80Not in pools 34 19 20 20 20
Source: The Danish AgriFish Agency.
The coastal fisheries scheme The number of vessels classified as a coastal vessel and thus a part of the coastal fisheries scheme is shown in Table 13. Vessels joining the scheme are obliged to participate for three years. Thus the sudden reduc-tion in the total number of coastal vessels observed from 2009 to 2010 was due to a new application pro-cess. However, the share of coastal vessels out of the total fleet has been stable around 10-11%, when comparing the total number of vessels in Table 1 and Table 12. The share of active coastal vessels out of the total number of active vessels has on the other hand been reduced a bit from 35% in 2007 to 30% in 2010.

PAGE 11 OF 11
Table 13 Number of vessels participating in the coastal fisheries scheme, 31st December 2007 2008 2009 2010 Active vessels1) <12m 187 163 131 114
12-15m 95 91 83 77 15-18m 21 23 23 25
Total 303 277 237 216 Less active vessels2) 38 55 82 57 Inactive vessels 11 13 27 18 Total number of vessels 352 345 346 291
Source: The Danish AgriFish Agency. Note: 1) Yearly gross earnings above € 30,000. 2) Yearly gross earnings below € 30,000.
The vessels participating in the coastal fisheries scheme have at the overall level had a more or less un-changed share of the vessel quota shares of demersal species and doubled their share of pelagic species, but from a low level, cf. Table 14. Table 14 Distribution of quota shares between vessels participating in the coastal fisheries scheme and not, 31st December
Demersal Pelagic 2007 2008 2009 2010 2007 2008 2009 2010
Coastal vessels 18 18 19 17 2 2 3 4Non-coastal vessels 82 82 81 83 98 98 97 96
Source: The Danish AgriFish Agency.