daniel albalate del sol (universitat de barcelona
TRANSCRIPT

Road safety determinants: do institutions matter?
Daniel Albalate del Sol (Universitat de Barcelona) Anastasiya Yarygina (Chicago Harris, Public Policy, The University of Chicago)
CÀTEDRA PASQUAL MARAGALL D’ECONOMIA I TERRITORI
COL·LECCIÓ DE DOCUMENTS DE TREBALL
Entitat col·laboradora:
WORKING PAPER 03/2015

1
Road safety determinants: do institutions matter?
1. INTRODUCTION
In 2010 the United Nations General Assembly adopted resolution 64/255 declaring 2011–2020
the Decade of Action for Road Safety with the main goal of stabilizing and then reducing the level of
road traffic fatalities (United Nations, 2010). Support for this action from the world’s governments
reflects the growing awareness that road traffic accidents and fatalities constitute a global public
health problem. In short, the fact that 1.24 million people lost their lives on the roads in 2010 (World
Health Organization [WHO], 2013a) and that traffic injuries were the eighth leading cause of death
globally (Lozano et al., 2012) can no longer be overlooked.
The problem is particularly alarming in low- and middle-income countries. According to the
WHO, 92% of deaths on roads in 2010 occurred in such countries, although they concentrate just 53%
of the world’s vehicle fleet (WHO, 2013a). The number of fatalities among vulnerable road users (i.e.,
pedestrians, motorcyclists and cyclists) is also higher in low- and middle- income countries. In
addition, road traffic crashes are associated with high economic costs that seem to hit developing
economies hardest, with 59% of fatalities occurring among adults who are often the family’s sole
breadwinner. A study conducted in Bangladesh and India1 shows that most families affected by a road
traffic fatality experience a significant decline in household income, often causing them to fall below
the poverty line (Commission for Global Road Safety, 2007). The loss not only affects the victim’s
family, but also puts a burden on the nation, whose overall productivity is affected by the exit from
the labor market of some of its most productive workers. In 2005 the costs of road traffic crashes in
low- and middle-income countries amounted to US$65 billion, while globally the loss was US$518
billion, representing between 1 and 3% of the world’s gross national product (WHO, 2013a, 2013b).
1 A study conducted in 2004 by the Transport Research Laboratory commissioned by the Global Road Safety
Partnership. Available at www.grsproadsafety.org

2
Although some of these losses are unavoidable, many are preventable. Today, road safety is
generally assumed to be the shared responsibility of governments and civil society, but reducing the
burden of traffic accidents still falls largely on the state authorities. There is substantial evidence from
studies of road safety and its determinants to show that governments can play an active role. Taking
their lead from Nilsson (2002), for instance, Elvik, Høye, Vaa, and Sørensen (2009) identify 128 road
safety measures which governments can use to enhance road safety. These measures address all
aspects of road systems and allow ample scope for action in the public sector, where road authorities
can be joined by other public institutions – including the health authorities (hospitals, ambulance
services), the police force and education authorities – in the provision of road safety. Indeed, public
sector policymakers can be viewed as “producers of traffic safety”, which in turn can be characterized
as a public good that is “consumed by the general public” (Maier, Gerking, & Weiss, 1989). It is
reasonable, therefore, to suppose that if a set of factors has a significant impact on a government’s
provision of public goods, these factors should also influence the provision of road safety as a public
good.
The research also shows that the quality and quantity of public goods vary systematically
according to a country’s political institutions and economic policy. On the one hand, theoretical
research on economic policy outcomes has developed and empirically tested several models on how
electoral rules and forms of government influence the size and composition of government spending.
The models presented by Lizzeri and Persico (2001), Milesi-Ferretti, Perotti, and Rostagno (2002), and
Persson and Tabellini (2000) predict that governments elected by proportional representation are
more likely to implement public spending programs that benefit large groups of the population. In
their theoretical research on the impact of different forms of government on public spending,
Persson, Roland, and Tabellini (2000) develop a formal model which predicts that presidential regimes
lead to smaller governments and less redistribution than is the case under parliamentary
democracies. These predictions are empirically tested by Persson and Tabellini (2004), who find that

3
electoral rules and forms of government shape the size and composition of government spending.
More evidence supporting the theoretical priors is provided in Persson and Tabellini (2003).
Additionally, research on government spending and the provision of public goods under
dictatorship and democracy finds that democratization generally has a significant impact on public
outlay. McGuire and Olson (1996), among others, predict higher levels of public good provision under
democracies than under dictatorships and Bueno De Mesquita, Smith, Siverson, and Morrow (2003),
Deacon (2009), Lake and Baum (2001) present empirical evidence to support this, although Mulligan,
Gil, and Sala-i-Martin (2004) find no significant difference in the provision of social and economic
policies under the two types of regime.
The impact of democratic institutions on policy outcomes can be particularly important in
developing countries, whose political institutions have undergone significant transformations in
recent decades: less than 10% of low-income and only one third of middle-income countries were
democracies in 1975 (Figure 1), while these percentages increased to more than 80% by 2009. The
institutional changes brought about by democratization have led to significant modifications in their
systems of governance and have had a marked impact on different aspects of the public sector.
<<Insert Figure 1 about here >>
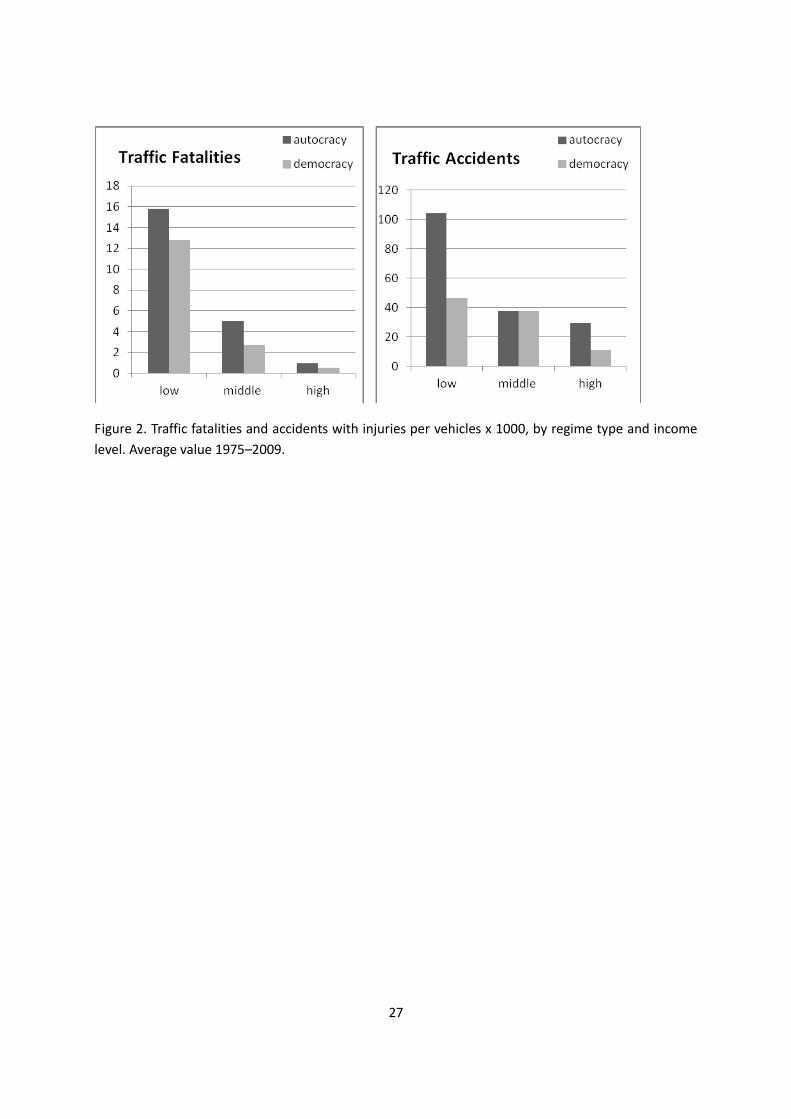
Road safety is one of the outcomes that appears to have benefited from this democratization
process: the evidence in Figure 2 shows that democratic institutions are associated with better road
safety, which suggests that research should be conducted into the role of institutions and the causal
links between democratization and road safety.
<<Insert Figure 2 about here >>
To date, few academic studies have addressed the relationship between institutions and road
safety outcomes. Anbarci, Escaleras, and Register (2006) analyzed the association between public
sector corruption and traffic fatalities. Grimm and Treibich (2010) used indices of institutional quality
to study the effect of income on variability in traffic fatalities. Law, Noland, and Evans (2009)
4
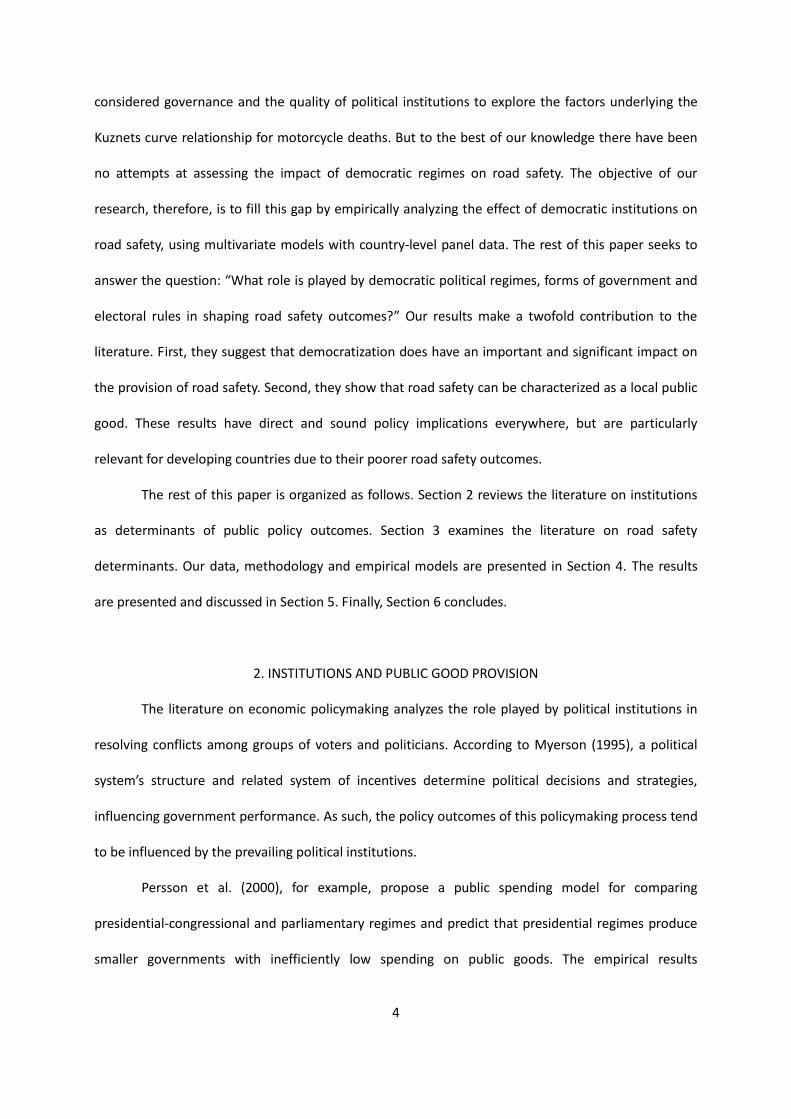
considered governance and the quality of political institutions to explore the factors underlying the
Kuznets curve relationship for motorcycle deaths. But to the best of our knowledge there have been
no attempts at assessing the impact of democratic regimes on road safety. The objective of our
research, therefore, is to fill this gap by empirically analyzing the effect of democratic institutions on
road safety, using multivariate models with country-level panel data. The rest of this paper seeks to
answer the question: “What role is played by democratic political regimes, forms of government and
electoral rules in shaping road safety outcomes?” Our results make a twofold contribution to the
literature. First, they suggest that democratization does have an important and significant impact on
the provision of road safety. Second, they show that road safety can be characterized as a local public
good. These results have direct and sound policy implications everywhere, but are particularly
relevant for developing countries due to their poorer road safety outcomes.
The rest of this paper is organized as follows. Section 2 reviews the literature on institutions
as determinants of public policy outcomes. Section 3 examines the literature on road safety
determinants. Our data, methodology and empirical models are presented in Section 4. The results
are presented and discussed in Section 5. Finally, Section 6 concludes.
2. INSTITUTIONS AND PUBLIC GOOD PROVISION
The literature on economic policymaking analyzes the role played by political institutions in
resolving conflicts among groups of voters and politicians. According to Myerson (1995), a political
system’s structure and related system of incentives determine political decisions and strategies,
influencing government performance. As such, the policy outcomes of this policymaking process tend
to be influenced by the prevailing political institutions.
Persson et al. (2000), for example, propose a public spending model for comparing
presidential-congressional and parliamentary regimes and predict that presidential regimes produce
smaller governments with inefficiently low spending on public goods. The empirical results

5
corroborate that the size of government is smaller under presidential regimes. Persson and Tabellini’s
(2000) model is based on the trade-off a candidate faces when making a binding promise to supply a
public good that benefits everyone (“universal” spending) or to target redistribution to a specific
group or groups (“targetable” spending). The model predicts that parliamentary systems and
proportional elections help produce spending programs that allocate revenues more evenly to broad
and stable groups of the population. The model presented by Milesi-Ferretti et al. (2002) examines
the trade-off that elected representatives face between allegiance to geographic constituencies and
social constituencies, predicting that in proportional systems voters elect representatives prone to
spending on transfers, while in majoritarian systems voters elect candidates prone to (local) public
good spending. Their empirical results support the theoretical priors of the model. A further
theoretical contribution is made by Lizzeri and Persico (2001), in whose politico-economic model
office-seeking candidates face a trade-off between allocating public money to public goods or to
pork-barrel projects. The model predicts that the proportional system is more efficient when the
public good is very valuable and the winner-take-all system is more efficient when it is not very
valuable. The empirical results of Persson and Tabellini (2003) suggest that presidential regimes have
smaller governments than parliamentary regimes, and that majoritarian elections induce smaller
governments, generate less welfare spending and smaller deficits than those resulting from
proportional elections. Similar results are obtained in Persson and Tabellini (2004), who find that
majoritarian elections lead to smaller governments and smaller welfare programs, while presidential
regimes induce smaller governments than parliamentary democracies. Albalate, Bel, and Elias (2012)
analyze the effect of democratization and the impact of electoral rule and form of government on
national defense, finding that military spending is greater in presidential democracies with
majoritarian electoral rule.
Another strand of the literature on political institutions compares the provision of public
goods under authoritarian and democratic regimes. Mulligan et al. (2004) find no significant

6
differences in policy outcomes in economically similar democracies and non-democracies. Stroup
(2007) finds that governments with more democratic freedoms do not necessarily generate public
policy that effectively provides public goods. However, the theoretical literature generally predicts
that fewer resources are allocated to public good provision under dictatorial regimes than under
democracies, and this is supported by the empirical papers. For instance, Lake and Baum (2001)
construct and empirically test a theoretical model in which states are conceived as natural
monopolies for public service provision and they find that fewer public services are provided under
dictatorships. In the same vein, Deacon (2009) adapts a model of probabilistic voting to analyze the
allocation of a government budget between a public good and transfers under dictatorship and
democracy. Deacon’s prediction that the level of public good provision is lower in dictatorships than
in democracies is supported by results from his empirical analysis. Ghobarah, Huth, and Russett
(2004) analyze the effect of political institutions on the level of public health expenditure and on
health outcomes, finding that democracy is associated with higher total health spending. Profeta,
Puglisi and Scabrosetti (2013) analyze the impact of democracy on military spending, finding an
inverted U-shaped relationship between defense expenditure and the strength of democratic
institutions. Finally, in the literature on the political economy of investment, Saiz (2006) finds that
dictatorships invest more in road quality and quantity.
All in all, our literature review yields sound empirical evidence that the level of public good
provision depends on a country’s political institutions, making it reasonable to suppose that the
provision of road safety as a public good will vary across countries governed by different political
institutions. First, the literature suggests that authoritarian regimes provide fewer public goods, and
we would therefore expect authoritarian countries to have poorer road safety outcomes. Second,
presidential democracies with majoritarian electoral rule are found to have smaller governments and
spend less on public goods than do parliamentary democracies with proportional electoral systems.
We expect countries with presidential systems and majoritarian electoral rule to have higher numbers

7
of traffic accidents and fatalities. We test these hypotheses with a multivariate model which controls
for institutional variables and other road safety determinants. The following section reviews the
literature on these factors.
3. RESEARCH ON ROAD SAFETY DETERMINANTS
Much of the academic work on road safety focuses on the effectiveness of road safety
measures that neutralize and diminish the risk factors of traffic accidents, injuries and fatalities. Three
main groups of measures – user-associated measures, concerned with road-user behavior; vehicle-
related measures, aimed at improving vehicle safety; and road infrastructure-related measures – are
commonly explored in the literature. The research concerned with road-user behavior and in-car
safety analyzes the impact of traffic regulations and their enforcement, while the literature on road
infrastructure-related measures assesses the effects of road characteristics and traffic conditions.
Among recent studies evaluating the implementation and enforcement of regulatory
measures, many papers evaluate the effect of speed limit modification. They report mixed results and
suggest that the effect of speed limit modifications is uneven and may be divergent for different
groups of drivers (for example, see Dee & Sela, 2003; Tay, 2009). The effectiveness of seat belt laws is
also extensively analyzed. Carpenter and Stehr (2008) and Cohen and Einav (2003) find that seat belt
usage has a positive impact on road safety, while other papers (e.g., Derrig, Segui-Gomes, Abtahi, &
Ling-Ling, 2002) find little or no evidence of safety belt effectiveness. The restrictive regulation of
blood alcohol limits is generally found to be effective in improving road safety (see, amongst others,
Albalate, 2008; Kaplan & Prato, 2007). This positive effect on road safety does not hold for the
mandatory periodic motor vehicle inspection (see Christensen & Elvik, 2007; Sutter & Poitras, 2002).
Studies on the impact of road infrastructure usually report mixed results and seem to be
dependent on particular cases and on the variables taken into account (Albalate et al., 2012). For
instance, Anastasopoulos, Tarko, and Mannering (2008), Flahaut (2004), Park, Carlson, Porter, and

8
Andersen (2012), all find positive effects of better quality roads (broader lane-width, larger number of
lanes, better paving, median strips and shoulders), while the results obtained by Noland (2003)
undermine the hypothesis that improvements in road infrastructure effectively reduce fatalities and
injuries. This divergence seems to be mostly due to the strength of the Peltzman effect (Peltzman,
1975), where drivers respond to improved safety measures by taking greater risks and so offset the
effectiveness of the improved road infrastructure. Many studies (e.g., Haynes et al., 2008) also report
that traffic conditions constitute an important determinant of road safety.
Another strand of literature on the determinants of road safety investigates the effect of
socioeconomic variables. Some of these studies also consider the effect of institutions. For instance,
the research by Jacobs and Cutting (1986) explores the relationship between the fatality rate and
socio-economic and physical characteristics of developing countries such as per capita GDP, the
number of circulating vehicles, road density, vehicle density, population per physician and population
per hospital bed. It finds that the variable that has the greatest impact on the number of fatalities is
vehicle ownership, and that per capita GDP, vehicle density and population per hospital bed are
contributing factors.
In their research on the relationship between traffic fatalities and economic development,
Anbarci et al. (2006) find that a decrease in public sector corruption reduces traffic deaths, and that
the number of fatalities increases in income up to a threshold of US$15,000 and then decreases.
These results are obtained for a cross-country panel data set where the variation in the number of
road traffic fatalities is explained by the level of public sector corruption and other socio-economic
variables (per capita GDP, illiteracy and fatality rates, motorization, population structure).
Another analysis of the effect of economic growth on traffic fatalities in low- and high-income
countries is conducted in Bishai, Quresh, James, and Ghaffar (2006). The findings show that in low
income countries per capita GDP growth is associated with an increase in traffic crashes, injuries and

9
deaths, while in high income countries the increase in per capita GPD lowers the number of traffic
fatalities but does not alter the number of crashes and injuries.
Law et al. (2009) also estimate the relationship between per capita income and traffic
fatalities investigating the Kuznets curve relationship for motorcycle deaths. Using political rights and
corruption indices as proxies for governance and the quality of political institutions, the authors find
an inverted U-shaped relationship between motorcycle deaths and per capita income. They also find
that the implementation of road safety regulations and the improvement of institutional quality,
medical care and technology significantly reduce motorcycle deaths.
According to Grimm and Treibich (2010), the results of the inverted U-shaped relationship
between income and traffic fatalities must be interpreted with caution. They suggest that income is a
proxy for such factors as road network quality, the degree of motorization and the implementation
and enforcement of regulations, and that it affects road safety through channel variables such as
population and traffic density, risk-taking behavior or alcohol consumption. They find that the U-
shaped relationship between income and road traffic fatalities does not hold when the effect of
income on the variability of fatalities is disentangled from the effect of the channel variables. Neither
does the effect of income seem significant in explaining the variation in fatalities within high- and
low-income countries.
Vereeck and Vrolix (2007) also argue that per capita income must be treated as a complex
indicator that comprises several factors: the average age of the vehicle fleet, road construction and
maintenance, education level and economic conditions. Controlling for these factors and for traffic
exposure, population characteristics and alcohol consumption, the authors explore how social
willingness to comply with the law affects driver behavior and traffic fatalities. They find that social
willingness to comply is an important factor and that this matters more to drivers than the content of
the legal rule (legal specificity).

10
From this literature review we can conclude that there is a consensus on the set of factors
that are most relevant to road safety: traffic exposure, road infrastructure characteristics, socio-
economic variables, traffic regulation and driver behavior.2 The aim of our research is to implement a
model to predict cross-country road safety variability using these safety factors and a further set of
explanatory variables associated with democratic institutions. To our knowledge, this is the first time
this kind of modeling has been conducted.
4. DATA AND METHODOLOGY
To analyze the relationship between institutions and road safety we employ a panel of annual
country data. The panel includes data for 138 countries over 35 years (1975-2009). These data
comprise information on traffic fatalities, accidents with injuries, institutional variables and other
controls (road network quality, traffic exposure and socio-economic variables). A summary of the
descriptive statistics is provided in Table 1 and detailed information on our variables and data sources
is given in Table 2. Unfortunately, the total number of observations in our analysis has been reduced,
due to missing values, so we have to deal with an unbalanced data set.
<<Insert Tables 1, 2 about here >>
We employ Hausman’s (Hausman, Bronwyn, & Griliches, 1984) negative binomial regression
model, a specification that has been shown to yield a good fit for the analysis of count data, such as
the number of traffic accidents and fatalities, and which has become the most frequently used
specification in crash-frequency modeling (Lord & Mannering, 2010). Negative binomial estimators
are more efficient than Poisson estimates because they control for the overdispersion commonly
present in count data (Cameron & Trivedi, 2009). The descriptive statistics of our dependent variables
reported in Table 3 show that the unconditional means of fatality and accident counts are much lower
2 A detailed study of the effects of a range of different factors on road safety can be found in Bester (2000).

11
than their variance, which indicates the presence of overdispersion and suggests that the negative
binomial model is an appropriate specification.
<<Insert Table 3 about here >>
The reasonable within- and between-variability of all the dependent variables (Table 3)
facilitates the use of the conditional fixed-effects negative binomial model. This model allows for the
correlation between common unobserved effects and the dependent variables, and overcomes the
problem of omitted variable bias by collecting all the time-invariant information omitted in the fixed
effects. The random-effects model may also be used, but it gives inconsistent estimates if shared
unobserved effects are correlated with the regressors. In our analysis we employ both fixed- and
random-effects specifications. The coefficient estimates obtained are consistently robust as regards
their sign and, with some exceptions, their significance.
We estimate two models. Model 1 (Eq. 1) is employed for the full sample. Here we assess the
effect of democratization on road safety. Model 2 (Eq. 2) is an extended model, in which we
incorporate institutional variables that identify two specific traits of democracies: the electoral rule
and the form of government. Model 2 is, therefore, estimated only for democratic countries and
examines the effect of the traits of democracy on road safety.
Ln(λit)=ln(vehkmit) + δLeveldemocit + βXit + TEt + si + εit (1)
Ln(λit)=ln(vehkmit) + δ1Leveldemocit + δ2Presidentialit+ δ3Majorit+ βXit + TEt + si + εit (2)
where i=1,…N; t=1….Ti
The dependent variable λit is the expected value of Yit and Var(Yit ) = λit (1+ai) where ai is the
rate of overdispersion for each country. Yit is either the number of traffic fatalities (fat) or the number
of traffic accidents resulting in injuries (accinj). We implement these two variables to identify two
dimensions of road safety: the severity of accidents captured by the fatality counts, and a broader
measure captured by the number of accidents.

12
Eq. (1) is estimated for the full sample of countries and the institutional variable considered
here is leveldemoc. It takes values from 1 to 7, where 1 is given to the least democratic countries and
7 to the most democratic countries3. Eq. (2) is estimated for democratic countries only (leveldemoc
equal to 6 or 7) and, in addition to the leveldemoc institutional variable, the model employs
Presidential and Major binary variables. These variables take a value of one, respectively, if the
democracy is presidential and if the electoral rule is majoritarian. Otherwise, they take a value of
zero.
Vector Xit collects (1) the time-varying controls related to the quality of the road network, i.e.,
the density of the road network (density), the share of motorways (sharemw) and the share of paved
roads (paved)4, and (2) the socio-economic time-varying controls, i.e., the logarithm of per capita GDP
(lgdppc), the growth of per capita GDP (grthgdppc), the urban population concentration (urbrate) and
the share of people over 65 years old (pop65up).
TEt is a vector of variables related to time effects. First, we introduce a general time trend
(trend) for all countries in order to account for the time patterns affecting road safety. Then, we
replace the general trend with three different time trends: for low-income countries (trendl), middle-
income countries (trendm) and high-income countries (trendh), to control for possible divergent time
patterns between countries of different income levels. In the second model we introduce year-
specific dummy variables for the first ten years following democratization to quantify the dynamics of
the process.
N is the number of countries, Ti is the year for the i-th country and εit is the error term. In the
fixed-effect specification si denotes either a country-specific fixed or random effect. The parameters
3 See Table 2 for more information on how the leveldemoc variable is constructed
4 Since the sharemw variable has more missing values than paved, we employ paved rather than sharemw in
the second model (estimated only for democratic countries) to maintain a stable number of observations
across the two models.

13
of the model are estimated by the maximum likelihood method. The number of vehicles per km
network (vehkm) is an offset variable5 accounting for the fact that countries with a higher level of
motorization per network kilometer should have more traffic accidents and fatalities. In the
estimation the coefficient of its logarithm is restricted to one.
5. RESULTS
First, we assess the effect of democratic institutions on traffic fatalities and accidents (Model
1). The results are displayed in Tables 4 and 5. Then, we assess the impact of two dimensions of
democracy: the form of government and the electoral rule (Model 2). The results are shown in Tables
6 and 7. In each of these tables (4 through to 7), columns (1) and (2) display the results for fixed - and
random-effects estimations without trend variables, while columns (3) to (4) and (5) to (6) show the
results for fixed- and random-effects estimations with general trend and with three income-specific
time trends, respectively. In Tables 6 and 7, columns (7) and (8) are added to show our results for the
regressions with year-specific dummy variables for the first ten years after countries become
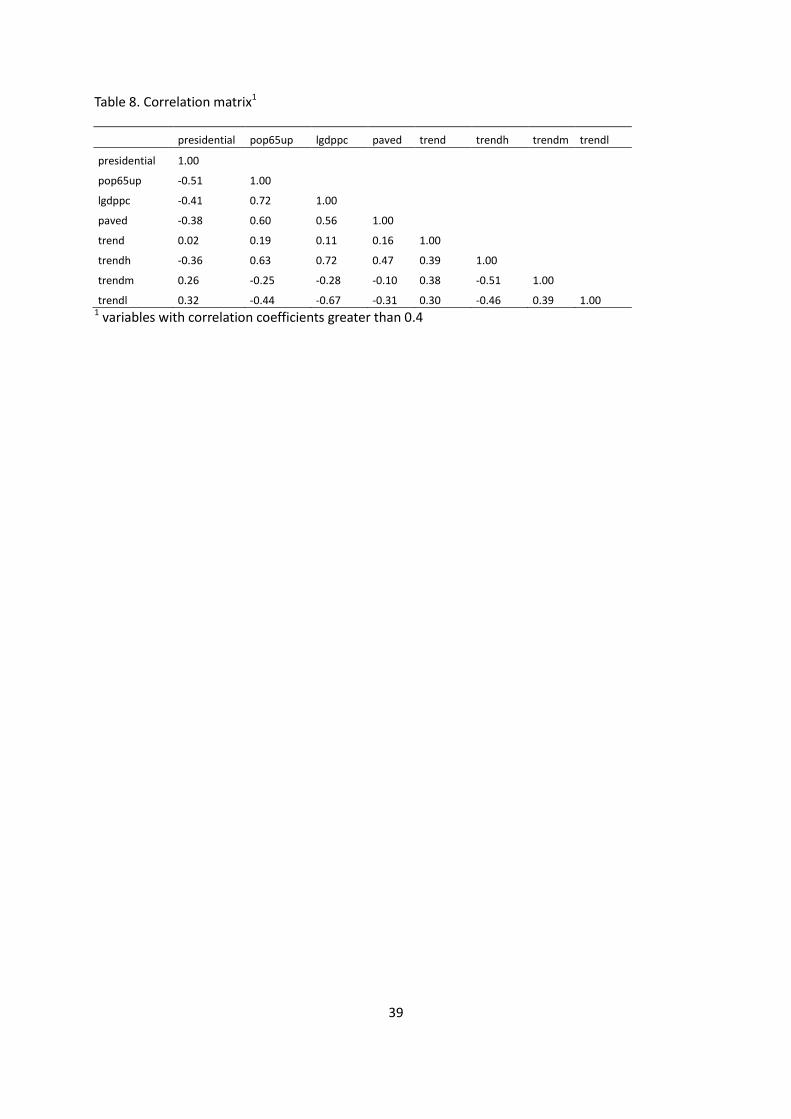
democratic. The pairwise correlation coefficients for the variables with at least one correlation
coefficient higher than 0.40 are reported in Table 8.6
<<Insert Tables 4, 5, 6, 7, 8 about here >>
5 While traffic volume might be better as the offset, the variable available in the IRF’s WRS database has a lot of
missing values. We do not employ it in our final estimations, but we check the consistency of our results by
estimating both models with the traffic volume offset variable. This modification does not substantially alter
our original results.
6 Two variables - pop65up and trendh - show high correlation coefficients. Nonetheless, the estimation of the
Model (1) and (2) excluding these variables showed no significant alteration in coefficient estimates for
other covariates, suggesting the absence of multicollinearity problem.

14
Institutional variables
As expected, democratic institutions have a marked impact on road safety. The coefficient
estimates of the leveldemoc variable are negative across all regressions and statistically significant in
all but one. The negative sign suggests that democracy has a positive effect on road safety.7 This
result is applicable not only to countries in a process of democratic transition but also to established
democracies consolidating their democratic institutions. The results for the traffic accident counts in
the estimation for the full sample are particularly notable because of the high significance (one
percent) of all coefficients. This outcome is in line with the theoretical prediction that more
democratic regimes are associated with higher levels of public good provision.
Our empirical results for the voting system show that the majoritarian voting rule has a
positive effect on road safety, reducing the number of traffic fatalities. This can be interpreted using
the model developed by Persson, Roland, and Tabellini (1999), which draws on the differentiation
between systems of majoritarian and proportional representation based on district magnitude: under
the proportional electoral system there is a single electoral district, while majoritarian systems use
multiple-district elections. The difference in district magnitude across the two systems results in
differences in public good provision: fiercer competition for the marginal district in majoritarian
systems leads to smaller internalization of voter costs and benefits and, hence, to a lower level of
public good provision than in proportional systems. A further theoretical result is offered by Milesi-
Ferretti et al. (2002). In this model, the proportional system voters elect representatives whose
spending satisfies a great variety of interests nationwide, while in majoritarian systems voters elect
candidates committed to local public good spending. Consequently, one explanation for our empirical
7 Instead of leveldemoc we also conduct the estimations with a binary variable which takes a value of one if the
country is democratic and zero otherwise. The coefficient estimates obtained for this variable are
statistically significant and negative, and its inclusion does not qualitatively alter the estimates for other
regressors.

15
findings may be that voters consider road safety to be more properly a local public good, and give
more incentives to increase its provision to politicians elected in majoritarian systems.
Our results for the form of government suggest that there are more traffic accidents in
presidential than in parliamentary democracies. This confirms the prediction that presidential
democracies provide lower levels of road safety as a public good than parliamentary democracies.
The effect on traffic fatalities is not clear, since all but one coefficient estimates for the form of
government are statistically non-significant.
Road infrastructure quality variables
The impact of road network density on both traffic fatalities and accidents is positive and
statistically significant in the Model 1 estimation. The sign of the coefficient indicates that the
number of traffic fatalities and accidents increases with increasing road density, since denser
networks might mean that the greater supply of roads induces greater demand and, hence, more
accidents. The effect is not evident in Model 2, where the coefficient estimates are mostly non-
significant and, on occasions, negative and significant at the five and ten per cent levels.
The effect of the share of paved roads on road safety is beneficial: the sign of the coefficient
estimates for both traffic fatalities and accidents is negative and statistically significant in both
models. This result is largely intuitive since we expect a larger number of paved roads to enhance
road safety.
The coefficient estimates for the share of motorways are positive and statistically significant
in the estimation for traffic fatality counts. This suggests that a larger number of motorways has a
negative effect on road safety, possibly because of the higher demand induced by a greater supply of
better roads and because of the Peltzman effect (see explanation in Section 3 above). The estimations
for the accident counts yield negative and statistically significant coefficients when time trends are
not considered and positive and significant coefficients when the three income-specific trends are
16
included. This may be explained by the significance of the time trends, which capture the
improvement in road infrastructure technology.
Socio-economic variables
The concentration of population in urban areas displays a significant negative effect on road
safety across both models. This result is consistent with the literature, which reports a higher relative
risk of accidents with injuries in urban areas (Elvik et al., 2009). The increase in per capita GDP seems
to have a negative effect on road safety by increasing the number of traffic fatalities. However, the
coefficient is significant only in the regressions without time trends in Model 1 and without income-
specific time trends in Model 2, which may be explained by higher rates of motorization leading to
more traffic crashes and deaths in developing economies. The negative and statistically significant
coefficient estimates for the income-specific control variable suggest that high income countries
experience fewer accidents and fatalities from traffic crashes. The result for the elderly population
control variable presents a positive sign in estimations for traffic accident counts. In the estimations
for fatality counts without time trends the greater proportion of elderly people results in fewer
fatalities. When the time trends are included, the coefficient estimates become either positive and
statistically significant or non-significant. This change may be explained by the significance of the time
trends, which capture the improvement in medical technology that is essential for the post-crash
medical care associated with a smaller number of deaths caused by traffic accidents.
Trends and time effect variables
The general time trend and the trends for high- and middle-income countries are negative
and statistically significant across both models. The negative signs of the coefficient suggest that
growing public awareness of road safety and improvements in technology have a very clear and
positive effect on road safety. This positive dynamic seems to occur only in high-income countries,

17
since the coefficient estimates for the low-income countries are non-significant in the estimations for
fatality counts and positively significant in the estimations for accident counts. The notable difference
between the coefficient estimates associated with the time trends for middle- and high-income
countries8 supports the conclusion that the richer the country, the greater the rewards of improved
road safety. In addition, the significance of the time trends may show that road safety benefits from
other important factors not included in our regressions. This is important for our analysis, since we
cannot rely on either regulation or enforcement variables. The favorable effect of traffic laws on road
safety can be captured by significant time trends.
Interesting results are obtained for the timing effects of democratization on road safety. Our
analysis is similar to analyses on democratic transitions and economic growth (Papaioannou &
Siourounis, 2008), and to the literature assessing the lag in effectiveness of road safety regulations
(e.g., Albalate, 2008; or Eisenberg, 2003). The dynamics of the timing effects are shown in Figures 3
and 4. They suggest that (1) a country’s transition from autocratic to democratic regime leads to a
decrease in the number of traffic fatalities and accidents; (2) there is a delay of four years before
democratization starts to have a significant effect on road safety; (3) considering the sizes of
coefficients, the impact of democratization becomes greatest in the sixth year of the country’s
transition.
<<Insert Figures 3, 4 about here >>
6. CONCLUSIONS
International institutions and national governments alike recognize that the deaths and
injuries resulting from road traffic accidents are a major public health concern, above all in low- and
8 Our tests find that the difference between coefficient estimates associated with the high- and middle-income
trend variables is statistically significant.

18
middle-income countries. Although some of these losses are unavoidable, many are preventable.
Today, reducing the burden of traffic accidents falls largely on the state authorities and, in this regard,
governments can be seen as producers, and the general public as consumers, of road safety as a
public good. Drawing on the results from the research on political institutions and economic policy,
which indicate that public good provision varies systematically with the political institutions allocating
public revenues, we argue that the level of provision of road safety is likewise influenced by the
prevailing political institutions.
The descriptive statistics presented in the introduction to this paper and the results of our
empirical study show that political institutions do play an important role in determining the toll of
traffic accidents and fatalities. Above all, our results suggest that lower rates of fatalities and
accidents are associated with democracies, and that the process of democratization has a beneficial
and significant effect on road safety. Democratization would therefore seem to be an important
process for stabilizing and then reducing the level of road traffic fatalities. However, we find that
democratization does not have an immediate impact, it requiring around four years for its effects to
start to become statistically noticeable. This suggests that democratic institutions need time to set up
the bodies and implement the policies that produce better road safety outcomes. Yet, having said
this, it is surprising just how quickly the effects become statistically significant. Interestingly, not only
the beneficial effects of democratization apparent in countries making the transition to democracy,
but they are also discernible in established democracies that are consolidating their political
institutions.
The impact of democratic institutions on road safety is particularly significant in the low- and
middle-income countries that were at the epicenter of the democratization process which took place
in the last decades of the twentieth century. Yet, their performance in this area still leaves much to be
desired. Reports issued by the international institutions claim that low- and middle-income countries
continue to underperform on issues of road safety because of a lack of funding and political concern.
19
Indeed, even though the health costs attributable to road traffic injuries are comparable to those of
malaria and tuberculosis, the fight against disease attracts greater political concern and financial
support. Our characterization here of road safety as a local public good perhaps corroborates the
evidence that it remains a secondary objective. In comparison, healthcare justifiably is given priority
status, as low-income countries concentrate their efforts on disease prevention and eradication.
However, simply raising political awareness and increasing public spending on road safety are
insufficient. If strong efficient institutions are not created, the general indifference to traffic laws and
the authorities that enforce them can hamper effective outcomes. To understand more clearly the
effect of these factors, future research needs to focus on the variables of regulation, enforcement and
compliance. The consideration of road safety as the shared responsibility of governments and civil
society suggests that social capital can also be a significant factor in this approach.
Overall, our research shows that the inclusion of institutional variables in the analysis of road
safety determinants provides new insights in the analysis of traffic safety and the provisions of public
goods. But if we are to alleviate the burden imposed by traffic accidents, especially in the world’s
poorest economies, we need a better understanding of the causal links between political institutions
and road safety.

20
REFERENCES
Albalate, Daniel, 2008. Lowering blood alcohol content levels to save lives: the European experience.
Journal of Policy Analysis and Management 27(1), 20–39.
Albalate, Daniel, Bel, Germà, Elías, Ferran, 2012. Institutional determinants of military spending.
Journal of Comparative Economics 40(2), 279-290.
Anastasopoulos, Panagiotis C., Tarko, Adrew P., Mannering, Fred L., 2008. Tobit analysis of vehicle
accident rates on interstate highways. Accident Analysis and Prevention 40(2), 768–775.
Anbarci, Nejat, Escaleras, Monica, Register, Charles, 2006. Traffic fatalities and public sector
corruption. Kyklos 59(3), 327–344.
Bester, Christo J., 2000. Explaining national road fatalities. Accident Analysis and Prevention 33, 633-
672.
Bishai, David, Quresh, Asma, James, Prashant, Ghaffar, Abdul, 2006. National road casualties and
economic development. Health Economics 15(1), 65-81.
Bueno De Mesquita, Bruce, Smith, Alastair, Siverson, Randolph M., Morrow, James D., 2003. The logic
of political survival. MIT Press, Cambridge, MA.
Cameron, A. Colin, Trivedi, Pravin K., 2009. Microeconometrics using Stata. Stata press, Texas, the
USA.
Carpenter, Christopher S., Stehr, Mark, 2008. The effects of mandatory seatbelt laws on seatbelt use,
motor vehicle fatalities, and crash-related injuries among youths. Journal of Health Economics 27(3),
642-62.

21
Christensen, Peter, Elvik, Rune, 2007. Effects on accidents of periodic motor vehicle inspection in
Norway. Accident Analysis and Prevention 39(7), 47–52.
Cohen, Alma, Einav, Liran, 2003. The effects of mandatory seat belt laws on driving behavior and
traffic fatalities. Review of Economics and Statistics 85(4), 828–843.
Commission for Global Road Safety (CGRS), 2007. Make roads safe. A new priority for sustainable
development. Available at http://www.makeroadssafe.org/about/Pages/homepage.aspx. CGRS, UK.
Deacon, Robert T., 2009. Public good provision under dictatorship and democracy. Public Choice 139,
241–262.
Dee, Thomas S., Sela, Rebecca J., 2003. The fatality effects of highway speed limits by gender and age.
Economics Letters 79, 401–408.
Derrig, Richard A., Segui-Gomes, Maria, Abtahi, Ali, Ling-Ling, Liu, 2002. The effect of population
safety belt usage rate on motor vehicle-related fatalities. Accident Analysis and Prevention 34, 101–
110.
Elvik, Rune, Høye, Alena, Vaa, Truls, Sørensen, Michael, 2009. Handbook of road safety measures (2nd
edition). Emerald Group Publishing Limited, Bingley, UK.
Eisenberg, Daniel, 2003. Evaluating the effectiveness of policies related to drunk driving. Journal of
Policy Analysis and Management 22, 249–274.
Flahaut, Benoıt̂, 2004. Impact of infrastructure and local environment on road unsafety. Logistic
modeling with spatial autocorrelation. Accident Analysis and Prevention 36, 1055–1066.

22
Grimm, Michael, Treibich, Carole, 2010. Socio-economic determinants of road traffic accident
fatalities in low and middle income countries. ISS working paper 504. International Institute of Social
Studies, The Hague.
Ghobarah, Hazem Adam, Huth,Paul, Russett, Bruce, 2004. Comparative public health: the political
economy of human misery and well‐being. International Studies Quarterly 48(1), 73-94.
Hausman, Jerry, Bronwyn, H. Hall, Griliches, Zvi, 1984. Econometric models for count data with an
application to the patents-R&D relationship. Econometrica 52, 909–938.
Haynes, Robin, Lake, Iain R., Kingham, Simon, Sabel, Clive E., Pearce, Jamie, Barnett, Ross, 2008.
Influence of road curvature on fatal crashes in New Zealand. Accident Analysis and Prevention 40,
843–850.
Jacobs, G.D., & Cutting, C. A., 1986. Further research on accident rates in developing countries.
Accidents Analysis and Prevention 18(2), 119-27.
Kaplan, Sigal, Prato, Carlo Giacomo, 2007. Impact of BAC limit reduction on different population
segments: a Poisson fixed effect analysis. Accident Analysis and Prevention 39, 1146–1154.
Keefer, Philip, 2010. Database of Political Institutions DPI 2010. Development Research Group, The
World Bank , Washington, DC.
Lake, David A., Baum, Matthew A., 2001. The invisible hand of democracy: political control and the
provision of public services. Comparative Political Studies 34(6), 587-621.
Law, Teik Hua, Noland, Robert B., Evans, Andrew W., 2009. Factors associated with the relationships
between motorcycle deaths and economic growth. Accident Analysis and Prevention 41(2), 234-240.

23
Lizzeri, Alessandro, Persico, Nicola, 2001. The provision of public goods under alternative electoral
incentives. American Economic Review 91(1), 225-239.
Lord, Dominique, Mannering, Fred, 2010. The statistical analysis of crash-frequency data: a review
and assessment of methodological alternatives. Transportation Research (A) 44, 291–305.
Lozano, Rafael, Naghavi, Mohsen, Foreman, Kyle, Lim, Stephen, Shibuya, Kenji, Aboyans, Victor, …
Murray, Christopher J. L., 2012. Global and regional mortality from 235 causes of death for 20 age
groups in 1990 and 2010: a systematic analysis for the Global Burden of Disease Study 2010 Lancet
380(9859), 2095-2128.
Maier, Gunther, Gerking, Shelby, Weiss, Peter, 1989. The economics of traffic accidents on Austrian
roads: risk lovers or policy deficit? Empirica 16, 177-192.
Milesi-Ferretti, Gian Maria, Perotti, Roberto, Rostagno, Massimo, 2002. Electoral systems and the
composition of public spending. Quarterly Journal of Economics 117, 609-657.
Mulligan, Casey B., Gil, Ricard, Sala-i-Martin, Xavier, 2004. Do democracies have different public
policies than nondemocracies? Journal of Economic Perspectives AEA 18(1), 51-74.
Myerson, Roger. B, 1995. Analysis of democratic institutions: structure, conduct and performance.
Journal of Economic Perspectives 9(1), 77-89.
Nilsson, Göran, 2002. The three dimensions of exposure, risk and consequence. Unpublished
manuscript. Swedish national road and transport research institute, Linköping.
Noland, Robert B., 2003. Traffic fatalities and injuries: the effect of changes in infrastructure and other
trends. Accident Analysis and Prevention 35, 599–611.

24
Park, Eun Sug, Carlson, Paul J., Porter, Richard J., Andersen, Carl K., 2012. Safety effects of wider edge
lines on rural, two-lane highways. Accident Analysis and Prevention 48, 317–325.
Papaioannou, Elias, Siourounis, Gregorios, 2008. Democratisation and growth. The Economic Journal
118, 1520-1551.
Peltzman, Sam, 1975. The effects of automobile safety regulation. Journal of Political Economy 83(4),
677–725.
Persson, Torsten, Roland, Gerard, Tabellini, Guido, 1999. The size and scope of government:
comparative politics with rational politicians. European Economic Review 43, 699–735.
Persson, Torsten , Roland, Gerard, Tabellini, Guido, 2000. Comparative politics and public finance.
Journal of Political Economy 108, 1121-1141.
Persson, Torsten, Tabellini, Guido, 2000. Political economics: explaining economic policy. MIT Press,
Cambridge, MA.
Persson, Torsten, Tabellini, Guido, 2003. The economic effect of constitutions. MIT Press, Cambridge,
MA.
Persson, Torsten, Tabellini, Guido, 2004. Constitutional rules and fiscal policy outcomes. American
Economic Review 94(1), 25-45.
Profeta, Paola, Puglisi, Riccardo, Scabrosetti, Simona, 2013. Does democracy affect taxation and
public spending? Evidence from developing countries. Journal of Comparative Economics 41, 684–
787.
Saiz, Albert, 2006. Dictatorships and highways. Regional Science and Urban Economics 36, 187-206.

25
Stroup, Michael D., 2007. Economic freedom, democracy and the quality of life: an empirical analysis.
World Development 35(1), 52–66.
Sutter Daniel, Poitras, Marc, 2002. The political economy of automobile safety inspections. Public
Choice 113, 367-387.
Tay, Richard, 2010. Speed cameras: improving safety or raising revenue? Journal of Transport
Economics and Policy (A) 44(2), 247–257.
United Nations (UN), 2010. Resolution adopted by the General Assembly. 64 / 255 Improving global
road safety. Available at
http://www.who.int/violence_injury_prevention/publications/road_traffic/UN_GA_resolution-54-
255-en.pdf. UN, NY.
Vereeck, Lode, Vrolix, Klara, 2007. The social willingness to comply with the law: the effect of social
attitudes on traffic fatalities. International Review of Law and Economics 27(4), 385–408.
World Bank (WB), 2012. World Development Indicators. Available at http://data.worldbank.org/data-
catalog/world-development-indicators. WB, Washington D.C.
World Health Organization (WHO), 2013a. Global Status Report on Road Safety 2013. WHO, Geneve.
World Health Organization (WHO), 2013b. Road traffic injuries (Fact sheet N°358, March 2013).
Available at http://www.who.int/mediacentre/factsheets/fs358/en/. WHO, Geneve.

26
FIGURES AND TABLES
Figure 1. The share of democracies in 1975, 1993 and 2009 classified by income level.
27
Figure 2. Traffic fatalities and accidents with injuries per vehicles x 1000, by regime type and income
level. Average value 1975–2009.

28
Figure 3. Timing effects. The impact of the first ten years of democracy on traffic fatality counts. Note: *, ** and *** indicate the significance of the coefficient estimates. * p<0.05, ** p<0.01, *** p<0.001.

29
Figure 4. Timing effects. The impact of the first ten years of democracy on traffic accident counts
(accidents with injuries). Note: *, ** and *** indicate the significance of the coefficient estimates. * p<0.05, ** p<0.01, *** p<0.001.

30
Table 1. Sample statistics summary
Variable Number
observations Mean Std. Dev. Min Max
Dependent variables fat 2851 3876465 10426.6 4.5 125660
accinj 2659 75607.57 251039.5 85 2425054
Institutional variables
leveldemoc 4462 5.286195 2.155548 1 7
presidential 4458 0.5361148 0.49875 0 1
major 3438 0.6614311 0.4732918 0 1
Infrastructure variables
sharemw 1618 0.0172571 0.075184 0 1
density 2799 0.9109287 5.071533 0.005 256
paved 2633 52.29992 33.32716 0.15 100
Socio-economic controls
lgdppc 4240 8.009008 1.624284 3.912867 11.38187
grthgdppc 4237 1.698487 6.123588 -50.23583 91.67289
pop65up 4830 6.906763 4.598957 0.3649629 22.28709
urbrate 4757 33.58355 18.46835 2.563864 100
Offset (exposure) variable
vehkm 2424 28.94152 35.11312 0.05 429

31
Table 2. Definition of variables, definitions and data sources
Variable Definition Source
Dependent variables
Fatalities Number of deaths in road
accidents
International Road Federation (IRF) World Road
Statistics (WRS) 1963–1989, WRS 1990–1999 and WRS
2000–2010
Accidents Number of road accidents
with injuries
IRF WRS 1963–1989, WRS 1990–1999 and WRS 2000–
2010
Institutional variables
Level of democracy Variable ranging from 1 (the
most autocratic countries) to 7
(the most democratic
countries)
Database of Political Institutions (Keefer, 2010).
Constructed as equal to the Executive Index of
Electoral Competitiveness (EIEC). A competitively
elected prime-minister scores 6 or 7. If a chief
executive receives less than 75% of the votes, the
score is 7. If a chief executive receives more than 75%
of the votes, the score is 6. A country is considered to
be autocratic or a country where democratic
institutions are not consolidated and leadership is
personality-based if the EIEC is below 6.
Democracy A dummy variable that takes a
value of one if country is
democratic and zero
otherwise.
Database of Political Institutions and authors' own.
Constructed from EIEC. If the EIEC is below 6, then the
country is deemed autocratic or a country where
democratic institutions are not consolidated and
leadership is personality-based.
Democratization
timing effects
A dummy variable that takes a
value of one in a particular
year after a country’s
democratization (only the first
ten years are considered)
Database of Political Institutions and authors' own.
Presidential A dummy variable that takes a
value of one if the democracy
is presidential and zero if it is
parliamentary
Database of Political Institutions. Constructed from
SYSTEM. As in Albalate et al. (2012), all assembly-
elected president democracies are considered
parliamentarian.
Majoritarian A dummy variable that takes a
value of one if the country has
a majoritarian electoral rule
and zero if the electoral rule is
proportional.
Database of Political Institutions. Constructed from
PLURALITY. In plurality systems, legislators are elected
using a winner-take-all/first past the post rule.
PLURALITY equals one if this system is used and zero
otherwise.
Infrastructure

32
variables
Share motorways Share of motorways over the
total road network
IRF WRS 1963–1989, WRS 1990–1999 and WRS 2000–
2010. Constructed as a ratio between the length of
motorways and the length of the total road network.
Density Density of total network (kms
per sq. km)
IRF WRS 1963–1989, WRS 1990–1999 and WRS 2000–
2010
Paved Percentage of paved roads
over the total road network
IRF WRS 1963–1989, WRS 1990–1999 and WRS 2000–
2010
Socio-economic
controls
LGDP per capita Natural logarithm of GDP per
capita (constant 2005 US$)
WDI database (World Bank, 2012) and authors’ own
Growth GDP per
capita
GDP per capita growth (annual
%)
WDI database
Population over 65 Share of population older than
65
WDI database
Urban concentration
of population
Population in the largest city
as a percentage of urban
population
WDI database
Exposure variable
Vehicles per km Units of vehicles per km of
road network
IRF WRS 1963–1989, WRS 1990–1999 and WRS 2000–
2010
Other variables
Trend A variable that captures the
effects of time. It takes a value
of one for the first year in the
sample (1975) and increases
by one for each passing year.
Authors' own
Trend low income
countries
A variable that takes a value of
one for the first year in the
sample (1975) and increases
by one for each passing year
for low income countries only.
IRF WRS 2000–2010 and authors' own. Countries
considered are classified as “low income” in IRF WRS
2000–2010.
Trend middle income
countries
A variable that takes a value of
one for the first year in the
IRF WRS 2000–2010 and authors' own. Countries
considered are classified as “lower middle income”

33
sample (1975) and increases
by one for each passing year
for middle income countries
only.
and “upper middle income” in IRF WRS 2000–2010.
Trend high income
countries
A variable that takes a value of
one for the first year in the
sample (1975 ) and increases
by one for each passing year
for high income countries only.
IRF WRS 2000–2010 and authors' own. Countries
considered are classified as “high income” in IRF WRS
2000–2010.

34
Table 3. Variability and overdispersion. Dependent variables and institutional variables
Variable Mean Std. Dev. Min Max Observations
fat overall 3876.47 10426.60 4.50 125660.00 N = 2851
between
9083.45 17.06 71727.44 n = 138
within
4210.34 -49969.13 57809.03 T-bar = 20.6594
accinj overall 75607.57 251039.5 85 2425054 N = 2659
between
190720.7 111 2051122 n=138
within
44236.56 -427717.1 555720.6 T-bar=19.681
leveldemoc overall 5.29 2.16 1 7 N = 4462
between
1.67 2 7 n = 138
within
0.35 0.43 1.,20 T-bar = 32.3333
presidential overall 0.54 0.50 0 1 N = 4458
between
0.46 0 1 n = 138
within
0.20 -0.41 1.45 T-bar = 32.3043
major overall 0.66 0.47 0 1 N = 3438
between
0.43 0 1 n = 132
within
0.18 -0.31 1.63 T-bar = 26.0455
Note: The overall and within statistics are calculated over N country-years of data. The between standard deviation is
calculated over n countries. The average number of years each country was observed during T-bar years.

35
Table 4. Results: Negative binomial estimates for fatality counts. Full sample (1) (2) (3) (4) (5) (6)
fatfe1 fatre1 fatfe2 fatre2 fatfe3 fatre3
Institutional variables
leveldemoc -0.0333* -0.0317* -0.0360** -0.0392** -0.0432** -0.0449***
(0.0143) (0.0141) (0.0135) (0.0131) (0.0133) (0.0130)
Infrastructure variables
sharemw 1.8540*** 1.8178*** 1.5199*** 1.5111*** 1.7247*** 1.6997***
(0.2407) (0.2461) (0.2983) (0.2942) (0.2671) (0.2650)
density 0.1542*** 0.1228*** 0.2560*** 0.2148*** 0.3028*** 0.2626***
(0.0220) (0.0234) (0.0217) (0.0221) (0.0224) (0.0229)
Socio-economic controls grthgdppc 0.0050* 0.0054* 0.0034 0.0042 0.0003 0.0011
(0.0023) (0.0023) (0.0024) (0.0024) (0.0024) (0.0024)
lgdppc -0.4804*** -0.5084*** -0.2570*** -0.3331*** -0.1384** -0.2157***
(0.0350) (0.0343) (0.0423) (0.0403) (0.0468) (0.0453)
urbrate 0.0225*** 0.0185*** 0.0165*** 0.0113*** 0.0192*** 0.0143***
(0.0024) (0.0024) (0.0027) (0.0027) (0.0026) (0.0027)
pop65up -0.0727*** -0.0675*** 0.0226** 0.0236** 0.0270*** 0.0295***
(0.0091) (0.0090) (0.0086) (0.0087) (0.0081) (0.0082)
Time trends trend
-0.0343*** -0.0323***
(0.0018) (0.0017)
trendl
0.0064 0.0059
(0.0042) (0.0040)
trendm
-0.0262*** -0.0256***
(0.0026) (0.0026)
trendh
-0.0410*** -0.0393***
(0.0019) (0.0019)
N 1143 1157 1143 1157 1143 1157
AIC 16.227 18.491 15.869 18.216 15.925 18.197
chi2 1306 1245 1927 1834.0201 2059.7147 1956.7946 ll -8105.3 -9235.5 -7925.4 -9063.6175 -7897.8345 -9036.3352
Notes: Cluster-robust standard errors in parentheses; * p<0.05, ** p<0.01, *** p<0.001; N: number of observations; AIC: Akaike information criteria; chi2: Wald test statistic; ll: log likelyhood.

36
Table 5. Results: Negative binomial estimates for accident counts (accidents with injuries). Full sample
(1) (2) (3) (4) (5) (6)
accfe1 accre1 accfe2 accre2 accfe3 accre3
Institutional variables
leveldemoc -0.0743*** -0.0768*** -0.0584*** -0.0639*** -0.0523*** -0.0574***
(0.0173) (0.0169) (0.0154) (0.0151) (0.0157) (0.0154)
Infrastructure variables sharemw -6.7891*** -6.3538*** 0.2262 0.5233 1.1632* 1.2085**
-15.478 -15.382 (0.9380) (0.7349) (0.4755) (0.4457)
density 0.1852*** 0.1146*** 0.2979*** 0.2399*** 0.3020*** 0.2497***
(0.0273) (0.0298) (0.0233) (0.0253) (0.0236) (0.0251)
Socio-economic controls
grthgdppc 0.0012 0.0017 -0.0010 0.0010 -0.0019 -0.0004
(0.0028) (0.0030) (0.0025) (0.0027) (0.0025) (0.0026)
lgdppc -0.3549*** -0.3626*** -0.2381*** -0.2979*** -0.2066*** -0.2444***
(0.0425) (0.0426) (0.0469) (0.0460) (0.0482) (0.0487)
urbrate 0.0163*** 0.0110*** 0.0210*** 0.0167*** 0.0207*** 0.0169***
(0.0026) (0.0027) (0.0022) (0.0025) (0.0022) (0.0024)
pop65up 0.0173* 0.0219** 0.0958*** 0.0965*** 0.0917*** 0.0908***
(0.0085) (0.0085) (0.0079) (0.0081) (0.0080) (0.0082)
Time trends trend
-0.0322*** -0.0303***
(0.0016) (0.0016)
trendl
0.0274*** 0.0266***
(0.0056) (0.0053)
trendm
-0.0426*** -0.0409***
(0.0036) (0.0034)
trendh
-0.0329*** -0.0313***
(0.0019) (0.0019)
N 1110 1123 1110 1123 1110 1123
AIC 21.994 24.659 21.675 24.380 21.646 24.346
chi2 299 241 946 741 959 776
ll -10990.00 -12320.00 -10830.00 -12180.00 -10810.00 -12160.00
Notes: Cluster-robust standard errors in parentheses; * p<0.05, ** p<0.01, *** p<0.001; N: number of observations; AIC: Akaike information criteria; chi2: Wald test statistic; ll: log likelyhood.

37
Table 6. Results: Negative binomial estimates for fatality counts. Democracies only
(1) (2) (3) (4) (5) (6) (7) (8)
fatfe1 fatre1 fatfe2 fatre2 fatfe3 fatre3 fatfe4 fatre4
Institutional variables
leveldemoc -0.1209* -0.1336* -0.1243* -0.1272* -0.1803** -0.1861** -0.1580* -0.1657**
(0.0561) (0.0553) (0.0605) (0.0590) (0.0634) (0.0617) (0.0640) (0.0623)
major -0.6293*** -0.5999*** -0.6696*** -0.6286*** -0.6241*** -0.5730*** -0.6438*** -0.5847***
(0.0631) (0.0606) (0.0621) (0.0596) (0.0630) (0.0608) (0.0637) (0.0616)
presidential -0.1129* -0.0912 0.0043 0.0319 0.0100 0.0399 -0.0032 0.0228
(0.0479) (0.0480) (0.0464) (0.0471) (0.0474) (0.0480) (0.0472) (0.0482)
Infrastructure variables
paved -0.0051*** -0.0054*** -0.0027* -0.0031** -0.0029** -0.0032** -0.0033** -0.0036***
(0.0011) (0.0011) (0.0011) (0.0010) (0.0011) (0.0010) (0.0010) (0.0010)
density -0.0260* -0.0342** -0.0294* -0.0387** -0.0203 -0.0294* -0.0151 -0.0256*
(0.0114) (0.0119) (0.0115) (0.0119) (0.0114) (0.0118) (0.0114) (0.0116)
Socio-economic controls
grthgdppc 0.0071* 0.0073** 0.0059* 0.0066* 0.0044 0.0050 0.0033 0.0043
(0.0028) (0.0028) (0.0026) (0.0026) (0.0026) (0.0026) (0.0026) (0.0026)
lgdppc -0.3067*** -0.3509*** -0.2099*** -0.2771*** -0.1067* -0.1703*** -0.1097* -0.1756***
(0.0366) (0.0355) (0.0381) (0.0369) (0.0447) (0.0429) (0.0454) (0.0433)
urbrate 0.0133*** 0.0077** 0.0180*** 0.0119*** 0.0187*** 0.0124*** 0.0200*** 0.0134***
(0.0025) (0.0026) (0.0025) (0.0026) (0.0025) (0.0026) (0.0026) (0.0026)
pop65up -0.0793*** -0.0690*** -0.0067 -0.0016 -0.0040 0.0021 -0.0008 0.0048
(0.0111) (0.0109) (0.0109) (0.0109) (0.0107) (0.0107) (0.0105) (0.0104)
Time trends trend
-0.0236*** -0.0223***
(0.0017) (0.0017)
trendl
0.0030 0.0040 0.0003 0.0015
(0.0041) (0.0038) (0.0041) (0.0039)
trendm
-0.0182*** -0.0174*** -0.0186*** -0.0180***
(0.0026) (0.0025) (0.0025) (0.0025)
trendh
-0.0287*** -0.0281*** -0.0300*** -0.0293***
(0.0019) (0.0020) (0.0019) (0.0019)
Democratization timing effects No No No No No No Yes Yes
N 1190 1198 1190 1198 1190 1198 1190 1198
AIC 16.133 18.385 15.959 18.230 15.941 18.209 15.921 18.192
chi2 937 970 1204 1158 1220 1160 1351 1274
ll -8057 -9181 -7969 -9102 -7958 -9089 -7938 -9071
Notes: Cluster-robust standard errors in parentheses; * p<0.05, ** p<0.01, *** p<0.001; N: number of observations; AIC: Akaike information criteria; chi2: Wald test statistic; ll: log likelyhood.

38
Table 7. Results: Negative binomial estimates for accident counts (accidents with injuries).
Democracies only
(1) (2) (3) (4) (5) (6) (7) (8) accfe1 accre1 accfe2 accre2 accfe3 accre3 accfe4 accre4
Institutional variables
leveldemoc -0.1638* -0.1903** -0.1367 -0.1645* -0.1707* -0.2045** -0.1534* -0.1839*
(0.0723) (0.0721) (0.0731) (0.0734) (0.0768) (0.0769) (0.0777) (0.0779)
major -0.4234*** -0.3770*** -0.3702*** -0.3266*** -0.3124*** -0.2632*** -0.3265*** -0.2718***
(0.0625) (0.0612) (0.0615) (0.0601) (0.0628) (0.0612) (0.0632) (0.0614)
presidential 0.1309* 0.1250* 0.2486*** 0.2500*** 0.2379*** 0.2360*** 0.2286*** 0.2248*** (0.0539) (0.0542) (0.0526) (0.0533) (0.0531) (0.0537) (0.0534) (0.0542)
Infrastructure variables
paved -0.0077*** -0.0081*** -0.0046*** -0.0051*** -0.0040*** -0.0044*** -0.0045*** -0.0047***
(0.0011) (0.0011) (0.0011) (0.0011) (0.0011) (0.0011) (0.0011) (0.0011)
density 0.0034 -0.0112 0.0113 -0.0038 0.0127 -0.0020 0.0107 -0.0058
(0.0147) (0.0155) (0.0132) (0.0138) (0.0133) (0.0139) (0.0136) (0.0142)
Socio-economic controls
grthgdppc 0.0036 0.0043 0.0026 0.0038 0.0019 0.0029 0.0014 0.0028
(0.0029) (0.0030) (0.0028) (0.0028) (0.0028) (0.0029) (0.0028) (0.0029)
lgdppc -0.3947*** -0.3892*** -0.2975*** -0.3157*** -0.2133*** -0.2193*** -0.2419*** -0.2488***
(0.0374) (0.0370) (0.0390) (0.0382) (0.0474) (0.0466) (0.0488) (0.0476)
urbrate 0.0228*** 0.0183*** 0.0253*** 0.0204*** 0.0249*** 0.0200*** 0.0251*** 0.0200***
(0.0024) (0.0025) (0.0024) (0.0025) (0.0023) (0.0024) (0.0024) (0.0025)
pop65up 0.0632*** 0.0624*** 0.1095*** 0.1070*** 0.1054*** 0.1022*** 0.1091*** 0.1057*** (0.0093) (0.0092) (0.0090) (0.0091) (0.0092) (0.0093) (0.0093) (0.0094)
Time trends
trend
-0.0228*** -0.0219***
(0.0017) (0.0017)
trendl
0.0146** 0.0165*** 0.0124** 0.0142**
(0.0045) (0.0044) (0.0046) (0.0044)
trendm
-0.0293*** -0.0296*** -0.0291*** -0.0297***
(0.0033) (0.0032) (0.0033) (0.0032)
trendh
-0.0251*** -0.0245*** -0.0253*** -0.0247***
(0.0020) (0.0020) (0.0020) (0.0020)
Democratization timing effects No No No No No No Yes Yes
N 1153 1160 1153 1160 1153 1160 1153 1160
AIC 22.088 24.782 21.933 24.642 21.914 24.617 21.911 24.613
chi2 402 377 608 544 629 573 670 612
ll -1103.00 -1238.00 -1096.00 -1231.00 -1094.00 -1229.00 -1093.00 -1228.00
Notes: Cluster-robust standard errors in parentheses; * p<0.05. ** p<0.01. *** p<0.001; N: number of observations; AIC: Akaike information criteria; chi2: Wald test statistic; ll: log likelyhood.
39
Table 8. Correlation matrix1
presidential pop65up lgdppc paved trend trendh trendm trendl
presidential 1.00 pop65up -0.51 1.00
lgdppc -0.41 0.72 1.00 paved -0.38 0.60 0.56 1.00
trend 0.02 0.19 0.11 0.16 1.00 trendh -0.36 0.63 0.72 0.47 0.39 1.00
trendm 0.26 -0.25 -0.28 -0.10 0.38 -0.51 1.00 trendl 0.32 -0.44 -0.67 -0.31 0.30 -0.46 0.39 1.00
1 variables with correlation coefficients greater than 0.4