dangerous driving event prediction on roadways
DESCRIPTION
http://www.as-se.org/sss/paperInfo.aspx?ID=13753 This paper presents a dangerous driving event prediction method that can be embedded in driver assistance systems. The proposed method contains four major tasks: perception, representation, interpretation, and database updating. Therefore, four techniques: an activation mechanism, an attribute relational map, two-way fuzzy attribute map matching, and a danger evaluation process, are developed to implement each task, respectively. The activation mechanism gives each incoming driving action an activation value, which will gradually decrease as time progresses. A series of consecutive driving actions forms a driving event, which is represented as a directed graph and called an attributed relational map (ARM). Dangerous driving events are defined as events that directly caused, or almost caused, traffic accidents. They can be translated into dangerous ARMs and collected in a dangerous driving event database. Once the observed (current)TRANSCRIPT
www.as‐se.org/sss Studies in System Science (SSS) Volume 2, 2014
14
Dangerous Driving Event Prediction on Roadways Sei‐Wang Chen1, Chiung‐Yao Fang*2, Chih‐Ting Tien3 and Bo‐Yan Wu4
Department of Computer Science and Information Engineering
National Taiwan Normal University
Taipei, Taiwan [email protected]; *[email protected]; [email protected]; [email protected]
Received 18 December 2013; Accepted 19 February 2014; Published 21 April 2014 © 2014 American Society of Science and Engineering Abstract
This paper presents a dangerous driving event prediction method that can be embedded in driver assistance systems. The proposed method contains four major tasks: perception, representation, interpretation, and database updating. Therefore, four techniques: an activation mechanism, an attribute relational map, two‐way fuzzy attribute map matching, and a danger evaluation process, are developed to implement each task, respectively.
The activation mechanism gives each incoming driving action an activation value, which will gradually decrease as time progresses. A series of consecutive driving actions forms a driving event, which is represented as a directed graph and called an attributed relational map (ARM). Dangerous driving events are defined as events that directly caused, or almost caused, traffic accidents. They can be translated into dangerous ARMs and collected in a dangerous driving event database. Once the observed (current) driving event is input into the proposed system, it will be translated into an observed ARM and compared with the template ARMs stored in the database using a two‐way fuzzy attributed map matching technique. The matching result helps the system to predict whether the observed driving event will cause a traffic accident. Moreover, the system contains a danger evaluation technique with which to evaluate dangerous driving events for database updating.
A series of experiments with synthetic examples generated using a driving simulator were conducted. The experiments demonstrate the feasibility and practicality of the proposed system.
Keywords
Activation Mechanism; Advanced Driver Assistance Systems; Attributed Relational Map; Danger Evaluation; Dangerous Driving Event Prediction; Two‐way Fuzzy Attributed Map Matching
Introduction
The recent remarkable advances in sensors, controls, computers, and communications, have allowed the investigation of advanced driver assistance systems (ADAS) [1] [2] [13] [18] [22]. However, a complete and perfect ADAS has not yet been proposed. The primary objectives of the ADAS are safety, efficiency, and comfort. However, we conceive that the ADAS should possess at least four further capabilities, including detection, analysis, prediction, and coordination. This study focuses on exploring the prediction capability of the ADAS.
Dangerous Driving Events
We assume that various types of sensors incorporated in the detection system of the ADAS can be used to obtain driving data. This raw data provides information on the type of road, the vehicle, and the driver. The road information may include road conditions (e.g., street, intersection, curvature [5], and incline), traffic situations (e.g., road signs [3], traffic signals, and congestion [6], and environment (e.g., bridges, tunnels, and climate). The vehicle information may contain position [23], direction, speed, steering wheel angle, gear control, and brake and gas pedal positions. The driver information may include pose, awareness level [12], mental state, gender, age, and experience. It is inevitable that the above information may suffer from redundancy, uncertainty, and be deficient. The analysis system of the ADAS compensates for such situations and reorganizes the results to arrive at what we call a driving state. Fig. 1 illustrates the relationship between the sensor information, road information, vehicle information, driver information, and the driving state.
A driving action can be regarded as an obvious change of a driving state within a fixed interval. One driving action is
represented as a 4‐element vector ( , , , )Tc t a v d , where t indicates the time of occurrence of the driving action, a its

Studies in System Science (SSS) Volume 2, 2014 www.as‐se.org/sss
15
attribute, v its attribute value, and d the duration of the change. For example, consider the case when the speed of a host vehicle at 9:12:36 am decreases from 90 to 60 km/h within 2 seconds. This driving action can be represented as
c (9:12:36 am, speed, ‐30, 2)T. As another example, 'c (4:51:26 pm, steering wheel, 28, 1)T means that at 4:51:26 pm,
the steering wheel of the host vehicle made a change of 28 within 1 second.
A series of consecutive driving actions forms a driving event e, 1 2 ... ne c c c , where ic ,1 i n , are driving actions. For
example, overtaking a vehicle, changing lane, or stopping the vehicle on the roadside, are all valid driving events. A dangerous driving event indicates that the series of consecutive driving actions constructing that event has caused or almost caused a traffic accident. Note that driving events may or may not be dangerous. It depends on the ordering and relative times of the driving actions.
This document is a template. An electronic copy can be downloaded from the journal website. For questions on paper guidelines, please contact the publications committee as indicated on the journal website. Information about final paper submission is available from the journal website.
FIG. 1. THE RELATIONSHIP BETWEEN THE SENSOR INFORMATION, ROAD INFORMATION, VEHICLE INFORMATION, DRIVER INFORMATION, AND THE DRIVING STATE.
The dangerous driving events cannot be exhaustively listed. However, the possible outcomes of dangerous driving vents can be limited and defined by some constraints. In general, they either lead to very short distances between the host vehicle and other vehicles (e.g., hit, collision, and crash), or result in abrupt driving actions (e.g., severe alteration in driving state). In this study, the dangerous driving vents are identified primarily based on their outcomes.
Event Representations
To represent driving events, graph models for time‐series events such as finite‐state machines, hidden Markov models (HMM), Petrinets [9], and neural networks [4][21] have been used. Helander [11] presented a two‐state automaton to explore the relationship between the driver braking behaviour and electrodermal response. Kuge et al. [14] suggested an HMM to detect lane change maneuvers. Pentland and Liu [20] reported a four‐state HMM to infer the driver’s intention from their physical movements of eyes, head, hands, and legs. The driver’s intentions (e.g., preparing to brake, turn, overtake, enter or leave a curve, and follow the car in front) are then sent to a control system that will take control of the remainder of the driving actions. Oliver and Pentland [19] later extended the traditional HMM to a coupled HMM (CHMM) by incorporating contextual information when modelling the driving maneuvers.
Mitrovi´c [17] introduced an assembly of HMMs, each of which recognizes one of seven events: driving through a left/right curve, turning left/right at an intersection (with and without roundabout), and going straight on at an intersection with a roundabout. Dagli et al. [8] reported a dynamic belief network (DBN) capable of interpreting six intended actions: acceleration/ deceleration, remaining longitudinal/ lateral, and lane‐change right/left. The intended actions associate with causal dependencies between vehicle states that are described in terms of probabilistic variables. The DBN deduces the intended actions by adjusting the distribution of vehicle states through an inference engine.
The above HMM, CHMM, and DBN are all probabilistic models. They are stable and efficient in the recognition stage. However, it is difficult to add new types of driving events once they have completed training. These systems must be retrained to learn new driving events. In this study, we propose a graph‐based method, representing each driving event by a corresponding graph. This allows the addition of new driving events efficiently and does not affect other
Detection system Sensor 1 Sensor 2 Sensor n
Sensor information
Sensor information
Sensor informationn
Analysis system
((Road information) (Vehicle information)(Driver information))
Driving state
www.as‐se.org/sss Studies in System Science (SSS) Volume 2, 2014
16
events that have already been learned.
In this study, were present a driving event as a directed acyclic graph, called an attributed relational map (ARM), in
which each node corresponds to a driving action. These nodes are connected by links according to their order of
occurrence. The nodes and links are associated with attribute values that reflect the danger levels of driving actions,
and the relationships between driving actions, respectively. Our proposed system determines whether a driving event
is dangerous by map matching using a two‐way fuzzy attributed map matching technique. If a match to a dangerous
driving event retained in a database is found, the event is determined as dangerous. If no match is found, a danger
evaluation is used to assess the event.
Dangerous Driving Event Prediction System
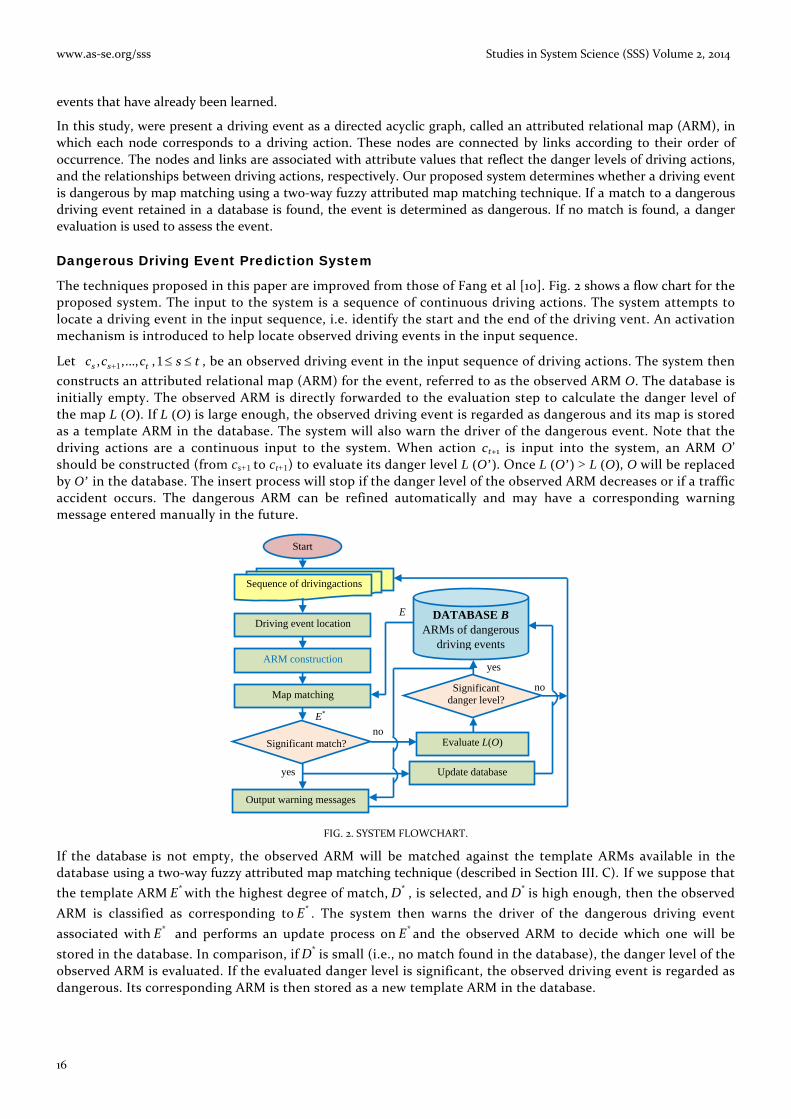
The techniques proposed in this paper are improved from those of Fang et al [10]. Fig. 2 shows a flow chart for the
proposed system. The input to the system is a sequence of continuous driving actions. The system attempts to
locate a driving event in the input sequence, i.e. identify the start and the end of the driving vent. An activation
mechanism is introduced to help locate observed driving events in the input sequence.
Let 1, ,...,s s tc c c ,1 s t , be an observed driving event in the input sequence of driving actions. The system then
constructs an attributed relational map (ARM) for the event, referred to as the observed ARM O. The database is
initially empty. The observed ARM is directly forwarded to the evaluation step to calculate the danger level of
the map L (O). If L (O) is large enough, the observed driving event is regarded as dangerous and its map is stored
as a template ARM in the database. The system will also warn the driver of the dangerous event. Note that the
driving actions are a continuous input to the system. When action ct+1 is input into the system, an ARM O’
should be constructed (from cs+1 to ct+1) to evaluate its danger level L (O’). Once L (O’) > L (O), O will be replaced
by O’ in the database. The insert process will stop if the danger level of the observed ARM decreases or if a traffic
accident occurs. The dangerous ARM can be refined automatically and may have a corresponding warning
message entered manually in the future.
FIG. 2. SYSTEM FLOWCHART.
If the database is not empty, the observed ARM will be matched against the template ARMs available in the
database using a two‐way fuzzy attributed map matching technique (described in Section III. C). If we suppose that
the template ARM *E with the highest degree of match, *D , is selected, and *D is high enough, then the observed
ARM is classified as corresponding to *E . The system then warns the driver of the dangerous driving event
associated with *E and performs an update process on *E and the observed ARM to decide which one will be
stored in the database. In comparison, if *D is small (i.e., no match found in the database), the danger level of the
observed ARM is evaluated. If the evaluated danger level is significant, the observed driving event is regarded as
dangerous. Its corresponding ARM is then stored as a new template ARM in the database.
Sequence of drivingactions
Start
Driving event location
ARM construction
Map matching
Update database
Evaluate L(O)
Output warning messages
Significant match?
Significant
danger level?
DATABASE B ARMs of dangerous
driving events
yes
yes
no
no
E
E*

Studies in System Science (SSS) Volume 2, 2014 www.as‐se.org/sss
17
Implementation Techniques
There are four major tasks in the proposed system: (i) locating the driving events in the input sequence of driving actions, (ii) constructing the ARMs for the driving events, (iii) interpretation of the driving events, and (iv) evaluating the danger level of the events. In this section, we present four techniques to solve these four tasks: (1) an activation mechanism, (2) ARM construction, (3) two‐way fuzzy attributed map matching, and (4) a danger evaluation process. This section addresses each of the techniques and then summarizes the system process.
Activation Mechanism
The concept of “activation” originated from the theory of neural networks. The activation of a neuron will increase when stimulus continues and begins to decay when stimulus stops. In a neural network, each neuron has an activation function to calculate the activation which can specify the output of a neuron to a given input stimulus. The activation function implements a protective mechanism of the neurons. Once the input stimulus is extremely strong or unexpected, the activation function will restrict the influence of the input and the neuron’s output will be bound. This mechanism is usually implemented using an embedded sigmoid function. Once the value of the input of the driving action may not be well detected, the activation mechanism here is to prevent the influence of extremely unexpected input. Moreover, the decay property of the activation is used to restrain the previous influence of driving actions.
As mentioned previously, the activation mechanism gives each incoming driving action, say ( , , , )Tc t a v d , an
activation A whose value increases for duration d and then gradually decays as time progresses. The symbol T indicates the time interval between the occurrence of the driving action c and the start time of the driving event that contains action c. The activation function is defined as
( ) (| |)( )ap TaA T qS v e , (1)
where q is a positive constant. The constant ap and function aS are relative to attribute a. The function 12 1 1 ( ) ( )ax
aS x e is a sigmoid in which a is a positive constant characterized by attribute a. One can observe,
from Eq. (1), that the activation of driving action c decreases when T increases, which means the activation will decay with time.
The activation mechanism helps us to partition successive driving actions flexibly and determine the starting action of a driving event easily. The activation of the first driving action of the observed driving event should be larger than a threshold; the driving actions that occur before reaching this threshold are deleted, since they do not affect the driving safety.
ARM Construction
The construction of an attributed relational map (ARM) for a driving event consists of two steps: map formation and attribute calculation.
FIG. 3. EXAMPLE OF A RELATIONAL MAP REPRESENTING A DRIVING EVENT. THE DRIVING ACTIONS ARE REPRESENTED AS NODES.
1) Map Formation
If we consider a driving event tss ccce ,...,, 1 , the driving actions ic in the event can be represented as nodes.
We next add links from the previous action to the following action for each pair of successive driving actions. The result is a directed acyclic map. In Fig. 3 an example map is shown and the time axis is below the ARM. The positions of the nodes have been arranged according to the occurrence time of their corresponding driving actions. The map construction method is very similar to the one presented by Chen et al.[7] with the exception of the definition of the weights of the nodes and links. It can be seen that more than one driving actions can occur at the same time, so their corresponding nodes are aligned vertically.
Ttcurr-2 tcurr-1tcurr
www.as‐se.org/sss Studies in System Science (SSS) Volume 2, 2014
18
2) Attribute Calculation
When the relational map of the driving event has been obtained, the next step is to calculate the weights (danger levels) of nodes and links of the map. The resultant map is called the attributed relational map (ARM) of the driving event.
Let ( , , , )Tc t a v d be an action of a driving event, and A(T) be the present activation of the driving action. The
weight of c can be defined as
tanh( ( ) / )ccD A T d , (2)
wherec is a positive constant. We can observe from Eq. (2) that cD is monotonically increasing with A(T), but
decreasing with d. A large activation A(T)hints at a recent driving action; a large attribute value v indicates an immense adaptation between two driving states; a short duration d implies that the adaptation is abrupt. These can all lead to a high value for the danger level. The hyperbolic tangent function is used to ensure the value of the weight of nodes is in the range [‐1, 1] and can be replaced by any other similar function, such as the sigmoid function.
The directed link between two nodes ac and bc defines a relationship ( , )a bR c c . Let t be the time interval
between ac and bc respectively. This study assumes that the longer the time interval t between ac and
bc the lower the danger level rD of R, i.e., 1 /rD t . Recall also that multiple driving actions may occur at
the same time. A driving action followed by multiple driving actions, in a sense, incurs a higher hazard than a
driving action following multiple driving actions, i.e., /rb aD n n , where an and bn are the numbers of driving
actions taking place at times at and bt , respectively. Moreover, multiple driving actions following multiple
driving actions are more dangerous, thus ( )ra bD n n .
Let caD and c
bD denote the danger levels of driving actions ac and bc , respectively. We stress their relational
danger level rD when c ca bD D because a threat is typically increased from a low to a high danger level, while
relieve rD when c ca bD D . Mathematically, /r c c
b aD D D . Summarizing the above analysis, the danger level rD
of relationship ( , )a bR c c is defined as the weight of this link is defined as
tanh( ( )/( ))r c cr b b a b a aD D n n n D tn , (3)
wherer is a positive constant.
Two‐Way Fuzzy Attributed Map Matching
The process used to match two ARMs is presented in this section. For convenience, we refer to one ARM as the observed ARM, denoted by O, and the other as the template ARM, denoted by E. The proposed matching process consists of three steps: contextual set location, set fuzzification, and two‐way matching.
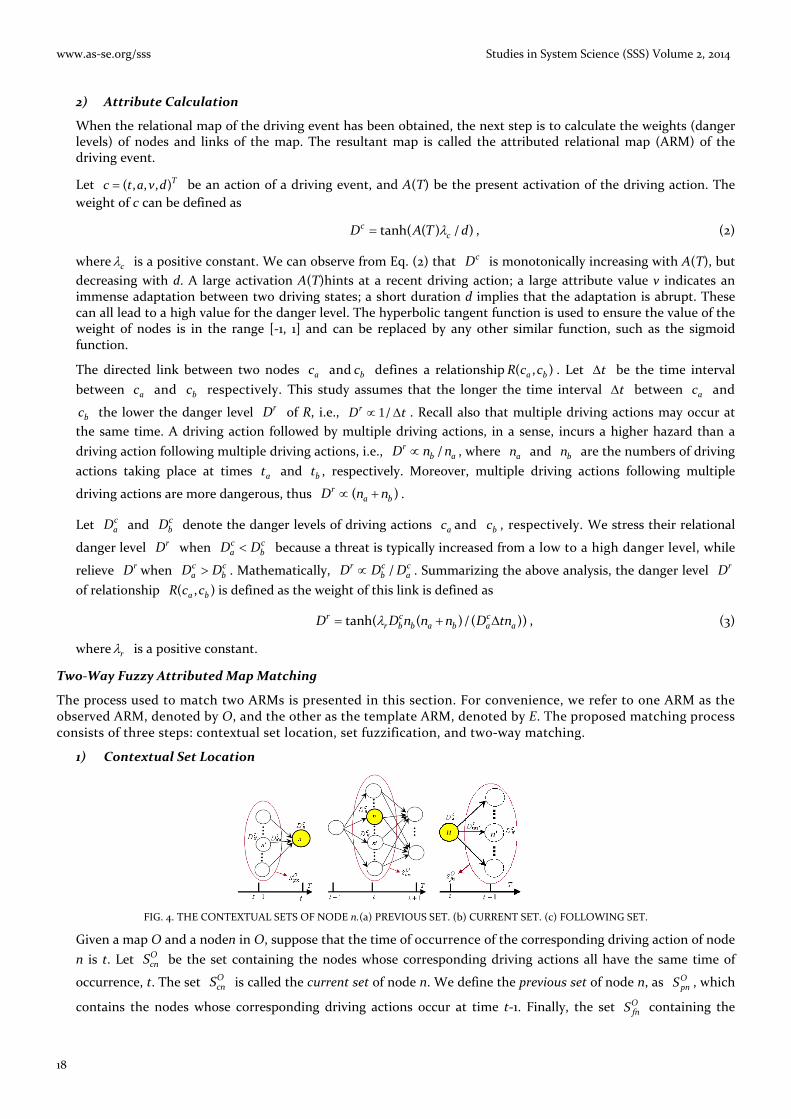
1) Contextual Set Location
FIG. 4. THE CONTEXTUAL SETS OF NODE n.(a) PREVIOUS SET. (b) CURRENT SET. (c) FOLLOWING SET.
Given a map O and a noden in O, suppose that the time of occurrence of the corresponding driving action of node
n is t. Let OcnS be the set containing the nodes whose corresponding driving actions all have the same time of
occurrence, t. The set OcnS is called the current set of node n. We define the previous set of node n, as O
pnS , which
contains the nodes whose corresponding driving actions occur at time t‐1. Finally, the set OfnS containing the

Studies in System Science (SSS) Volume 2, 2014 www.as‐se.org/sss
19
nodes whose corresponding driving actions have the same time of occurrence t+1 is defined as the following set of
node n. The sets OpnS , O
cnS and OfnS are collectively called the contextual sets of node n, as shown in Fig. 4. The
above process repeats for every node in map O.
2) Set Fuzzification
The contextual sets of the nodes inevitably involve various types of uncertainty, such as inadequate location of the driving event, imperfect map construction, and measurement errors and inaccuracies. Tools from fuzzy theory
provide an elegant approach to deal with such uncertainties. We let OpnS , OcnS , and OfnS denote the fuzzy
versions of sets OpnS , O
cnS , and OfnS , which are interpreted in terms of the potential danger that may affect the
observed driving event.
For fuzzy set OcnS , let OcnS be its membership function. Let 'n be any node in OcnS with positive danger level
'cnD . Since the danger level of a node in a set reflects its relative importance with respect to the other nodes in the
set, the larger the danger level of the node the more important the node in the set. Hence, such a node should
possess a larger membership grade of belonging to the set. Along this line of thought, '( ')Ocn
cnS
n D . We relate its
two sides with cnD to arrive at
( )Ocn
Ocn
cc nnS c
mm S
Dn D
D . (4)
Next, consider fuzzy previous set OpnS whose membership function is OpnS. Let 'n be any node in OpnS with
positive danger level cnD . As discussed above, '( ')O
pn
cnS
n D . Let the link between nodes 'n and n with
positive danger level 'rn nD . This value reflects the linkage strength between the two nodes. A large '
rn nD hints at
a firm relationship between nodes 'n and n and, in turn, 'n and set OpnS . Therefore, '( ')Opn
rn nS
n D . Since
'( ')Opn
cnS
n D and '( ')Opn
rn nS
n D must hold simultaneously, it follows that ' '( ') ( , )Opn
c rn n nS
n D D , where
denotes fuzzy intersection. The two sides of the above expression are related with the danger level cnD of node n
to obtain
( , )( )
( , )Opn
Opn
c rc n n nnS c r
m mnm S
D Dn D
D D , (5)
where denotes fuzzy intersection. Similarly, we define the membership function of the fuzzy following set OfnS
as
( , )( )
( , )Ofn
Ofn
c rc n nnnS c r
m nmm S
D Dn D
D D . (6)
In order to avoid division by zero, a small positive constant can be added to the denominators in the above definitions.
Having completed the definitions for the membership functions of fuzzy contextual sets for all nodes of the observed ARM O, we repeated the same definition process for the template ARM E. In practice, the definition process is applied to all template ARMs in the database in advance so as to reduce the processing time of the map matching step.
Two‐Way Matching
Let n be a node in map O and 'n be a node in map E, which has the same attribute as node n. The degree in the match of these two nodes is calculated by

www.as‐se.org/sss Studies in System Science (SSS) Volume 2, 2014
20
1
3
'' '
' ' '
| || | | |( , ') ( )
| | | | | |
O EO E O Efn fnpn pn cn cn
O E O E O Epn pn cn cn fn fn
S SS S S Sn n
S S S S S S, (7)
where |‧| indicates the fuzzy scalar cardinality and is the fuzzy union operator. In the above equation, we set
| | ' , where denotes the fuzzy empty set and ' is a small positive constant. It should be noted that the
contextual information of nodes n and 'n has been considered in the calculation. The degree of match between maps O and E can be defined as
1 1
'' '
( , ) { ( , '), ( , ')}E On nn S n Sn O n Eo E
O E n n n nn n
(8)
where EnS is the setof all the nodes in map Ewith the same attribute as node n, and '
OnS is the set of all the nodes in
map O with the same attribute as node 'n . The values On and En indicate the total number of nodes in map O
and E respectively. Equation (8) performs a two‐way matching. The first term calculates the degree of matching map E with map O, whereas the second term calculates the degree of matching map O with map E. The resultant degree of match of the maps O and E is determined through the fuzzy intersection of the two individual degrees of match.
Danger Evaluation
The objective for the danger evaluation stage is to calculate the danger level of a driving event. Let
1 2 { , ,..., }c
c c c cnD D DD and 1 2 { , ,..., }
r
r r r rnD D DD be the weights of nodes 1 2 { , ,..., }
cnc c cC and links 1 2 { , ,..., }
rnr r rR
of the ARM of the driving event, respectively. Let link jr connect nodes ic and kc , whose times of occurrence are
it and kt , respectively. The time of occurrence of link jr is defined by the average 2 ( )/j i kt t t . The danger level,
D, of an ARM can be defined as
1
11 1
2
cc
( )max{ } ( [ ]/ )max{ }c rj j
j i j i
n nc r
n i n i i rS r Si i
D G t t D G t t t D (9)
where ciS {c| c occurring at time it }, r
iS {r| r occurring at time it }, and ( )G is the Gaussian function. Note
that a threshold should be given in Eq. (9) to check whether one driving event is dangerous. This threshold was set to 0.75 in this study.
When a template ARM stored in the database is matched by an observed ARM, an update process is used to update the database. This update is achieved by calculating the ARMs danger levels using Eq. (9), and the one with higher danger level is stored in the database. This means that a template ARM may be replaced once its matched ARM has a higher danger level. Note that each template ARM represents one type of dangerous driving event. To change any node or link of a template ARM separately, one may create a virtual driving event that does not actually exist. Thus, we believe that selecting one ARM from the observed ARM and its matching template ARM, and storing the selected ARM without changing any nodes and links, is a reasonable method to update the database.
Summary of Dangerous Driving Event Prediction
Given an observed ARM O constructed from a driving event located in an input sequence of driving actions, we can summarize the dangerous driving event prediction process as follows.
1. If the databaseB of template ARMs is empty, then go to Step 5.
2. For each ARM E in B,calculate the degree of the match( , )O E using Eq. (8).
3. Determine the template ARM *E that has the highest degree of match with map O.
4. If *( , )O E is above a threshold, report the dangerous driving event corresponding to *E , update the data‐
base B, remove the observed driving event from the input sequence, and continue. Otherwise, go to Step 5.
5. Calculate the danger level Dof ARM O using Eq. (9).
a. If D is larger than a threshold, store ARM O as a new template in B, report the dangerous driving event associated with O, remove the observed driving event from the input sequence, and continue.
b. If Dis less than the threshold, continue.
In the above algorithm, “continue” means “input the following observed ARM and go to Step 1.”
Studies in System Science (SSS) Volume 2, 2014 www.as‐se.org/sss
21
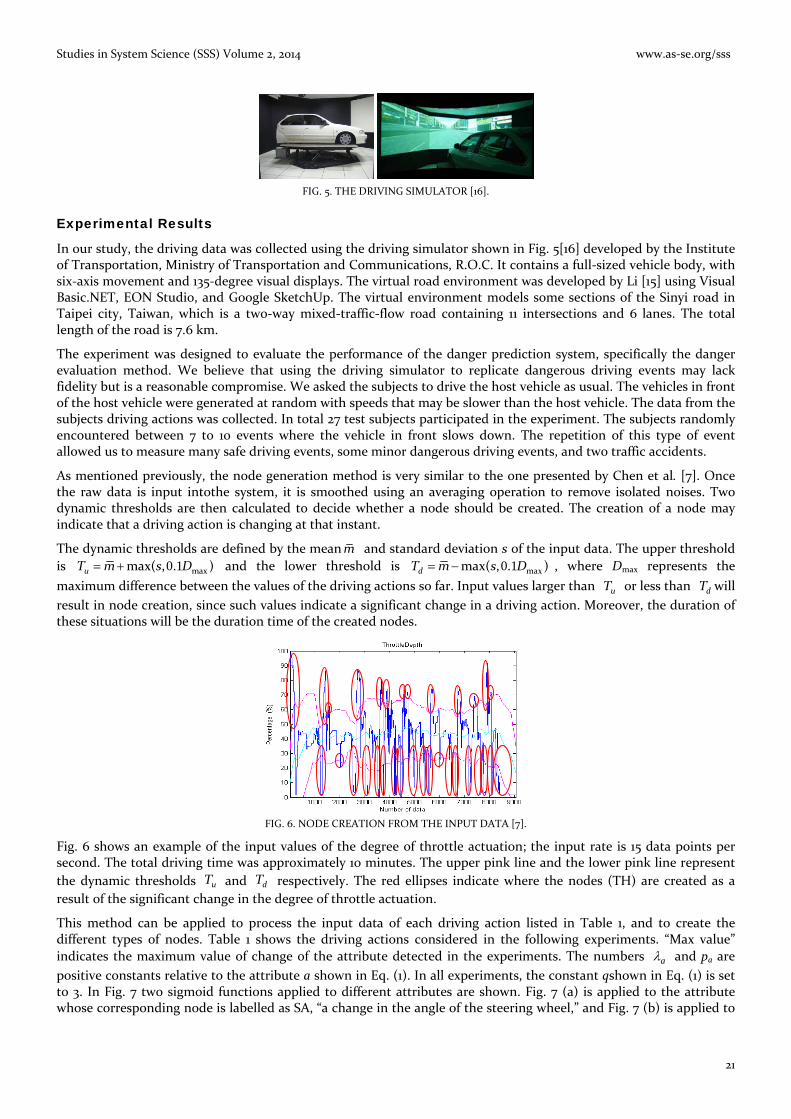
FIG. 5. THE DRIVING SIMULATOR [16].
Experimental Results
In our study, the driving data was collected using the driving simulator shown in Fig. 5[16] developed by the Institute of Transportation, Ministry of Transportation and Communications, R.O.C. It contains a full‐sized vehicle body, with six‐axis movement and 135‐degree visual displays. The virtual road environment was developed by Li [15] using Visual Basic.NET, EON Studio, and Google SketchUp. The virtual environment models some sections of the Sinyi road in Taipei city, Taiwan, which is a two‐way mixed‐traffic‐flow road containing 11 intersections and 6 lanes. The total length of the road is 7.6 km.
The experiment was designed to evaluate the performance of the danger prediction system, specifically the danger evaluation method. We believe that using the driving simulator to replicate dangerous driving events may lack fidelity but is a reasonable compromise. We asked the subjects to drive the host vehicle as usual. The vehicles in front of the host vehicle were generated at random with speeds that may be slower than the host vehicle. The data from the subjects driving actions was collected. In total 27 test subjects participated in the experiment. The subjects randomly encountered between 7 to 10 events where the vehicle in front slows down. The repetition of this type of event allowed us to measure many safe driving events, some minor dangerous driving events, and two traffic accidents.
As mentioned previously, the node generation method is very similar to the one presented by Chen et al. [7]. Once the raw data is input intothe system, it is smoothed using an averaging operation to remove isolated noises. Two dynamic thresholds are then calculated to decide whether a node should be created. The creation of a node may indicate that a driving action is changing at that instant.
The dynamic thresholds are defined by the meanm and standard deviation s of the input data. The upper threshold
is 0 1 maxmax( , . )uT m s D and the lower threshold is 0 1 maxmax( , . )dT m s D , where Dmax represents the
maximum difference between the values of the driving actions so far. Input values larger than uT or less than dT will
result in node creation, since such values indicate a significant change in a driving action. Moreover, the duration of these situations will be the duration time of the created nodes.
FIG. 6. NODE CREATION FROM THE INPUT DATA [7].
Fig. 6 shows an example of the input values of the degree of throttle actuation; the input rate is 15 data points per second. The total driving time was approximately 10 minutes. The upper pink line and the lower pink line represent
the dynamic thresholds uT and dT respectively. The red ellipses indicate where the nodes (TH) are created as a
result of the significant change in the degree of throttle actuation.
This method can be applied to process the input data of each driving action listed in Table 1, and to create the different types of nodes. Table 1 shows the driving actions considered in the following experiments. “Max value”
indicates the maximum value of change of the attribute detected in the experiments. The numbers a and pa are
positive constants relative to the attribute a shown in Eq. (1). In all experiments, the constant qshown in Eq. (1) is set to 3. In Fig. 7 two sigmoid functions applied to different attributes are shown. Fig. 7 (a) is applied to the attribute whose corresponding node is labelled as SA, “a change in the angle of the steering wheel,” and Fig. 7 (b) is applied to

www.as‐se.org/sss Studies in System Science (SSS) Volume 2, 2014
22
the attribute whose corresponding node is labelled as TH, “a change in the degree of the throttle actuation.” A total of
eight sigmoid functions are needed in the experiments since a is set to eight different values. The value c in Eq.
(2) is set to 1 and r in Eq. (3) is set to 0.1.
TABLE 1. DRIVING ACTIONS CONSIDERED IN THE EXPERIMENTS.
No. Label Description Max Value a pa
1 SA A change in the angle of the steering wheel. 260 0.011 0.500
2 TH A change in the degree of the throttle actuation. 100 0.045 0.070
3 BR A change in the degree of the brake actuation. 100 0.045 0.070
4 AX A change in the lateral acceleration of the vehicle. 8 0.500 0.438
5 AY A change in the longitudinal acceleration of the vehicle. 8 0.500 0.175
6 VX A change in the lateral speed of the vehicle. 0.15 18.000 0.438
7 VY A change in the longitudinal speed of the vehicle. 20 0.200 0.078
8 PX A change in the lateral position of the vehicle. 5 0.600 0.438
9 PY A change in the longitudinal position of the vehicle. 700 0.014 0.438
10 DX A change in the lateral distance between the nearest neighbor vehicle and the host vehicle.
5 0.700 0.500
11 DY A change in the longitudinal distance between the nearest neighbor vehicle and the host vehicle.
25 0.700 0.500
FIG. 7. TWO SIGMOID FUNCTIONS FOR EXAMPLE ATTRIBUTES, (a) SA AND (b) TH.
It should be noted that to simplify the representation of the ARM, the details of the attributes of the nodes that are recorded in the system are not shown in the figures. For example, a node labelled AX is used to indicate “a change in the angle of the steering wheel.” This change is independent of whether the steering wheel turns to the left or right; the AX node will be created. Similarly, the DX node is used to indicate a change of lateral distance between the nearest neighbor vehicle and the host vehicle. “The nearest neighbor vehicle” in this context, may indicate different positions of the vehicles, including in front, behind, left, or right. A detailed description will be shown in the context.
(a) (b) FIG. 8. TWO SAFE ARMS.
In Fig. 8, two normal safe ARMs are shown. Fig. 8 (a) shows an ARM containing three TH nodes. These nodes are
(a)
(b)

Studies in System Science (SSS) Volume 2, 2014 www.as‐se.org/sss
23
orderly generated from 312.18 to 351.23 seconds. The weights of the nodes are 0.126, 0.848, and 0.999, respectively, and the weights of the links are 0.084 and 0.010. Since the time intervals between the nodes are significant, the corresponding danger levels at time 312.18, 328.07, and 351.23 seconds are 0.241, 0.252, and 0.252, respectively. The average time interval between the three nodes is large (about 20 seconds), thus the danger levels are minimal, and the ARM represents a safe driving event. In this case, the subject is driving with minimal disturbance, gently changing the degree of throttle actuation to maintain the speed of the vehicle. In Fig. 8 (b) another ARM containing three nodes, one VY and two TH nodes, is shown. This ARM also represents a safe driving event. In this case, the subject gradually changes the degree of throttle actuation and the longitudinal speed of the vehicle is also changed.
FIG. 9. ARM DEMONSTRATING A MINOR DANGEROUS DRIVING EVENT.
In Fig. 9, an example of a small dangerous driving event is shown. In this case, the ARM contains six nodes, which are generated from 157.20 to 164.62 seconds. When the vehicle in front slows down, the subject moves to the left lane (DX is created at 157.20 seconds), this subsequently slows down the host vehicle (BR at 157.97) and then increases the speed of the host vehicle (DX at 164.62). The actions of “change lane, slow down, then speed up” are considered a minor dangerous driving event if the degree of these changes is small, thus the danger level has increased to 0.306.
FIG. 10. ARM DEMONSTRATING A MEDIUM LEVEL DANGEROUS DRIVING EVENT.
In Fig. 10, an example of a medium level dangerous driving event is shown. In Fig. 10, the ARM contains 12 nodes that are generated from 403.75 to 414.27 seconds. In this case, when the vehicle in front unexpectedly slows down, the subject suddenly shifts the host vehicle to the left (SA is created at 403.75 seconds and VX is created at 404.62 seconds), then to the right (SA, VX, and PX at 405.14), and then decides to change lane to the left (AY at 407.97). However, a vehicle in the left lane is very close to the host vehicle (DY at 414.27). It is clear that the number of nodes in Fig. 11 is greater than that in Fig. 8, since the subject’s response (behavior) is more complex and more dangerous. Note that the danger level has increased from 0.171 to 0.591 because the subject’s behavior is significant. The level then decreases again, falling to 0.214 and 0.264. Finally, it increases to 0.470 since the vehicle on the left is approaching quickly when the subject changes to the left lane.
FIG. 11. ARM DEMONSTRATING A VERY DANGEROUS DRIVING EVENT.

www.as‐se.org/sss Studies in System Science (SSS) Volume 2, 2014
24
In Fig. 11, an example of a very dangerous driving event is shown. In this case, when the vehicle in front unexpectedly slows down, the subject changes lane to the left (PX at 297.18) and then speeds up (TH at 299.12 and AY, VY at 302.06). At the same time, a vehicle behind in the left lane also speeds up thus the vehicle from behind (DY at 305.85) hits the host vehicle. The danger level 0.765 is very high. In Fig. 13, an extreme dangerous driving event is shown. In this case, when the vehicle in front unexpectedly slows down, the subject also slows down (BR at 72.67) before speeding up (TH and AY at 73.59, VY at 74.89, and TH at 82.39). This causes the subject to hit the front vehicle (DY at 87.25), causing the extreme danger level of 0.981.
FIG. 12. ARM DEMONSTRATING AN EXTREME DANGEROUS DRIVING EVENT.
TABLE 2. THE DEGREE OF MATCH IN THE SUB‐ARMS.
Time 72.67 73.59 74.89 82.39 87.25
Degree of match 0.111 0.190 0.479 0.778 1
Table 2 shows the degree of match in the sub‐ARMs comparing with the ARM shown in Fig. 12. Suppose that the ARM E shown in Fig. 12 has been stored in the database. If an observed ARM O contains only the BR, the degree of match between E andO is 0.111. If the TH and AY nodes are subsequently input in the system, and ARM O is reconstructed as a sub‐ARM of E containing 3 nodes, then the degree of match between E and O increases to 0.190. Similarly, if the nodes VY, TH, and DY are input into the system in order, then their corresponding degrees of match are 0.479, 0.778, and 1, respectively. This example illustrates the matching method shown in Eq. (8). The system will output a corresponding warning message for E if the degree of match between E andOis significant. The proposed system is capable of predicting the dangerous driving events.
TABLE 3. THE LEVEL OF DANGER AND DEGREE OF MATCH IN THE SUB‐ARMS.
Node Deleted BR TH AY VY TH DY
Degree of match 0.722 0.670 0.812 0.667 0.590 0.778
Level of danger 0.738 0.976 0.981 0.740 0.731 0.738
Table 3 shows the degree of match of the sub‐ARMs comparing with the ARM shown in Fig. 12. We remove only one node each time from the ARM E shown in Fig. 12 to construct sub‐ARMs from E. The degrees of match of the sub‐ARMs when compared to E range from approximately 0.590 to 0.812. We can observe that a sub‐ARM missing node AY obtains the largest degree of match. This means that node AY is least important in ARM E. The danger levels of these sub‐ARMs are also shown in Table 3. We can observe that the level of danger of the sub‐ARM minus node AY, is 0.981 (largest). This is the same value as that obtained with AY included, i.e. that of the full ARM E. This is because Eq. (9) uses the maximum operator to obtain the degree of danger, which means that node AY will not affect the degree of danger of the driving event in this example.
Concluding Remarks and Future Work
In this paper, a template based dangerous driving event prediction system was presented. There are four major tasks involved in the system: perception, representation, interpretation, and database updating. To solve these tasks we proposeed four techniques: an activation mechanism, an attributed relational map (ARM), two‐way fuzzy attributed map matching (FAMM), and a danger evaluation process.
The driving events in this study are constructed from a sequence of continuous driving actions, and do not have obvious corresponding meanings such as turning right or left. When the driving events have been stored in the database to become template ARMs, they are only regarded as “one of the dangerous driving events,” and not, for example, “the dangerous driving event when the vehicle in front unexpectedly slows down, the driver changes lane to the left and then speeds up.” We believe our proposed method has greater flexibility in incorporating new types of driving events.

Studies in System Science (SSS) Volume 2, 2014 www.as‐se.org/sss
25
In conclusion, the proposed system can use the detected dangerous driving events to predict the current driving danger and avoid corresponding traffic accidents. Further, the system also automatically estimates the danger level of a driving event without prior knowledge of that event. The proposed method was applied to experimental data obtained from a driving simulator, demonstrating its use.
There are still many aspects requiring further study. These include (a) avoiding the unwanted location of sub‐events in longer events in the input sequence; (b) improving the evaluation of the danger level of driving actions, their relationships, and driving events; (c) exploring effective database organization to optimize the template event search; and (d) investigating biological techniques in addition to the engineering ones for system development.
ACKNOWLEDGMENT
This work was supported by the National Science Council, Republic of China, under Contract 99‐2221‐E‐003‐019‐MY2 and NSC 102‐2221‐E‐003‐015‐. And the driving simulator was supported by Institute of Transportation, Ministry of Transportation and Communications, R.O.C.
REFERENCES
[1] Adell, E., Várhelyi, A., and Fontana, M. dalla. “The effects of a driver assistance system for safe speed and safe distance – a
real‐life field study.” Transportation Research Part C: Emerging Technologies, 19 (1) 145‐155, 2011.
[2] Ammoun, S., and Nashashibi, F. “Design and efficiency measurement of cooperative driver assistance system based on
wireless communication devices.” Transportation Research Part C: Emerging Technologies, 18 (3) 408‐428, 2010.
[3] Barnes, N., Zelinsky, A., and Fletcher, L.S. “Real‐time speed sign detection using the radial symmetry detector.” IEEE Trans.
on Intelligent Transportation Systems, 9 (2) 322‐332, 2008.
[4] Caraffi, C., Cattani, S., and Grisleri, P. “Off‐road path and obstacle detection using decision networks and stereo vision.” IEEE
Trans. on Intelligent Transportation Systems, 8 (4) 607‐618, 2007.
[5] Cheng, H., Zheng, N., Zhang, X., Qin, J., and Wetering, H. van de. “Interactive road situation analysis for driver assistance
and safety warning systems: framework and algorithms.” IEEE Trans. on Intelligent Transportation Systems, 8 (1) 157‐167,
2007.
[6] Cheng, H. Y., Gau, V., Huang, C. W., and Hwang, J. N. “Advanced formation and delivery of traffic information in intelligent
transportation systems.” Expert Systems with Applications, 39 (9), 8356‐8368, 2012.
[7] Chen, S. W., Fang, C. Y., Tien, C. T. “Driving behaviour modelling system based on graph construction.”Transportation
Research Part C: Emerging Technologies, 26, 314‐330, 2013.
[8] Dagli, I., Brost, M., and Breuel, G. “Action recognition and prediction for driver assistance systems using dynamic belief
networks.” in Agent Technologies, Infrastructures, Tools, and Applications for E‐Services, Eds. By R. Kowalczyk, J. P. Muller,
H. Tianeld, and R. Unland. Lecture Notes in Computer Science, 2592 179‐194, Springer, 2002.
[9] Fang, C. Y., Hsueh, H. L., and Chen, S. W. “Dangerous driving event analysis system by a cascaded fuzzy reasoning petri net.”
Proc. of the 9th IEEE Int’l. Conf. on Intelligent Transportation Systems, Toronto, Canada, 337‐342, 2006.
[10] Fang, C. Y., Wu, B. Y., Wang, J. M., and Chen, S. W. “Dangerous driving event prediction on expressways using fuzzy
attributed map matching.” Proceedings of the International Conference of Machine Learning and Cybernetics (ICMLC 2010),
Qingdao, Shandong, China, 11‐14, 2010.
[11] Helander, M. “Applicability of drivers' electrodermal response to the design of the traffic environment.” Journal of Applied
Psychology, 63(4) 481‐488, 1978.
[12] Ji, Q., Zhu, Z., and Lan, P. “Real‐time nonintrusive monitoring and prediction of driver fatigue.” IEEE Trans. Vehicular
Technology, 53 (4) 1052‐1068, 2004.
[13] Jiménez, F., Aparicio, F., and Estrada, G. “Measurement uncertainty determination and curve‐fitting algorithms for
development of accurate digital maps for advanced driver assistance systems.” Transportation Research Part C: Emerging
Technologies, 17 (3) 225‐239, 2009.
www.as‐se.org/sss Studies in System Science (SSS) Volume 2, 2014
26
[14] Kuge, N., Yamamura, T., and Shimoyama, O. “A driver behavior recognition method based on a driver model framework.”
Society of Automotive Engineering Publication, 1998.
[15] Li, C. L. “A driving simulator development to apply to a driver‐behavior research.” Master thesis, Department of Mechanical
Engineering, National Central University, 2005.
[16] Lin, C. Y. “IOT DS instruction manual, Technique Report.” Institute of Transportation, Ministry of Transportation and
Communications, R.O.C., 2010.
[17] Mitrovi´c, D. “Reliable method for driving events recognition.” IEEE Trans. on Intelligent Transportation Systems, 6 (2)
198‐205, 2005.
[18] Milanés, V., Pérez, J., Godoy, J., and Onieva, E. “A fuzzy aid rear‐end collision warning/avoidance system.”Expert Systems
with Applications, 39 (10), 9097‐9107, 2012.
[19] Oliver, N. and Pentland, A.P. “Graphical models for driver behavior recognition in a smartcar.” Proc. of the IEEE Intelligent
Vehicles Symp. Dearborn, Michigan, 7‐12, 2000.
[20] Pentland, A. and Liu, A. “Toward augmented control systems.” Proc. of the IEEE Conf. on Intelligent Transportation Systems,
Detroit, Michigan, 350‐355, 1995.
[21] Ruichek, Y. “Multilevel‐ and neural‐network‐based stereo‐matching method for real‐time obstacle detection using linear
cameras.” IEEE Trans. on Intelligent Transportation Systems, 6 (1) 54‐62, 2005.
[22] Schraut, M., Naab, K., and Bachmann, T. “BMW's driver assistance concept for integrated longitudinal support.” The 7th
Intelligent Transport Systems World Congress, (2121) Turin, Italy, 2000.
[23] Wang, J. G., Linb, C. J. and Chen S. M. “Applying fuzzy method to vision‐based lane detection and departure warning
system.”Expert Systems with Applications, 37 (1), 113‐126., 2010.
Sei‐Wang Chen received the M. Sc. and Ph.D. degrees in computer science and engineering from MichiganStateUniversity, East Lansing, Michigan, in 1985 and 1989, respectively. In 1990, he was a researcher in the AdvancedTechnologyCenter of the Computer and Communication Laboratories at the Industrial Technology Research Institute, Hsinchu, Taiwan, Republic of China. He is currently a full professor of the Department of Computer Science and Information Engineering at the National Taiwan Normal University, Taipei, Taiwan, Republic of China. He was elected to the grades of IEEE Senior Member and the IET Fellow in 1997 and 2012, respectively. Since 1991, he has been the Director of Image Processing and Computer Vision – Intelligent
Transportation Systems (IPCV‐ITS) Lab at the University. His areas of research interest include pattern recognition, image processing, computer vision, and Intelligent Transportation Systems.
Chiung‐Yao Fang received the B.Sc. Degree and the M.Sc. degree in Information and Computer Education from National Taiwan Normal University, Taipei, Taiwan, R.O.C., in 1992 and 1994, respectively, and Ph.D. degrees in Computer Science and Information Engineering from National Taiwan University, Taipei, Taiwan, R.O.C., in 2003. She is currently an Associate Professor of the Department of Computer Science and Information Engineering at the National Taiwan Normal University, Taipei, Taiwan, R.O.C. Her research interests include vision‐based driver assistance systems, vision‐based infant monitoring systems, artificial neural networks, pattern recognition, and computer vision.
Bo‐Yan Wu received the B.Sc. Degree and the M.Sc. degree in Information and Computer Education from National Taiwan Normal University, Taipei, Taiwan, R.O.C., in 2006 and 2008, respectively. Now he is working in Garmin Corporation, Taipei, Taiwan, R.O.C as a Software Engineer.He is good at Windows application programming.
Chih‐Ting Tien received the B.Sc. degree and the M.Sc. degree in Computer Science and Information Engineering at the National Taiwan Normal University, Taipei, Taiwan, R.O.C., in 2009 and 2011, respectively.She is currently a computer science teacher at the Luzhou Junior High School, New Taipei, Taiwan, R.O.C.