articledang/coursecg/s6-festim.pdf · · 2007-01-03the use of inbred patients whose exact...
TRANSCRIPT

62 The American Journal of Human Genetics Volume 79 July 2006 www.ajhg.org
ARTICLE
Using Genomic Inbreeding Coefficient Estimates forHomozygosity Mapping of Rare Recessive Traits: Applicationto Taybi-Linder SyndromeAnne-Louise Leutenegger, Audrey Labalme, Emmanuelle Genin, Annick Toutain, Elisabeth Steichen,Francoise Clerget-Darpoux, and Patrick Edery
The use of inbred patients whose exact genealogy may not be available is of primary interest in mapping genes involvedin rare recessive diseases. We show here that this can be achieved by estimating inbreeding coefficients from the patients’genomic information and using these estimates to perform homozygosity mapping. We show the interest of the approachby mapping a gene for Taybi-Linder syndrome to chromosome 2q, with the use of a key patient with no genealogicalinformation.
From the INSERM U535, Villejuif, France (A.L.L.; E.G.; F.C.-D.); INSERM U679 (A.L.L.), Universite Paris 6 (A.L.L.), Hopital Pitie-Salpetriere (A.L.L.),and Universite Paris 11 (E.G.; F.C.-D.), Paris; Hospices Civils de Lyon (A.L.; P.E.) and EA 3739, Universite Claude Bernard–Lyon1 (P.E.), Lyon, France;Centre Hospitalier et Universitaire de Tours, Tours, France (A.T.); and Universitat Klinik fur Kinder- und Jugendheilkunde, Innsbruck, Austria (E.S.)
Received February 13, 2006; accepted for publication March 27, 2006; electronically published April 28, 2006.Address for correspondence and reprints: Dr. Francoise Clerget-Darpoux, INSERM U535, BP 1000, 94817 Villejuif Cedex, France. E-mail:
[email protected]. J. Hum. Genet. 2006;79:62–66. � 2006 by The American Society of Human Genetics. All rights reserved. 0002-9297/2006/7901-0008$15.00
Affected offspring from consanguineous marriages may beof particular interest in mapping genes involved in reces-sive diseases. The disease locus is, indeed, likely to befound in a region where affected individuals have receivedtwice the same ancestral allele (identical by descent [IBD]).In such a region, the alleles at polymorphic loci surround-ing the disease locus are likely to be also IBD. The patientis said to be autozygous in such a region.
Lander and Botstein1 proposed a method, referred to as“homozygosity mapping,” that consists of searching for aregion of the genome that is autozygous in inbred indi-viduals affected by a given disease. They showed that, toquantify the evidence of linkage provided by such a re-gion, a LOD score could be computed for the marker ob-servations by comparing the likelihood of being at thedisease locus with the likelihood of being at a randompoint on the genome. Calculation of the latter likelihoodrequires that, for each affected inbred individual, thechance of having two IBD alleles at a locus randomly sam-pled on the individual’s genome is known. By definition,2,3
this value is the individual’s inbreeding coefficient (F).Efficient algorithms4–7 based on the known genealogyhave been previously developed to compute F.
However, information on genealogy may not be accu-rate or may even be lacking, especially for populations inwhich marriages between relatives are very frequent, mak-ing relationships very complex. Miano et al.8 reportedsome pitfalls in homozygosity mapping. One of them waspotential LOD score inflation and hence potential increasein false linkage evidence because of underestimation ofthe extent of inbreeding in the affected individual or,equivalently, of the extent of kinship between the parentsof a patient. More generally in linkage analysis, under-estimation of the parental relationships may lead to anincrease in type I error.9
Here, we propose to estimate F from each individual’sgenomic information (by FEstim) as presented by Leute-negger et al.10 and to use this genomic F to control forparental relationships in the LOD score computation.Hence, to perform linkage analysis when parental rela-tionships are poorly known, we introduce a new homo-zygosity mapping statistic, FLOD. This statistic allows in-vestigators to include inbred patients in homozygos-ity mapping without having any knowledge of theirgenealogy.
We show the advantage of FLOD over the usual ho-mozygosity mapping LOD score (HMLOD) by mappingthe first locus for an autosomal recessive disease, Taybi-Linder syndrome, with the use of a key patient withoutany genealogical information.
MethodsEstimation of the Genomic Inbreeding Coefficient by FEstim
We have proposed a new method, FEstim, to estimate the in-breeding coefficient F of an individual by use of the individual’sgenomic data.10 Our method does not require any knowledge ofthe parental relationships. Instead, it uses only information ongenotypes at random markers throughout the individual’s ge-nome, which allows an estimation of the proportion of the ge-nome that is autozygous. The observed marker genotypes aremodeled by a hidden Markov chain that depends on F and onthe rate of change of IBD status per cM. These are both estimatedby maximum likelihood, with the intermarker genetic distancesand marker-allele frequencies specified. It is worth noting thatthe reliability of our estimator depends on the informativity ateach point of the genome—that is, on the density and hetero-zygosity rate of the markers.
FEstim gives more-specific information about an individual’sgenome than the genealogy does, because it better reflects thetrue proportion of the individual’s genome that is autozygous.Indeed, the genealogical F is the expected value of the genomic

www.ajhg.org The American Journal of Human Genetics Volume 79 July 2006 63
F. Since the genome of an individual is of finite size and onlyrepresents a small gene sampling, a large variance around thisexpected value may be observed. Thus, the use of an individual’sgenealogy to estimate the chance of having two IBD alleles atany random point on the genome may give estimates that arevery far from what is actually happening on the genome. Foroffspring of first cousins, for instance, the probability of samplingan autozygous marker from their genome may be as low as 3%and as high as 12% when its expected value from the genealogyis 6%.10
New Homozygosity Mapping Statistic FLOD
We propose to incorporate this genomic F, estimated for eachaffected inbred individual, into the LOD score statistic, insteadof F estimated from the genealogy. For a given affected inbredindividual, we define FLOD at marker k as
P(X p 1 d Y) � qP(X p 0 d Y)k klog ,10 f � q(1 � f )
where f is the genomic estimate of F, q is the disease-allele fre-quency, Xk is the IBD status at marker k (1 for IBD; 0 for nonIBD), and Y is the observed genotypes at all markers along theindividual’s genome. The LOD score statistic FLOD is computedusing a multipoint method. More details can be found in thework of Leutenegger.11
For a sample of independent, affected inbred individuals, theFLOD value for the sample is the sum of each individual FLOD.This statistic enables us to include in a linkage analysis anyaffected individuals, without requiring any genealogicalinformation.
When siblings of a patient are available for study, FEstim es-timates are obtained for all of them, and the median value forthe whole sibship can then be used to represent the parentalkinship. The FEstim estimation and FLOD computation havebeen implemented in the FEstim software, which is available onrequest ([email protected]).
Taybi-Linder Syndrome Data
Taybi-Linder syndrome, or microcephalic osteodysplastic pri-mordial dwarfism (MOPD) type I/III (MIM 210710), is a very rareautosomal recessive condition. It is characterized by intrauterinegrowth retardation, low birth weight, dwarfism, bone dysplasia,facial anomalies, microcephaly, and malformations of the brain.12
Fewer than 30 patients have been described to date, many ofwhom died within the 1st year of life because of infectiousdisease.13
Here, we study a sample of four inbred patients, including twosiblings (patients 1 and 2). The patients originated from the Med-iterranean region: Algeria, Turkey, and Morocco. Clinical reportson the four patients are given elsewhere—for patients 1–3, themanuscript is in preparation, and patient 4 was reported as case4 by Sigaudy et al.13 (the other patients described in that articledied within the first few mo of life; DNA from only patient 4 wasavailable for the present study). In all cases, inbreeding was pre-sent but not well documented. For the affected siblings and pa-tient 3, we had information that the parents were first cousinsand that additional relationships were likely. For patient 4, therewas no genealogical information at all. Additional members ofthe nuclear family were available for patients 1 and 2 (three un-affected siblings and their parents) and for patient 3 (her parents).
On the other hand, we had no relatives of patient 4. In total,blood samples from 11 individuals were collected. Participantsgave informed consent. DNA was extracted from blood lympho-cytes by use of standard procedures. A high-density genomewidescan was performed through deCODE services with the use of a1,000-marker fluorescent-labeled microsatellite screening set thatcovered the whole genome with an average density of 3.7 cM,where genetic locations were based on the deCODE map.14 Themap used here allows us to get very accurate estimates of thegenomic inbreeding coefficient F with FEstim. Indeed, with thespecific map characteristics, we have, as in the work of Leute-negger et al.,10 a high correlation of 0.9 between the estimated Fand the true proportion of genome IBD for offspring of firstcousins.
First, we estimated the genomic inbreeding coefficient of allpatients and their available siblings, using FEstim. We then com-puted FLOD for the whole sample with these estimated F values.Finally, we computed HMLOD, assuming a first-cousin relation-ship for the parents of patients 1, 2, and 3 while excluding patient4 because the calculation could not be done using a standardcomputer package, such as Allegro.15 For all LOD score compu-tations, we used a fully penetrant autosomal recessive model anda disease-allele frequency of 0.00001. To check the sensitivity ofour results to the disease-allele frequency, we also performed theanalysis with a frequency of 0.0001. The LOD score values wereidentical up to the second decimal place (not shown).
Results
FEstim inbreeding coefficient estimates and 95% CIs areshown in figure 1. All inbreeding-coefficient estimates ofpatients were significantly different from zero. In partic-ular, patient 4 had an estimated F of 0.06, which showedthat the parents are, in fact, closely related. This patientis thus informative for linkage, whereas previously thepatient could not be used in any linkage analysis. For sib-lings 1 and 2, who have additional siblings available, weobserved a large variability of the FEstim estimates for thesibship, from 0.04 to 0.13. The estimate for patient 3 in-dicates the probable existence of remote consanguinitybesides the first-cousin relationship of her parents. Her Fis estimated to be 0.13, which is significantly ( )P ! .025higher than 0.06, the expected inbreeding coefficient forfirst-cousin offspring.
First, we used these FEstim estimates to compute themultipoint FLOD statistic on the entire sample of the pa-tients and their available relatives. We obtained a maxi-mum FLOD of 3.28 at the D2S347 marker. Moreover, anFLOD value 13 was also reached at D2S2271, the markeradjacent to D2S347. No other chromosomal region gavecombined LOD scores 12. A study of the affected individ-uals’ haplotypes on the chromosome 2q region showedmeiotic recombinations between centromeric markersD2S2254 and D2S347 for patient 3 and between telomericmarkers D2S2271 and D2S2215 for patients 1 and 2, thusrestricting the autozygous candidate region to an ∼13-cMinterval flanked by D2S2254 and D2S2215 on chromo-some 2q14.2-2q14.3 (table 1).
To compare our results with the usual homozygosity

64 The American Journal of Human Genetics Volume 79 July 2006 www.ajhg.org
Figure 1. FEstim-estimated inbreeding coefficient (F), SE, and 95% CI for the patients with Taybi-Linder syndrome and siblings. Themedian F value for each sibship and the reported parental relationships are also specified. The 95% CIs were computed as F � 1.96SE.
Table 1. Haplotypic Analysis Showing Candidate Region for the Taybi-Linder Syndrome Locuson Chromosome 2q14
Algeria Turkey
Location(cM) Marker Parents
UnaffectedSiblings Patient 1 Patient 2 Parents Patient 3
MoroccoPatient 4
132.2 D2S2254 2 2 2 2 2 2 2 2 2 2 2 2 2 2 2 2 2 12 2 12 9 9138.1 D2S347 1 5 1 8 1 5 8 5 8 1 1 1 1 1 1 9 6 1 1 1 1 1143.6 D2S2271 3 3 3 4 3 3 4 3 4 3 3 3 3 3 2 6 1 2 2 2 3 3145.4 D2S2215 5 9 9 3 9 9 3 9 3 5 9 5 9 5 4 7 7 4 4 4 10 10
NOTE.—Patients’ haplotypes defining the candidate region are shaded.
mapping statistic, we computed HMLOD for patients 1and 2 (the siblings), patient 3, and their available relatives,assuming a first-cousin relationship for the parents. Wedid not find evidence of linkage in any part of the genome,but we had some suggestive results, since the combinedHMLOD exceeded 2 in two chromosomal regions. We ob-tained LOD score values of 2.62 on chromosome 2q atD2S347 and of 2.19 on chromosome 7q at D7S514. Thus,no clear-cut linkage could be established by including onlythese three patients and their available relatives in thelinkage study. As can be seen in figure 2, because of ourFLOD statistic and the inclusion of patient 4, it was pos-sible, first, to exclude the 7q region, which had an FLODvalue of �1.25, and, second, to get a LOD score 13 in the2q region.
Discussion
We have mapped the first Taybi-Linder syndrome locus tochromosome 2q, using our genomically controlled ho-mozygosity mapping method. It allowed us to include inthe analysis a key patient with no available genealogy. Itis also interesting to note that this patient (patient 4), withan estimated genomic F of 0.06, is actually more infor-mative for linkage than patient 3, who had an estimatedgenomic F of 0.13.
It is worth noting that, for patient 3, the LOD scorevalues obtained with HMLOD under the assumption that
her parents are first cousins were inflated. This statisticreached 1.2 on chromosome 2q; however, with her actualinbreeding level of 0.13, the LOD score should be reducedby log10(2), thus reaching only 0.9, the observed FLODvalue on chromosome 2q.
Our proposed solution to incorporate the genomic F ofeach affected inbred individual, instead of the expected Ffrom the genealogy, into the LOD score statistic shouldmake it easier to map autosomal recessive traits. The FLODstatistic has the great advantage of taking into account theactual inbreeding of individuals and its variability whileallowing researchers to study a sample of patients withoutrequiring any genealogical information. As for any linkagestudy, however, it does require a very informative markermap. This was the case here, in which we used a map withan average intermarker distance of 3.7 cM and an averageheterozygosity rate of 0.75. A more standard 10-cM mi-crosatellite map would yield less precise F estimates.
The approach proposed here is especially well suited tostudying patients from populations with a long traditionof marriages between close relatives. For the case of pop-ulations with lower levels of inbreeding, such as founderpopulations, we are working on a typing strategy thatwould allow this sparse inbreeding to be correctly cap-tured. Indeed, in that case, one needs a high informativityat each point of the genome, which depends on bothmarker informativity and density. This will likely requiremixing SNP and microsatellite markers. However, when

Figure 2. LOD score plots of FLOD (black lines) and HMLOD (dashed gray lines) over the whole genome (A), chromosome 2q (B), andchromosome 7q (C) for the Taybi-Linder syndrome data. On the genomewide plot (A), the chromosome numbers are written at the top.B and C, FLOD123 (solid gray lines) represents FLOD computed for patients 1, 2, and 3 and their available relatives only (not patient4). The solid horizontal lines represent a LOD score of 3.
66 The American Journal of Human Genetics Volume 79 July 2006 www.ajhg.org
very dense marker maps are used, it is important to takeinto account the linkage disequilibrium that may be pre-sent between marker alleles. Finally, we currently are re-fining the disease locus interval and are undertaking acandidate-gene strategy with the aim of identifying theTaybi-Linder syndrome–causing gene itself.
Acknowledgments
We are grateful to the family members. We also thank Marie-Claude Babron for fruitful discussions. This work was supportedby the Unite de Formation et de Recherche Lyon-Nord 2005, theHospices Civils de Lyon (contracts HCL 1999, HCL 2001, andPHRC 01.099), and the Fondation pour la Recherche Medicale(projet ARS 2.13).
Web Resource
The URL for data presented herein is as follows:
Online Mendelian Inheritance in Man (OMIM), http://www.ncbi.nlm.nih.gov/Omim/ (for MOPD type I/III)
References
1. Lander ES, Botstein D (1987) Homozygosity mapping: a wayto map human recessive traits with the DNA of inbred chil-dren. Science 236:1567–1570
2. Wright S (1922) Coefficient of inbreeding and relationship.Am Nat 56:330–338
3. Malecot G (1948) Les mathematiques de l’heredite. Masson,Paris
4. Jacquard A (1966) Logique du calcul des coefficientsd’identite entre deux individus. Population (French Edition)21:751–776
5. Denniston C (1968) Probability and genetic relationship.PhDthesis, University of Wisconsin, Madison
6. Cockerman C (1971) Higher order probability functions ofidentity of alleles by descent. Genetics 69:235–246
7. Karigl G (1981) A recursive algorithm for the calculation ofidentity coefficients. Ann Hum Genet 45:299–305
8. Miano MG, Jacobson SG, Carothers A, Hanson I, Teague P,Lovell J, Cideciyan AV, Haider N, Stone EM, Sheffield VC,Wright AF (2000) Pitfalls in homozygosity mapping. Am JHum Genet 67:1348–1351
9. Leutenegger AL, Genin E, Thompson EA, Clerget-Darpoux F(2002) Impact of parental relationships in maximum lodscore affected sib-pair method. Genet Epidemiol 23:413–425
10. Leutenegger AL, Prum B, Genin E, Verny C, Lemainque A,Clerget-Darpoux F, Thompson EA (2003) Estimation of theinbreeding coefficient through use of genomic data. Am JHum Genet 73:516–523
11. Leutenegger AL (2003) Estimation of random genome shar-ing: consequences for linkage. PhD thesis, Universite Paris11, Paris, and University of Washington, Seattle
12. Taybi H, Linder D (1967) Congenital familial dwarfism withcephaloskeletal dysplasia. Radiology 89:275–281
13. Sigaudy S, Toutain A, Moncla A, Fredouille C, Bourliere B,Ayme S, Philip N (1998) Microcephalic osteodysplastic pri-mordial dwarfism Taybi-Linder type: report of four cases andreview of the literature. Am J Med Genet 80:16–24
14. Kong A, Gudbjartsson DF, Sainz J, Jonsdottir GM, GudjonssonSA, Richardsson B, Sigurdardottir S, Barnard J, Hallbeck B,Masson G, Shlien A, Palsson ST, Frigge ML, Thorgeirsson TE,Gulcher JR, Stefansson K (2002) A high-resolution recombi-nation map of the human genome. Nat Genet 31:241–247
15. Gudbjartsson DF, Jonasson K, Frigge ML, Kong A (2000) Al-legro, a new computer program for multipoint linkage anal-ysis. Nat Genet 25:12–13

Am. J. Hum. Genet. 73:516–523, 2003
516
Estimation of the Inbreeding Coefficient through Use of Genomic DataAnne-Louise Leutenegger,1,2 Bernard Prum,4 Emmanuelle Genin,1 Christophe Verny,6Arnaud Lemainque,5 Francoise Clerget-Darpoux,1,* and Elizabeth A. Thompson2,3,*
1Unite de Recherche en Genetique Epidemiologique et Structure des Populations Humaines, INSERM U535, Villejuif, France; Departmentsof 2Biostatistics and 3Statistics, University of Washington, Seattle; 4Laboratoire Statistique et Genome, UMR CNRS 8071, and 5Centre Nationalde Genotypage, Evry, France; and 6INSERM U289, Hopital Pitie-Salpetriere, Paris
Many linkage studies are performed in inbred populations, either small isolated populations or large populationswith a long tradition of marriages between relatives. In such populations, there exist very complex genealogieswith unknown loops. Therefore, the true inbreeding coefficient of an individual is often unknown. Good estimatorsof the inbreeding coefficient (f) are important, since it has been shown that underestimation of f may lead to falselinkage conclusions. When an individual is genotyped for markers spanning the whole genome, it should be possibleto use this genomic information to estimate that individual’s f. To do so, we propose a maximum-likelihood methodthat takes marker dependencies into account through a hidden Markov model. This methodology also allows usto infer the full probability distribution of the identity-by-descent (IBD) status of the two alleles of an individualat each marker along the genome (posterior IBD probabilities) and provides a variance for the estimates. Wesimulate a full genome scan mimicking the true autosomal genome for (1) a first-cousin pedigree and (2) a quadruple-second-cousin pedigree. In both cases, we find that our method accurately estimates f for different marker maps.We also find that the proportion of genome IBD in an individual with a given genealogy is very variable. Theapproach is illustrated with data from a study of demyelinating autosomal recessive Charcot-Marie-Tooth disease.
Introduction
Many linkage studies are performed in small isolatedpopulations and in populations with a long tradition ofmarriages between relatives. In these populations, theset of relationships between individuals might not beknown exhaustively, since genealogies can be very com-plex with potentially unknown loops. Therefore, no ac-curate knowledge of each individual’s inbreeding coef-ficient can be gained from the known genealogy. Theinbreeding coefficient (f) is the probability that the twoalleles at any locus in an individual are identical by de-scent (Malecot 1948). In this article, we consider onlyidentity by descent (IBD) within an individual.
In the case of homozygosity mapping for recessivetraits (Lander and Botstein 1987), good estimators of fare important for declaring a region as a candidate forharboring a susceptibility locus. Indeed the linkage sta-tistic relies on an increased genome sharing within theaffected individuals, compared with what would be ex-pected under random segregation in the genealogies of
Received April 29, 2003; accepted for publication June 13, 2003;electronically published July 29, 2003.
Address for correspondence and reprints: Dr. Anne-Louise Leuten-egger, Department of Biostatistics, University of Washington, Box357232, Seattle, WA 98195. E-mail: [email protected]
* These authors contributed equally to the supervision of this work.� 2003 by The American Society of Human Genetics. All rights reserved.
0002-9297/2003/7303-0006$15.00
the individuals. If we do not know the genealogies ex-haustively, we may underestimate f. Underestimation off may artificially increase the statistics and, hence, therate of false-positive results (Miano et al. 2000).
We are interested in developing a methodology toestimate an individual’s f without requiring any knowl-edge of the parental relationships. To do so, we needto characterize the IBD process along the individual’sgenome and estimate its parameters without using theparental relationships. Stam (1980) was the first to pro-pose a model for the IBD process along the genome ofan individual in finite random mating populations.However, he assumed that he could observe continuousIBD data on the genome, whereas only discrete identity-by-state (IBS) data can be observed (marker genotypes).More recently, Abney et al. (2002) used a similar modeland estimated its parameters from the individual’s ge-nealogy. Here, we propose to rely on the individual’smarker genotype data to estimate these parameters. Todo so, we use a hidden Markov model (HMM) for theIBD process of the individual. The IBD transition prob-abilities depend on the genetic distance between themarkers and two unknown parameters: f, the inbreedingcoefficient of the individual, and a, such that af is theinstantaneous rate of change per centimorgan from noIBD to IBD.
First, we present the methodology. Then, we showsimulation results for (1) a first-cousin pedigree and (2)a quadruple-second-cousin (cyclic sibship exchange)

Leutenegger et al.: Inbreeding Coefficient Estimation 517
Table 1
Probabilities of the GenotypeGiven the IBD Status andY Xk k
the Error Model
Yk
PROBABILITY WHEN
X p 0k X p 1k
A Ai i2pi
2(1 � e)p � epi i
A Ai j 2p pi j e2p pi j
NOTE.— p Frequency of al-pi
lele ; e p rate of error.Ai
pedigree (Thompson 1988), to evaluate the proposedmethod and to validate our estimates. Finally, we illus-trate the method on data from a study of Charcot-Ma-rie-Tooth (CMT) disease (Charcot and Marie 1886;Tooth 1886).
Methods
Estimation of the Inbreeding Coefficient through Useof HMM
We propose here to estimate f for an individual, frommarker data on that individual’s entire autosomal ge-nome, by means of the maximum-likelihood method.Latent random variables (the IBD status at the markers)underlie these observed marker data. A marker k haseither two alleles IBD ( ) or two alleles non-IBDX p 1k
( ). We approximate the IBD process along theX p 0 Xk
genome by a Markov chain. This approximation wasshown to give results close to the true ones for geneal-ogies such as first-cousin marriages but also for morecomplex ones (Thompson 1994). With the Markov ap-proximation, the IBD status at marker k depends onlyon the IBD status at adjacent loci, and the probabilityof the IBD statuses along each autosomal chromosomepair can be written as
Mc
P(X) p P(X FX ) P(X ) , (1)�[ ]k k�1 1kp2
where Mc is the number of markers on chromosome c.Therefore, we need only characterize the single-locusIBD probability and the transition IBD probabilitiesbetween adjacent loci. The single-locus IBD probability
is our parameter of interest: the inbreeding co-P(X )k
efficient f. The transition IBD probabilities are as fol-lows:
�at �atk kP(X p 1FX p 1) p (1 � e )f � e ,k k�1
�atkP(X p 0FX p 1) p (1 � e )(1 � f ) ,k k�1
�atkP(X p 1FX p 0) p (1 � e )f , andk k�1
�at �atk kP(X p 0FX p 0) p (1 � e )(1 � f ) � e , (2)k k�1
where tk is the genetic distance (in cM) between markerand k. We assume an absence of genetic interfer-k � 1
ence, and the genetic map is assumed to be known with-out error. In the first line of equation (2) describing theprobability of staying IBD, the final term, , corre-�atkesponds to no change in the coancestry over a segmentof length tk, and the other term, , corresponds�atk(1 � e )fto a change in the coancestry, in which case IBD resultswith equilibrium probability f. Note that our model issimilar to that of Stam (1980). Indeed, in his model, he
assumes that the lengths of both IBD and non-IBD seg-ments are distributed exponentially, with mean lengths
and , respectively. Our model corresponds to his,1/a 1/lwith and .a p a(1 � f ) l p af
From equations (1) and (2), we can compute the like-lihood for f and a if we observe the IBD statusL (f,a)x
at the markers. However, only the genotypes arex Yobserved at the markers. The previous approximationallows us to use an HMM to calculate the probabilityof the marker genotype data. For genotype data onYc
the autosomal chromosome pair c, we have
L (f,a) p P(YFf,a) p P(YFX p x)L (f,a)�Y c c xcx
p P(YFX p x)P(X p xFf,a)� cx
Mc
p P(YFX p x )� �[ ]k k kkp1x
Mc
# P(X p x FX p x ,f,a) P(X p x Ff ) .�[ ]k k k�1 k�1 1 1kp2
This likelihood can then be calculated using theLYc
Baum algorithm (Baum 1972; Boehnke and Cox 1997;Epstein et al. 2000), which uses a recurrence relationship(Mc times) on one-dimensional sums to compute this Mc-dimensional sum. The algorithm goes forward along thegenome to compute recursively
∗R (x) p P(Y , j p 0 … k � 1, X p x)k j k
∗p P(X p xFX p x )� k k�1∗x
∗ ∗ ∗# P(Y FX p x )R (x ) ,k�1 k�1 k�1
with . From (where∗ ∗R (x) p P(X p x) R M p1 1 M
), we can calculate the probability of :22� M Yccp1
∗ ∗ ∗P(YFf,a) p P(Y FX p x )R (x ) .� M M M∗x
The probability of Yk is determined by Xk and is afunction of the allele frequencies at marker k (table 1).We have also included a simple model for genotypingerrors and mutations similar to the one of Broman and

518 Am. J. Hum. Genet. 73:516–523, 2003
Weber (1999). When the genotype is missing at aYk
marker k, we sum over all possible genotypes, regardlessof the IBD status , so for all x. TheX P(YFX p x) p 1k k k
probability of Xk is determined by , as presented inXk�1
equation (2).We perform numerical maximization of ln L (f,a) pY
through use of GEMINI (Lalouel 1979)22� ln L (f,a)Ycp1 c
to obtain the maximum-likelihood estimates (MLEs) off and a, hereafter denoted as and , respectively. Toˆ ˆf aobtain variance estimates for and , we need to com-ˆ ˆf apute the observed information matrix . The varianceIY
of is then , and the varianceˆ ˆ �1 �1f V(f ) p (I � I I I )11 12 22 21
of is , where Iij is the element�1 �1ˆ ˆa V(a) p (I � I I I )22 21 11 12
from the ith row and jth column of . This observedIY
information is the negative curvature of the log-like-IY
lihood surface at its maximum. The informationln LY
provided by the observed data about the parametersI YY
f and a is equal to the information that would be pro-vided by the latent IBD process (since the distributionXof given does not depend on f and a) minus theY Xpenalty of observing only and not (Sundberg 1974;Y XLouis 1982):
I p I � I . (3)Y X XFY
When the notation andl (f,a) p � ln L (f,a)/�(f,a)X X
is used, we have¨ 2 2l (f,a) p � ln L (f,a)/�(f,a) I pX X X
. is the expected information from¨ ˆ ˆ�E [l (f,a)FY] I XX X
conditional on the observed genotype data . Then, theYpenalty term in equation (3) for not observing the IBDstatus at the markers is
ˆ˙[ ]ˆI p V l (f,a)FYXFY X
ˆ ˆ T˙ ˙[ ]ˆ ˆp E l (f,a)l (f,a) FYX X
Tˆ ˆ˙ ˙[ ] [ ]ˆ ˆ�E l (f,a)FY E l (f,a)FY .X X
Since each term of equation (3) is a conditional ex-pectation, each one can be estimated by a Monte Carlomethod sampling from its joint posterior distributionX
. We start with sampled from .P(XFY) X P(X p xFY)M M
Then, is obtained by sampling fromX P(X pk�1 k�1
as we go backward along the∗xFX p x ,X , … ,X ,Y)k k�1 M
genome for . These probabilities are easilyk p M … 2obtained from the forward-backward Baum algorithm(Baum et al. 1970). Indeed,
∗R (x)P(Y FX p x)M M MP(X p xFY) p ,M ∗ ∗ ∗�R (x )P(Y FX p x )M M M∗x
and, with the HMM structure, we have
∗P(X p xFX p x ,X , … ,X ,Y)k�1 k k�1 M
∗p P(X p xFX p x ,Y , j p 1 … Y )k�1 k j k�1
∗R (x)k�1∗p P(X p x FX p x)P(Y FX p x) .k k�1 k�1 k�1 ∗ ∗R (x )k
Simulation Study
We evaluate our proposed methodology by simula-tion. First, we want to validate our estimates of f anda. Then, we study their sensitivity to misspecification ofmarker allele frequencies. We generate, for individualsbelonging to two different genealogies, 1,000 replicatesof a full-genome scan composed of 22 autosomal chro-mosome pairs mimicking the true genome and giving atotal length of ∼33 morgans (through use of the Gene-drop program of MORGAN2.5 [available from the Pan-gaea Web site]) for three different marker maps. For eachmarker, the true IBD status can be determined by makinguse of the founder allele labels.
The two genealogies considered are first cousin (here-after denoted as “1C”) and quadruple second cousin(cyclic type; “4#2C”), as shown in figure 1. These twogenealogies (g1 and g2, respectively) have the same ex-pected proportion of genome IBD (f p f p 1/16 pg g1 2
) but different distributions of this IBD along the0.0625genome (and, hence, different values of a). For 4#2C,one expects to see smaller IBD blocks than for 1C, be-cause of more remote common ancestors, and also tosee more of these blocks, because of the multiple com-mon ancestors. We compute the exact two-locus in-breeding coefficient from the genealogy (through use ofthe kin program of MORGAN2.5 [available from thePangaea Web site]) for and solve1 cM � t � 10 cM
�atP(IBD at both of 2 loci t cM apart) p f [(1 � e )f �(from eq. [2]) for a, with or . The�ate ] f p f f p fg g1 2
values of a are not sensitive to t, and we get an expecteda from the genealogy: for 1C anda ≈ 0.063 a ≈g g1 2
for 4#2C. This implies that, for 1C, the expected0.084mean IBD block length is cM and,�1[a (1 � f )] ≈ 17g g1 1
for 4#2C, cM. We chose these two�1[a (1 � f )] ≈ 13g g2 2
genealogies because they are likely to be found in realityand have the same expected proportion of genome IBDbut different a values.
For each replicate, we consider three different markermap scenarios: (S1) SNPs every 1.67 cM, with allelefrequencies 0.4/0.6 (1,972 markers); (S2) microsatellitesevery 5 cM, with five equifrequent alleles (672 markers);and (S3) microsatellites every 10 cM (347 markers). Foreach marker map scenario, we estimate f and a from themarker genotype data through use of our HMM. Wecall these estimators and . From the true marker IBDˆ ˆf a

Leutenegger et al.: Inbreeding Coefficient Estimation 519
Figure 1 Quadruple-second-cousin pedigree (cyclic type)
status, we compute the proportion of markers IBD( ), the expected value of which is for 1C andf f ftrue g g1 2
for 4#2C. Then, we evaluate how estimating markerallele frequencies on a small sample could impact theestimates of f and a. For each replicate, we estimate theallele frequencies at each marker from a sample of 30control individuals drawn from the population in whichpatients were studied and the allele frequencies areknown. For the SNP map (S1), we sample our controlsfrom a population with allele frequencies 0.4/0.6 for allmarkers and call the scenario S1′. For the microsatellitemaps (S2 and S3), we sample the 30 controls from apopulation with allele frequencies 0.2/0.2/0.2/0.2/0.2and call the scenarios S2′ and S3′, respectively. Finally,we look at the impact of having maps in which themarkers do not have equifrequent or nearly equifrequentalleles. For each replicate, we still have the same truemarker IBD status as we did previously, but now theSNP map has allele frequencies 0.2/0.8 (map scenarioZ1) and the microsatellite maps have allele frequencies0.02/0.08/0.3/0.3/0.3 (map scenarios Z2 and Z3, for the5-cM and 10-cM spacing, respectively). For these threemap scenarios, we look at the sensitivity of and toˆ ˆf athe estimation of marker allele frequencies from a smallcontrol sample of 30 individuals (called Z1′ for the SNPmap, Z2′ for the 5-cM microsatellite map, and Z3′ forthe 10-cM microsatellite map). Whenever an allele wasnot observed in the control sample, we gave this allelea frequency of 0.01 and recomputed the other allelefrequencies so that the frequencies still added to 1.
In all cases, we present the median values over all thereplicates, along with the observed 95% CI. We showmedian values rather than mean ones, because a is aconvex monotone function of the transition IBD prob-
abilities. Thus, the mean value of the estimates providesan overestimate of the expected value of , but the me-adian value of the estimates does not. For f, the medianwas equal to the mean in our simulations. Finally, wefalso look at the correlation between and over theˆ ˆf ftrue
simulation replicates for the three map scenarios S1, S2,and S3.
Results
Simulation Results
Table 2 shows the median values of the estimates off and a under the simulation conditions for the threemap scenarios (S1, S2, and S3) and both 1C and 4#2C.For both genealogies, the median values of are veryfclose to the proportion of genome IBD expected for thesetwo genealogies, . The median esti-f p f p 0.0625g g1 2
mates are also very similar among all marker maps. The95% CI is wider at 10 cM than at 5 cM for the micro-satellite marker maps. Indeed, for the same level of poly-morphism, less information is provided about the IBDstatus at one marker by the adjacent marker for loosermaps, in comparison with tighter ones. Similarly, forboth genealogies and all marker maps, the median valuesof are very close to the expected anda a ≈ 0.063g1
, for 1C and 4#2C, respectively. The CI fora ≈ 0.084g2
is rather sensitive to marker density, and we observeasome estimates 11 at 10 cM. This reflects the fact that,with a 10-cM map, there are too few stretches of IBDmarkers that can be observed to allow a precise estimateof this parameter. and are good estimates of f and aˆ ˆf aon average, but the variability in the estimates seemsquite large.

520 Am. J. Hum. Genet. 73:516–523, 2003
Table 2
Median Estimates of f and a and 95% CIs over All Replicates, fromMarker Genotypes under Three Map Scenarios (S1, S2, and S3) forOffspring of First Cousins (1C) and Quadruple Second Cousins (4#2C)
Simulationa (95% CI)f (95% CI)a
1C, , :f p .0625 a p .063g g1 1
S1 .066 (.021–.123) .063 (.022–.165)S2 .064 (.023–.123) .063 (.021–.195)S3 .065 (.012–.133) .066 (.017–1.182)
4#2C, , :f p .0625 a p .084g g2 2
S1 .063 (.022–.114) .088 (.037–.226)S2 .063 (.020–.114) .086 (.032–.240)S3 .064 (.006–.127) .089 (.024–1.278)
a ( , ) and ( , ) are the expected (f, a) for 1C and 4#2C, respec-f a f ag g g g1 1 2 2
tively. Each simulation included 1,000 replicates. S1 p SNPs every 1.67 cM,frequency .4/.6; S2 p microsatellites every 5 cM, five alleles, frequency .2/.2/.2/.2/.2; S3 p microsatellites every 10 cM, five alleles, frequency .2/.2/.2/.2/.2.
Table 3
Median Estimates of f and 95% CI over AllReplicates, from IBD Data ( ) and from Markerftrue
Genotypes ( ) under Three Map Scenarios (S1, S2,fand S3) for Offspring of First Cousins
Simulationa (95% CI)ftrue (95% CI)f
S1 .061 (.024–.120) .066 (.021–.123)S2 .061 (.024–.120) .064 (.023–.123)S3 .060 (.023–.118) .065 (.012–.133)
a Each simulation included 1,000 replicates. S1 pSNPs every 1.67 cM, frequency .4/.6; S2 p micro-satellites every 5 cM, five alleles, frequency .2/.2/.2/.2/.2; S3 p microsatellites every 10 cM, five alleles,frequency .2/.2/.2/.2/.2.
Since very similar results were obtained for both 1Cand 4#2C, only results for 1C are presented hereafter.To evaluate how much of this variability is due to ourmethod, we compare our estimate ( ) to the proportionfof markers IBD ( ) rather than to the inbreeding co-ftrue
efficient expected from the genealogy. Table 3 givesand the estimates obtained from the observed IBSftrue
data with the three marker maps (S1, S2, and S3) for1C. The table shows that, even when the true IBD statusis known, there is a large variability in . This meansftrue
that two individuals with the same genealogy may becharacterized by very different values of f. For instance,an offspring of 1C ( ) can have as little asf p 0.0625g1
3% or as much as 12% of his or her genome IBD. Inaddition, for S1 and S2 maps, both the median and 95%CI for are very similar to the ones for , althoughˆ ˆf ftrue
the variability of is always slightly larger because thefIBD status has to be inferred from the IBS data. For S3,we can see that the variability of the estimate is muchflarger than that of , because marker genotypes everyftrue
10 cM do not provide good information on the hiddenIBD status at the markers.
Figure 2 shows the correlation between and ,ˆ ˆf ftrue
with each dot corresponding to a simulation replicatefor 1C. The correlation between and is very highˆ ˆf ftrue
(0.89) when marker map S1 is used. Similar resultswere also observed for 4#2C, with a correlation of0.84 for marker map S1. Hence, is a good estimatefof the proportion of markers IBD, and it also reflectswell the high variability of this proportion. Again, wecan see that the correlation is not as good for the es-timates obtained from markers observed only every 10cM (map S3).
Table 4 shows the sensitivity of our estimations tomarker allele frequency accuracy for 1C, looking atmarker map scenarios S1, S2, and S3. For all markermaps, we observe a small upward bias for the estimates
of f when the control individuals are drawn from thesame population as the patients (S1′, S2′, and S3′). Thelargest bias is observed for the 10-cM map S3′ but isstill within the 95% CI of . When the genotype datafare simulated with markers having a rare allele (table5), results are very similar, but the variability is slightlyincreased (especially for the 10-cM map) because of thedecreased informativeness of each marker.
Application to Real Data: Families with CMT Disease
CMT disease is the most frequent inherited neurop-athy. On the basis of motor-nerve conduction velocities(MNCVs) at the median nerve, two main types can bedistinguished: the axonal type (MNCV 140 m/s) and thedemyelinating type (MNCV !35 m/s) (Harding and Tho-mas 1980; Bouche et al. 1983). For both types, modesof inheritance can be autosomal dominant, autosomalrecessive, or X-linked.
We had genome-scan data for 26 unrelated individ-uals affected with demyelinating CMT and originat-ing from the Mediterranean basin (Northern Africa,France, and Italy). The mode of inheritance seemed

Leutenegger et al.: Inbreeding Coefficient Estimation 521
Figure 2 Estimated f ( ) versus marker IBD proportion ( ) for offspring of first cousins under 1.67-cM SNP map with marker alleleˆ ˆf ftrue
frequencies 0.4/0.6 (S1) (A), 5-cM microsatellite map with marker allele frequencies 0.2/0.2/0.2/0.2/0.2 (S2) (B), and 10-cM microsatellite mapwith marker allele frequencies 0.2/0.2/0.2/0.2/0.2 (S3) (C). The solid line represents .ˆ ˆf p ftrue
likely to be recessive: all parents of the affected indi-viduals were clinically healthy, without neurologicalsigns of peripheral neuropathy. In addition, all patientswere tested for the PMP22 duplication on chromosome17 (the most frequent causative gene for the dominantform of demyelinating CMT) and the results were neg-ative. Finally, parents of an affected individual werealways related: most couples were reported as firstcousins, two were reported as second cousins, and onewas reported as first cousins with paternal grandpar-ents also being first cousins. For six individuals, the
parental relationships were not precisely reported.Hence, for these six individuals, the usual LOD-scorecalculations could not be performed.
The marker map had microsatellite markers spaced at∼10 cM (for a total of 376 markers) and with an averageexpected heterozygosity of 0.79. We estimated themarker allele frequencies for the parents of the affectedindividuals, when available, not taking into accounttheir relatedness. This will potentially increase the fre-quency of rare alleles at a marker.
We used our method to study the inbreeding coeffi-

522 Am. J. Hum. Genet. 73:516–523, 2003
Table 4
Median Estimates of f and 95%CIs over All Replicates, forOffspring of First Cousins, UsingMarker Genotypes
Simulationa (95% CI)f
S1 .066 (.021–.123)S1′ .068 (.023–.127)S2 .064 (.023–.123)S2′ .071 (.027–.130)S3 .065 (.012–.133)S3′ .073 (.020–.140)
a Marker allele frequencies arethe theoretical ones (S1, S2, and S3)or were estimated on a control sam-ple of 30 individuals (S1′, S2′, andS3′). Each simulation included1,000 replicates. S1 p SNPs every1.67 cM, frequency .4/.6; S2 p mi-crosatellites every 5 cM, frequency.2/.2/.2/.2/.2; S3 p microsatellitesevery 10 cM, frequency .2/.2/.2/.2/.2.
Table 5
Median Estimates of f and 95%CIs over All Replicates, forOffspring of First Cousins, UsingMarker Genotypes
Simulationa (95% CI)f
Z1 .065 (.019–.124)Z1′ .070 (.022–.128)Z2 .065 (.020–.127)Z2′ .071 (.023–.132)Z3 .066 (.000–.139)Z3′ .076 (.012–.148)
a Marker allele frequencies arethe theoretical ones (Z1, Z2, andZ3) or were estimated on a controlsample of 30 individuals (Z1′, Z2′,and Z3′). Each simulation included1,000 replicates. Z1 p SNPs every1.67 cM, frequency .2/.8; Z2 p mi-crosatellites every 5 cM, frequency.02/.08/.3/.3/.3; Z3 p microsatelli-tes every 10 cM, frequency .02/.08/.3/.3/.3.
cients of all 26 affected individuals. Figure 3 shows theestimates of f we obtained for each individual. The val-ues of the estimates ranged from 0 to 0.167. The sixaffected individuals with no genealogical informationhad in the lower part of this range, between 0 andf0.061.
This application illustrates how genomic data can beused to provide estimates of f when no information onthe genealogy is available. However, our estimates haveto be taken with caution, for two reasons. The markermap has a mean marker spacing of 10 cM, and somemarker genotypes are missing. As we have shown bysimulation, a denser map is necessary for reliable esti-mations. In addition, we do not have a good controlsample for the marker allele frequency estimation and,as we showed, it may lead to overestimation of .f
Discussion
In small isolated populations and in populations with along tradition of marriages between relatives, there existvery complex genealogies with unknown loops. There-fore, the inbreeding coefficient f of an individual is oftenunknown. Here, we have presented a method that canreliably estimate the individual’s f from marker data onhis or her entire genome, without requiring any knowl-edge of the genealogy.
We have found by simulations that our estimator isunbiased. There is a very good correlation between ourestimator and the true proportion of genome IBD, aslong as maps are dense enough. Our estimator also re-quires good estimates of marker allele frequencies. Wehave shown that estimating marker allele frequencies
from a small sample of control individuals will alwaystend to slightly overestimate the inbreeding coefficient.
We have also found very different estimates of f fortwo individuals with the same genealogy. This is not aresult of our estimation method but represents the truevariability of the proportion of genome IBD. The ob-served variability is due to the finite length of the humangenome, which leads to a small number of independentobservations in the individual’s genome. This variabilityin the proportion of genome IBD around the value ex-pected from the individual’s genealogy had also beenpointed out by Stam (1980).
From the estimation of the parameters f and a, onecan compute the IBD probabilities at each marker ofthe genome of the individual (posterior IBD probabil-ities) via the Baum algorithm (Baum et al. 1970). Thiscan then be used to perform a homozygosity map-ping–type analysis even when no genealogical infor-mation is available for the affected individuals. For eachaffected individual, the posterior IBD probability at amarker can be controlled for his or her “genomic” in-breeding coefficient. Accumulation, over independentaffected individuals, of excess sharing at a marker willbe considered as evidence for the presence of a recessivegene in the neighborhood.
Finally, this method can be generalized to other kindsof linkage analyses in inbred populations. For instance,we have previously shown that the maximum LODscore affected-sib-pair method (Risch 1989) is quite sen-sitive to an underestimation of the parental relationships(Leutenegger et al. 2002). We are currently extendingour method to a pair of individuals for application inaffected-sib-pair analyses in inbred populations. In that
Leutenegger et al.: Inbreeding Coefficient Estimation 523
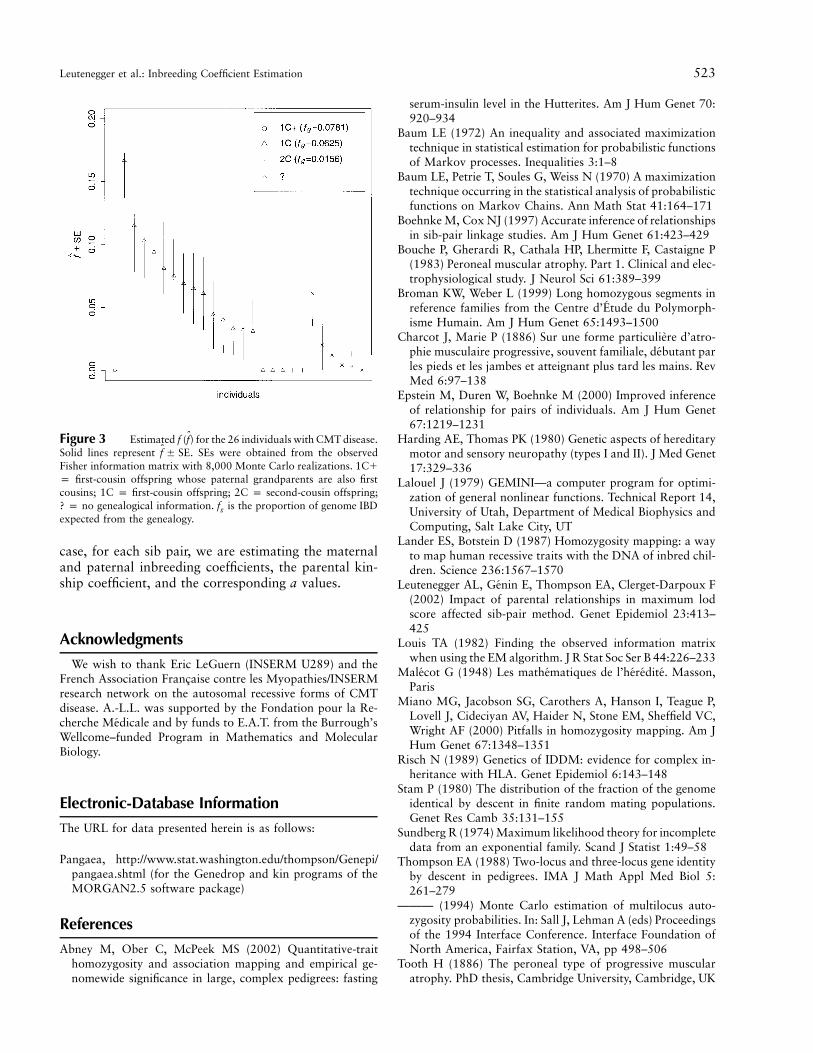
Figure 3 Estimated f ( ) for the 26 individuals with CMT disease.fSolid lines represent . SEs were obtained from the observedf � SEFisher information matrix with 8,000 Monte Carlo realizations. 1C�p first-cousin offspring whose paternal grandparents are also firstcousins; 1C p first-cousin offspring; 2C p second-cousin offspring;? p no genealogical information. is the proportion of genome IBDfg
expected from the genealogy.
case, for each sib pair, we are estimating the maternaland paternal inbreeding coefficients, the parental kin-ship coefficient, and the corresponding a values.
Acknowledgments
We wish to thank Eric LeGuern (INSERM U289) and theFrench Association Francaise contre les Myopathies/INSERMresearch network on the autosomal recessive forms of CMTdisease. A.-L.L. was supported by the Fondation pour la Re-cherche Medicale and by funds to E.A.T. from the Burrough’sWellcome–funded Program in Mathematics and MolecularBiology.
Electronic-Database Information
The URL for data presented herein is as follows:
Pangaea, http://www.stat.washington.edu/thompson/Genepi/pangaea.shtml (for the Genedrop and kin programs of theMORGAN2.5 software package)
References
Abney M, Ober C, McPeek MS (2002) Quantitative-traithomozygosity and association mapping and empirical ge-nomewide significance in large, complex pedigrees: fasting
serum-insulin level in the Hutterites. Am J Hum Genet 70:920–934
Baum LE (1972) An inequality and associated maximizationtechnique in statistical estimation for probabilistic functionsof Markov processes. Inequalities 3:1–8
Baum LE, Petrie T, Soules G, Weiss N (1970) A maximizationtechnique occurring in the statistical analysis of probabilisticfunctions on Markov Chains. Ann Math Stat 41:164–171
Boehnke M, Cox NJ (1997) Accurate inference of relationshipsin sib-pair linkage studies. Am J Hum Genet 61:423–429
Bouche P, Gherardi R, Cathala HP, Lhermitte F, Castaigne P(1983) Peroneal muscular atrophy. Part 1. Clinical and elec-trophysiological study. J Neurol Sci 61:389–399
Broman KW, Weber L (1999) Long homozygous segments inreference families from the Centre d’Etude du Polymorph-isme Humain. Am J Hum Genet 65:1493–1500
Charcot J, Marie P (1886) Sur une forme particuliere d’atro-phie musculaire progressive, souvent familiale, debutant parles pieds et les jambes et atteignant plus tard les mains. RevMed 6:97–138
Epstein M, Duren W, Boehnke M (2000) Improved inferenceof relationship for pairs of individuals. Am J Hum Genet67:1219–1231
Harding AE, Thomas PK (1980) Genetic aspects of hereditarymotor and sensory neuropathy (types I and II). J Med Genet17:329–336
Lalouel J (1979) GEMINI—a computer program for optimi-zation of general nonlinear functions. Technical Report 14,University of Utah, Department of Medical Biophysics andComputing, Salt Lake City, UT
Lander ES, Botstein D (1987) Homozygosity mapping: a wayto map human recessive traits with the DNA of inbred chil-dren. Science 236:1567–1570
Leutenegger AL, Genin E, Thompson EA, Clerget-Darpoux F(2002) Impact of parental relationships in maximum lodscore affected sib-pair method. Genet Epidemiol 23:413–425
Louis TA (1982) Finding the observed information matrixwhen using the EM algorithm. J R Stat Soc Ser B 44:226–233
Malecot G (1948) Les mathematiques de l’heredite. Masson,Paris
Miano MG, Jacobson SG, Carothers A, Hanson I, Teague P,Lovell J, Cideciyan AV, Haider N, Stone EM, Sheffield VC,Wright AF (2000) Pitfalls in homozygosity mapping. Am JHum Genet 67:1348–1351
Risch N (1989) Genetics of IDDM: evidence for complex in-heritance with HLA. Genet Epidemiol 6:143–148
Stam P (1980) The distribution of the fraction of the genomeidentical by descent in finite random mating populations.Genet Res Camb 35:131–155
Sundberg R (1974) Maximum likelihood theory for incompletedata from an exponential family. Scand J Statist 1:49–58
Thompson EA (1988) Two-locus and three-locus gene identityby descent in pedigrees. IMA J Math Appl Med Biol 5:261–279
——— (1994) Monte Carlo estimation of multilocus auto-zygosity probabilities. In: Sall J, Lehman A (eds) Proceedingsof the 1994 Interface Conference. Interface Foundation ofNorth America, Fairfax Station, VA, pp 498–506
Tooth H (1886) The peroneal type of progressive muscularatrophy. PhD thesis, Cambridge University, Cambridge, UK