damaged starch in flour milling
TRANSCRIPT

CHOPIN Technologies: a KPM Analytics brand
Damaged Starch in Flour MillingDr. M. Hikmet Boyacioglu Cereal/Grain Scientist Applications Development SpecialistKPM [email protected]

CHOPIN Technologies: a KPM Analytics brand
What is damaged starch?
Structurally disruption/modification of starch granules in wheat and flour!
Starch damage, damaged starch, mechanically activated starch,mechanical starch modification
Wilson, et al., 2006
Small,
Round
(B-starch)
Large,
lenticular (A-starch)
CHOPIN Technologies: a KPM Analytics brand
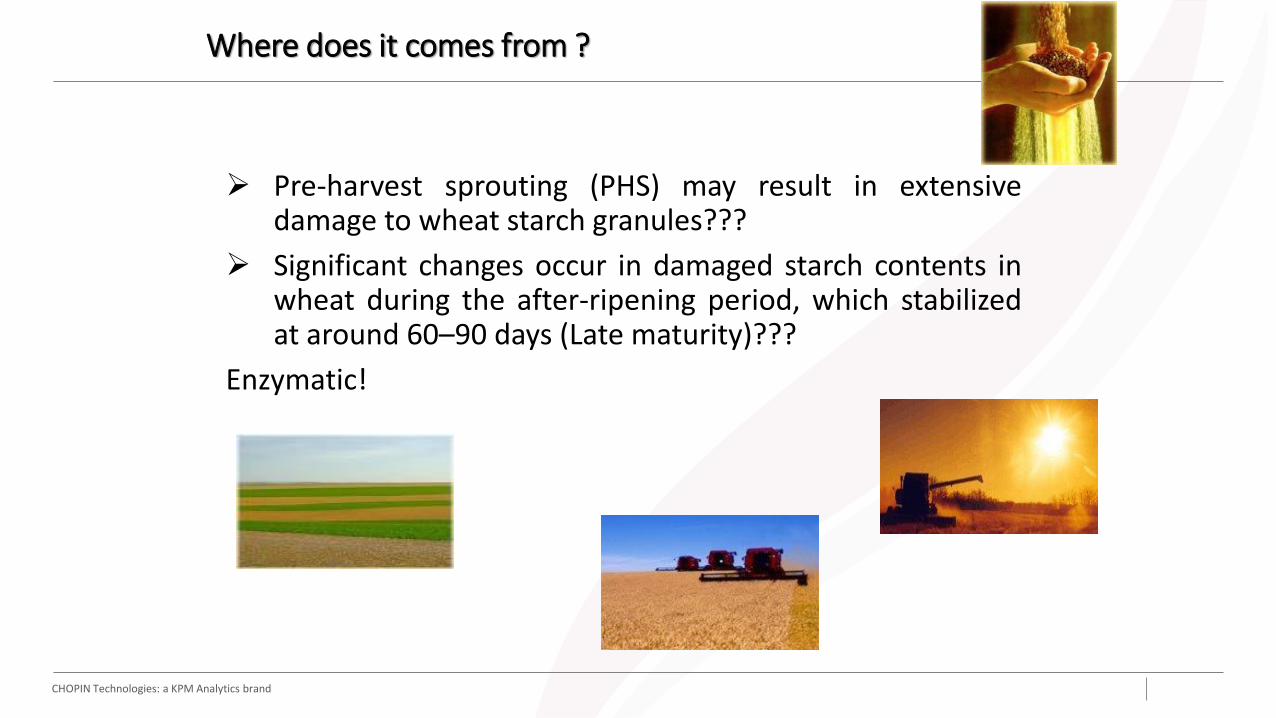
Where does it comes from ?
➢ Pre-harvest sprouting (PHS) may result in extensivedamage to wheat starch granules???
➢ Significant changes occur in damaged starch contents inwheat during the after-ripening period, which stabilizedat around 60–90 days (Late maturity)???
Enzymatic!

CHOPIN Technologies: a KPM Analytics brand
Where does it comes from ?
There are two types of starch damage:
➢ Damaged starch comes from the wheat itself (as afunction of hardness) - genetic criteria -
The first is that which results in the starch granule being broken in two.Although the granule is clearly damaged, this type of damage results instarch that is not susceptible to attack by fungal α-amylase.

CHOPIN Technologies: a KPM Analytics brand
Where does it comes from ?
➢ Damaged starch also comes from the milling process -mechanical criteria -
The second more classic starch damage produced during milling results ingranules that have partially or completely lost their crystallinity and aresusceptible to fungal α-amylase.
Barrera, et al., 2013

CHOPIN Technologies: a KPM Analytics brand
Starch damage during milling
✓ Roller milling damages a small but significant number ofthe starch granules in the flour.
In general, the level of damage depends not only on the hardness of thewheat used but also on the settings of the milling rolls. Indeed, given aconstant wheat supply, flour with increasing water-absorptioncharacteristics can be produced by adjusting the roll settings such thatincreasing levels of starch damage are produced.
Hard
Soft

CHOPIN Technologies: a KPM Analytics brand
Impact of roll adjustments
Starch damage during milling
10
15
20
25
30
0 0.02 0.04 0.06 0.08 0.1
Sta
rch
da
ma
ge
(U
CD
)
Roll gap (mm)
Starch damage = f (Roll gap)

CHOPIN Technologies: a KPM Analytics brand
Impact of roll adjustments
Starch damage during milling
Damaged starch = f (Rolls pressure)
12
14
16
18
20
22
2 2,5 3 3,5 4
Pressure (bar)
Dam
ag
ed
Sta
rch
(U
CD
)

CHOPIN Technologies: a KPM Analytics brand PAGE 9
Starch damage during milling
Analysis of flour streams
0
2
4
6
8
10
12
14
Bk1
Bk2
Bk3
Bk4
Red
1
Red
2
Red
3
Red
4
Red
5
Red
6
Red
7
Red
8
Red
9
Sta
rch
da
ma
ge
(%
)
Streams

CHOPIN Technologies: a KPM Analytics brand PAGE 10
Starch damage during milling
Analysis of flour streams – Quantity of flour
0
2
4
6
8
10
12
14
16
Bk1
Bk2
Bk3
Bk4
Red
1
Red
2
Red
3
Red
4
Red
5
Red
6
Red
7
Red
8
Red
9
% F
lou
r p
rod
uc
ed
Streams
50+%

CHOPIN Technologies: a KPM Analytics brand PAGE 11
Starch damage during milling
Analysis of flour streams – Most contributing fractions
0
20
40
60
80
100
120
0
2
4
6
8
10
12
14
16
Bk1
Bk2
Bk3
Bk4
Red
1
Red
2
Red
3
Red
4
Red
5
Red
6
Red
7
Red
8
Red
9
Da
ma
ge
d s
tarc
h X
flo
ur
qu
an
tity
Da
ma
ge
d s
tarc
h (
%)
Streams
Damaged starch
Flour produced
Damaged starchgiven by stream
Most
contributing
fractions

CHOPIN Technologies: a KPM Analytics brand
For any product, there is an optimum/moderate
level of starch damage!
Proteins (%)
Star
ch d
amag
e (U
CD
)
Why measure damages?

CHOPIN Technologies: a KPM Analytics brand
When starch damage occur at low levels (or at optimum/moderate levelsfor desired product) of the total wheat starch, they are considered to bebeneficial to flour performance;
because they are readily accessible to water and enzyme penetration andserve the dual function of increasing flour absorption and providingfermentable maltose for the yeast.
Why measure damages?

CHOPIN Technologies: a KPM Analytics brand
Protein absorbs 1.8 times its weight of water,
Pentosans: 10 times,
Native starch: 0.4 times,
➢ Damaged starch: 3 to 4 times!
Millers' objective• Produce the largest amount of flour from a lot of wheat (economic
profitability)
Produce flours according to the specifications of their customers (high hydration capacity flours for example for bread making flours)
Bakers' interest• Add max content of water (better yield and better profit)
Effects on water absorption
54
56
58
60
62
64
66
68
10.1 12.3 14.4 15.5
Starch damage (Audidier)
% a
bso
rpti
on
.
0
2
4
6
8
10
12
14
16
18
20
Sta
bil
ity
Hydration Stability
Why measure damages?

CHOPIN Technologies: a KPM Analytics brand
Effects on dough processing
✓ Doughs produced with high mechanical starch modification levels may notbe fully developed at Peak time (optimum mixing time) and display asecond peak – Modify mixing time?
✓ Possibility of having a sticky dough probably because of weakenedprotein–filler interfacial interactions and larger voids within the proteinnetwork?
➢ Damaged starch increases initial water absorption andprevents optimum gluten formation during mixing!!!
Hackenberg, et al., 2019
Why measure damages?

CHOPIN Technologies: a KPM Analytics brand
Amylases preferentially attack damaged starch, not native starch.If starch damage in excess:
Effects on fermentation characteristics
SIMPLE SUGAR
• Intense yeast activity (too much of CO2), reduced gas-retention capacity
• Coloration possibly higher (Maillard reaction) and caramelization
WATER
• Bread shelf life
STARCH
DAMAGE
Why measure damages?

CHOPIN Technologies: a KPM Analytics brand
Effects on acrylamide formation in bread
Damaged starch content in wheat flour from the same cultivar showed astrong positive correlation with acrylamide formation in bread sincereducing sugar contents increased with increasing damaged starch contentin flour.
The mitigation of acrylamide formation in bread can be achieved by reducing damaged starch in flour and by fermentation of the dough.
Wand, et al., 2017
Eslamizad, et al., 2019
Why measure damages?

CHOPIN Technologies: a KPM Analytics brand
Effects on staling/shelf life of the bread
The content of damaged starch also influences the bread staling throughincreasing the retrogradation of the amylopectin and crumb firmness, andtherefore affects negatively the quality of the resulting fresh products andtheir shelf life.
Le´on, et al., 2006
Why measure damages?

CHOPIN Technologies: a KPM Analytics brand
If the level of damaged starch becomes too high, the doughrheology and baking performance are negatively affected.
Stickiness FermentationTexture
Color Cracks
Why measure damages?

CHOPIN Technologies: a KPM Analytics brand PAGE 20
Why measure damages?
Effects on cookies, biscuits
➢ An excess of starch damage causes:
▪ Broken cookies when packaging is opened!
▪ Cookie with too much/low color
▪ Non-standard/uniform size
CHOPIN Technologies: a KPM Analytics brand PAGE 21
Why measure damages?
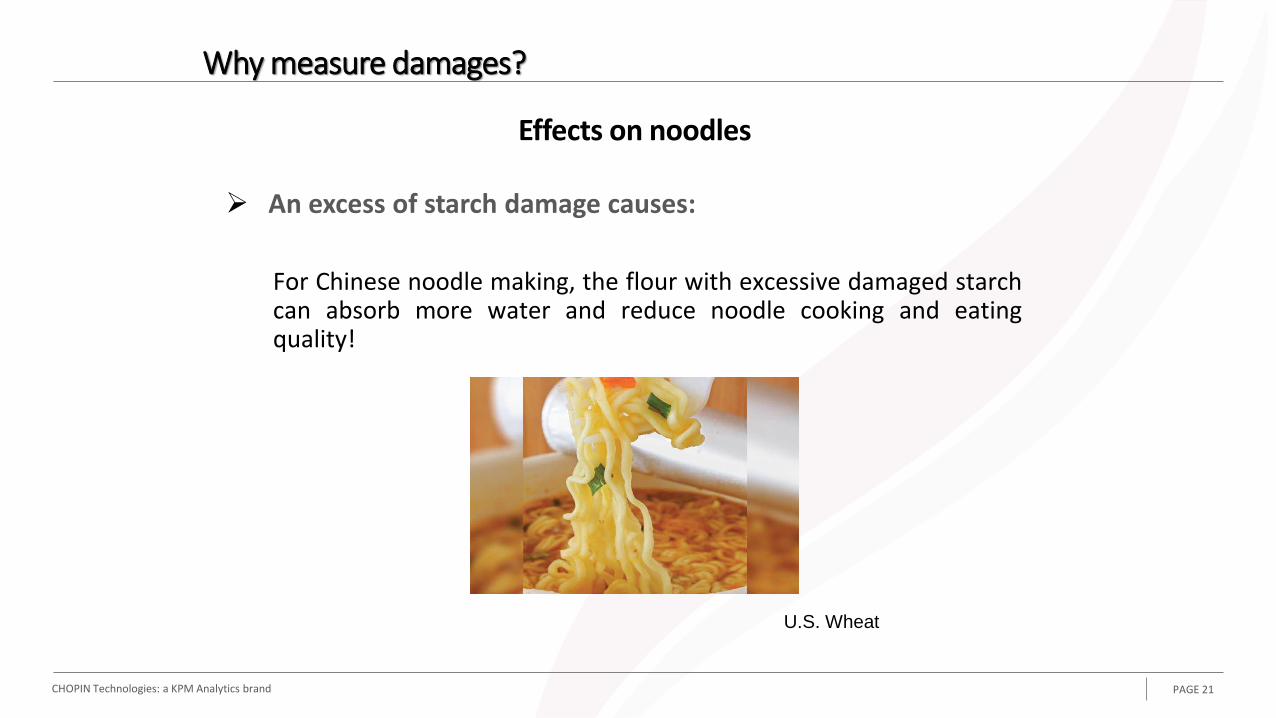
Effects on noodles
➢ An excess of starch damage causes:
For Chinese noodle making, the flour with excessive damaged starchcan absorb more water and reduce noodle cooking and eatingquality!
U.S. Wheat

CHOPIN Technologies: a KPM Analytics brand PAGE 22
Why measure damages?
Effects on wheat flour tortilla texture
➢ An excess of starch damage causes:
As damaged starch increased, the flour tortillas become less stretchable,and firmness and rollability increase.
To make a tortilla with acceptable rollability, starch damage should notbe too high!
Mao and Flores, 2001
Wikipedia

CHOPIN Technologies: a KPM Analytics brand PAGE 23
Why measure damages?
Starch damage could not be increased indefinitely for at least two reasons:
✓ First, as water absorption increased with the increase in starch damage,the air-dough interface in gas cells became proportionally less stableduring baking, leading to a loss of volume and a coarse texture.
✓ Second, with too high a level of starch granule fragmentation, theavailable gluten can be insufficient to coat the surface of the starch,resulting in a loss of gas retention capacity, a lower loaf volume and abreakdown of cell structure.

CHOPIN Technologies: a KPM Analytics brand
“Proofed” Bread
Flat breads
Biscuits
Noodles, fideos (wheat flour)
“Durum” Wheat
• For breadmaking
• For pasta
Tortillas !!...
All concerned!
Why measure damages?

CHOPIN Technologies: a KPM Analytics brand
Measuring Starch Damage as a Mill Optimization Technique
Why measure damages?
Testing Objective
The objective of this project was to determine the optimal grinding
pressure for each reduction passage in the Hal Ross flour mill using the
amount of starch damage as the indicator.
Look at different grinding practices and their effect on flour starch
damage and quantity.
– Determine optimum grinding pressure on reduction rolls
Thiele, 2016

CHOPIN Technologies: a KPM Analytics brand
Measuring Starch Damage as a Mill Optimization Technique
Why measure damages?
Data collection
Data was collected during a full day mill run with the same wheat (HRW)
• First collected a baseline ash curve after the mill warmed up with
reduction rolls set at an operator determined optimum setting.
• Then decreased the grinding pressure on all reduction rolls and
collected three ash curves on the soft grind.
• Next increased the grinding pressure on all reduction rolls and
collected three ash curves on the hard grind.
• Lastly, reset the mill to baseline settings and collected an additional
ash curve for the operator determined optimum setting.Thiele, 2016

CHOPIN Technologies: a KPM Analytics brand
Measuring Starch Damage as a Mill Optimization Technique
Why measure damages?
Sample Set
The complete sample set consists of 16 individual flour streams
– 15 individual flour streams
• Collected at patent flour screw
– Straight grade flour sample
• Collected below rebolt sifter
Measuring Starch Damage
Amperometric measurement of iodine absorption.
– SDmatic rapid measurement of iodine absorption
Thiele, 2016

CHOPIN Technologies: a KPM Analytics brand
Measuring Starch Damage as a Mill Optimization Technique
Why measure damages?
Conclusions
No significant gain in flour production from baseline to hard grind, just increased
amount of starch damage.
✓ The possibility to optimize midds rolls using a combination of flour release
and starch damage does exist.
✓ Starch damage and ash results were correlated, especially towards the tail
end of the mill, however, they don’t have a direct effect on one another.
✓ Measuring starch damage on reduction rolls could ensure a more consistent
grind between shifts and help monitor excess grinding pressure.
✓ Next steps would be to measure energy usage compared to flour released
and starch damage to determine savings.Thiele, 2016

CHOPIN Technologies: a KPM Analytics brand
TO ACT ACCORDINGLY!
If I do not have enough starch damage?
I can:
✓ Set the mill differently✓ Choose a harder type of
wheat...✓ Both of them...
If I have too much starch damage?
I can:
✓ Take care of amylases content✓ Add gluten to increase rheological
properties✓ Set the mill differently✓ Change wheat for a softer one…
Why measure damages?
In every case, we see the necessity for measuring the damaged starch in the flour !!!

CHOPIN Technologies: a KPM Analytics brand PAGE 30
How measure damages?
In view of the importance of damaged starch to the flourand baking industries, many methods have beendeveloped to quantify its presence:
Colorimetric
Polarimetric
Spectrophotometric
Enzymatic
Amperometric

CHOPIN Technologies: a KPM Analytics brand
Damaged starch determination methods
AACC Approved Methods of Analysis, 11th Edition
Starch
AACC Method 76-30.02Determination of Damaged Starch
ObjectiveThis method determines the percentage of starch granules in flour or starch preparations that is susceptible to hydrolysis by fungal alpha-amylase. Percent starch damage is defined as g starch subject to enzymatic hydrolysis per 100 g sample on a 14% moisture basis.

CHOPIN Technologies: a KPM Analytics brand
AACC Approved Methods of Analysis, 11th Edition
Starch
AACC Method 76-31.01Determination of Damaged Starch -- Spectrophotometric Method
ObjectiveIn this method, damaged starch granules are hydrated; this is followed by hydrolysis to maltosaccharides and limit dextrins by fungal alpha-amylase. Amyloglucosidase is then used to convert dextrins to glucose, which is specifically determined spectrophotometrically after glucose oxidase/peroxidase treatment. Damaged starch is calculated as a percentage of flour weight on "as is" basis. This method is applicable to wheat flour and starch.
Damaged starch determination methods

CHOPIN Technologies: a KPM Analytics brand
Damaged starch determination methods
AACC Approved Methods of Analysis, 11th Edition
Starch
AACC Method 76-33.01Damaged Starch -- Amperometric Method by SDmatic
ObjectiveThis method measures the kinetics of iodine absorption in a liquid suspension, using an amperometric probe. Results are given in an iodine absorption index percentage (AI%). An indication of the speed of iodine absorption in seconds is also reported as “Vabs”. The method is specific to white flour obtained from Triticum aestivum coming from either laboratory or industrial milling, but it can also be used on wholemeal flour.

CHOPIN Technologies: a KPM Analytics brand
The SDmaticby CHOPIN Technologies
The SDmatic CHOPIN provides a simple, precise and fast (less than10 min) measurement of starch damage in flour!
CHOPIN SDmatic

CHOPIN Technologies: a KPM Analytics brand
AACC Method 76-33.01Damaged Starch -- Amperometric Method by SDmatic
CHOPIN SDmatic

CHOPIN Technologies: a KPM Analytics brand
CHOPIN SDmatic
Tactil screen
Spoon
Heatingof the sample
Electrode of measurement
Cleaning accessories
Reaction bowlSDmatic
- Composition -

CHOPIN Technologies: a KPM Analytics brand
Prepare the solution
Place the reaction bowl in the SDmatic and lower the arm
Put the flour (1g) in the spoon. Put the spoon in the SDmatic
Start the test
Test:
CHOPIN SDmatic
1
3
2
4

CHOPIN Technologies: a KPM Analytics brand
The element brings the solution to 35°C and produces iodine
The probe measures the residual current
The flour is introduced and the iodine binds to it
Results are displayed
Test:
CHOPIN SDmatic
5
7
6
8

CHOPIN Technologies: a KPM Analytics brand
Principle: The amperometric method measures the amount of iodineabsorbed by the starch granules in a solution at a temperature of 35°C(Medcalf and Gilles, 1965).
0: start of measuring cycle
1: heating to 35°C
2 & 3: production of iodine (100s for 1g)
4: measure the exact current
5: introduction of the flour
6: 180 seconds after, the probe measures the residual current (Ir).
CHOPIN SDmatic

CHOPIN Technologies: a KPM Analytics brand PAGE 40
CHOPIN SDmatic
0
20
40
60
80
100
120
140
0 50 100 150 200 250 300 350 400 450 500
Low damage
High damage
At the end of the test, the SDmatic measures the residual current/iodine absorption in a diluted flour suspension!
– More damaged starch, more fixed iodine.
– The residual current decrease.

CHOPIN Technologies: a KPM Analytics brand
CONCLUSION
Damaged Starch
is influenced by the
hardness of wheat kernel
depends on wheat
preparation and milling
process
can improve the quality of
flour
in excess may affect the quality
of the final product
interacts with alpha amylase

CHOPIN Technologies: a KPM Analytics brand PAGE 42
Application examples
• Blending flours
• Anticipate overload
• Optimize rolls life
• Avoid lower yield
= Cost reduction
CONCLUSION

CHOPIN Technologies: a KPM Analytics brand PAGE 43
• Fully automated analysis, enzyme-free, using 1 gram of flour
Easy
• Results in less than 10 minutes
Fast
• Reproducible and standardized measurement
Reliable
CONCLUSION

KPM Analytics
KPM Analytics
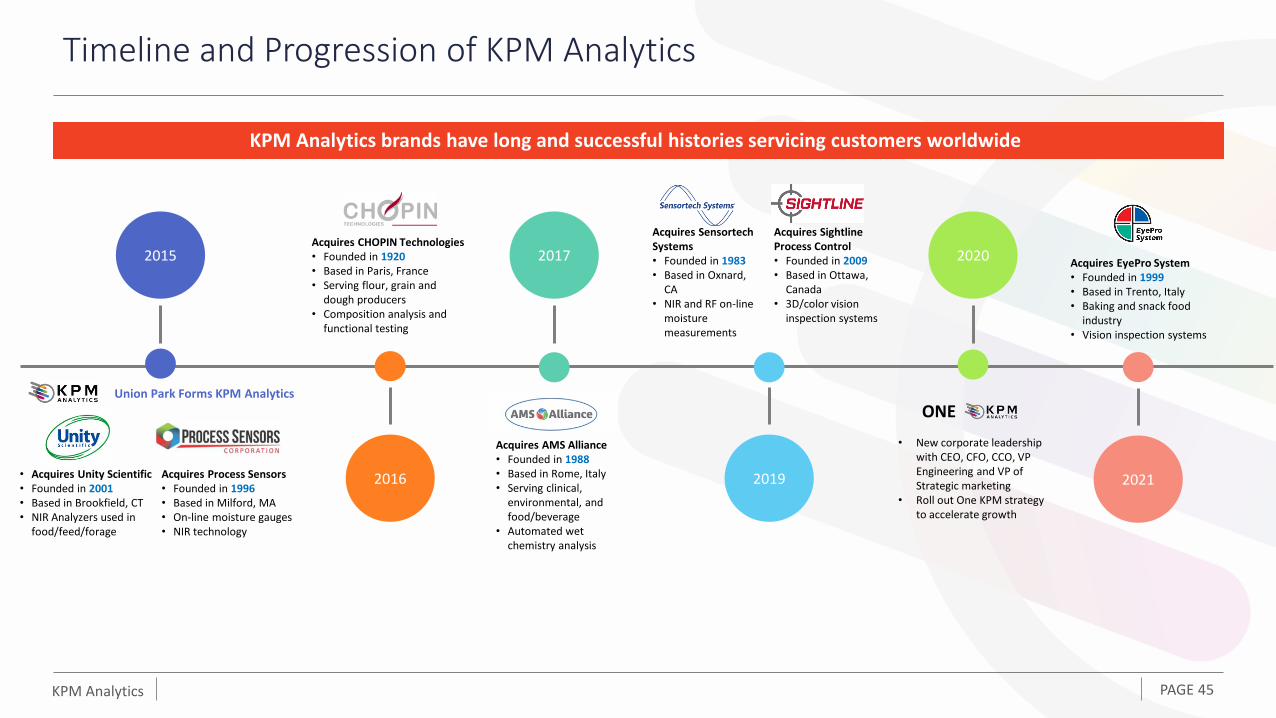
Timeline and Progression of KPM Analytics
PAGE 45
Acquires AMS Alliance• Founded in 1988• Based in Rome, Italy• Serving clinical,
environmental, and food/beverage
• Automated wet chemistry analysis
2017
2016
Acquires CHOPIN Technologies• Founded in 1920• Based in Paris, France• Serving flour, grain and
dough producers• Composition analysis and
functional testing
2019
Acquires SensortechSystems• Founded in 1983• Based in Oxnard,
CA• NIR and RF on-line
moisture measurements
Acquires Sightline Process Control• Founded in 2009• Based in Ottawa,
Canada• 3D/color vision
inspection systems
2020
ONE
• New corporate leadership with CEO, CFO, CCO, VP Engineering and VP of Strategic marketing
• Roll out One KPM strategy to accelerate growth
2015
Acquires Process Sensors• Founded in 1996• Based in Milford, MA• On-line moisture gauges• NIR technology
• Acquires Unity Scientific • Founded in 2001• Based in Brookfield, CT• NIR Analyzers used in
food/feed/forage
Union Park Forms KPM Analytics
KPM Analytics brands have long and successful histories servicing customers worldwide
2021
Acquires EyePro System• Founded in 1999• Based in Trento, Italy• Baking and snack food
industry• Vision inspection systems

KPM Analytics
Cereals
Pet Food
Prepared Foods
Farm
Millers
Fertilizer
Water
Pest Control
Har
vest
FoodBreeding
Research
Trad
ers
Gra
in &
fo
rage
Grain Processors
Feed
Fish/Seafood
Fruits and Vegetables
Meat & Dairy
Impacting Quality Across the Entire Value Chain
PAGE 46
From raw ingredients to prepared foods, our products rapidly assess critical properties and overall quality

KPM Analytics PAGE 47
KPM brand solutions are used in every process step throughout the grain, milling and baking supply chain
Trusted Partner Supporting Every Step of the Food Production Process
Breeding Through Elevator
Milling
Baking

KPM Analytics
Broad Range of Products and Technologies
NIR & RF moisture and compositional analysis for various industries
Functional & rheological analysis for grain, flour and dough
Wet chemistry analysis for agriculture, food, environmental and clinical applications
Machine vision inspection for food production and packaging lines

KPM Analytics
Near Infrared (NIR) and Radio Frequency (RF) Spectroscopy
Page 49
Critical composition insight such as moisture, fat, protein, and other constituents informs R&D and ensures quality & consistency in production processes for agriculture, food and industrial applications
Portable Moisture Meter
• PMT 330 RF dielectric measurement technology
• Lightweight and portable
Benchtop Moisture Meter
• QuikCheck NIR measurement at fixed wavelengths
• Quick and accurate moisture measurement
Benchtop NIR Spectrum Analyzer
• NIR spectrum analyzers, transmittance (InfraNeo) or reflectance(SpectraStar)
• Large calibration library for grain, flour, feed & forage, and food applications
In-line Moisture Gauge
• NIR (NIR 6000 & MCT 460 series) or RF technology (ST 3300)
• Precision moisture measurement for production quality control
In-line Moisture Profiling System
• Moisture or coat weight profiling (Guardian) or moisture sensor array (IMPS 4400)
• For gypsum boards, paper, film or converting process
Comprehensive and growing calibration library for grain & flour, feed & forage, food, and more
Agriculture Food & Beverage Feed, Forage & Animal food
Paper & Converting
Building Material
Textile, chemical, minerals & others

KPM Analytics
Functional Analysis of Grain, Flour and Dough
Page 50
Precise repeatable methods and results ensure operational specifications, regulatory compliance, and quality standards for wheat breeders, millers, bakers, food companies, and research institutes.
Chopin is a pioneer and a reference in the
analysis of cereals and their derivatives.
Recognized by, and in collaboration with,
numerous international standards including
ISO, EN, AFNOR, AACC, and ICC
Grain Analysis
• Quatuor II, EM10, Numigral, Amylab
• Weight, moisture, impurity and falling number measurement of grains
Flour Analysis
• SRC-Chopin, AmyLab, SDMatic
• Measure flour characteristics including falling number, starch damage etc.
Dough Analysis
• AlveoLab/AlveoPC, MixoLab 2, Rheo F4
• Industry standard for measuring dough characteristics
Sample Preparation Devices
• Grinder-Chopin, LabMill, CD1-Mill, MR2L-MR10-L
• Grinder, mill, and homogenizer
Grain Flour Dough

KPM Analytics
Wet Chemistry Analysis with Automated Colorimetry Solutions
Page 51
Discrete Analyzers
• SmartChem series (SC140, SC200, SC450, SC600)
• ISO, EPA compliant methods
Continuous Flow Analyzer
• Futura 3 and automatic samplers
• Flexible channel and manifold configuration for various chemistries
Reagents
• Reagent for discrete wet chemistry analyzers
• FDA approved for clinical applications
In-line PH, Temperature and Redox potential system
• iCinac analyzer with wired/wireless probe sensors
• Manage and control diary acidification process
AMS Alliance analyzers and methods are
compliant with EPA, FDA and other
regulatory standards worldwide.
High throughput, automatic wet chemistry analyzers for agricultural, food, environmental, and clinical applications
Agriculture Food & Beverage
Environmental Testing
Clinical Diagnostics

KPM Analytics
Automated Product Inspection using 3D Vision
Page 52
Imaging and analysis solutions for food producers that ensure quality standards, reduce production costs, and increase productivity
Bakery Meat Cheese
Snack Food Packaged Food Packaging Crates

KPM Analytics
Extensive Global Sales and Service Network
HQ,Boston
Paris
Rome Beijing
FrankfurtLondon Warsaw
Miami
200+ Distributors over 50+ Countries
China/APACEMEAAmericas
Manufacturing Facilities & Sales offices
Sales & Service Locations
Los Angles
Ottawa
Kuala Lumpur
Zhengzhou
Shenzhen
Trento
