dam safety: use of seismic monitoring instrumentation in dams
TRANSCRIPT
Journal of Earth Sciences and Geotechnical Engineering, Vol.11, No.1, 2021, 203-247
ISSN: 1792-9040 (print version), 1792-9660 (online)
https://doi.org/10.47260/jesge/1116
Scientific Press International Limited
Dam Safety: Use of Seismic Monitoring
Instrumentation in Dams
Nasrat Adamo1, Nadhir Al-Ansari2, Varoujan Sissakian3, Jan Laue4
and Sven Knutsson5
Abstract
Seismic instrumentation of dams and reservoirs sites is accepted today as a valuable
tool to understand significant seismic hazards facing existing dams or future planed
dams. With the advent of digital seismic accelerometers and recorders, it can now
be used today as an integral part of dam safety monitoring systems. Outputs of these
instruments help in understanding the dynamic response of dams during earthquake,
assessing the damage caused by such events and determining required upgrading
works necessary for existing dams and designing of safer dams in the future.
Measuring and recording by strong motion seismographs covers the induced Peak
Ground Acceleration (PGA), velocity and displacement recorded on time scale to
indicate the intensity and frequency of ground vibration at the site during seismic
events. Seismometers for such measurements and recordings have undergone
considerable evolution and there exist today a variety of these instruments with high
degree of refinement which can even provide for remote sensing. In this work, this
development is outlined and examples of seismic instrumentation in strategic dams
are described. Damages to actual concrete and embankment dams of various types
are described indicating the associated PGAs experienced during the mentioned
earthquakes. Damages in the form of cracking, increased seepage, additional
settlements and displacements are described to show type and extent of possible
consequences of such events on dams. The reached conclusion is that seismic
instrumentation systems are desirable and highly recommendable for all types of
dams; existing and future ones and their high cost is justified by the service they
provide.
1 Consultant Dam Engineer, Sweden. 2 Lulea University of Technology, Lulea 971 87, Sweden. 3 Lecturer, University of Kurdistan Hewler and Private Consultant Geologist, Erbil. 4 Lulea University of Technology, Lulea 971 87, Sweden. 5 Lulea University of Technology, Lulea 971 87, Sweden.
Article Info: Received: September 7, 2020. Revised: September 17, 2020.
Published online: September 28, 2020.

204 Adamo et al.
Keywords: Seismic instrumentation, seismic hazard, accelerometers, safety
monitoring systems, dynamic response, strong motion seismograph, ground
vibration, seismometers, remote sensing.
1. General
History of recorded dam failures and incidents due to earthquake ground shaking
indicates that many dams had failed or badly damaged by such events during the
second half of the nineteenth century and first half of the twentieth century [1].
Design criteria and methods of dynamic analysis of large concrete and embankment
dams have undergone substantial changes since the 1930s after Westergaard had
developed his theory of structures based on the elastic theory, and loading due to
earthquake action was introduced into their design. Until the 1960's, seismic
analysis of dams consisted essentially of the use of the seismic coefficient method,
in which a static horizontal inertia force was applied to the potential sliding mass in
embankment dams, or center of gravity of concrete dams, in an otherwise
conventional static limit analysis. The magnitude of the inertia force was chosen on
the basis of judgment and tradition and it was represented by a seismic coefficient
multiplied by fraction of the dam weight. Typically, a seismic coefficient value of
0.1g was used for most dams. In exceptional cases in Japan and Iran, slightly higher
values were considered. The seismic coefficients had no clear physical relation with
the design ground motions and the seismic hazard at the dam site. Moreover, the
dynamic response was determined by a pseudostatic analysis, which does not
account for the dynamic characteristics of the dam.
Due to the simplicity of this method it remained in use, although it had no scientific
basis, until late 1980s, but gradually has been replaced, especially for moderate or
significate risk dams, by more rational use of analysis of the actual response of dams.
This has raised the need for advanced monitoring instrumentation capable of
recording peak ground acceleration and its variation with time during the event,
Early seismic instruments for dams were developed during the 1930s by the United
State Bureau of Reclamation (USBR). Most technological advances in this field,
however, have occurred during the 1970s and after; when number of vibration
measuring devices have been developed and of these, the seismograph
(accelerograph) is now the most commonly used seismic instrument. This
instrument consists of a sensor (seismometer or accelerometer) and a mechanism
for producing a permanent record of the vibration applied to the sensor. Nearly all
seismic instruments in use today utilize servo-accelerometers that have the ability
to measure motion in a single horizontal, vertical, or transverse plane. Most of the
devices are considered “strong motion” instruments that record significant
movement, as opposed to micro-seismic activity that requires the use of signal
conditioner or enhancers to magnify the motion to recordable level. The first strong
motion instrument installed by USBR was Hoover Dam in 1936 [2].
Obtaining data on ground motion during earthquakes to which all types of structures
such as high-rise building, power stations, bridges and dams is very important for

Dam Safety: Use of Seismic Monitoring Instrumentation in Dams
205
the investigation of the dynamic behavior of these structures and for defining design
criteria of future similar structures. This has given rise to the development of
networks of strong motion instruments installed in various countries of the world
and especially in seismic regions to gather such information.
In the beginning of the 70s, networks of strong earthquakes recording instruments
were installed in several seismic regions in the world such as USA, Japan, Italy,
former Yugoslavia and others. This example was later followed by several other
countries like Mexico, New Zealand, Iran, Turkey, Greece and others, thus at
present, there is a relatively high number of such networks. Today, earth is being
constantly monitored by over 20,000 strong motion seismometers deployed
throughout the world, most of which transmit data in real time. As early as the late
19th century, Rebeur Paschwitz had understood the fundamental advantage of being
able to study an earthquake from several points on the globe, and recent
technological innovations have made it possible to record, digitize and relay seismic
data to remote observatories.
Even with the large number of strong motion seismometer aforementioned, they are
still not sufficient to cover all the seismically active regions in the world and to
provide sufficient quantity of usable data. Therefore, large number of countries in
the engineering practice apply records obtained by other countries. But, having in
mind that earthquakes are characterized by:
1. the frequency and amplitude content, which depend on the geological and
tectonic structure of the seism region.
2. the magnitude, and/or the intensity of the earthquake.
3. the origin depth.
4. the epicentral distance.
Then it is obvious that they differ from those recorded in other areas, even in cases
when earthquakes of the same intensity are considered. Therefore, it is necessary to
use records from the actual seismogene region, or if used from another region, then
one should be careful, and, if possible, use records from a region having similar
seismo-tectonic characteristics [3].
This development, however, has not precluded the need for installing strong motion
instruments at medium and significant risk dams’ sites to define the strong motion
parameters at such sites which are defined and modified by geology and topographic
conditions at their sites [4].
The outdated concept that seismic instrumentation of dams and reservoirs’ sites is
only a research tool has given way to the modern concept that seismic
instrumentation is necessary to understand significant hazard dams’ behavior in
seismic areas. It is also desirable in traditionally non-seismic areas. With the advent
with digital seismic equipment, it can now be an integral part of dam safety
monitoring works. The digital earthquake data can be gathered by site personnel
and remote control centers by use of computer programs. When the digital
instrument is installed with modem and communication means, then remote access
from several offices is available.

206 Adamo et al.
These devices typically consist of three mutually-perpendicular accelerometers, a
recording system, and triggering mechanism. To prevent accumulation of unwanted
data, the instruments are usually set to be triggered at accelerations generated by
nearby small earthquakes or more distant, larger earthquakes. They are expensive,
especially considering that multiple instruments are necessary to record dynamic
response at several locations on a structure, a foundation, or abutments. The devices
must be properly maintained, so that they operate if an earthquake takes place.
Seismic instrumentation’s installation should be considered on a case-by-case basis
depending on; dam design, foundation materials, and methods of construction. Site-
specific seismotectonic data needs should be weighed against potential benefits
before any seismic strong motion instrumentation is adopted [5].
2. Seismographs and their Use in Dams
The general term, seismograph, refers to all types of seismic instruments that record
a permanent, continuous record of earth motion. The basic components of a
seismograph include a frame anchored to the ground, one or more transducers, and
a recorder. As the frame moves with the ground, the transducers respond according
to the principles of dynamic equilibrium. Signals of horizontal motion in two planes
and vertical motion may be sensed either electrically, optically, or mechanically.
The motion sensed may be proportional to acceleration, velocity, or ground
displacement. A triggering mechanism is provided to prevent accumulation of
unwanted data and the instruments are usually set to be triggered at accelerations
generated by nearby small earthquakes or more distant, larger earthquakes. These
equipment are expensive, especially considering that multiple instruments are
necessary to record dynamic response at several locations on a structure, a
foundation, or abutments. The devices must be properly maintained, so that they
operate if an earthquake takes place.
An example of seismograph is shown in Figure 1, which is of Kinemetrics
seismograph, formerly used by the USBR [6, 7].
The earliest form of seismometers was known as early as 132 A. D. in China using
pendulum as the principle seismic measuring device. The history of seismometers
development from that time up to 1900 is given in the book “Early History of
Seismometry to 1900”[8].

Dam Safety: Use of Seismic Monitoring Instrumentation in Dams
207
Figure 1: Kinemetrics seismograph, formerly used by the United States
Department of the Interior [6] and [7].
Two main types of seismographs exist today as far as the recording of obtained data
are concerned namely; analog recording seismographs and the digital recording
seismographs.
In dams, a digital seismograph can be part of other data acquisition systems installed
in such dam such as a trigger device for piezometer recordings or for slope stability
during an earthquake, a telephone calling system to report an earthquake event, or
a multi-recorder installation to study the response of particular appurtenant dam
structure.
According to USBR practice, strong motion seismographs are categorized
according to their placement location.
i) Free field instruments
It is recommended that such instruments are located near both abutments at the toe
but at such distance beyond any significant influences of the dam on the recorded
ground motion.
ii) Input motion instruments
They are to be placed at the downstream toe and to the abutments as close to the
dam as possible. Most of these instruments are placed in prefabricated housing on
concrete pads firmly secured to the underlying rock or surface material, but
normally finding suitable locations at the toe is difficult due to various tail water
conditions, and difficulties in locating them on the abutments can be due to
restricted access due to topographic conditions. In abutment areas, an ideal
installation in a spatially restricted area would be a small chamber in the natural
material where maintenance problems could be minimized. Siting interior or

208 Adamo et al.
subsurface input motion instruments consist of boreholes instrumentation in the
foundation within selected galleries in concrete dams. Drainage and grouting
galleries, when excavation in earth dam foundation, can be utilized as input motion
sites for strong motion instruments.
iii) Response instruments
These are located on the dam to determine dam response to the vibration. Ideally,
one or two response instruments are installed on the crest of both earth and concrete
dams. The primary location is where maximum deformation during strong motion
is expected, usually at the maximum section. A secondary section may be about
one-third of the crest length from an abutment, such a location is basically for
backup purposes. If a dynamic analysis of the structure has been done prior to strong
motion instrument deployment, the response instrument location may be specified
based on the analysis. Specified areas would be where lower safety factors and
higher loads are expected. These locations are site specific for each structure. The
locations for earth dams depend upon zoning geometry of the dam, types of
materials used in the zones, and nature of the foundation; while for concrete dams
depend upon type of the dam (gravity or arch), geometric configuration of the dam
and nature of foundation materials [9].
One possible arrangement of instruments location is shown in Figure 2. This is
given only as an example, but actual numbers and arrangements may be done after
careful assessment of the needs based on type and importance of the dam and the
seismic region where it is located, [10, 11].
Figure 2: Example of dam seismic instrumentation [10, 11].

Dam Safety: Use of Seismic Monitoring Instrumentation in Dams
209
Basically, vibration measuring devices consist of sensors, signal conditioner, and a
recorder or storage medium.
i) Sensor
The sensing devices used are electromechanical units that respond to motion and
produce an electrical signal that is, within limits, proportional to displacement,
velocity, or acceleration. Most sensors are models of single degree of freedom,
spring-mass dashpot system. The measurement is usually made of the spring
extension or compression with the resonant frequency and the damping of the
system so proportioned as to produce an electrical signal that is an analog of either
acceleration, velocity or displacement. Sensors may be located at the recording unit
or placed in a remote location; such as in a drill hole, or elsewhere. Signals are
transmitted by a coaxial cable to the signal conditioner. It is common for sensors to
contain a starter or triggering device that activates the sensor at some predetermined
acceleration, such 0.01 gravity. The sensor would then continue to operate as long
as the motion is greater than that value, and for short time thereafter. These sensors
act as seismic alarm devices (SAD) and they are installed where a display of peak
acceleration is required immediately following an earthquake. The instruments
measure acceleration, triaxially, vertical, longitudinal and transverse directions,
and they are available in digital and analog models. ii) Signal Conditioner
The term “signal conditioner” refers to all units and devices placed between the
sensor and the final output data recorder. These devices are usually power amplifiers
that are required to change the micropower signal level from the sensor to the
macrolevel required to activate the recorder system. Signal conditioners also usually
include sensitivity controls to permit a desired level of recorded signal.
Signal conditioning equipment may also include analog integration units for
conversion of one measured parameter to another. The equipment may physically
be part of the sensor unit, part of the recording unit, or may be separately packaged. iii) Recorder
The recording unit is the final device in the system and is located in a protected
environment in a secured area. The recorder presents the output in some usable form
for evaluation and/or further use. Most recorders now being used produce historical
records of the input phenomenon versus time as a paper record. Such records
provide a quick method for visual inspection, and permit a rapid evaluation of peak
amplitudes and other values. Detailed study of data in this form requires point- by
point transcription of values for future computation. Automatic data handling can
be obtained for the use of magnetic tape recorder and later playback on to computing
systems. The most desirable system includes an output of both direct reading paper
records for rapid field inspection; plus a magnetic tape for direct storage, which
allows for later computer processing. Most recorders also provide a timing base that
is recorded along with the sensor signals as a reference for determining the
frequency of the vibration.
Generally, recorders may be provided as analog recording units or digital recording

210 Adamo et al.
units. The analog type record data on 70 mm film which must be recovered under
low light conditions and chemically processed to develop the film. A component
diagram of such recorder is shown in Figure 3 [12].
Figure 3: Analog/accelerograph component diagram showing working
principles [12].
Digital recorder continuously digitalizes the three internal force balance
accelerometers and stores data in solid state memory. The general arrangement of a
digital accelerograph box is presented in Figure 4a, and a typical plot of such
accelerograph is shown in in Figure 4b [12].
Figure 4: (a) On the left shows the general arrangement of a digital
accelerograph. (b) On the right is a typical plot of such accelerograph [12].

Dam Safety: Use of Seismic Monitoring Instrumentation in Dams
211
Development of strong motion instrumentation from the early Chinese instrument
up to now has gone very far and it is possible now that at each measuring point on
a dam or other important structure a high dynamic mechanical force balance
accelerometer is deployed. These devices collect raw acceleration data and transfer
it to Data Acquisition System (DAS). From the DAS, the data is collected and
sampled. It can then be transmitted to an offsite location or stored locally for
automatic intelligent processing. The reliable level of remote monitoring eliminates
the need for site visits for structures in remote locations. The system allows for tools
to remove mundane data, noise, thermal, or other unwanted effects before storage,
and make data interpretation easier, faster, and more accurate. Diagnostics convert
abstract data signals into useful information about the structural response and
conditions [11].
3. Modern Dam Monitoring Systems and Examples
Great progress has been done in the world today in the field of seismic monitoring
of dams. The high cost of seismic monitoring systems of large strategic dams
utilizing available modern technologies of recording and transmitting data to remote
control centers is justified by the great value attached to these dams. Two cases of
such progress are presented in the following.
3.1 Old Aswan Dam and High Aswan Dam, Egypt
An example of advanced monitoring systems applied to Old Aswan and High
Aswan Dams in Egypt is given here to show the type and level of technological
sophistication reached in the field of seismic safety monitoring of dams and to
explain the techniques used.
The contract was awarded in 2011 to Ref Tek, a division of Trimble Geospatial for
the design, supply and commissioning of a strong motion instrumentation network
for both dams. The network was installed with the support of Noor Scientific &
Trade Co. and completed in 2013.
The Old Aswan Dam is a 54 m high and 1900 m long gravity buttress dam whose
construction began in 1899 and it was completed in 1902. The buttress sections
accommodate numerous gates, which were opened yearly to pass the flood and its
nutrient-rich sediments, but without retaining any yearly storage. The dam was
constructed of rubble masonry and faced with red ashlar granite. The design also
included a navigation lock of similar construction on the western bank, which
allowed shipping to pass upstream as far as the second cataract,
whereas portage overland was previously required. When constructed, the Old
Aswan Dam was the largest masonry dam in the world; nothing of such scale had
ever been attempted. The initial construction was found to be inadequate for
development needs, and the height of the dam was raised in two phases; five
meters between 1907-1912 and nine meters between 1929-1933. Generation of
electricity was added. The Old Aswan Dam supports now two hydroelectric power
plants, Aswan I (1960) and Aswan II (1985–1986). Aswan I contains 7 X 40
megawatts generators with Kaplan turbines for a combined capacity of 280
212 Adamo et al.
megawatts and is located west of the dam. Aswan II contains 4 x 67.5 megawatts
generators for an installed capacity of 270 megawatts (360,000 hp) and is located at
the toe of the dam.
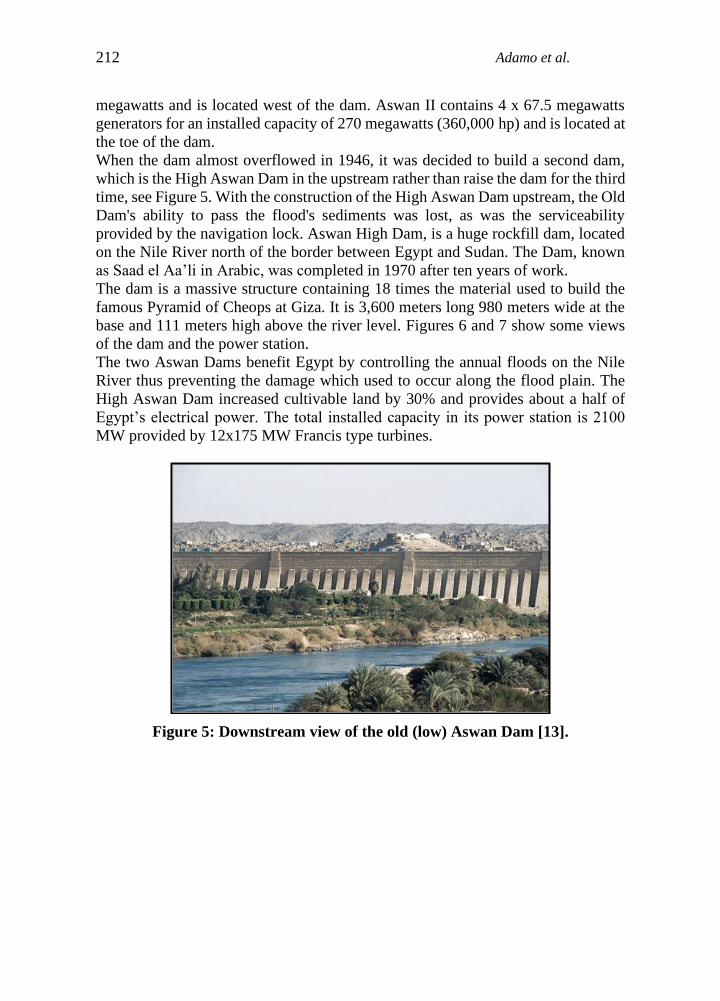
When the dam almost overflowed in 1946, it was decided to build a second dam,
which is the High Aswan Dam in the upstream rather than raise the dam for the third
time, see Figure 5. With the construction of the High Aswan Dam upstream, the Old
Dam's ability to pass the flood's sediments was lost, as was the serviceability
provided by the navigation lock. Aswan High Dam, is a huge rockfill dam, located
on the Nile River north of the border between Egypt and Sudan. The Dam, known
as Saad el Aa’li in Arabic, was completed in 1970 after ten years of work.
The dam is a massive structure containing 18 times the material used to build the
famous Pyramid of Cheops at Giza. It is 3,600 meters long 980 meters wide at the
base and 111 meters high above the river level. Figures 6 and 7 show some views
of the dam and the power station.
The two Aswan Dams benefit Egypt by controlling the annual floods on the Nile
River thus preventing the damage which used to occur along the flood plain. The
High Aswan Dam increased cultivable land by 30% and provides about a half of
Egypt’s electrical power. The total installed capacity in its power station is 2100
MW provided by 12x175 MW Francis type turbines.
Figure 5: Downstream view of the old (low) Aswan Dam [13].

Dam Safety: Use of Seismic Monitoring Instrumentation in Dams
213
Figure 6: An overview of the High Aswan Dam (Water Technologies) [14].
Figure 7: Downstream view of the power station at High Aswan Dam [15].
The a/m information is given to show the extreme importance and strategic nature
of these infrastructures; this led the Egyptian National Research Institute of
Astronomy and Geophysics (NRIAG) to agree with the Aswan and High Dams
Authority (HADA) that an array of strong motion accelerographs should be installed
to record seismic activity in the area, in order to better monitor and study its effect
on the structures of the two dams.
NRIAG criteria for the strong motion array consisted using the following:

214 Adamo et al.
i) Remote and fixed strong motion accelerograph stations consisting of
accelerometers and digital recorders, ii) Communications network; and software to receive and analyze the seismic data.
Fort the High Aswan Dam, the instrumentation installed were five low noise, high
resolution and strong motion recorders (Model 130-SMHR); four in the High Dam
structure, and one (free field station) located on bedrock at the north side of the Dam
base. The illustration in Figure 9 below shows layout of the array inside the dam.
The High Dam has three galleries (tunnels) inside the Dam body. Each tunnel is
about 1500 meters deep. The upper gallery contains two 130-SMHRs plus one at
the entrance to the gallery, and the southern lower gallery has one 130-SMHR. The
fifth 130-SMHR is externally located on the crest of the dam [16].
The 130-SMHR strong motion accelerograph, which combines the 130-01 broad
band seismic recorder and an internal low-noise force-balance triaxial
accelerometer, was the perfect fit for this application. It provides accurate and
timely data and information for seismic events, including their effects on buildings
and structures by employing modern monitoring methods and technologies. The
130-SMHR has advanced communications features including transmission control
protocol/Internet protocol (TCP/IP) over Ethernet and Asynchronous Serial. An
LCD continuously displays state-of-health and status information.
The 130-SMHRs installed inside the dam body are powered by 220VAC mains
power. The free field station at the North side of the dam base and dam crest are
supplied by a solar energy system. The diagram in Figure 8 illustrates the power
and communication equipment at the entrance of the two galleries at the High Dam.
Figure 8: Illustration of the power and communication equipment at the
entrance of the two galleries at the High Aswan Dam [16].
Dam Safety: Use of Seismic Monitoring Instrumentation in Dams
215
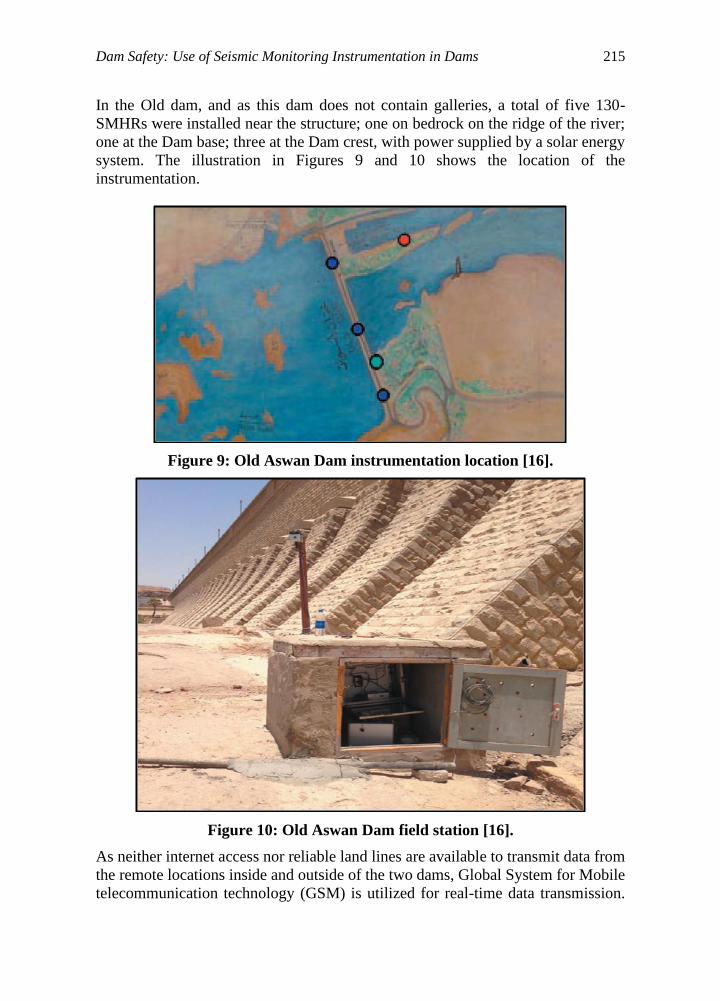
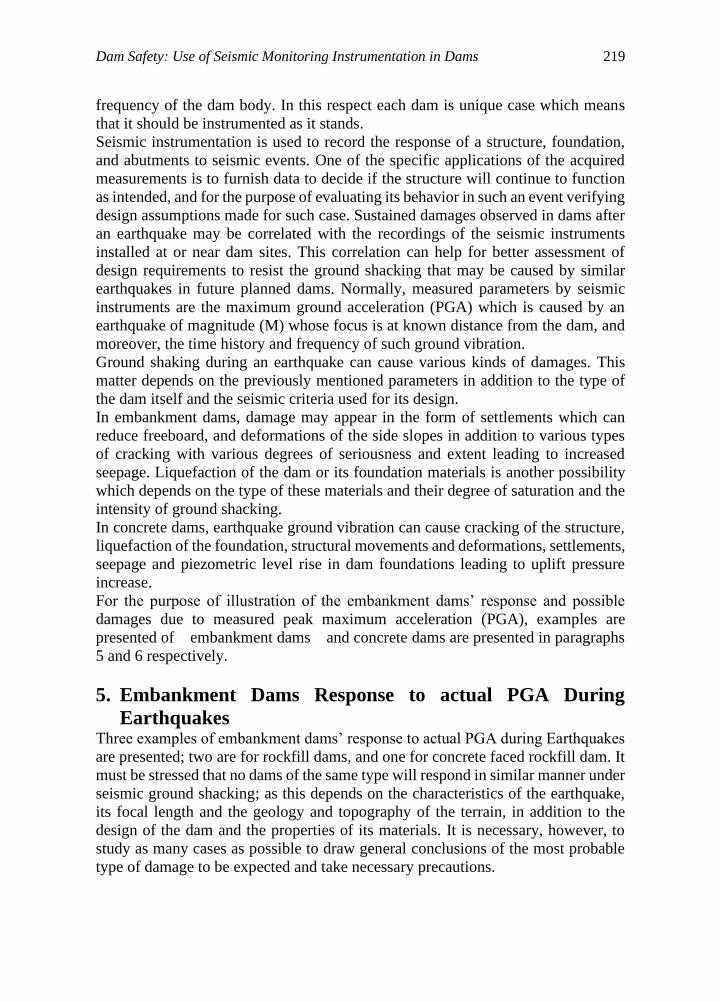
In the Old dam, and as this dam does not contain galleries, a total of five 130-
SMHRs were installed near the structure; one on bedrock on the ridge of the river;
one at the Dam base; three at the Dam crest, with power supplied by a solar energy
system. The illustration in Figures 9 and 10 shows the location of the
instrumentation.
Figure 9: Old Aswan Dam instrumentation location [16].
Figure 10: Old Aswan Dam field station [16].
As neither internet access nor reliable land lines are available to transmit data from
the remote locations inside and outside of the two dams, Global System for Mobile
telecommunication technology (GSM) is utilized for real-time data transmission.

216 Adamo et al.
GSM is a proven technology for both temporary and permanent seismic telemetry
network communication media. Net Module Wireless Routers are used to connect
networks and sites, see Figure 11.
Figure 11: Illustration of GSM network [16].
All data transmitted from the strong motion instruments in the two dams are
received by the established Aswan Regional Earthquake Research Center for further
processing.
Data processing equipment supplied to the processing center included two servers
equipped with advanced software for data acquisition, data analysis and data
archiving. The acquisition software is capable of downloading data from remote
instruments automatically on trigger, and on-demand. This software is also capable
of configuring, controlling, synchronizing the 130-SMHRs remotely as well as
monitoring the state-of-health. Mission critical computers and peripherals were
installed at the processing center, as indicated in Figure 11.
The 130-SMHR has built-in hardware to support IP communications. The
applications supported by them are an FTP server, a command server and an RTP
protocol client.
Instrumentation of the Aswan dams has provided NRIAG scientists with invaluable
information on the structure’s response to seismic activity based on time-lapse
observations and early warnings. Using the information, field crews are enabled to
accomplish rapid deployment and prioritized inspections to address the need for
safe and cost-effective operation of structures [16].

Dam Safety: Use of Seismic Monitoring Instrumentation in Dams
217
3.2 Enguri Dam Monitoring System, Georgia
A second example of dam monitoring system is cited from the dam monitoring of
Enguri1 Dam. This dam, sometimes called Inguri Dam, is one of the highest
concrete arch dams in the world which is located on the Enguri Rivers in Jvari,
Georgia. It is part of the Enguri hydroelectric power station. The dam is 271.5 m
high and 750 m long. Its crest has a length of 728 m and is 10 m thick. The power
station is equipped with five Francis type turbines, 275 MW each. Construction of
the dam started in 1971; power station became partially operational in 1978, and it
was completed in 1987. Repairs and refurbishment at the Enguri dam took place in
1999, and in 2011 work began to complete the rehabilitation and to ensure safe
water flow towards the black sea. The Enguri dam was listed as cultural heritage of
Georgia in 2015, Figure 12.
Figure 12: View of Enguri Dam, Georgia.
Georgia is situated in the Caucasus, which is one of the most seismically active
regions in the Alpine-Himalayan collision belt. Historical analysis shows that it is a
region of moderate seismicity and that strong earthquakes have occurred here in the
past, including a 7.0M earthquake in the region of Racha in 1991, which killed 270
people.
The scope of the Enguri Dam seismic instrumentation project was installing dam
monitoring system to record seismic motions and other ambient dynamic activity in
order to continuously monitor dam structural safety within the context of a safe
operating dam environment [17].
The solution was to install 10 (AC-63) force balanced accelerometers, 10 (GSR-18)
strong motion recorders, an interconnecting cabling and modem system (GRX- ICC
interconnection set), and a central processing system center with processing and
reporting software, Figure 13.

218 Adamo et al.
Figure 13: Strong motion recorders connection scheme [17].
Once the data has been processed, it is assessed and compared as the dam behavior
against seismic design criteria applicable to dam operation. The project facilitated
the development and improvement of dam emergency and safety measuring
equipment within the context of increased awareness and contributed to the regional
data management systems. Note that the instruments models cited here belong to
instrumentation manufacturer and developer GeoSig, Switzerland.
4. Dams Response to PGA During Earthquakes
Damages sustained by dams in response to strong motion acceleration, measured at
their sites, depends on type of the dam, whether concrete or earthfill, its height, its
design, and the previous seismic history of the dam. As some damages may tend to
accumulate due to recurrent events which tend in earthfill dams to change dam
material’s properties.
The main objective of seismic instrumentation of dams is monitoring their behavior
when an earthquake occurs and recoding their response. The other important use is
to compare recorded PGAs with those assumed for the design and examine ways of
improving dams` safety; if the recorded values exceed the design assumptions.
The intensity and duration of ground vibration that a dam can tolerate without
experiencing damage are quite variable. The physical factors that create such
variation in dams when subject to earthquake ground vibration are; material used,
its density and water content. Not only does physical property variability create
problems, but also the parameters that best describe the necessary intensity of
ground motion to create structural damage. These parameters include the maximum
displacement, maximum particle velocity, maximum acceleration, and the natural
Dam Safety: Use of Seismic Monitoring Instrumentation in Dams
219
frequency of the dam body. In this respect each dam is unique case which means
that it should be instrumented as it stands.
Seismic instrumentation is used to record the response of a structure, foundation,
and abutments to seismic events. One of the specific applications of the acquired
measurements is to furnish data to decide if the structure will continue to function
as intended, and for the purpose of evaluating its behavior in such an event verifying
design assumptions made for such case. Sustained damages observed in dams after
an earthquake may be correlated with the recordings of the seismic instruments
installed at or near dam sites. This correlation can help for better assessment of
design requirements to resist the ground shacking that may be caused by similar
earthquakes in future planned dams. Normally, measured parameters by seismic
instruments are the maximum ground acceleration (PGA) which is caused by an
earthquake of magnitude (M) whose focus is at known distance from the dam, and
moreover, the time history and frequency of such ground vibration.
Ground shaking during an earthquake can cause various kinds of damages. This
matter depends on the previously mentioned parameters in addition to the type of
the dam itself and the seismic criteria used for its design.
In embankment dams, damage may appear in the form of settlements which can
reduce freeboard, and deformations of the side slopes in addition to various types
of cracking with various degrees of seriousness and extent leading to increased
seepage. Liquefaction of the dam or its foundation materials is another possibility
which depends on the type of these materials and their degree of saturation and the
intensity of ground shacking.
In concrete dams, earthquake ground vibration can cause cracking of the structure,
liquefaction of the foundation, structural movements and deformations, settlements,
seepage and piezometric level rise in dam foundations leading to uplift pressure
increase.
For the purpose of illustration of the embankment dams’ response and possible
damages due to measured peak maximum acceleration (PGA), examples are
presented of embankment dams and concrete dams are presented in paragraphs
5 and 6 respectively.
5. Embankment Dams Response to actual PGA During
Earthquakes Three examples of embankment dams’ response to actual PGA during Earthquakes
are presented; two are for rockfill dams, and one for concrete faced rockfill dam. It
must be stressed that no dams of the same type will respond in similar manner under
seismic ground shacking; as this depends on the characteristics of the earthquake,
its focal length and the geology and topography of the terrain, in addition to the
design of the dam and the properties of its materials. It is necessary, however, to
study as many cases as possible to draw general conclusions of the most probable
type of damage to be expected and take necessary precautions.

220 Adamo et al.
5.1 Matahina Dam Case (1987), New Zealand
Matahina Dam is a large embankment rockfill dam which was shaken by
Edgecumbe earthquake (M6.3), New Zealand on May 2, 1987. The earthquake had
caused a peak ground acceleration of 0.33g at the base of the dam and
triggered subsidence or settlement at the crest, revealing and boosting internal
erosion. The dam response was recorded by five strong motion accelerometers and
a maximum crest level acceleration of 0.42 g was measured. The rockfill at dam
crest settled by 100 mm and the dam moved by 250mm downstream generating
deformation of the dam shoulders.
The earthquake occurred near the town of Edgecumbe. The dam is located on the
Rangataiki River about 23 km south of the main shock epicenter and 11 km from
the main surface faulting, Figure 14 [18, 19].
Figure 14: Regional geology; Matahina Dam [19].
In the two weeks preceding the main event, there were earthquake swarms in the
region; these are culminated in the main shock at 00.01hr 42m 34s on 2 March 1987
UT. The epicenter location was 8 km NNW of Edgecumbe, Figure 14 and Figure
15, and the focal depth was estimated to be 12 km. The magnitude of the main shock
was 6.3.
A foreshock and four aftershocks had magnitudes of over 5.0 with epicenters within
a few kilometres of the main shock. The accelerometer at the base of the dam
recorded M5.2 foreshock, the M6.3 main shock and the largest aftershock, the M5.5
event 8 minutes after the main shock. The transverse (upstream-downstream)
acceleration, velocity and displacement record from the base of the dam and the 5%
damped acceleration response spectra are shown in Figure (15a). The El Centro
1940 (N-S) response spectra is shown for comparison Figure (15b).

Dam Safety: Use of Seismic Monitoring Instrumentation in Dams
221
Figure 15: Location of Fault Rupture [19].
Figure 15a: Acceleration, velocity and displacement at the base of Matahina
Dam [19].

222 Adamo et al.
Figure 15b: El Centro earthquake (1940) 5% damped acceleration response
spectra (for comparison) [19].
The dam (Figures 16 and 17) stands 86 m high above foundation level and has a
crest length of 400 m. It has an upstream sloping core of moderate width. The core
material is weathered greywacke with a low plasticity gravelly clay grading. The
dam shoulders are of hard ignimbrite rockfill compacted by heavy tractor track
rolling. The transition zones between the core and shoulders comprise the fines and
softer stripping from the ignimbrite rock quarry.
There is a grout curtain forming a partial cutoff within the spur supplemented by
two drainage drives. Seepage flows and groundwater levels are monitored.
Under seepage is controlled by a shallow cutoff below the core and a 30 m deep
curtain of drain holes which discharge into an extensive drainage blanket. Flow
from the drainage blanket is monitored by a weir located in the old river channel
downstream of the dam.
The dam instruments include five strong motion accelerometers from which records
of the foreshock and main shock were obtained. The extensive surface monument
network had been resurveyed three weeks prior to the earthquake.
During lake filling in 1967, core cracking, leakage and internal erosion occurred
above a step in the right abutment. High turbid leakage flows were observed at the
drainage blanket monitoring weir. An erosion cavity was subsequently located
downstream of the core. Repairs comprised a plastic concrete patch on the
downstream side of the core backed by granular filter zones. The core was grouted
with a cement bentonite mix and the lake refilled without further incident.

Dam Safety: Use of Seismic Monitoring Instrumentation in Dams
223
Figure 16: View of Matahina Dam [20].
Figure 17: Cross section of the Matahina Dam [21].
Detailed inspection following the earthquake showed surface cracking and minor
local settlements near the abutments, a turbid and increased drainage flow from the
left abutment spur, a minor increase in flow at the drainage blanket weir, settlement
and downstream displacement of the crest and large settlements in the upstream
rock fill shoulder. Investigating the damages revealed the following:
224 Adamo et al.
i) Seepage
It was observed during the period of lake drawdown following the earthquake. Flow
from the drainage blanket weir increased from 70 1/min to 630 1/min. Four days
after the earthquake flow from the weir ceased and it has flowed only intermittently
since then. Investigations concluded that in the periods of low tailwater level flow
from the drainage blanket leaks into the groundwater system downstream of the
dam. The increase in flow after the earthquake was probably due to the increased
tailwater level during drawdown and that increased leakage up to 2000 1/min may
not be detected during periods of zero weir flow, and no major dam leakage has
occurred as a result of the earthquake.
Seepage flow from the left abutment rock spur which rose to four times the normal
flow after the earthquake has continued to slow rise. This trend was continued to be
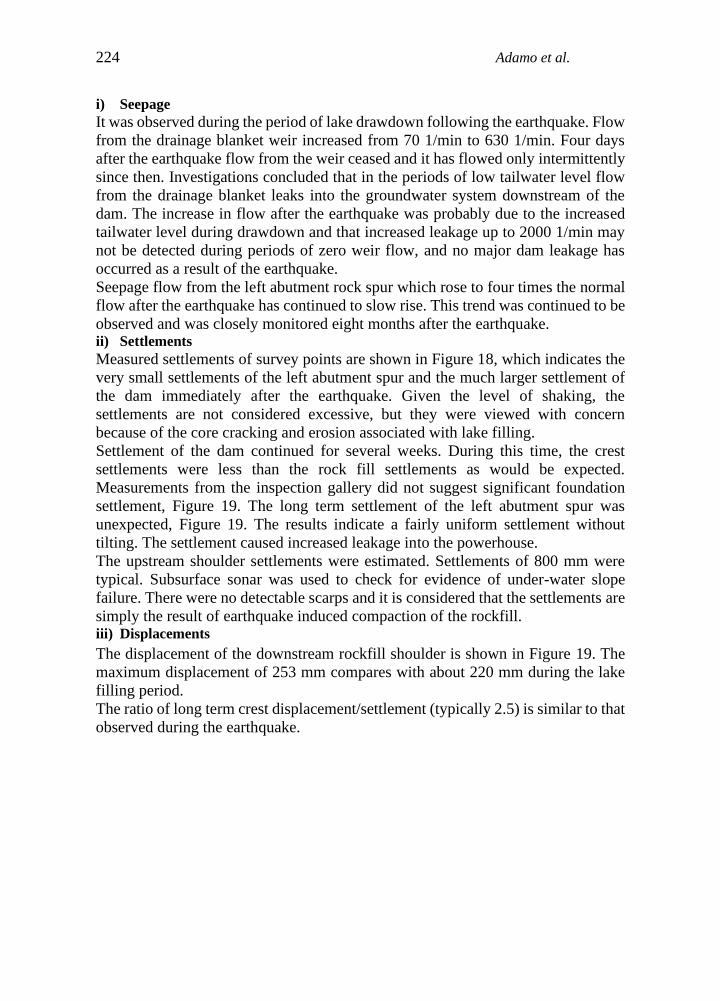
observed and was closely monitored eight months after the earthquake. ii) Settlements
Measured settlements of survey points are shown in Figure 18, which indicates the
very small settlements of the left abutment spur and the much larger settlement of
the dam immediately after the earthquake. Given the level of shaking, the
settlements are not considered excessive, but they were viewed with concern
because of the core cracking and erosion associated with lake filling.
Settlement of the dam continued for several weeks. During this time, the crest
settlements were less than the rock fill settlements as would be expected.
Measurements from the inspection gallery did not suggest significant foundation
settlement, Figure 19. The long term settlement of the left abutment spur was
unexpected, Figure 19. The results indicate a fairly uniform settlement without
tilting. The settlement caused increased leakage into the powerhouse.
The upstream shoulder settlements were estimated. Settlements of 800 mm were
typical. Subsurface sonar was used to check for evidence of under-water slope
failure. There were no detectable scarps and it is considered that the settlements are
simply the result of earthquake induced compaction of the rockfill. iii) Displacements
The displacement of the downstream rockfill shoulder is shown in Figure 19. The
maximum displacement of 253 mm compares with about 220 mm during the lake
filling period.
The ratio of long term crest displacement/settlement (typically 2.5) is similar to that
observed during the earthquake.

Dam Safety: Use of Seismic Monitoring Instrumentation in Dams
225
Figure 18: Settlements resulting from earthquake [21].
Figure 19: Deformations at the center of the dam [21].

226 Adamo et al.
iv) Left abutment area
Four inclined drill holes were drilled using air flushing. High water inflows were
encountered downstream of the core of the dam. Caving areas were found in two
holes. Twelve piezometers were installed and anomalously high pore pressures
measured. Permeability’s measured from falling head tests in the piezometers are at
least 1,000 times higher than expected.
The results indicate that core cracking and erosion had occurred similar to that
observed in 1967 on the right abutment. It is not known whether the defects were
predating or postdate the earthquake. Intensive monitoring indicates that they are
stable at present. Remedial measures were proposed and executed.
The dynamic behavior of the dam was studied based on the recordings of the five
strong-motion accelerographs of which the dam was equipped with. These recorded
the foreshock and the main shock and some of the aftershocks. Three of these
instruments were sited across the crest, one at the center of the base of the dam and
one at a mid-height rockfill berm. They recorded the peak accelerations shown in
Table 1. Table 1. Summary of the maximum accelerations measured
on the transverse dam’s centreline [21].
Description Acceleration (cm2/s)
Component Base Midheight Crest
Vertical 1378 2018 3247
Horizontal
Maximum 3247 4680 4155
Transverse 4366 3209 2824
Longitudinal 4155 3427 2766
The vertical base acceleration is amplified by a factor of over two at crest level. The
horizontal crest components are amplified more in the transverse direction than in
the longitudinal direction. An unexpected result is that the highest horizontal
accelerations (0.48 g) are measured on the rockfill shoulder at the mid height of the
dam which was subjected to further investigated.
5.2 La Villita Dam Case (1985) Mexico
La Villita Dam is a 60 m high zoned earth dam in Mexico with a crest about 420 m
long, constructed on a 70 m thick alluvium layer. The dam was the principal
component of a 304 MW multi-purpose hydroelectric, irrigation and flood-control
development. It was designed with symmetrical cross-section with a central
impervious clay core, well graded filter and transition zones and compacted rock
fill shells. The alluvial layer beneath the clay core was grouted below the dam, while
there is also a 0.6 m thick concrete cut-off wall to control seepage through the
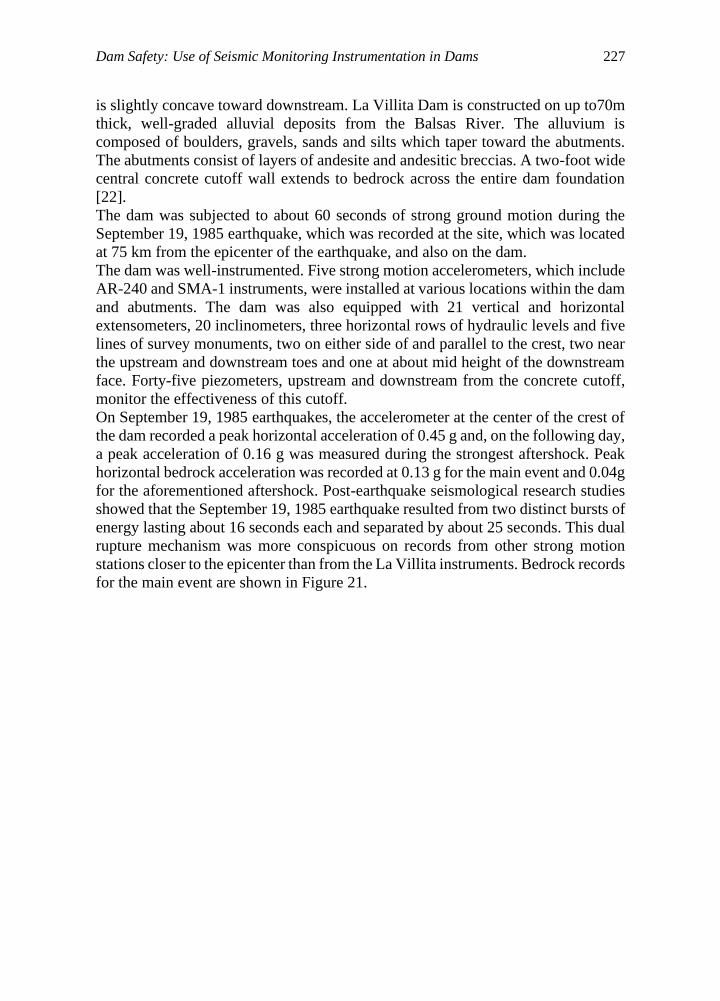
alluvium below the dam. Figure 20a and 20b shows a schematic representation of
the transverse cross section of the dam and a longitudinal section. Both sections
show the location of three functioning strong motion accelerometers (C), (B), and
(R).
Upstream and downstream faces slope at 2.5:1, horizontal to vertical. The dam crest
Dam Safety: Use of Seismic Monitoring Instrumentation in Dams
227
is slightly concave toward downstream. La Villita Dam is constructed on up to70m
thick, well-graded alluvial deposits from the Balsas River. The alluvium is
composed of boulders, gravels, sands and silts which taper toward the abutments.
The abutments consist of layers of andesite and andesitic breccias. A two-foot wide
central concrete cutoff wall extends to bedrock across the entire dam foundation
[22].
The dam was subjected to about 60 seconds of strong ground motion during the
September 19, 1985 earthquake, which was recorded at the site, which was located
at 75 km from the epicenter of the earthquake, and also on the dam.
The dam was well-instrumented. Five strong motion accelerometers, which include
AR-240 and SMA-1 instruments, were installed at various locations within the dam
and abutments. The dam was also equipped with 21 vertical and horizontal
extensometers, 20 inclinometers, three horizontal rows of hydraulic levels and five
lines of survey monuments, two on either side of and parallel to the crest, two near
the upstream and downstream toes and one at about mid height of the downstream
face. Forty-five piezometers, upstream and downstream from the concrete cutoff,
monitor the effectiveness of this cutoff.
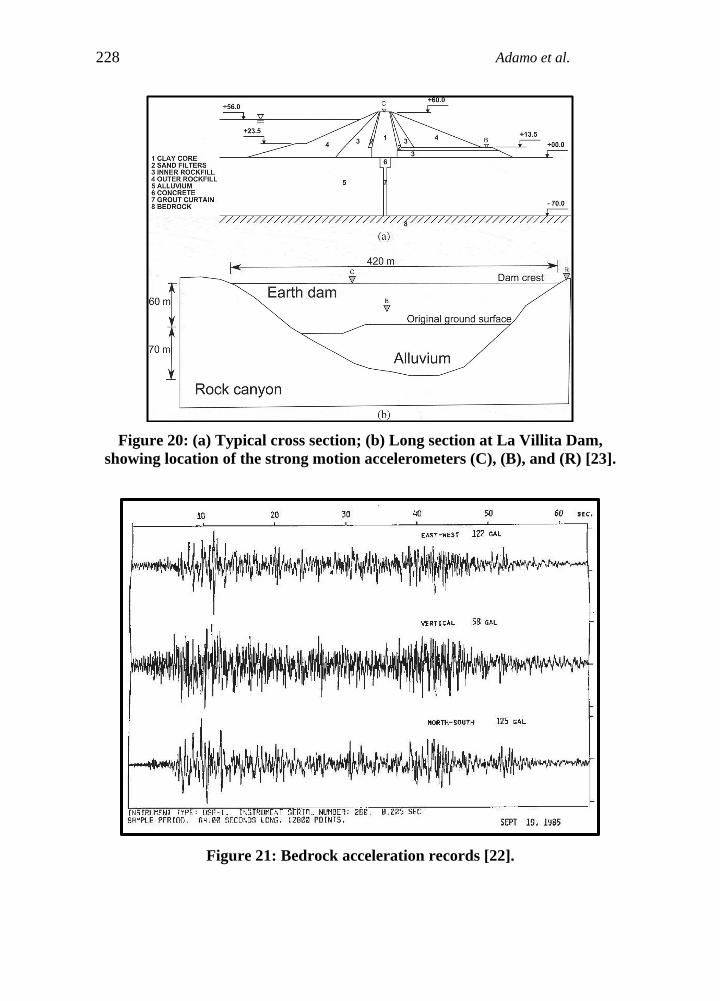
On September 19, 1985 earthquakes, the accelerometer at the center of the crest of
the dam recorded a peak horizontal acceleration of 0.45 g and, on the following day,
a peak acceleration of 0.16 g was measured during the strongest aftershock. Peak
horizontal bedrock acceleration was recorded at 0.13 g for the main event and 0.04g
for the aforementioned aftershock. Post-earthquake seismological research studies
showed that the September 19, 1985 earthquake resulted from two distinct bursts of
energy lasting about 16 seconds each and separated by about 25 seconds. This dual
rupture mechanism was more conspicuous on records from other strong motion
stations closer to the epicenter than from the La Villita instruments. Bedrock records
for the main event are shown in Figure 21.
228 Adamo et al.
Figure 20: (a) Typical cross section; (b) Long section at La Villita Dam,
showing location of the strong motion accelerometers (C), (B), and (R) [23].
Figure 21: Bedrock acceleration records [22].

Dam Safety: Use of Seismic Monitoring Instrumentation in Dams
229
Damages to the dam was noticeable on the dam in the form of cracking, settlement
and displacements, as follows:
i) Cracking
Two main systems of longitudinal cracks developed at the crest of La Villita Dam,
parallel to its axis, some 16 feet away from the crest edges. These cracks formed
along the buried shoulders of the central core and most likely resulted from
differential settlement between the core and the adjacent filter zones. A 260- foot-
long crack, 1/4 to 2 inches wide at the surface, formed along the upstream side of
the dam crest. Vertical offsets of 2 to 4 inches occurred between the lips of the
crack, the upstream side settling the most. On the downstream side, another major
crack system appeared, about 1,000 feet long, 0.4 to 0.6-inch-wide, with vertical
offsets ranging from 0.5 to 0.8 inch, the side toward the face of the dam being
downthrown. Several other longitudinal cracks, up to two inches wide, but less
extensive than the two principal crack systems, were also found. The most
significant cracks did not reach the impervious core zone and were found to
disappear below two-feet depth, except near the right abutment, where one of the
cracks was delineated as a closed fissure through a clay lens embedded at about
three-foot depth within the filter sands, Figures 22 and 23.
Figure 22: Crack Locations on La Villita Dam [22].

230 Adamo et al.
Figure 23: Photographs showing longitudinal cracking at dam crest [22].
ii) Settlements
Post-earthquake surveys showed that, in its central part, the dam settled between 20
and 32 cm on the upstream side and between 9.1 and 22 cm decreased in magnitude
to near zero toward the abutments and seemed to be evenly distributed within the
dam cross-section, rather than associated with distinct surfaces.
Figure 24 gives the accumulated settlement of the dam due to the earthquakes to
which the dam was subjected in previous years. Earthquake-induced settlements
have been found to exceed static postconstruction settlements and appear to increase
in magnitude from one earthquake to the other, perhaps indicating a change in
stiffness of the dam materials or a slow, cumulative, deterioration of part of the
embankment. Inclinometer records confirmed that permanent deformations

Dam Safety: Use of Seismic Monitoring Instrumentation in Dams
231
decreased in magnitude from crest to bottom of the embankment and did not involve
the foundation materials.
Figure 24: Historical crest Settlements record showing crest settlements from
1968 to 1985 [22].
Settlements were particularly noticeable at several piezometer locations, where the
piezometer tubes which extend down 80m to deep within the embankment remained
in place, while their protective concrete boxes settled along with the face of the dam,
Figure 25.

232 Adamo et al.
Ö
Figure 25: Settlement at piezometer box [22].
iii) Displacements
The downstream half of the dam moved horizontally up to 10 cm in the downstream
direction and the upstream half up to 16.5 cm in the upstream direction.
Downstream horizontal displacements were somewhat irregular, although generally
more symmetrical with respect to the center of the dam than the upstream
displacements. These observed damages correlated well with the instrumentation and strong motion
records. Survey monuments, inclinometers and extensometers were essential to
provide detailed information on the earthquake-induced deformations of La Villita
Dam. Of particular interest was the fact that the dam had previously been shaken by
several significant earthquakes in the 12 years that preceded the 1985 event.
The dam was well instrumented, especially for strong motion accelerometers which
proved their significant value by the records they provided; giving full picture of
the dam response under large earthquakes.
It is interesting to note that the 148 m El Infiernillo earth core rockfill dam, which
is located in the same area as La Villita Dam was also shaken by the same 1985
(M8.1) earthquake and the sequence of the five closely spaced events since 1975.
The dam suffered also cracking and settlement problems, but the deformations
remained small and consistent from one event to the next.
5.3 Cogoti Dam Case (1943), Chile
This dam is a concrete face rockfill dam built in 1938, it is located about 47 miles
(75 km) from the City of Ovalle, Chile. The dam site is situated downstream from
the confluence of the Pama and Cogoti rivers, and in a deep gorge naturally carved
by the Cogoti River. Cogoti Dam, shown in plan and cross section in Figures 26 and
27, has a maximum height of 85 m, a crest length of 160 m. The upstream slope
averages 1.4H : 1V and the downstream slope is about 1.5H :1V. The dam is

Dam Safety: Use of Seismic Monitoring Instrumentation in Dams
233
primarily used for irrigation purposes and impounds a reservoir of 148 million cubic
meters capacity [24].
Figure 26: Site plan and layout of Cogoti Dam [24].
Figure 27: Typical cross section of Cogoti Dam [24].

234 Adamo et al.
Local rocks, which consists primarily of andesitic breccia, was used for construction.
The main rock fill zone was started by blasting some of the abutment rocks and
allowing the blasted rock fragments to fall freely on the foundation. Following
completion of the required abutment excavation, rockfill was dumped in lifts as
thick as could be practical, and without mechanical compaction or sluicing.
The flexible, impervious, segmented reinforced concrete face was placed on a 2 m
thick bedding zone of hand-placed, small-size, rock. It was designed as individually
formed slabs, of 10 x 10 m average size, with a thickness tapering from 80 cm at
the upstream toe to 20 cm at the crest of the dam. Horizontal and vertical joints with
60 cm wide copper water stops and rivets were provided. The spacing and bar sizes
of the steel reinforcement vary as a function of elevation along the dam face, starting
with a double curtain of 25mm bars at 30 cm pacing near the toe and ending with a
single curtain of 18mm bars at 20 cm spacing at the crest.
The spillway is an ungated channel with a reinforced concrete side-channel having
broad crested weir control, and was excavated in the left abutment rocks. It has a
design capacity of 4,984 m3/s.
On April 6, 1943, a large earthquake (M7.9) occurred approximately 200 km north
of the City of Santiago. The earthquake centered about 95 km from the Cogoti Dam
site; peak ground acceleration at the site was estimated to be about 0.19 g.
Substantial settlement of the dam was observed as a result of this earthquake.
The April 6, 1943, Illapel Earthquake destroyed most of the towns of Combarbala,
Ovalle and Illapel, about 200 km north of the City of Santiago. Damage was
reported in a wide area, some including the City of Santiago. However, few
references, and none of these technical reports, describe this earthquake.
Presumably, this is because the affected onshore area is mountainous, was sparsely
populated and was probably considered of minor economic importance in 1943.
The shock was; however, felt as far away as Buenos Aires, Argentina, where dishes
were broken and ink spilled from ink wells. Damage extended throughout the
province of Coquimbo. A copper mine tailings dam collapsed near the City of
Ovalle, killing five persons. Total reported lives lost were eleven. The epicenter was
determined to be offshore, directly across the mouth of the Limari River. Earlier
magnitude estimates were as high as M8.3, but were subsequently lowered to a
maximum of M7.9. Many aftershocks were felt during the week that followed the
earthquake.
The Illapel Earthquake was centered about 95 km from Cogoti Dam. An intensity
IX on the Rossi-Forel scale was reported at the dam site. The reservoir is believed
to be at its normal operating level at the time of occurrence of the earthquake. The
principal observed effect on Cogoti Dam was to produce an instantaneous
settlement of up to 41cm. Settlement occurred throughout the length of the crest,
and the extreme upper part of the concrete face slab was exposed from the
downstream side, as quoted in an internal report by Empresa Nacional de
Electricidad S.A., Santiago, Chile (1972). It is of interest to note that the maximum
earthquake induced settlement was about equal to that observed 4.5 years at the end
of construction. The point where this settlement was measured was near the center

Dam Safety: Use of Seismic Monitoring Instrumentation in Dams
235
of the crest, where the dam height is about 63 m. This was not the highest dam
section, which was located close to the right abutment. The settlement at the
maximum dam height was less, presumably because of a restraining effect due to
the nearby presence of the very steep abutment. Minor rockslides also occurred
along the downstream slope of the dam.
Leakage had been observed at Cogoti Dam since the reservoir’s first filling in 1939.
Intermittent records have been kept over the years, which indicate leakage to be
directly related to the elevation of the reservoir and probably coming through the
abutment or foundation, rather than the dam itself. No significant increase in dam
leakage was observed as a result of the 1943 earthquake. No face cracks were caused
by the earthquake. Yearly settlement and leakage data at Cogoti Dam are presented
in Figures 28 and 29.
Figure 28: Crest settlement curve [24].

236 Adamo et al.
Figure 29: Leakage at Cogoti dam [24].
The dam has continued to settle after the 1943 earthquake. Interestingly, it was
shaken again by three significant, although considerably more remote earthquakes:
in 1965 La Ligue Earthquake, M7.1; in 1971 Papudo-Zapallar Earthquake, M7.5;
and in 1985 Llolleo-Algarrobo Earthquake, M7.7. These more recent events;
however, were centered at distances of more than 165 km from the dam and did not
induce any noticeable settlement. Yet, in 1971, even though the reservoir was empty
at the time of occurrence of that earthquake, the Papudo-Zapallar Earthquake caused
longitudinal cracking at the dam crest and dislodged some rocks along the
downstream slope.
Cogoti Dam was not instrumented at the time of the 1943 earthquake, nor were
accelerometers installed that could have recorded the subsequent earthquakes.
Using an attenuation equation primarily developed from Chilean earthquake data,
the peak ground acceleration (PGA) induced at the Cogoti Dam site by the Illapel
Earthquake was estimated to be 0.19 g. Peak ground accelerations generated by the
subsequent earthquakes were probably less than 0.05 g; therefore, that noticeable
settlements were unlikely to occur under such moderate shaking conditions.
Although significant settlement occurred due to Illapel Earthquake, the dam
performed extremely well and no seismic damage was observed to the concrete face.
Cogoti Dam’s performance substantiates the generally accepted belief that concrete
face rockfill dams have an excellent inherent capacity to withstand substantial
earthquake motion without experiencing significant damage. Although Cogoti
Dam’s leakage has increased over the years, this has been related to aging and

Dam Safety: Use of Seismic Monitoring Instrumentation in Dams
237
spalling of the concrete and joint squeezing, not to the 1943 Illapel Earthquake nor
to any of the subsequent earthquakes to which the dam was exposed [24].
Leakage increased from 200l/sec to 1400l/sec after the earthquake and, after
repairing it decreased to 400l/sec.
On 14 October 1997, the magnitude M6.8 Punitaqui Earthquake with epicentral
distance of 20 km and focal depth of 30 km, produced a PGA of 0.19 g and a crest
settlement of 15 cm. No damage was reported from the concrete face, but some
cracking did occur at the downstream face of the dam, Figure 30.
Figure 30: (Left) General view of the dam. (Right) A close up view of the dam
crest showing longitudinal cracking [25].
The absence of strong motion accelerometer at this dam site is regrettable; as
valuable information on the actual response of the dam could have been obtained
from the recordings of PGA’s acting on dam; therefore, dynamic analysis of the
dam was not performed [25].
Moreover, the near-field response of the concrete slab facing still needs to be tested
both in experiments and during a strong seismic event. An example is the 85 m high
Cogoti CFR Dam in Chile [26].
6. Concrete Dams Response to observed PGAs During
Earthquakes From the recorded response of concrete dams to earthquake ground shacking, it can
be seen that these dams generally fare better than embankment dams under seismic
loads. Large number of concrete dams have been shaken by earthquakes close to
dam sites, but only few have suffered major damages. In fact, during the last fifty
years, many such dams experienced peak horizontal ground accelerations (PHGA)
greater than 0.3 g. The most severely shaken dams included all principal types of
concrete structures: arch, multiple arch, gravity buttress and RCC dams. Generally,
concrete dams had performed extremely well when subjected to earthquake
238 Adamo et al.
motions, even when shaken by forces far in excess of their design loading. It has
become apparent that the most significant factor in determining the response of
concrete dams is the PHGA and probably the spectral acceleration at the natural
frequency of the dam.
No significant damage has ever been suffered by an arch dam, although three such
structures have historically experienced substantial ground motions. Concrete
buttress dams when subjected to severe shaking have developed horizontal cracks
at the elevation high in the dam where the downstream buttresses intersect the
vertical “chimney” section. This is an area where the stiffness of the concrete
structures significantly changes. Roller-compacted concrete dams; Shapai arch
Dam in China and Miyatoko Dam in Japan, performed no differently to date than a
dam built of conventionally placed concrete despite concern by some of less
strength at the many lift joints.
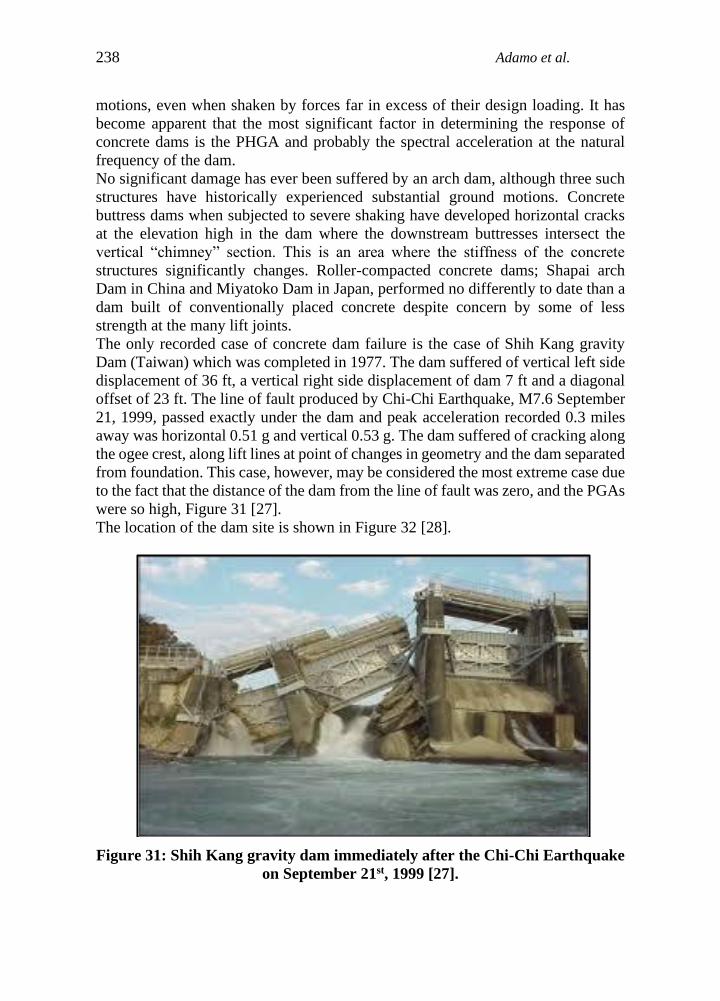
The only recorded case of concrete dam failure is the case of Shih Kang gravity
Dam (Taiwan) which was completed in 1977. The dam suffered of vertical left side
displacement of 36 ft, a vertical right side displacement of dam 7 ft and a diagonal
offset of 23 ft. The line of fault produced by Chi-Chi Earthquake, M7.6 September
21, 1999, passed exactly under the dam and peak acceleration recorded 0.3 miles
away was horizontal 0.51 g and vertical 0.53 g. The dam suffered of cracking along
the ogee crest, along lift lines at point of changes in geometry and the dam separated
from foundation. This case, however, may be considered the most extreme case due
to the fact that the distance of the dam from the line of fault was zero, and the PGAs
were so high, Figure 31 [27].
The location of the dam site is shown in Figure 32 [28].
Figure 31: Shih Kang gravity dam immediately after the Chi-Chi Earthquake
on September 21st, 1999 [27].

Dam Safety: Use of Seismic Monitoring Instrumentation in Dams
239
The availability nowadays of high quality strong motion records derived from
refined strong motion accelerometers, at or close to dam site, has enhanced our
knowledge of dams’ behavior in response to earthquakes. Correlation of the type
and magnitude of damage with the measured PGAs at dam sites is possible now
which helps in better designs of future dams.
Since the 1979, many large magnitude earthquakes have occurred as expected. With
a greater number of higher quality strong motion instruments located at or near dams,
our base of knowledge of the magnitude of shaking to which concrete dams have
been subjected has increased. Thus, the performance of severely shaken concrete
dams has increased and this knowledge can be applied in a positive and beneficial
manner to the design of future dams [29].
Figure 32: The Chelungpu fault, and the epicenter of the Chi- Chi
earthquake. Also shown are background seismicity, strong aftershocks, E-W
component velocity forms along the fault line [28].

240 Adamo et al.
In a table annexed to the same paper [29], but published in the International Water
Power and Dam Construction Magazine, the response of 19 dams during
earthquakes was described [30]. The table included many cases of concrete dams
that were shaken by peak ground acceleration (PGA) of 0.3g or more (measured or
estimated). This table is reproduced in an abridged form in Table 2 which contains
selected and representative cases only. More details are given on these dams in
reference [27].

Dam Safety: Use of Seismic Monitoring Instrumentation in Dams
241
Table 2: Concrete Dams Response in Earthquakes for
(PHGA > 0.3 g) (1 January, 2000) [30].
Dam
(completed) Country
Height
(m)
Type of
Dam
EQ name
and date M
PHGA (g)
[31] Remarks
Koyna
(1963) India (103) Gravity
Koyna
11 Dec 1967 1.8 (3) 6.5 0.63
Cracks in both
faces
Mingtan
(1990) Taiwan (82) Gravity
Chi- Chi
21 Sep 1999 7.5 (12) 7.6
0.4 to 0.5
(est) No damage
Kasho
(1989 Japan (46.4) Gravity
Western
Tottori
6 Oct 2000
1.9 or 5
(3 or 8) 7.3
0.54 b 2.09
c
Cracks in Control
Building at crest
Miyatoko
RCC (1993) Japan (48) RCC
Tohoku
11 Mar 2011 84 (135) 9.0 > 0.7 No Damage
Takou
(2007) Japan (77) Gravity
Tohoku
11 Mar 2011
[4]
68 (109) 9.0 > 0.4
Cracking of
gatehouse walls at
crest
Bear Valley
(1912, 1988) USA (28)
Multiple
arch
modified
to gravity
dam in
1988
Landers
28 Jun 1992,
Big Bear 29
Jun 1992
28 (45),
9 (14.5)
7.4,
6.6 0.57
Multiple arch
modified to gravity
dam in 1988. No
damage, except
slight displacement
of crest bridge
girders
Gibraltar
(1920, 1990) USA (52) RCC
Santa Barbara
29 Jun 1925
6.5 and
6.8 6.3 > 0.3 (est)
No damage.
Modified in 1990
with RCC
Rapel
(1968) Chile (110) Arch
Santiago 3
Mar 1985 28 (45) 7.8
0.31 near
dam
Damage to
spillway and intake
tower, dam
performed well
Techi
(1974) Taiwan (185) Arch
Chi-Chi 21
Sept. 1999 7.6
0.5 b 0.86
c
Local cracking of
curb at dam crest
Shapai RCC
(2003) China (132) RCC
Wechuan 12
May 2008 7.8 (12) 8.0 > 0.5 (est) No damage
Sefid Rud
(1962) Iran (106) Buttress
Manjil 21 Jun
1990
Near
dam site 7.7 0.714 (est)
Horiz, cracks near
crest, minor disp,
of blocks
Legend: b=base, c=Crest, est=Estimate, disp.=Displacement, rt abut=Right Abutment, Ht= Height, V=Vertical,
M=Magnitude (ML or mb for less than 6.5 and MS above 6.5 [31]), Surf=Surface, aft=Aftershock, PHGA=Peak
horizontal ground acceleration

242 Adamo et al.
The analysis of the seismic response of a concrete dam is a complex
problem in which the accurate representation of the material’s behavior
requires some form of nonlinear model, especially if the concrete material is
subjected to significant tensile stress demands. In case of severe ground motions,
considerable cracking is likely to develop across extensive regions of the
dam, particularly at the dam heel and in the vicinity of abrupt changes
in geometry. Therefore, the proper consideration of this nonlinear phenomenon and
its consequences on the dynamic response of the system become
critically important for a rigorous seismic evaluation. The actual post-
cracking behavior and the ultimate capacity of existing concrete dams can only be
determined by performing the corresponding nonlinear dynamic analyses
[32]. This analysis requires the seismic spectra measured on dam sites or nearby
sites as an input data in addition to material properties assumed for linear and
nonlinear dynamic analyses.
7. Summary Points and Conclusions
7.1 Since the late 1980s, the need for rational method of design for moderate or
significate risk dams has raised the need for using seismic monitoring
instrumentation in dam sites. These were required for recording peak ground
acceleration and its variation with time during the event, together with the three
dimensional displacements in dam body and deformations of its slopes.
Recording the response of pore pressure devices accompanying the measured
PGAs was also done. The development of equipment for transmitting these
information and observation to observation centers helped relaying them from
remote sites. Nearly, all seismic instruments in use today utilize servo-
accelerometers that have the ability to measure motion in a single horizontal,
vertical, or transverse planes. Most of the devices are considered “strong
motion” instruments that record significant movements.
7.2 Seismic instrumentation of dams and reservoirs’ sites is accepted nowadays not
as luxury items for research work, but mainly to understand significant seismic
hazards facing existing dams in seismic areas and even desirable in
traditionally non-seismic areas. With the advent of digital seismic equipment,
it can now be an integral part of dam safety monitoring works. The digital
earthquake data can be gathered by site personnel and remote control centers
by use of computers. When digital instruments are installed with modem and
communication means, then remote access from several offices is made
available. Seismic instruments’ recordings taken from existing dam sites help
also in the safe design of new dams in seismically similar regions.
7.3 The increased awareness of the importance of seismic instrumentation in dams
have led to installing them in large number in strategic dams. Examples are
given of two cases only for demonstration, but many more are given in
manufacturers literature. Many high caliber manufactures are available in the
world nowadays; their literature shows the degree of advancement in

Dam Safety: Use of Seismic Monitoring Instrumentation in Dams
243
instruments manufacturing, software development and progress in data transfer
equipment. Seismic instrumentations are costly to install, run and maintain, but
all agree on their extreme value which justifies their use in dams and make their
installation highly recommendable.
7.4 Normally, recorded parameters are the maximum ground acceleration (PGA)
caused by an earthquake of magnitude (M) whose focus is at known distance
from the dam. Damage sustained by dams after an earthquake can be matched
with the recordings of the seismic instruments used at dam sites. Apart from
PGAs, other obtained recordings are the time history and frequency of the event
so a full picture is formed. The correlation of damage with the seismic records
gives good guide in selecting the most suitable type of a future dam in any
seismic region. Seismic measurements show that concrete dams are less
affected by earthquakes than embankment dams under similar seismic loading
conditions, and even that rockfill dams have better performance than earthfill
dams. We have tried to explain this by presenting many case histories of dams
in terms of increased seepage, settlement, displacement and cracking. From
these and many other documented cases, there are lessons to be learnt by
designers of the best ways to handle any new design or the best rehabilitating
and upgrading program needed for damaged existing dams.
7.5 It was possible from seismic measurements and dynamic analyses of affected
dams to discover the reasons why concrete dams have performed well and
invariably better than that predicted by design or analysis when shaken by an
earthquake. These reasons may be:
i) the redundancy of the damaged structure to redistribute load.
ii) the duration of strong shaking being too short to cause sizable damage.
iii) the increase in the tensile strength of the concrete during dynamic loading that
increases resiliency.
iv) increase in the damping that reduces the seismic impact on the dam.
v) reduced seismic impact because the natural frequency of the dam does not match
the frequency of the earthquake, and
vi) the three-dimensional effects of canyon confinement or dam geometry
(curvature) that help prevent failure [30].
7.6 It may be seen from the foregoing that, seismic instrumentation for measuring
and recording peak ground acceleration (PGA) and related parameters at dams’
sites during earthquake adds to dam safety precautions. They are as valuable to
dam safety as other conventional dam instrumentation, their use is therefore
highly desirable and recommendable.

244 Adamo et al.
References
[1] USCOLD (2000). Observed Performance of Dams during Earthquakes. Vol.
II, October 2000, pp.15- 20.
http://www.ussdams.org/wpcontent/uploads/2016/05/ObservedPerformanceII
_V2.pdf
[2] USBR (1987). Concrete Dams Instrumentation Manual. Page12.
https://www.usbr.gov/tsc/techreferences/mands/mands-pdfs/CDamInst.pdf
[3] Mihailov, V. and Dojcinovsky, D. (2004). Strong Motion Instrumentation of
Dams in Macedonia-Some Experience and Results. 13th World Conference on
Earthquake Engineering Vancouver, B.C., Canada, August 1-6, 2004, Paper
No. 475.
https://www.iitk.ac.in/nicee/wcee/article/13_475.pdf
[4] National Research Council (1990). Earthquake Engineering for Concrete
Dams: Design, Performance, and Research Needs. Panel on Earthquake
Engineering for Concrete Dams, Committee on Earthquake Engineering.
National Academy Press Report pp.33-35. Washington, D.C. 1990.
https://www.nap.edu/catalog/1742/earthquake-engineering-for-concrete-
dams-design-performance-and-research-needs
[5] FEREC (n.d.). Instrumentation and Monitoring. Chapter 9, pp.20, 31.
https://www.ferc.gov/industries/hydropower/safety/guidelines/eng-
guide/chap9.pdf
[6] Wikipedia (2012). Seismometer. Retrieved on 10th June 2020.
https://en.m.wikipedia.org/wiki/Seismometer
[7] Engineering 360 (n.d.). Seismic Instruments Information. Retrieved on 10th
June 2020.
https://www.globalspec.com/learnmore/sensors_transducers_detectors/accele
ration_vibration_sensing/seismic_instruments
[8] Dewey, J. and Byerlym, P. (2004). The Early History of Seismometry to 1900.
USGS. Last modification on 23 January 2004. Retrieved on 10th June 2020.
https://web.archive.org/web/20060622213909/http://neic.usgs.gov/neis/seism
ology/part02.html
[9] Bartholomew, C. L. and Haverland, M. L. (1987). USBR Concrete Dams
Instrumentation Manual.. USBR, October 1987, pp.121- 125.
https://www.usbr.gov/tsc/techreferences/mands/mands-pdfs/CDamInst.pdf
[10] Evangelidis, C. (2018). Seismic monitoring of Large Dams. Alliance for
Disaster Risk Reduction (ALTER). Retrieved on 10th June 2020.
http://alter-project.eu/wp-
content/uploads/2018/12/ALTER_seismic_monitoring.pdf
[11] GeoSig (n.d.). Seismic Instrumentation and Monitoring of Dams. Switzerland.
Retrieved on 10th June 2020.
https://www.geosig.com/Dams-pg38.aspx

Dam Safety: Use of Seismic Monitoring Instrumentation in Dams
245
[12] USACE (1995). Instrumentation of embankment Dams and Levees. Manual
No. 1110-2-1908, 30 June 1995. Chapter 4, pp.19-21. Washington, DC.
https://www.publications.usace.army.mil/Portals/76/Publications/EngineerM
anuals/EM_1110-2-1908.pdf
[13] Nile Alley (2017). Aswan High Dam. Retrieved on 12th June 2020.
http://www.nilecruised.com/aswan-high-dam/
[14] Water Technologies (n.d.). Aswan High Dam, River Nile, Sudan, Egypt.
Retrieved on 12th June 2020.
https://www.water-technology.net/projects/aswan-high-dam-nile-sudan-
egypt/
[15] McKenna, E. (n.d.). Aswan High Dam. Encyclopedia Britannica. Retrieved on
12th June 2020.
https://www.britannica.com/topic/Aswan-High-Dam
[16] REFTEK (2013). Strong Motion Structural Monitoring Technology is used on
the Aswan Dams. May 2013. Retrieved on 12th June 2020.
https://reftek.com/ref-teks-strong-motion-structural-monitoring-technology-
used-aswan-dams/
[17] GeoSig (n.d.). Dams- Enguri dam- Georgia. Retrieved on 13t June 2020.
https://www.geosig.com/Dams---Enguri-Dam--Georgia-pg101.aspx
[18] de Gali Price, C. H. and Christianson, K. J. (2019). The Legacy of Edgecumbe
the 1987 Earthquake. Proceeding of the 7th International Conference on
Earthquake Geotechnical Engineering for Protection and Construction. Edited
by Silvesti F, Moraci N. Rome, Italy 17- 20 June 2019, pp.1994-2001.
https://books.google.se/books?id=_Jq4DwAAQBAJ&pg=PA2000&lpg=PA2
000&dq=matahina+dam+history&source=bl&ots=uGoSK1vbX9&sig=ACfU
3U376Sx83-
2Caf5j2zpL_cYLOV_pTA&hl=sv&sa=X&ved=2ahUKEwjew52zk_LpAhW
IE5oKHYfwBhEQ6AEwEHoECAgQAg#v=onepage&q=matahina%20dam
%20history&f=false
[19] USCOLD (1992). Matahina Dam, New Zealand. Observed Performance of
Dams During Earthquakes. Vol.1, pp.101-109.
http://www.ussdams.org/wpcontent/uploads/2016/05/ObservedPerformanceIs
_v1.pdf
[20] McKinnon, M. (2015). Floodway, Lake Matahina. TERA, the Encyclopedia of
New Zealand. Updated 1 Jul 2015. Retrieved on 15th June 2020.
https://teara.govt.nz/en/photograph/5711/floodway-lake-matahina
[21] Gillon, M. D. (1988). The Observed Seismic Behavior of Matahina Dam.
International Conference on Case Histories in Geotechnical Engineering.
Session 4/25.
https://scholarsmine.mst.edu/cgi/viewcontent.cgi?article=1556&context=icch
ge

246 Adamo et al.
[22] USSD (2000). Observed Performance of Dams During Earthquakes. Vol. II,
pp.80-89, October 2000.
http://www.ussdams.org/wpcontent/uploads/2016/05/ObservedPerformanceII
_V2.pdf
[23] Pelecanos, L., Kontoe, S. and Zdravković, L. (2017). The Effects of Dam–
Reservoir Interaction on the Nonlinear Seismic Response of Earth Dams.
Journal of Earthquake Engineering, pp.1034-1056, 15 May 2017. Published
online:19 April 2018.
https://www.tandfonline.com/doi/full/10.1080/13632469.2018.1453409
[24] USCOLD (2000). Observed Performance of Dams During Earthquakes. Vol.II,
pp.72- 75, October 2000.
http://www.ussdams.org/wpcontent/uploads/2016/05/ObservedPerformanceII
_V2.pdf
[25] Wieland, M. (2009). CFRD’s in highly seismic regions. Published on 14th
April 2010 by Water Power and Dam Construction Magazine. Originally
presented at the First International Symposium on Rockfill Dams, held in
Chengdu, China from 18-21 October 2009.
https://www.waterpowermagazine.com/features/featurecfrds-in-highly-
seismic-regions/
[26] Wieland, M. (2003). Seismic Aspects of Dams. Q83 General report.
Proceedings of the 21st Congress of the International Commission on Large
Dams, pp.1233- 1362. Montreal, June 2003.
https://www.academia.edu/18384707/0_Wieland_ICOLD_Montreal_General
_ReportQ83_seismic_aspects_of_dams
[27] USSD (2017). Seismic Analysis of Concrete Dams Workshop Annual
Conference. April 6-7, 2017.
http://www.ussdams.org/wp-content/uploads/2016/05/Session1_Case-
Histories-and-Seismic-PFM.pdf
[28] Tsai, Y. B. and Huang, M.W. (2000).Strong Motion Characteristics of the Chi-
Chi Taiwan 1999 earthquake.
http://www.ctsee.org.tw/pdf/ee0201/es0201-1.pdf
[29] Hansen, K. D. and Nuss, L. K. (2001). Lessons learned from the earthquake
performance of concrete dams. Proceedings of 15th European Conference on
Soil Mechanics and Geotechnical Engineering, p.7. 12-15 September 2011.
http://www.hssmge.gr/TEFXOS_No_39_SEPTEMBER_2011.pdf
[30] Hansen, K. D., Nuss, L. K. and Roehm, L. (2011). Lessons learned from the
earthquake performance of concrete dams. International waterpower and Dam
Construction Magazine, Table (1), 27 September 2011.
https://www.waterpowermagazine.com/features/featurelessons-learned-from-
the-earthquake-performance-of-concrete-dams/

Dam Safety: Use of Seismic Monitoring Instrumentation in Dams
247
[31] Kanamori, H. (1983). Magnitude Scales and quantification of Earthquakes.
Tectonophysics Journal 93 (1983), pp.185-199. Elsevier 1983.
http://gps-prod
storage.cloud.caltech.edu.s3.amazonaws.com/people_personal_assets/kanam
ori/HKtect83b.pdf
[32] Yamaguchi, Y., Hall, R., Sasaki, T., Matheu, E., Kanenawak, K., Chudgar, A.
and Yule, D. (2004). Seismic Performance Evaluation of Concrete Gravity
Dams. Proceeding of the 13th World Conference on Earthquake Engineering
Vancouver, B.C., Canada. August 1-6, 2004 Paper No. 1068, p.5.
https://www.researchgate.net/publication/268428812_Seismic_Performance_
Evaluation_of_Concrete_Gravity_Dams