dallas-fort worth air quality update - tceq · eagle mountain lake 96 / 80 frisco corsicana na / 71...
TRANSCRIPT
Dallas-Fort Worth Air Quality Update
Air Quality Division
Office of Air Air Quality Division
David Brymer, Director
State Implementation Plan Public Information Meeting Arlington, Texas
September 5, 2013
Air Quality Division • DFW Air Quality Update • David Brymer • September 5, 2013 • Page 2
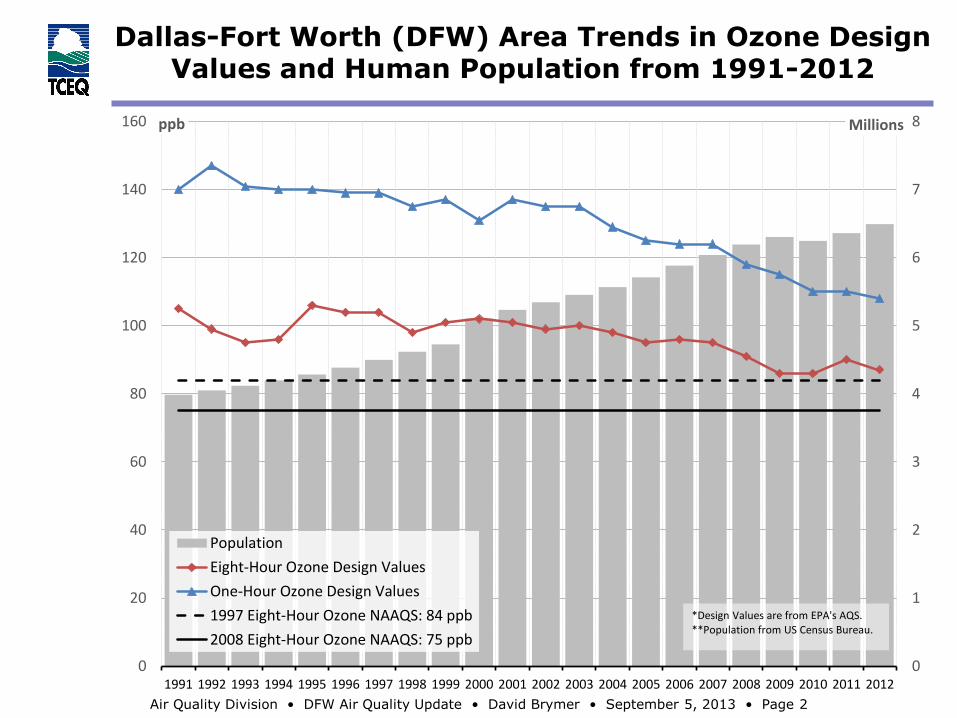
Dallas-Fort Worth (DFW) Area Trends in Ozone Design Values and Human Population from 1991-2012
0
1
2
3
4
5
6
7
8
0
20
40
60
80
100
120
140
160
1991 1992 1993 1994 1995 1996 1997 1998 1999 2000 2001 2002 2003 2004 2005 2006 2007 2008 2009 2010 2011 2012
Millionsppb
Population
Eight-Hour Ozone Design Values
One-Hour Ozone Design Values
1997 Eight-Hour Ozone NAAQS: 84 ppb
2008 Eight-Hour Ozone NAAQS: 75 ppb
*Design Values are from EPA's AQS. **Population from US Census Bureau.

Air Quality Division • DFW Air Quality Update • David Brymer • September 5, 2013 • Page 3
Eight-Hour Ozone Regulatory Design Value (DVR) Changes by Monitor - 2003 / 9-4-2013
Greenville NA / 72
Rockwall Heath 81 / 77
Kaufman 73 / 72
Italy NA / 72
Cleburne 90 / 78
Granbury 84 / 75
Parker 89 / 79
Pilot Point NA / 84
Denton Airport 97 / 87
Midlothian NA / 76
Arlington NA / 80
Dallas Exec. 85 / 78
Hinton 90 / 84
Dallas North 86 / 83
Grapevine 100 / 85
Keller 100 / 84
Fort Worth NW 96 / 79
Eagle Mountain Lake 96 / 80
Frisco 88 / 84
Corsicana NA / 71
Color Coding:
• Monitors in red were operational prior to 2000
• Monitors in blue began operation in 2000
• Monitors in green began operation after 2000
Note: • 2013 values
were updated on September 4 and are subject to change by the end of the ozone season.

Air Quality Division • DFW Air Quality Update • David Brymer • September 5, 2013 • Page 4
DFW Area Fourth-Highest Eight-Hour Ozone Levels Current Monitors That Began Operation Before 2000
50
60
70
80
90
100
110
2000 2001 2002 2003 2004 2005 2006 2007 2008 2009 2010 2011 2012 2013
Dallas Executive Airport Dallas Hinton Street
Dallas North #2 Denton Airport South
Frisco Fort Worth Northwest
Keller 75 ppb Standard
84 ppb Standard
ppb

Air Quality Division • DFW Air Quality Update • David Brymer • September 5, 2013 • Page 5
DFW Eight-Hour Ozone Regulatory Design Values Current Monitors That Began Operation Before 2000
Monitored regulatory ozone design value (DVR): three-year rolling average of the fourth highest reading per year. Example: The 2012 monitored design value is an average of the fourth highest monitored levels from 2010, 2011, and 2012.
50
60
70
80
90
100
110
2000 2001 2002 2003 2004 2005 2006 2007 2008 2009 2010 2011 2012 2013
Dallas Executive Airport Dallas Hinton Street
Dallas North #2 Denton Airport South
Frisco Fort Worth Northwest
Keller 75 ppb Standard
84 ppb Standard
ppb
Air Quality Division • DFW Air Quality Update • David Brymer • September 5, 2013 • Page 6
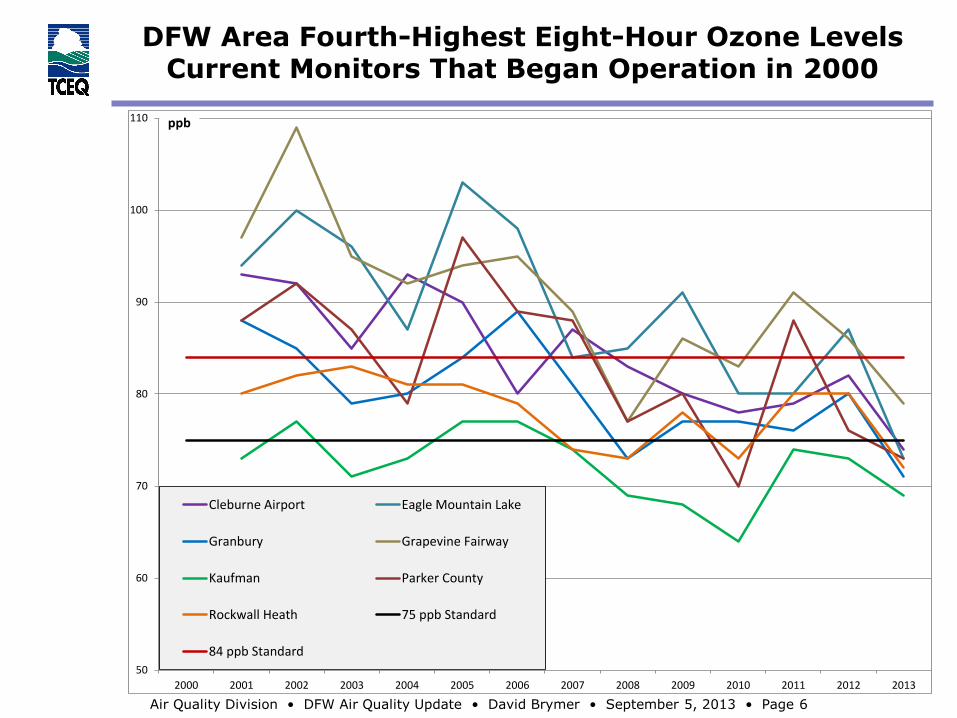
DFW Area Fourth-Highest Eight-Hour Ozone Levels Current Monitors That Began Operation in 2000
50
60
70
80
90
100
110
2000 2001 2002 2003 2004 2005 2006 2007 2008 2009 2010 2011 2012 2013
Cleburne Airport Eagle Mountain Lake
Granbury Grapevine Fairway
Kaufman Parker County
Rockwall Heath 75 ppb Standard
84 ppb Standard
ppb
Air Quality Division • DFW Air Quality Update • David Brymer • September 5, 2013 • Page 7
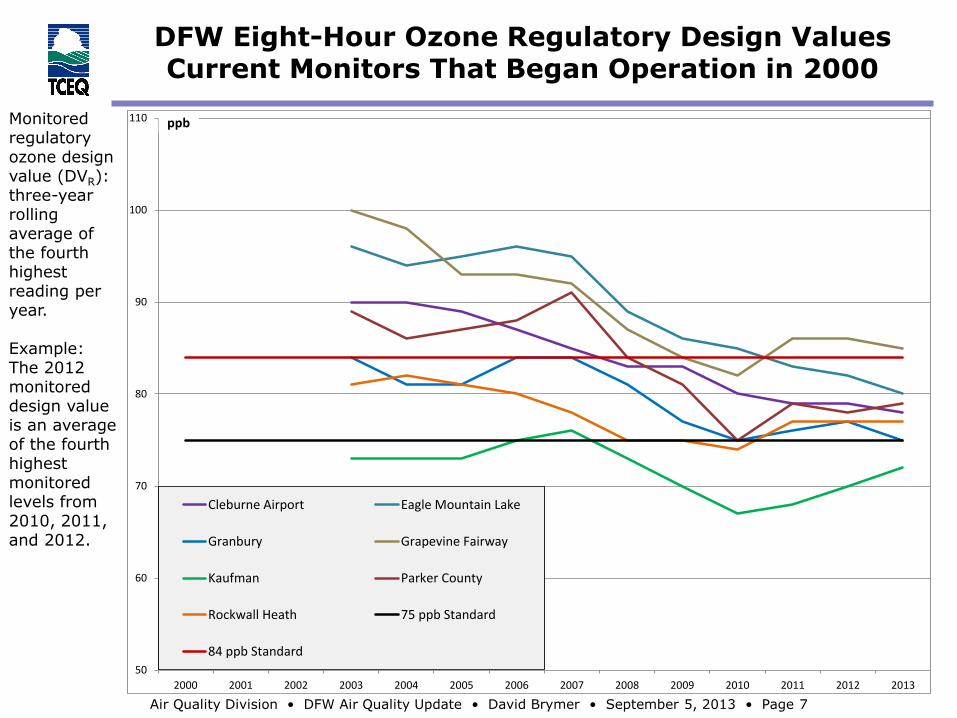
DFW Eight-Hour Ozone Regulatory Design Values Current Monitors That Began Operation in 2000
Monitored regulatory ozone design value (DVR): three-year rolling average of the fourth highest reading per year. Example: The 2012 monitored design value is an average of the fourth highest monitored levels from 2010, 2011, and 2012.
50
60
70
80
90
100
110
2000 2001 2002 2003 2004 2005 2006 2007 2008 2009 2010 2011 2012 2013
Cleburne Airport Eagle Mountain Lake
Granbury Grapevine Fairway
Kaufman Parker County
Rockwall Heath 75 ppb Standard
84 ppb Standard
ppb
Air Quality Division • DFW Air Quality Update • David Brymer • September 5, 2013 • Page 8
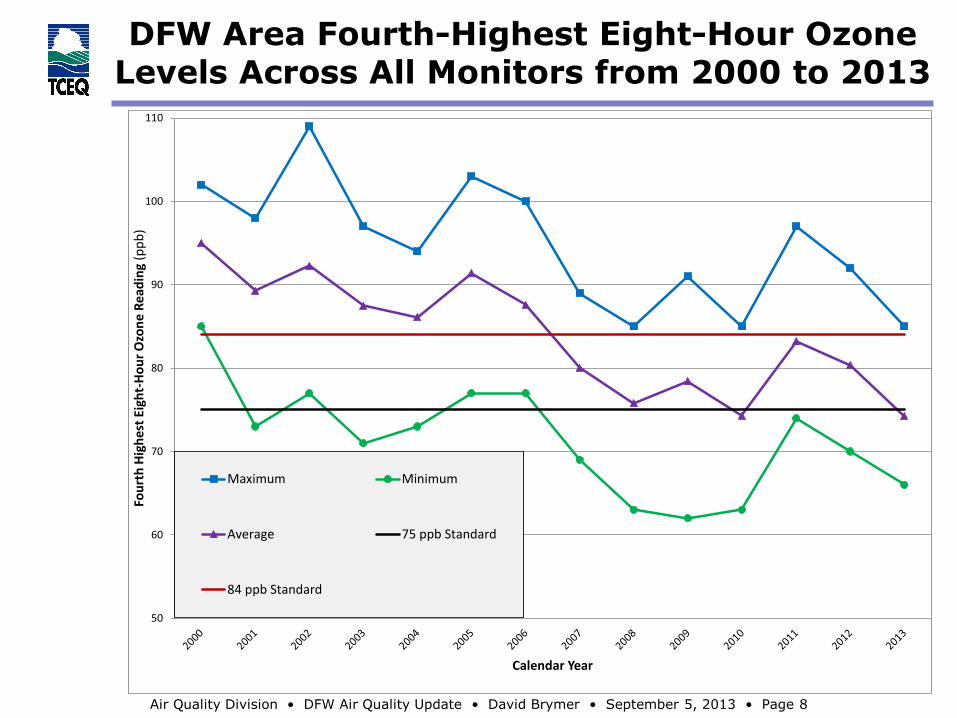
DFW Area Fourth-Highest Eight-Hour Ozone Levels Across All Monitors from 2000 to 2013
50
60
70
80
90
100
110
Fou
rth
Hig
hes
t Ei
ght-
Ho
ur
Ozo
ne
Rea
din
g(p
pb
)
Calendar Year
Maximum Minimum
Average 75 ppb Standard
84 ppb Standard

Air Quality Division • DFW Air Quality Update • David Brymer • September 5, 2013 • Page 9
DFW Area Eight-Hour Ozone Design Values Across All Monitors from 2000 to 2013
50
60
70
80
90
100
110
Eigh
t-H
ou
r O
zon
e D
esig
n V
alu
e(p
pb
)
Yearly Range for Eight-Hour Ozone Design Value
Maximum Minimum
Average 75 ppb Standard
84 ppb Standard
Air Quality Division • DFW Air Quality Update • David Brymer • September 5, 2013 • Page 10
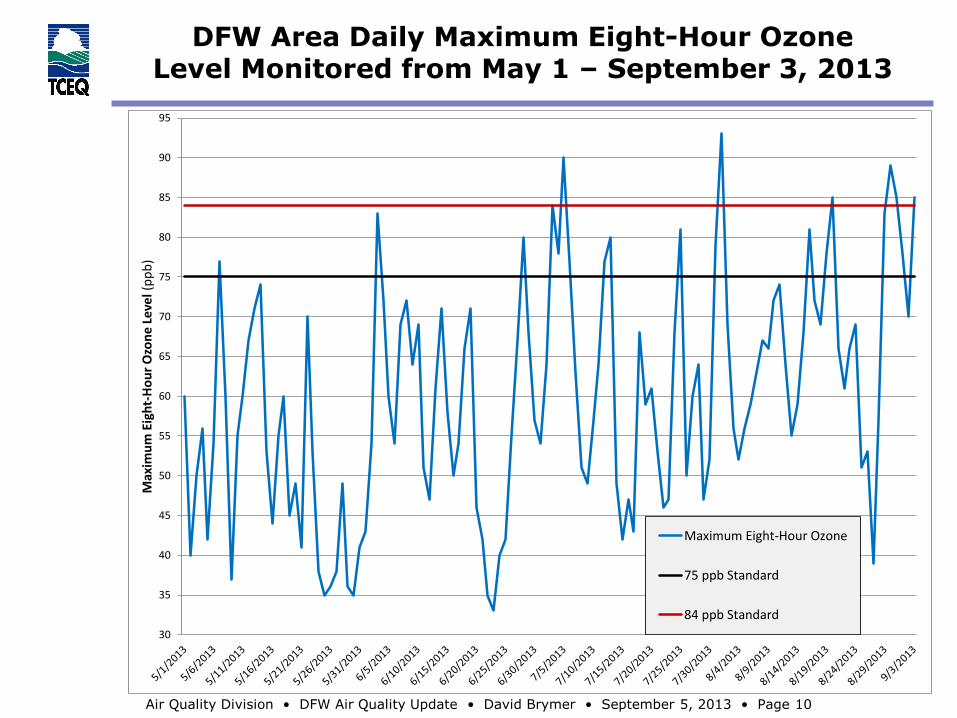
DFW Area Daily Maximum Eight-Hour Ozone Level Monitored from May 1 – September 3, 2013
30
35
40
45
50
55
60
65
70
75
80
85
90
95
Max
imu
m E
igh
t-H
ou
r O
zon
e Le
vel(
pp
b)
Maximum Eight-Hour Ozone
75 ppb Standard
84 ppb Standard
Air Quality Division • DFW Air Quality Update • David Brymer • September 5, 2013 • Page 11
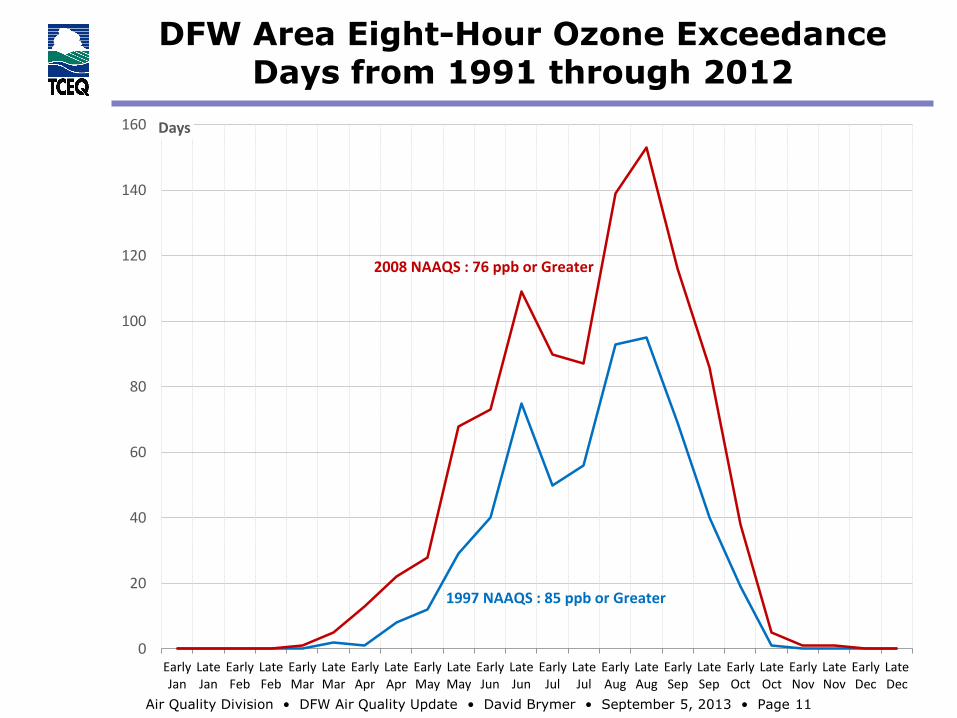
DFW Area Eight-Hour Ozone Exceedance Days from 1991 through 2012
0
20
40
60
80
100
120
140
160
EarlyJan
LateJan
EarlyFeb
LateFeb
EarlyMar
LateMar
EarlyApr
LateApr
EarlyMay
LateMay
EarlyJun
LateJun
EarlyJul
LateJul
EarlyAug
LateAug
EarlySep
LateSep
EarlyOct
LateOct
EarlyNov
LateNov
EarlyDec
LateDec
Days
2008 NAAQS : 76 ppb or Greater
1997 NAAQS : 85 ppb or Greater

Air Quality Division • DFW Air Quality Update • David Brymer • September 5, 2013 • Page 12
Number of DFW Area Monitors Exceeding Eight-Hour Ozone Standard from 2003-2012
1617 17
1617
13 13
11
14
16
11
1312 12
10
43
23 3
1718 18
17 1718
1718
1920
0
5
10
15
20
25
2003 2004 2005 2006 2007 2008 2009 2010 2011 2012
Monitors
Number of Monitors with aDesign Value > 75 ppb
Number of Monitors with aDesign Value > 84 ppb
Number of Monitors with aValid Design Value

Air Quality Division • DFW Air Quality Update • David Brymer • September 5, 2013 • Page 13
Questions?
David Brymer
512-239-1725