dairy waste management - home page | california state ... · dairy waste pond size estimation page...
TRANSCRIPT

Dairy Waste Pond Size Estimation
Page 1
Rev 12.07.2011 Dairy Waste Management System Evaluation Date: 17-Dec-12Time: 1:16 PM
Ocean View Dairy - Marvin L. Nunes Rev: 10-Mar-12Dairy ranch
3975 Mark West Station Road, Windsor CA 707.528.3545Address Green boxes are for data entry
All cells are unprotected1. Milk String Confinement Equivalent Days Estimation
Season Weeks milk Stall inside outside pastureper year barn barn feed bunk feed bunk
Winter 8.1 4 16 4 0 0 24 hrSpring 20 4 16 4 0 0 24 hrSummer 8 4 16 4 0 0 24 hrFall 16 4 16 4 0 0 24 hr
Total Weeks 52.1 365 daysEquiv Confined Days/year 61 243 61
Manured/unconfined Days/year 0Equiv Unconfined Days/year 0
2. Animal Waste Production GallonsAnimal No. of Weight Manure/Group Animals 1000 lb. un Confined Unconfined1000lb./day Confined UnconfinedMilk Cows high string 230 322.0 365 0 14.8 5.33 0.00 1400 lbs. low strings 100 140.0 365 0 14.8 2.32 0.00Dry Cows (1.5/12 of mi 40 56.0 30 335 10.0 0.05 0.57 1400 lbs.2yr->springer 80 96.0 0 365 7.0 0.00 0.75 large heifers 900-1500 lbs. pasturedMed. Heifers 80 56.0 0 365 4.8 0.00 0.30 pastured 500-900 lbs.Smal Heifers 80 30.4 365 0 1.7 0.06 0.00 pastured 250-500 lbs.Baby Calves 83 14.0 365 0 1.7 0.03 0.00 calf pen 100-250 lbs.On Site Totals 610 700 7.79 1.63
3. Total Animal Waste 9.41 Acre Feet
4. Additions to the Confinement Waste Management System:Units/Year Acre Feet
Notes: Animal Bedding 60.0 0.02 recycled from 3 20T loads/year sand Makeup sand tons4 20T loads/year straw Animal bedding 80.0 0.09 assumed, pe
Straw/organic tonsAssume 0.5% of 50lb ration/day, milk strings Damaged feed 15.1 0.02 40 lb/ft^3 den
at 40 lb/cu ft or silage tonsImported manure, whey, other External inputs 0 0.00
10 cy loadsDry lot scrapings plus 20 0.12
imports to compost pile 10 cy loadsSubtotal 0.26
Hours per Day
Annual Manure ProdAcre-feet
Equivalent Days

Dairy Waste Pond Size Estimation
Page 2
5. Wash and Process Water Produced Annually Rate Use Gal/Day Ac/ft Percent
Gal/min Hr/day per yr of TotalMilking System Wash Water 200 0.22 21.3Milking System Backflush @ .25 gal/unit 165 0.18 17.6Milk Tank Wash Water 60 0.07 6.4
Milk claw Wash Water Gal H2O/cow 0.25 165 0.18 17.6Milkings/day 2
Sprinkler Pen Water 0 0.00 0.0
Milking Parlor Wash Water 5 1.00 300 0.34 31.9Recycled wash water, per day 0 0.00 0 0.00 0.0Vacuum Pump Water 0 0 0 0.00 0.0Air Comp/Milk Cooler Water 0 0 0 0.00 0.0Leaking troughs, other losses 0 24 0 0.00 0.0Spring flows to manure storage 0 24 0 0.00 0.0Flush System Added Water Calf pen cleanup 50 0.06 5.3
days/year 365Total Wash and Process Water 940 1.05 100.0
Gal/day Acre FeetSection IV. Rain Water Additions to Waste System
Rainfall Data for Discretionary DesignLocal average 36.0 Local average per SCWA 5.4 25-year, 24-hr storm
annual rainfall, inches isohyetal map, rev June 83. Inches @ 3.8*(local avg/25.5) @ Petaluma.10-year Wet-Winter 53.6 10-year wet winter prorated based on 46-year Petaluma data with
Annual Rainfall, inches 38.0" 10-year wet winter relative to 25.5" avg annual rainfall (O'Connor, 2000).
Rainfall Runoff Entering Waste Management System
Runoff Average WetSurface areas from Areas tab Acres Coefficient Acre-feet Acre-feetManured Concrete 0.23 1.00 0.68 1.01Silage Pad Runoff 0.52 1.00 1.57 2.33Manure Storage, liquid 2.09 1.00 6.26 9.33Manured non-concrete 3.11 0.50 4.67 6.96Crop/pasture 2.03 0.40 2.44 3.64Total watershed area 7.46 15.62 23.27 10-year Winter
Storage Required3.34 25 year, 24-hour
Storage Required
Pump size required to handle 25 year, 24-hour storm: Pump Size OK?Hours pumped Days pumped Required Pump Pump period available?per day size, Gal/min (Y/N; caps only)
12 4 378 N

Dairy Waste Pond Size Estimation
Page 3
Section V. Total Annual Waste Flows Total System EvaluationEstimate Annual Waste Storage Requirement at Dairy Percent
Acre Feet of Total On-Site Animal Waste 7.79 24.1
Off-site additions to system 0.26 0.8 Bedding, feed, liquidsWash and Process Water 1.05 3.2
Manured-area Rainfall, 10-year wet winter 23.27 71.9
Subtotal - Annual wastewater volume 32.37 100.0 baseline
Storage Reduction Adjustments Reduction Adjusted Storage VolumeAcre-Feet Acre-Feet % of Total
Evaporation Feet 3.00 6.26 26.10 80.7Pond drained before use? Feet 0.0 0.00 26.10 80.7Solids Separation 12% reduction Y 0.93 25.17 77.8Mech. Manure Separation? (Y/N; caps only)Slurry Transport Gal/load 4000Daily drawdown of sump or pond Load/day 0 0.00 25.17 77.8independent of annual cleanout Day/yr 180Solids Transport Cu Yd/load 10 0 loads/yearCompost or solids removal Load/day 0 0.00 25.17 77.8independent of annual cleanout Day/yr 20Irrigation Disposal Gal/min 200 0 loads/yearDaily drawdown of sump or pond Hr/day 0.0 0.00 25.17 77.8independent of annual cleanout Day/year 30.0
Add 25-year, 24-hour storm runoff 3.34 10.3if insufficient pump capacity or cycle timeTotal Annual Waste Flows 28.51 88.1Requiring Storage Capacity
Section VI. Evaluate Capacity of Existing Storage System Waste Storage Capacity Acre FeetDesign storage capacity of waste ponds. 18.00
(from Areas worksheet)Design storage capacity of other facilities.
(add, if any)Total Storage Capacity 18.00
(Add cells 19,21)
Waste Storage Capacity Reductions 15.00(Incomplete annual pond cleanout, etc)Manure Handling and Storm Water Management CapabilityWorking Storage Capacity 3.00
(cell 3-cell 4)
Calculation indicates that: Total CapacityManure Production Exceeds Storage Capacity Required
Additional Capacity Required: 25.5 Acre-Feet 28.5 Acre-Feet

Dairy Waste Pond Size Estimation
Page 4
Dairy Pond Size Estimation - Data Summary SheetOcean View Dairy - Marvin L. Nunes 707.528.3545 17-Dec-123975 Mark West Station Road, Windsor CA 1:16 PM
Unconfined manure production 1.63 acre feetConfined manure production 7.79 acre feet 7.79 acre-feetTotal waste production 9.41 acre feetAdditions to the Confinement Waste Management SystemAnimal Bedding Makeup sand 0.02 acre feet
Straw/organic 0.09 acre feetExternal inputs 0.00 acre feet 0.26 acre-feetDamaged feed 0.02 acre feet
Milking System Wash Water 0.29 acre feetMilking System Backflush @ .25 gal/unit 0.18 acre feet
Milk claw Wash Water 0.18 acre feetSprinkler Pen Water 0.00 acre feet
Milking Parlor Wash Water 0.34 acre feet 940 gal/day 1.05 acre-feetRecycled wash water, per day 0.00 acre feet
Vac Pump/Air Comp/Cooler 0.00 acre feetLeaks/Springs 0.00 acre feet 9.09 af wastewate
Flush System Added Water 0.06 acre feet 28 % of totalRainfall Data for Discretionary Design Design rain Avg rain
Acres Coefficient runoff, ac-ft 53.6 36.0Manured Concrete 0.23 1.00 1.01Silage Pad Runoff 0.52 1.00 2.33Manure Storage, liquid 2.09 1.00 9.33Manured non-concrete 3.11 0.50 6.96Crop/pasture 2.03 0.40 3.64 ac ft ac ftTotal Runoff 7.46 na 23.27 23.27 15.62Subtotal - Annual wastewater volume Total: 32.37 24.71
Evaporation: -6.26 -6.26Solids separator: -0.93 -0.93Pond drawdown: 0.00 0.00Slurry Transport 4000 Gal/load 0 loads/yr 0.00 0.00Solids Transport 10 Cu Yd/load 0 loads/year 0.00 0.00
Irrigation Disposal 200 Gal/min 0 hr/yr 0.00 0.00Adjusted storage volume, acre-feet per year: -7.19 25.17 17.52
5.36 inches 25-year, 24-hr storm Inches @ 3.8*(local avg/25.5) @ Petaluma.Pump size required to handle 25 year, 24-hour storm: 3.34 2.24
12 hr/day4 day/yr 378 gal/min
Total Annual Waste Flows 28.51 19.75Requiring Storage CapacityWaste Storage Capacity
Design storage capacity of waste ponds. 18.00 acre-feetDesign storage capacity of other facilities. 0.00 acre-feetWaste Storage Capacity Reductions 15.00 acre-feetWorking Storage Capacity 3.00 acre-feet
Calculation indicates that: Total CapacityManure Production Exceeds Storage Capacity Required
Additional Capacity Required: 25.5 Acre-Feet 28.5 Acre-Feet

Runoff and Pond Areas Calculation WorksheetOcean View Dairy - Marvin L. Nunes Date: 17-Dec-123975 Mark West Station Road, Windsor CA Time: 1:16 PMMeasure areas and report in the space provided. Rev: 11-Mar-12
1. Concrete Manured Areas; 100% runoff coefficientIncludes feed lots, alley ways, holding corrals, sick pens, calf lots, compost piles,solids storage areas, outside loafing areas, and similar hardened or manured areaswith 100% runoff to manure storage
Area Width Length Sq Ft Location Notes Acresalley 20 492.5 9850 concrete alley between barns 0.23
0 0.000 0.000 0.000 0.000 0.00
9850 0.23 Used in Sec IV, Cell 4Square Feet Acres Cell 3 / 43560.
2. Roof Areas; 100% runoff coefficientIncludes feed lots, alley ways, holding corrals, sick pens, calf lots, compost piles,solids storage areas, outside loafing areas, and similar hardened or manured areaswith 100% runoff to manure storage
Area Width Length Sq Ft Location Notes Acres1 70 325 22750 silage pad, concreted 0.522 0 0.003 0 0.004 0 0.005 0.006 0 0.00
22750 0.52 Used in Sec IV, Cell 4Square Feet Acres Cell 3 / 43560.
3. Manure Pit and Liquid Storage Ponds: 100% catchmentIncludes wastewater ponds, manure pits, flush water recycle ponds, manure sumps, etc.
Pond/Pit Width Length Sq Ft Avg depth Capacity Location Notes Acres1 180 275.0 49500 8.8 10.00 Pond 1 1.142 150 276.0 41400 8.4 8.0 Pond 2 0.953 0 0.0 0.004 0 0.0 0.005 0 0.0 0.007 0 0.0 0.008 0 0.0 0.009 0 0.0 0.00
10 0 0.0 0.0090900 2.09 18.0 Used in Sec IV, Cell 3, Section VI Cell 1
Square Feet Acres Acre-feet
Notes: Width and length adjusted to provide surface area per GPS and CAD-based aerial measurementsAverage depth adjusted to provide spreadsheet-based capacity value based on surface area
Note: When measuring the waste storage capacity of ponds, include the capacity of pit(s) and other collection facilities. If more than one pond is used, measure all ponds. Allow for two feet of freeboard in the last pond when making measurements.

4. Non-Concrete Manured Areas Draining to StorageIncludes tributary areas of clean water around barns and corrals that drain to manure ponds.
Area Width Length Sq Ft Location Notes Acres1 53.3 180 9600 corral 1 0.222 110.6 180 19900 corral 2 0.463 59.4 180 10700 corral 3 0.254 55.3 180 9950 corral 4 0.235 128.4 180 23120 manure storage 1 0.536 254.0 200 50800 manure storage 2 1.177 70 164.3 11500 manure storage 3 0.268 0 0.009 0 0.00
10 0.00135570 3.11 Cell 3 / 43560
Square Feet Acres Used in Sec IV, Cell 4
5. Crop and Pasture Areas Draining to Manure Storage AreasIncludes tributary areas of clean water away from dairy that drain to manure ponds.
Area Width Length Sq Ft Location Notes Acres1 50 1062.8 53140 Pond tributary areas per CAD 1.222 100 355 35500 hillside west of barns 0.813 0 0.004 0 0.005 0 0.00
88640 2.03 Cell 3 / 43560Square Feet Acres Used in SecIV, Cell 9

Dairy Nutrient Budgeting Worksheet
Page 7
Nutrient Budgeting Worksheet 17-Dec-12 1:16 PM Rev: 10-Mar-12
Section I. Producer InformationOcean View Dairy - Marvin L. Nunes3975 Mark West Station Road, Windsor CA 707.528.3545
Land Areas On-Site Off-Site TotalAcres Acres Acres
Total Property 172 0 172
Housing, corrals 17 0 17barnRiparian, pond, swale, 25 25inaccessible All Crop Lands 55 55
Pasture Lands 75 0 75Irrigated or dry
Acres Acres Manure disposal AcresTotal Crop 130 0 130and Pasture
Section II: Pasture and Crop Nutrient Demand
Table 1. Plant Food Utilization by Various Crops Total uptake in harvested portion. Reference: Table 4.1, Western Fertilizer Handbook
Pounds per AcreCrop Yield N P2O5 K2O
Field Crops Corn - grain 5t/180bu 240 100 240 Note: These parameteCorn - silage 30t 250 105 250 values may be adjustedGrain sorghum 4t / 150bu 250 90 200 as desired to best matcOats 1.6t/100bu 115 40 145 existing site conditions.Wheat 3t/100bu 175 70 200Barley 2.5t / 100bu 160 60 160 Change numbers in this
Fruit and Nut Crops Apples 15t 120 55 215 table to adjust nutrient Grapes 15t 125 45 195 demands to reflect
Forage Crops Alfalfa 8t 480 95 480 soils, slope, aspect,Bromegrass 5t 220 65 315 rainfall, other parameteClover-grass 6t 300 90 360 affecting plant vigor andOrchardgrass 6t 300 100 375 nutrient demand.Sorghum-sudan 8t 325 125 475
This worksheet is intended to provide guidance for nutrient budgeting for management of manure produced by animals in both confined and unconfined conditions. It will partially fulfill facilities management plans as recommended by regulatory agencies. Complete the Producer and Area worksheets prior to entering nutrient bugeting information. Provide inputs as required in empty green-shaded boxes in the Nutrient Bugeting worksheet. Calculation results are shown in non-shaded boxes. Nutrient budgeting may include confined or unconfined animals, irrigated and non-irrigated land, fertilized or non-fertilized inputs, and may use lab or handbook data for stored manure nutrient values. Several runs of this computer spreadsheet worksheet will be needed to evaluate confined animal manures, unconfined animal manures, and individual fields, either on-site or off-site, because of the large number of possible nutrient input combinations. Take care when evaluating individual fields to include all inputs, and to eliminate duplicate accounting with such items as animals pastured elsewhere or fertilizer and irrigation water used elsewhere. Total ranch nutrient budgeting can be accomplished using total headcounts, acreages, etc., and will represent average conditions rather than site-specific conditions. Results are based on a large number of input assumptions, and represent general nutrient budgeting trends, rather than an exact detail accounting of site-specific conditions. Detailed assessments will require concentration sampling and quantity measurements of soil, forage, crops, irrigation water, stored manure, and other inputs and outputs to the nutrient input, waste management, and nutrient consumption systems.

Dairy Nutrient Budgeting Worksheet
Page 8
Timothy 4t 150 55 250Vetch 7t 390 105 320Coastal Dryland Pasture 200 80 175Irrigated Pasture 275 90 300
Section III: Nutrient Composition of Manure
Table 2. USDA-NRCS Ag Waste Handbook Table 3. Commercial Laboratory AnalysisNutrients, lb/day/1000lb of animal of your stored liquid manure
Nutrient milking dry heifer If available, enter data hereParameter Parameter Milligrams/liter Equivalent lb/gal
Nitrogen, N: 0.45 0.36 0.31 Nitrogen, N: 0.00000Phosphorous, P: 0.07 0.05 0.04 Phosphorous, P: 0.00000
Potassium, K: 0.26 0.23 0.24 Potassium, K: 0.00000Copper, Cu: 22 Copper, Cu: 0.00000
Section IV. Annual Production of Animal Waste for All Livestock
1. Handbook Method Animal counts from the companion Producer worksheet are multiplied by the appropriate table values for N, P, and K above to determine nutrient production.
Table 4. Unconfined Animal Nutrients Table 5. Confined Animal NutrientsProduction based on Handbook Values Production based on Handbook Values
Unconfined Total Pounds of Nutrients Confined Total Pounds of NutrientsCubic Feet N P K Cubic Feet N P K
Milk Cows 0 0 0 0 232236 52889 8227 30558 1400 lbs. 0 0 0 0 100972 22995 3577 13286Dry Cows (1.5 25047 6754 938 4315 2243 756 118 437 1400 lbs.2yr->springer 32748 10862 1402 8410 0 0 0 0 900-1500 lbs.Med. Heifers 13099 6336 818 4906 0 0 0 0 500-900 lbs.Smal Heifers 0 0 0 0 2518 4993 777 2885 250-500 lbs.Baby Calves 0 0 0 0 1162 2304 358 1331 100-250 lbs.On Site Totals 70893 23952 3157 17630 339131 83936 13057 48497
Nutrient concentration of manure depends on animal species and age, feed materials and additives, source of manure, storage method, length of storage, rainwater dilution, disposal method, and other factors. The most accurate nutrient budgeting estimates will be obtained if lab samples for nutrient concentration are taken from the storage area. A composite sample from several surface locations and depths within the storage is required for a representative value. The average table values shown from USDA-SCS Ag Waste Management Field Handbook are used for calculations if you do not provide site-specific nutrient concentrations.
Nutrient quantities stored in containment facilities are estimated in one of two ways: 1) USDA handbook N-P-K values are used with confined animal counts and manure production estimates obtained from the Producer worksheet. 2) If commercial lab analysis data for N-P-K is entered above, nutrient quantities are based on the lab concentration data times the pond storage volume obtained from the Producer worksheet. Note that total nutrient quantity estimates in storage facilities may be significantly different using the two different approaches. Lab data from the storage pond will tend to be most accurate. This is because factors affecting nutrient concentration are taken into account, including seasonal dilution, process and wash water, actual manure quantities collected, external inputs to storage, changes during storage, and similar factors. Wide variation between individual facilities can be expected.
Dairy Nutrient Budgeting Worksheet
Page 9
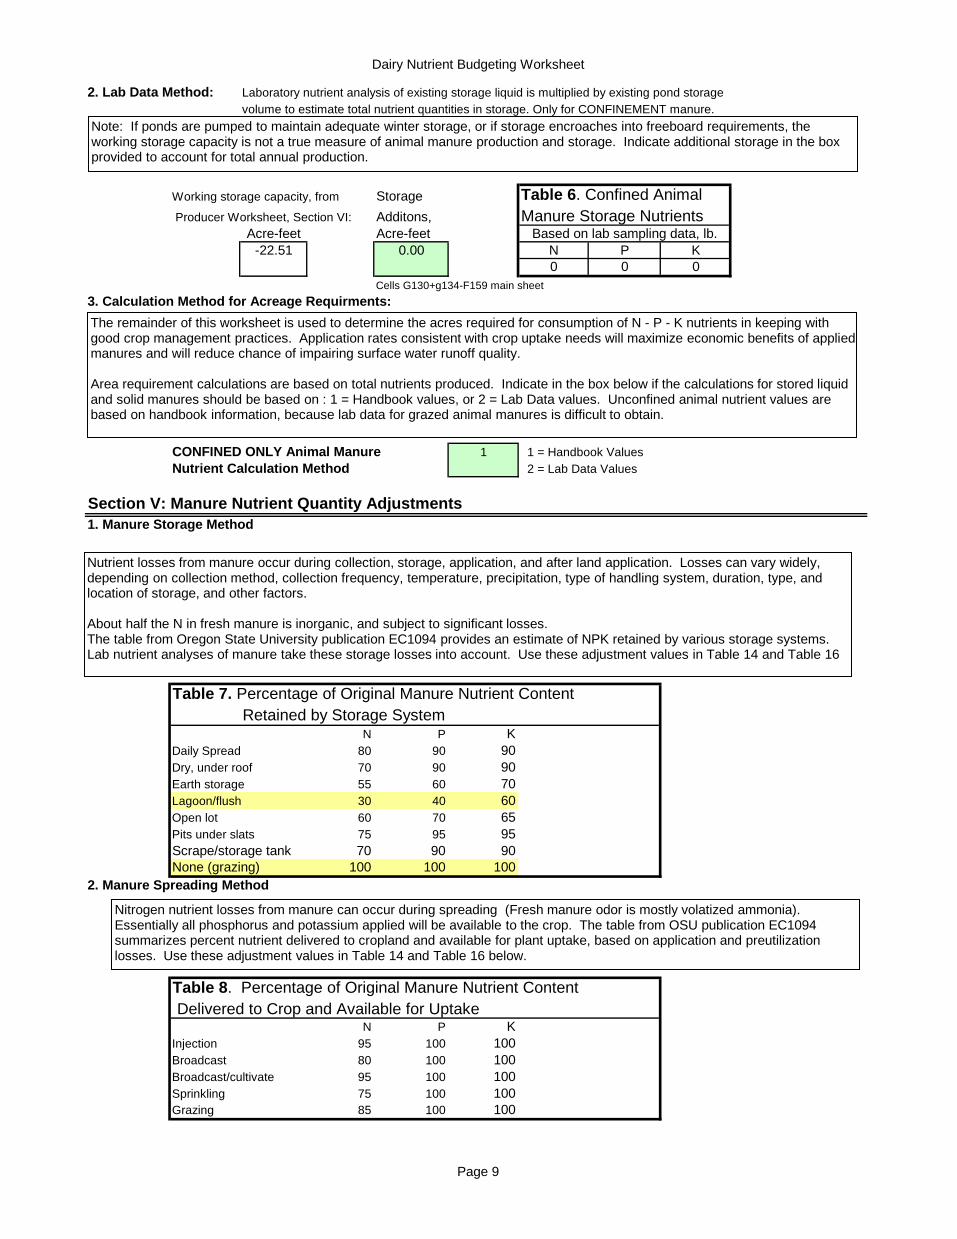
2. Lab Data Method: Laboratory nutrient analysis of existing storage liquid is multiplied by existing pond storagevolume to estimate total nutrient quantities in storage. Only for CONFINEMENT manure.
Working storage capacity, from Storage Table 6. Confined Animal Producer Worksheet, Section VI: Additons, Manure Storage Nutrients
Acre-feet Acre-feet Based on lab sampling data, lb.-22.51 0.00 N P K
0 0 0Cells G130+g134-F159 main sheet
3. Calculation Method for Acreage Requirments:
CONFINED ONLY Animal Manure 1 1 = Handbook ValuesNutrient Calculation Method 2 = Lab Data Values
Section V: Manure Nutrient Quantity Adjustments1. Manure Storage Method
Table 7. Percentage of Original Manure Nutrient Content Retained by Storage System
N P KDaily Spread 80 90 90Dry, under roof 70 90 90Earth storage 55 60 70Lagoon/flush 30 40 60Open lot 60 70 65Pits under slats 75 95 95Scrape/storage tank 70 90 90None (grazing) 100 100 100
2. Manure Spreading Method
Table 8. Percentage of Original Manure Nutrient Content Delivered to Crop and Available for Uptake
N P KInjection 95 100 100Broadcast 80 100 100Broadcast/cultivate 95 100 100Sprinkling 75 100 100Grazing 85 100 100
Nutrient losses from manure occur during collection, storage, application, and after land application. Losses can vary widely, depending on collection method, collection frequency, temperature, precipitation, type of handling system, duration, type, and location of storage, and other factors. About half the N in fresh manure is inorganic, and subject to significant losses. The table from Oregon State University publication EC1094 provides an estimate of NPK retained by various storage systems. Lab nutrient analyses of manure take these storage losses into account. Use these adjustment values in Table 14 and Table 16
Nitrogen nutrient losses from manure can occur during spreading (Fresh manure odor is mostly volatized ammonia). Essentially all phosphorus and potassium applied will be available to the crop. The table from OSU publication EC1094 summarizes percent nutrient delivered to cropland and available for plant uptake, based on application and preutilization losses. Use these adjustment values in Table 14 and Table 16 below.
The remainder of this worksheet is used to determine the acres required for consumption of N - P - K nutrients in keeping with good crop management practices. Application rates consistent with crop uptake needs will maximize economic benefits of applied manures and will reduce chance of impairing surface water runoff quality. Area requirement calculations are based on total nutrients produced. Indicate in the box below if the calculations for stored liquid and solid manures should be based on : 1 = Handbook values, or 2 = Lab Data values. Unconfined animal nutrient values are based on handbook information, because lab data for grazed animal manures is difficult to obtain.
Note: If ponds are pumped to maintain adequate winter storage, or if storage encroaches into freeboard requirements, the working storage capacity is not a true measure of animal manure production and storage. Indicate additional storage in the box provided to account for total annual production.

Dairy Nutrient Budgeting Worksheet
Page 10
Section VI: Additional Nutrient Inputs
1. Commercial Fertilizer
Table 9. Nutrient Value of Selected Commercial FertilizersWestern Fertilizer Handbook Available Water-Table 5-5 Total Phosphoric solubleFertilizer Formulation Nitrogen Acid Potash
N% P2O5% K2O%Ammonium nitrate 34Monoammonium phosphate 11 48Ammonium phosphate 1 13 39Ammonium phosphate 2 16 20Ammonium phosphate 3 27 12Diammonium phosphate 17 47Ammonium sulfate 21Anhydrous ammonia 82Aqua ammonia 20Sodium nitrate 16Urea 45Urea ammonium nitrate 32Single superphosphate 18Triple superphosphate 45Phosphoric acid 53Superphosphoric acid 80Potassium chloride 61Potassium nitrate 13 44Potassium sulfate 51Sulfate of potash-magnesia 22
Many ranchers provide supplemental fertilizer to pasture or silage crops, on an annual or other intermittent basis. These nutrients should be accounted for in a complete nutrient budget. Fertilizer may be applied in pastures where unconfined animals are grazed, in irrigated pastures, where manure is disposed, and in crop areas. This section estimates total nutrients available based on the fertilizer formulation used, the application rate, and the application frequency. Fertilizer composition data is from Western Fertlilzer Handbook, Table 5-5.
Indicate tons of fertilizer applied, area covered in acres, and how many years between applications for the commercial fertilizers noted. Formulations in Table 9 are used to estimate NPK application rates by fertilizer classification, using multipliers for elemental nutrients NPK. You will need to rerun the spreadsheet to determine effects on individual fields, if all fields are not treated the same. Entering two kinds of fertilizer on a single field will result in acreage duplication in the Table 10 summary and errors in the nutrient budget summary in Table 14. For simplicity, fertilizer nutrient values are included in both confined and unconfined animal manure disposal area evaluations, further down the spreadsheet. You will need to rerun the spreadsheet to individually evaluate confined and unconfined manure disposal areas, if both are not treated with equal amounts of commercial fertilizer.
Dairy Nutrient Budgeting Worksheet
Page 11
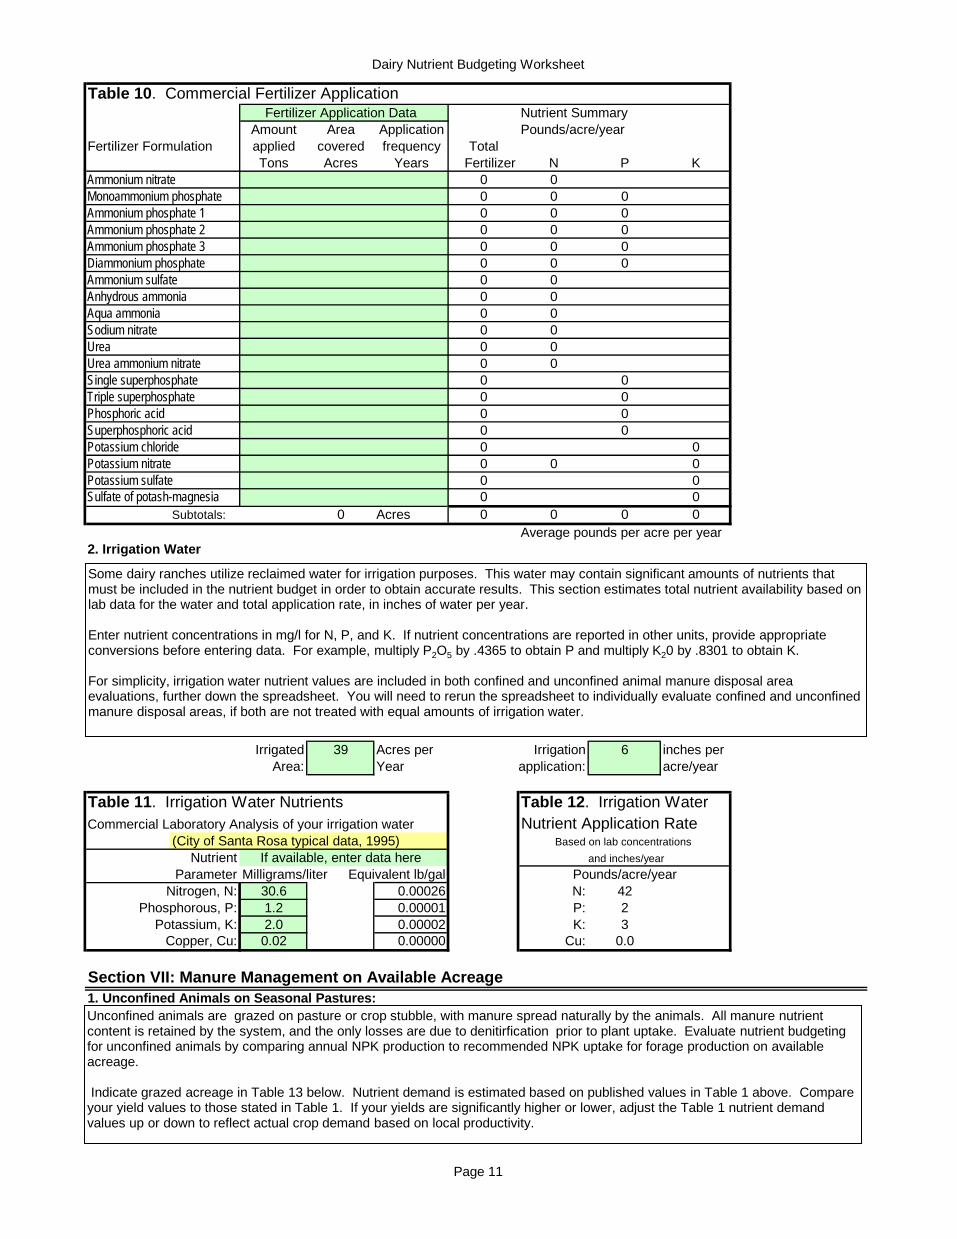
Table 10. Commercial Fertilizer ApplicationFertilizer Application Data Nutrient Summary
Amount Area Application Pounds/acre/yearFertilizer Formulation applied covered frequency Total
Tons Acres Years Fertilizer N P KAmmonium nitrate 0 0Monoammonium phosphate 0 0 0Ammonium phosphate 1 0 0 0Ammonium phosphate 2 0 0 0Ammonium phosphate 3 0 0 0Diammonium phosphate 0 0 0Ammonium sulfate 0 0Anhydrous ammonia 0 0Aqua ammonia 0 0Sodium nitrate 0 0Urea 0 0Urea ammonium nitrate 0 0Single superphosphate 0 0Triple superphosphate 0 0Phosphoric acid 0 0Superphosphoric acid 0 0Potassium chloride 0 0Potassium nitrate 0 0 0Potassium sulfate 0 0Sulfate of potash-magnesia 0 0
Subtotals: 0 Acres 0 0 0 0Average pounds per acre per year
2. Irrigation Water
Irrigated 39 Acres per Irrigation 6 inches perArea: Year application: acre/year
Table 11. Irrigation Water Nutrients Table 12. Irrigation WaterCommercial Laboratory Analysis of your irrigation water Nutrient Application Rate
(City of Santa Rosa typical data, 1995) Based on lab concentrations Nutrient If available, enter data here and inches/year
Parameter Milligrams/liter Equivalent lb/gal Pounds/acre/yearNitrogen, N: 30.6 0.00026 N: 42
Phosphorous, P: 1.2 0.00001 P: 2Potassium, K: 2.0 0.00002 K: 3
Copper, Cu: 0.02 0.00000 Cu: 0.0
Section VII: Manure Management on Available Acreage1. Unconfined Animals on Seasonal Pastures:Unconfined animals are grazed on pasture or crop stubble, with manure spread naturally by the animals. All manure nutrient content is retained by the system, and the only losses are due to denitirfication prior to plant uptake. Evaluate nutrient budgeting for unconfined animals by comparing annual NPK production to recommended NPK uptake for forage production on available acreage. Indicate grazed acreage in Table 13 below. Nutrient demand is estimated based on published values in Table 1 above. Compare your yield values to those stated in Table 1. If your yields are significantly higher or lower, adjust the Table 1 nutrient demand values up or down to reflect actual crop demand based on local productivity.
Some dairy ranches utilize reclaimed water for irrigation purposes. This water may contain significant amounts of nutrients that must be included in the nutrient budget in order to obtain accurate results. This section estimates total nutrient availability based on lab data for the water and total application rate, in inches of water per year. Enter nutrient concentrations in mg/l for N, P, and K. If nutrient concentrations are reported in other units, provide appropriate conversions before entering data. For example, multiply P2O5 by .4365 to obtain P and multiply K20 by .8301 to obtain K. For simplicity, irrigation water nutrient values are included in both confined and unconfined animal manure disposal area evaluations, further down the spreadsheet. You will need to rerun the spreadsheet to individually evaluate confined and unconfined manure disposal areas, if both are not treated with equal amounts of irrigation water.
Dairy Nutrient Budgeting Worksheet
Page 12
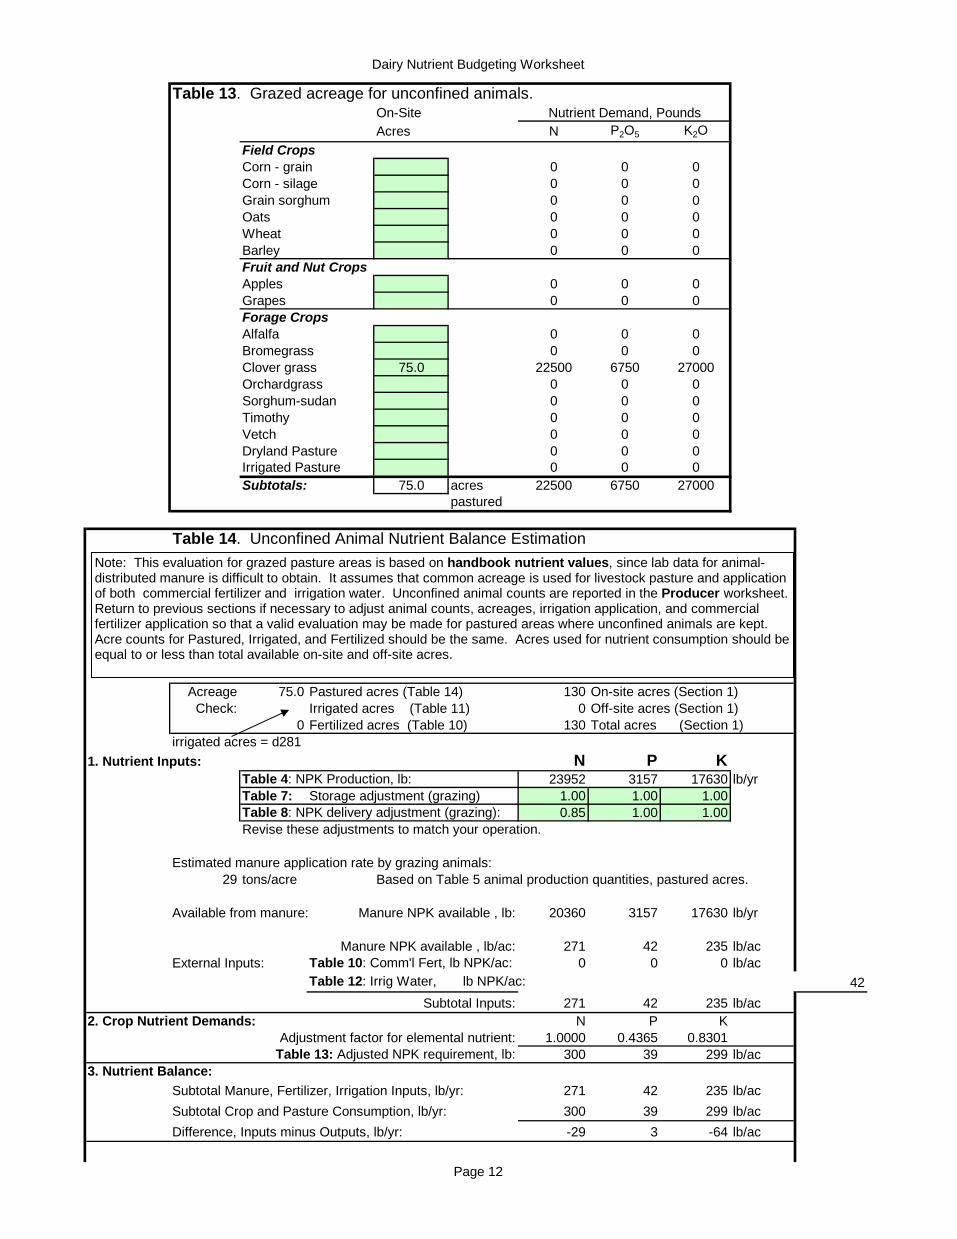
Table 13. Grazed acreage for unconfined animals.On-Site Nutrient Demand, PoundsAcres N P2O5 K2O
Field CropsCorn - grain 0 0 0Corn - silage 0 0 0Grain sorghum 0 0 0Oats 0 0 0Wheat 0 0 0Barley 0 0 0Fruit and Nut CropsApples 0 0 0Grapes 0 0 0Forage CropsAlfalfa 0 0 0Bromegrass 0 0 0Clover grass 75.0 22500 6750 27000Orchardgrass 0 0 0Sorghum-sudan 0 0 0Timothy 0 0 0Vetch 0 0 0Dryland Pasture 0 0 0Irrigated Pasture 0 0 0Subtotals: 75.0 acres 22500 6750 27000
pastured
Table 14. Unconfined Animal Nutrient Balance Estimation
Acreage 75.0 Pastured acres (Table 14) 130 On-site acres (Section 1)Check: Irrigated acres (Table 11) 0 Off-site acres (Section 1)
0 Fertilized acres (Table 10) 130 Total acres (Section 1)irrigated acres = d281
1. Nutrient Inputs: N P KTable 4: NPK Production, lb: 23952 3157 17630 lb/yrTable 7: Storage adjustment (grazing) 1.00 1.00 1.00Table 8: NPK delivery adjustment (grazing): 0.85 1.00 1.00Revise these adjustments to match your operation.
Estimated manure application rate by grazing animals:29 tons/acre Based on Table 5 animal production quantities, pastured acres.
Available from manure: Manure NPK available , lb: 20360 3157 17630 lb/yr
Manure NPK available , lb/ac: 271 42 235 lb/acExternal Inputs: Table 10: Comm'l Fert, lb NPK/ac: 0 0 0 lb/ac
Table 12: Irrig Water, lb NPK/ac: 42Subtotal Inputs: 271 42 235 lb/ac
2. Crop Nutrient Demands: N P KAdjustment factor for elemental nutrient: 1.0000 0.4365 0.8301
Table 13: Adjusted NPK requirement, lb: 300 39 299 lb/ac3. Nutrient Balance:
Subtotal Manure, Fertilizer, Irrigation Inputs, lb/yr: 271 42 235 lb/acSubtotal Crop and Pasture Consumption, lb/yr: 300 39 299 lb/acDifference, Inputs minus Outputs, lb/yr: -29 3 -64 lb/ac
Note: This evaluation for grazed pasture areas is based on handbook nutrient values, since lab data for animal-distributed manure is difficult to obtain. It assumes that common acreage is used for livestock pasture and application of both commercial fertilizer and irrigation water. Unconfined animal counts are reported in the Producer worksheet. Return to previous sections if necessary to adjust animal counts, acreages, irrigation application, and commercial fertilizer application so that a valid evaluation may be made for pastured areas where unconfined animals are kept. Acre counts for Pastured, Irrigated, and Fertilized should be the same. Acres used for nutrient consumption should be equal to or less than total available on-site and off-site acres.

Dairy Nutrient Budgeting Worksheet
Page 13
4. Nutrient Application Recommendations Analysis based on total pastured acres.cows on clover grass pasture
271 lb/ac N applied. Additional N permissible. 29 lb/ac additional N permissible.42 lb/ac P applied. Reduce P inputs or increase acres. 3 lb/ac excess P application.
235 lb/ac K applied. Additional K permissible. 64 lb/ac additional K permissible.
2. Confined Animal Manure Disposal on Remote Fields:
Table 15. Manure disposal acreage for confined animals.On-Site Nutrient Demand, PoundsAcres N P2O5 K2O
Field CropsCorn - grain 0 0 0Corn - silage 0 0 0Grain sorghum 0 0 0Oats 0 0 0Wheat 0 0 0Barley 0 0 0Fruit and Nut CropsApples 0 0 0Grapes 0 0 0Forage CropsAlfalfa 0 0 0Bromegrass 0 0 0Clover-grass 55.0 16500 4950 19800Orchardgrass 0 0 0Sorghum-sudan 0 0 0Timothy 0 0 0Vetch 0 0 0Dryland Pasture 0 0 0Irrigated Pasture 0 0 0Subtotals: 55.0 acres 16500 4950 19800
spread
Table 16. Confined Animal Nutrient Balance Estimation
Acreage 55.0 manure disposal acres (Table 15) 130 On-site acres (Section 1)Check: 39 irrigated acres (Table 11 0 Off-site acres (Section 1)
0 fertilized acres (Table 10 130 Total acres (Section 1)
Handbook values used for Liquid Manure nutrient estimation.
1. Nutrient Inputs: N P KTable 4: NPK Production, lb: 83936 13057 48497 lb/yrTable 7: Storage Adjustment (Earthen): 0.55 0.60 0.70Table 8: Delivery Adjustment (Broadcast): 0.80 1.00 1.00Revise these parameters to match your operation.(All storage adjustments = 1.00 for lab data approach)
Manure from confined animals is normally applied to pasture or crop stubble. The nutrient budget evaluation may be completed using either handbook values or lab analysis values. Manure nutrient quality may be adjusted for storage losses and application losses. Evaluate nutrient budgeting for seasonally-confined animals by comparing annual N-P-K production in storage to recommended N-P-K uptake for forage production on disposal acreage.
Note: This evaluation for pasture and crop areas assumes that common acreage is used for stored manure disposal and application of both commercial fertilizer and irrigation water. Confined animal counts are reported in the Producer worksheet. Return to previous sections if necessary to adjust animal counts, confinement season, acreages, irrgation amounts, and commercial fertilizer amounts so that a valid evaluation may be made for pasture or crop areas where confined animal manures are disposed. Acre counts for Pastured, Irrigated, and Fertilized areas should be the same. Acres used for nutrient consumption should be equal to or less than total available on-site and off-site acres.

Dairy Nutrient Budgeting Worksheet
Page 14
Required manure application rate for disposal:185 tons/acre Based on Table 5 animal production quantities, spread acres.
N P KAvailable from manure: Manure NPK available , lb: 36932 7834 33948 lb/yr
Manure NPK available , lb/ac: 671 142 617 lb/acExternal Inputs: Table 10: Comm'l Fert, lb NPK/ac: 0 0 0 lb/ac
Table 12: Irrig Water, lb NPK/ac 42 2 3 lb/acSubtotal Inputs: 713 144 620 lb/ac
2. Crop Nutrient Demands: N P KAdjustment factor for elemental nutrient: 1.0000 0.4365 0.8301
Table 15: Adjusted NPK requirement, lb: 300 39 299 lb/ac
3. Nutrient Balance:Subtotal Manure, Fertilizer, Irrigation Inputs, lb/yr: 713 144 620 lb/acSubtotal Crop and Pasture Consumption, lb/yr: 300 39 299 lb/acDifference, Inputs minus Outputs, lb/yr: 413 105 321 lb/ac
4. Nutrient Application Recommendations Analysis based on total manure disposal acres.
713 lb/ac N applied. Reduce N inputs or increase acres. 413 lb/ac excess N application.144 lb/ac P applied. Reduce P inputs or increase acres. 105 lb/ac excess P application.620 lb/ac K applied. Reduce K inputs or increase acres. 321 lb/ac excess application
Table 17. Fertilizer Economic Value
1. Benchmark economic values Enter current fertilizer costsAmmonium Sulfate (16-20-0), bulk grannular delivered to ranch: 700.00$ per tonPotassium Chloride (0-0-60), bulk grannular delivered to ranch: 600.00$ per ton
N P KEquivalent value, $/lb: 0.0560$ 0.0306$ 0.1494$ Unconfined animal manure $1,140 $96 $2,634 $3,871 unconfinedConfined animal manure $2,068 $239 $5,073 $7,380 confinedIrrigation water $91 $2 $16Applied Nutrient Values: $3,299 $338 $7,723 Total Values
Total Applied Nutrient Value: 11,360
Relative value of animal manure and irrigation water nutrients may be determined by comparison to commercially available bulk grannular fertilizer. Enter comparative retail costs for Ammonium sulfate (16-20-0)and for Potassium Chloride KCl (0-0-60) below for use as benchmark values. Handling and spreading costs vary for each producer and are not considered in the evaluation. Animal manures as fertlizer provide additional intangible benefits such as micronutrients, microbial populations, and organic matter for soil building.
This Nutrient Budgeting worksheet was developed to assist dairy ranch operators in evaluating waste management facilities and non-point source nutrient loading on their property, in order to better manage manures and protect fresh water resources. Developing and implementing a waste management plan based on appropriate management strategies will aid in preventing code violation through discharge of nutrient-laden materials into the waters of the region. The plan is the effort of the Gold Ridge Resource Conservation District, in cooperation with the University of California Cooperative Extension, Sonoma Marin Animal Waste Committee, North Coast Regional Water Quality Control Board, Natural Resource Conservation Service, and Western United Dairymen. The plan is a self-monitoring aid and may be used by anyone. The document may be copied and used freely. No warranty is expressed or implied and the authors are not responsible for facilities construction or operation or management decisions made on the basis of program outputs. Credit to the authors will be appreciated. L.R. Erickson Ph.D. Gold Ridge

Stage-Capacity Data File: c:xl2k\project\Ocean View Pond 1Erickson Engineering Inc. Property: Nunes DairyData from CAD Project: Pond Volume Estimate
Location: Mark West Station RoadDate: 17-Dec-12 01:16 PM
Revised: 10-Mar-12Water Avg Volume Cumulative Water H2O Area, Water
Elevation Sq Ft SF Cu Ft Cu Ft Acre-Feet Acres x 10Gal x 10^6112 11.57 11.38110 0 503870 11.57 11.38 3.774108 0 0 503870 11.57 11.38 3.774106 0 0 503870 11.57 11.38 3.774104 0 0 503870 11.57 11.38 3.774102 0 503870 11.57 11.38 3.774100 49590 47500 95000 503870 11.57 11.38 3.77498 45410 43400 86800 408870 9.39 10.42 3.06296 41390 39460 78920 322070 7.39 9.50 2.41294 37530 35675 71350 243150 5.58 8.62 1.82192 33820 32050 64100 171800 3.94 7.76 1.28790 30280 28583 57165 107700 2.47 6.95 0.80788 26885 25268 50535 50535 1.16 6.17 0.37986 23650 0 0 0.00 5.43 0.00084 0 0 0.00 0.00 0.00082 0 0 0 0.00 0.00 0.00080 0 0 0 0.00 0.00 0.00078 0 0 0 0.00 0.00 0.00076 0 0 0 0.00 0.00 0.00074 0 0 0 0.00 0.00 0.00072 0 0 0 0.00 0.00 0.00070 0 0 0 0.00 0.00 0.00068 0 0 0 0.00 0.00 0.00066 0 0 0 0.00 0.00 0.00064 0 0 0 0.00 0.00 0.00062 0 0 0 0.00 0.00 0.000
0 0 0 0.00 0.00 0.0000 0 0 0.00 0.00 0.000
288555 251935
Cut Avg Volume Cumulative Tot Excav Cum CutsElevation SF SF Cu Ft Cu Ft Acre-FeetCu Yd/1000
112 0 0 0.0 0.000110 0 0 0 0.0 0.000108 0 0 0 0.0 0.000106 0 0 0 0.0 0.000104 0 0 0 0.0 0.000102 0 0 0 0.0 0.000100 0 0 0 0.0 0.00098 0 0 0 0.0 0.00096 0 0 0 0.0 0.00092 0 0 0 0.0 0.00088 0 0 0 0.0 0.00086 0 0 0 0.0 0.00084 0 0 0 0.0 0.00082 0 0 0 0.0 0.00080 0 0 0 0.0 0.000

78 0 0 0 0.0 0.00076 0 0 0 0.0 0.00074 0 0 0 0.0 0.00072 0 0 0 0.0 0.00070 0 0 0 0.0 0.00068 0 0 0 0.0 0.00066 0 0 0 0.0 0.00064 0 0 0 0.0 0.00062 0 0 0 0.0 0.0000 0 0 0 0.0 0.0000 0 0 0 0.0 0.0000
Fill Avg Volume Cumulative Fill Cum FillElevation Cu Ft Cu Ft Cu Ft Cu Ft Acre-FeetCu Yd/1000
112 0 0 0.0 0.000110 0 0 0.0 0.000108 0 0 0 0.0 0.000106 0 0 0 0.0 0.000104 0 0 0 0.0 0.000102 0 0 0 0.0 0.000100 0 0 0 0.0 0.00098 0 0 0 0.0 0.00096 0 0 0 0.0 0.00092 0 0 0 0.0 0.00088 0 0 0 0.0 0.00086 0 0 0 0.0 0.00084 0 0 0 0.0 0.00082 0 0 0 0.0 0.00080 0 0 0 0.0 0.00078 0 0 0 0.0 0.00076 0 0 0 0.0 0.00074 0 0 0 0.0 0.00072 0 0 0 0.0 0.00070 0 0 0 0.0 0.00068 0 0 0 0.0 0.00066 0 0 0 0.0 0.00064 0 0 0 0.0 0.00062 0 0 0 0.0 0.0000 0 0 0.0 0.0000 0 0 0 0.0 0.0000 0 0 0 0.0 0.000
0 0 0 cut/fill ratio: #DIV/0!

11.6 11.6
9.4
7.4
5.6
3.9
2.5
1.2
0.0
11.4
11.4
10.4
9.5
8.6
7.8
7.0
6.2
5.4
0
2
4
6
8
10
12
14
16
86 88 90 92 94 96 98 100 102
Acre
-Fee
t; Ac
res
x10
Relative Elevation, feet
Ocean View Dairy Pond 1 Estimated Capacity
2.5:1 slopes, 14' depth, surface area per GE aerial photo
Design Capacity 9.4 ac-ft @ 98'
Top of Dam @ 100.0'
Principal Spillway @ 98'
Surface Area, Ac x 10

Stage-Capacity Data File: c:xl2k\project\Ocean View Pond 1Erickson Engineering Inc. Property: Nunes DairyData from CAD Project: Pond Volume Estimate
Location: Mark West Station RoadDate: 17-Dec-12 01:16 PM
Revised: 10-Mar-12Water Avg Volume Cumulative Water H2O Area, Water
Elevation Sq Ft SF Cu Ft Cu Ft Acre-Feet Acres x 10Gal x 10^6112 9.35 9.52110 0 407100 9.35 9.52 3.049108 0 0 407100 9.35 9.52 3.049106 0 0 407100 9.35 9.52 3.049104 0 0 407100 9.35 9.52 3.049102 0 407100 9.35 9.52 3.049100 41470 39555 79110 407100 9.35 9.52 3.04998 37640 35800 71600 327990 7.53 8.64 2.45796 33960 32200 64400 256390 5.89 7.80 1.92094 30440 28760 57520 191990 4.41 6.99 1.43892 27080 25480 50960 134470 3.09 6.22 1.00790 23880 22360 44720 83510 1.92 5.48 0.62588 20840 19395 38790 38790 0.89 4.78 0.29186 17950 0 0 0.00 4.12 0.00084 0 0 0.00 0.00 0.00082 0 0 0 0.00 0.00 0.00080 0 0 0 0.00 0.00 0.00078 0 0 0 0.00 0.00 0.00076 0 0 0 0.00 0.00 0.00074 0 0 0 0.00 0.00 0.00072 0 0 0 0.00 0.00 0.00070 0 0 0 0.00 0.00 0.00068 0 0 0 0.00 0.00 0.00066 0 0 0 0.00 0.00 0.00064 0 0 0 0.00 0.00 0.00062 0 0 0 0.00 0.00 0.000
0 0 0 0.00 0.00 0.0000 0 0 0.00 0.00 0.000
233260 203550
Cut Avg Volume Cumulative Tot Excav Cum CutsElevation SF SF Cu Ft Cu Ft Acre-FeetCu Yd/1000
112 0 0 0.0 0.000110 0 0 0 0.0 0.000108 0 0 0 0.0 0.000106 0 0 0 0.0 0.000104 0 0 0 0.0 0.000102 0 0 0 0.0 0.000100 0 0 0 0.0 0.00098 0 0 0 0.0 0.00096 0 0 0 0.0 0.00092 0 0 0 0.0 0.00088 0 0 0 0.0 0.00086 0 0 0 0.0 0.00084 0 0 0 0.0 0.00082 0 0 0 0.0 0.00080 0 0 0 0.0 0.000
78 0 0 0 0.0 0.00076 0 0 0 0.0 0.00074 0 0 0 0.0 0.00072 0 0 0 0.0 0.00070 0 0 0 0.0 0.00068 0 0 0 0.0 0.00066 0 0 0 0.0 0.00064 0 0 0 0.0 0.00062 0 0 0 0.0 0.0000 0 0 0 0.0 0.0000 0 0 0 0.0 0.0000
Fill Avg Volume Cumulative Fill Cum FillElevation Cu Ft Cu Ft Cu Ft Cu Ft Acre-FeetCu Yd/1000
112 0 0 0.0 0.000110 0 0 0.0 0.000108 0 0 0 0.0 0.000106 0 0 0 0.0 0.000104 0 0 0 0.0 0.000102 0 0 0 0.0 0.000100 0 0 0 0.0 0.00098 0 0 0 0.0 0.00096 0 0 0 0.0 0.00092 0 0 0 0.0 0.00088 0 0 0 0.0 0.00086 0 0 0 0.0 0.00084 0 0 0 0.0 0.00082 0 0 0 0.0 0.00080 0 0 0 0.0 0.00078 0 0 0 0.0 0.00076 0 0 0 0.0 0.00074 0 0 0 0.0 0.00072 0 0 0 0.0 0.00070 0 0 0 0.0 0.00068 0 0 0 0.0 0.00066 0 0 0 0.0 0.00064 0 0 0 0.0 0.00062 0 0 0 0.0 0.0000 0 0 0.0 0.0000 0 0 0 0.0 0.0000 0 0 0 0.0 0.000
0 0 0 cut/fill ratio: #DIV/0!

9.3 9.3
7.5
5.9
4.4
3.1
1.9
0.9
0.0
9.5
9.5
8.6
7.8
7.0
6.2
5.5
4.8
4.1
0
2
4
6
8
10
12
14
16
86 88 90 92 94 96 98 100 102
Acre
-Fee
t; Ac
res
x10
Relative Elevation, feet
Ocean View Dairy Pond 2 Estimated Capacity
2.5:1 slopes, 14' depth, surface area per GE aerial photo
Design Capacity 7.5 ac-ft @ 98'
Top of Dam @ 100.0'
Principal Spillway @ 98'
Surface Area, Ac x 10

Stage-Capacity Data File: c:xl2k\project\Ocean View Stored 1Erickson Engineering Inc. Property: Nunes DairyData from CAD Project: Storage Volume Estimate
Location: Mark West Station RoadDate: 17-Dec-12 01:16 PM
Revised: 10-Mar-12Stored Avg Volume Cumulative Manure Area,
Elevation Sq Ft SF Cu Ft Cu Ft Acre-Feet Acres x 10112 1.54 0.00110 0 67249 1.54 0.00108 0 0 67249 1.54 0.00106 0 0 67249 1.54 0.00104 0 0 67249 1.54 0.00102 0 67249 1.54 0.00100 0 0 67249 1.54 0.0098 0 67249 1.54 0.0096 775 996 1991 67249 1.54 0.1894 1216 1483 2966 65258 1.50 0.2892 1750 2276 4552 62292 1.43 0.4090 2802 3380 6760 57740 1.33 0.6488 3958 4610 9219 50980 1.17 0.9186 5261 5976 11951 41761 0.96 1.2184 6690 14905 29810 29810 0.68 1.5482 23120 0 0 0.00 5.3180 0 0 0 0.00 0.0078 0 0 0 0.00 0.0076 0 0 0 0.00 0.0074 0 0 0 0.00 0.0072 0 0 0 0.00 0.0070 0 0 0 0.00 0.0068 0 0 0 0.00 0.0066 0 0 0 0.00 0.0064 0 0 0 0.00 0.0062 0 0 0 0.00 0.00
0 0 0 0.00 0.000 0 0 0.00 0.00
45572 33625
Cut Avg Volume Cumulative Tot Excav Cum CutsElevation SF SF Cu Ft Cu Ft Acre-FeetCu Yd/1000
112 0 0 0.0 0.000110 0 0 0 0.0 0.000108 0 0 0 0.0 0.000106 0 0 0 0.0 0.000104 0 0 0 0.0 0.000102 0 0 0 0.0 0.000100 0 0 0 0.0 0.00098 0 0 0 0.0 0.00096 0 0 0 0.0 0.00092 0 0 0 0.0 0.00088 0 0 0 0.0 0.00086 0 0 0 0.0 0.00084 0 0 0 0.0 0.00082 0 0 0 0.0 0.00080 0 0 0 0.0 0.000

78 0 0 0 0.0 0.00076 0 0 0 0.0 0.00074 0 0 0 0.0 0.00072 0 0 0 0.0 0.00070 0 0 0 0.0 0.00068 0 0 0 0.0 0.00066 0 0 0 0.0 0.00064 0 0 0 0.0 0.00062 0 0 0 0.0 0.0000 0 0 0 0.0 0.0000 0 0 0 0.0 0.0000
Fill Avg Volume Cumulative Fill Cum FillElevation Cu Ft Cu Ft Cu Ft Cu Ft Acre-FeetCu Yd/1000
112 0 0 0.0 0.000110 0 0 0.0 0.000108 0 0 0 0.0 0.000106 0 0 0 0.0 0.000104 0 0 0 0.0 0.000102 0 0 0 0.0 0.000100 0 0 0 0.0 0.00098 0 0 0 0.0 0.00096 0 0 0 0.0 0.00092 0 0 0 0.0 0.00088 0 0 0 0.0 0.00086 0 0 0 0.0 0.00084 0 0 0 0.0 0.00082 0 0 0 0.0 0.00080 0 0 0 0.0 0.00078 0 0 0 0.0 0.00076 0 0 0 0.0 0.00074 0 0 0 0.0 0.00072 0 0 0 0.0 0.00070 0 0 0 0.0 0.00068 0 0 0 0.0 0.00066 0 0 0 0.0 0.00064 0 0 0 0.0 0.00062 0 0 0 0.0 0.0000 0 0 0.0 0.0000 0 0 0 0.0 0.0000 0 0 0 0.0 0.000
0 0 0 cut/fill ratio: #DIV/0!
1.5 1.5 1.5 1.5 1.5
1.4
1.3
1.2
1.0
0.7
0.0 0.0
0.0
0.0
0.0
0.2
0.3
0.4
0.6
0.9
1.2
1.5
0.0
0
1
2
80 82 84 86 88 90 92 94 96 98 100 102
Acre
-Fee
t; Ac
res
x10
Relative Elevation, feet
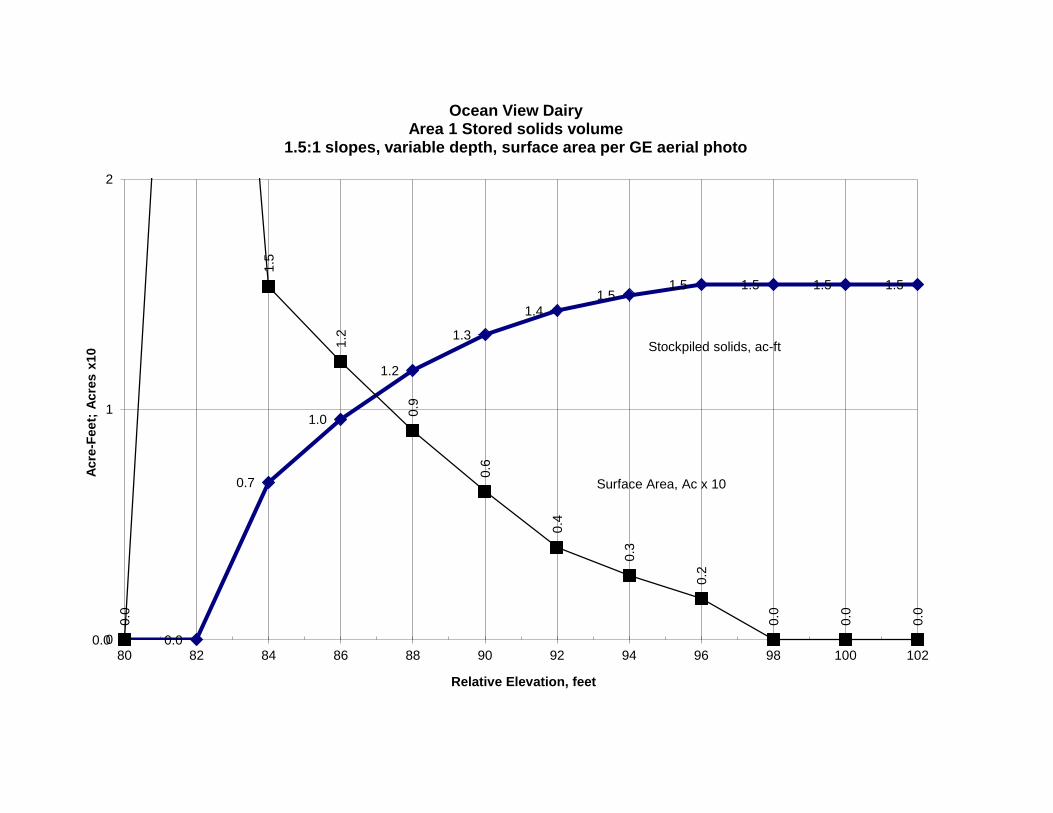
Ocean View Dairy Area 1 Stored solids volume
1.5:1 slopes, variable depth, surface area per GE aerial photo
Stockpiled solids, ac-ft
Surface Area, Ac x 10

Stage-Capacity Data File: c:xl2k\project\Ocean View Stored 2Erickson Engineering Inc. Property: Nunes DairyData from CAD Project: Storage volume estimate
Location: Mark West Station RoadDate: 17-Dec-12 01:16 PM
Revised: 10-Mar-12Stored Avg Volume Cumulative Manure Area,
Elevation Sq Ft SF Cu Ft Cu Ft Acre-Feet Acres x 10112 6.43 0.98110 0 280142 6.43 0.98108 0 0 280142 6.43 0.98106 0 0 280142 6.43 0.98104 0 0 280142 6.43 0.98102 0 280142 6.43 0.98100 4266 4792 9584 280142 6.43 0.9898 5318 5898 11796 270558 6.21 1.2296 6478 7270 14539 258762 5.94 1.4994 8061 9406 18811 244223 5.61 1.8592 10750 12475 24950 225412 5.17 2.4790 14200 16202 32404 200462 4.60 3.2688 18204 20368 40735 168058 3.86 4.1886 22531 24764 49527 127323 2.92 5.1784 26996 38898 77796 77796 1.79 6.2082 50800 0 0 0.00 11.6680 0 0 0 0.00 0.0078 0 0 0 0.00 0.0076 0 0 0 0.00 0.0074 0 0 0 0.00 0.0072 0 0 0 0.00 0.0070 0 0 0 0.00 0.0068 0 0 0 0.00 0.0066 0 0 0 0.00 0.0064 0 0 0 0.00 0.0062 0 0 0 0.00 0.00
0 0 0 0.00 0.000 0 0 0.00 0.00
167604 140071
Cut Avg Volume Cumulative Tot Excav Cum CutsElevation SF SF Cu Ft Cu Ft Acre-FeetCu Yd/1000
112 0 0 0.0 0.000110 0 0 0 0.0 0.000108 0 0 0 0.0 0.000106 0 0 0 0.0 0.000104 0 0 0 0.0 0.000102 0 0 0 0.0 0.000100 0 0 0 0.0 0.00098 0 0 0 0.0 0.00096 0 0 0 0.0 0.00092 0 0 0 0.0 0.00088 0 0 0 0.0 0.00086 0 0 0 0.0 0.00084 0 0 0 0.0 0.00082 0 0 0 0.0 0.00080 0 0 0 0.0 0.000

78 0 0 0 0.0 0.00076 0 0 0 0.0 0.00074 0 0 0 0.0 0.00072 0 0 0 0.0 0.00070 0 0 0 0.0 0.00068 0 0 0 0.0 0.00066 0 0 0 0.0 0.00064 0 0 0 0.0 0.00062 0 0 0 0.0 0.0000 0 0 0 0.0 0.0000 0 0 0 0.0 0.0000
Fill Avg Volume Cumulative Fill Cum FillElevation Cu Ft Cu Ft Cu Ft Cu Ft Acre-FeetCu Yd/1000
112 0 0 0.0 0.000110 0 0 0.0 0.000108 0 0 0 0.0 0.000106 0 0 0 0.0 0.000104 0 0 0 0.0 0.000102 0 0 0 0.0 0.000100 0 0 0 0.0 0.00098 0 0 0 0.0 0.00096 0 0 0 0.0 0.00092 0 0 0 0.0 0.00088 0 0 0 0.0 0.00086 0 0 0 0.0 0.00084 0 0 0 0.0 0.00082 0 0 0 0.0 0.00080 0 0 0 0.0 0.00078 0 0 0 0.0 0.00076 0 0 0 0.0 0.00074 0 0 0 0.0 0.00072 0 0 0 0.0 0.00070 0 0 0 0.0 0.00068 0 0 0 0.0 0.00066 0 0 0 0.0 0.00064 0 0 0 0.0 0.00062 0 0 0 0.0 0.0000 0 0 0.0 0.0000 0 0 0 0.0 0.0000 0 0 0 0.0 0.000
0 0 0 cut/fill ratio: #DIV/0!

6.4 6.4 6.2
5.9 5.6
5.2
4.6
3.9
2.9
1.8
0.0 0.0
1.0
1.0 1.
2 1.5
1.9
2.5
3.3
4.2
5.2
6.2
0.0
0
2
4
6
8
80 82 84 86 88 90 92 94 96 98 100 102
Acre
-Fee
t; Ac
res
x10
Relative Elevation, feet
Ocean View Dairy Area 2 Stored solids volume
1.5:1 slopes, variable depth, surface area per GE aerial photo
Stockpiled solids, ac-ft
Surface Area, Ac x 10

Manure Stockpile Volumentric EstimationOcean View Dairy - Marvin L. Nunes Date: 17-Dec-123975 Mark West Station Road, Windsor CA Time: 1:16 PM
Rev: 11-Mar-12Area matches CAD
Visual estimate Contour methodWidth Length Sq Ft Avg depth ft^3 Location Notes Acres ft^3 Location Notes100.0 143 14300 3.0 42900 manure storage 0 0.33 41540 manure storage 0128.4 180 23120 3.0 69360 manure storage 1 0.53 67250 manure storage 1254.0 200 50800 6.0 304800 manure storage 2 1.17 280140 manure storage 2
10 158 1580 2.0 3160 manure storage 3 0.04 3160 manure storage 370 164.3 11500 2.0 23000 manure storage 4 0.26 23000 manure storage 4
100 108 10800 4.0 43200 manure storage 5 0.25 43200 manure storage 5Totals 112100 486420 458290
52 lb/ft^3 18016 cy 52 lb/ft^3 1697412647 tons Use these for planning purposes 11916 tons
Pacific Northwest Extension Service http://cru.cahe.wsu.edu/cepublications/pnw0533/pnw0533.pdf
NPK range of values in storage lb per ton as-is3
Type N P K Solids lb/ton lb lb/ton lb lb/ton lb percent lb/cy lb/ft^3
Dry stack dairy 9 113822 1.8 22764 1.6 20235 35 1400 51.9Separated dairy solids 5 49684 0.9 8943 2.4 23848 19 1100 40.7
Range, tons 57 11 1025 4 12
Area and volume matches CADWidth Length Sq Ft Avg depth ft^3 Location Notes Acres
180 275.0 49500 8.8 435600 Pond 1 1.14150 276.0 41400 8.4 348480 Pond 2 0.9520 60.0 1200 5.0 6000 Pond 3 0.03
Totals 92100 79008062.4 lb/ft^3 18.1 acre feet
24650 tons 217.7 acre inches
Liquid storage, total nutrient values
Table 2 Average nutrient levels in dairy waste Table 5 Typical nutrient losses during handling and storageWaste type
Total N Organic Ammonium
P2O5 K2O System N lost % P lost % K lost %
Lagoon lb/ac-in
69 23 46 79 144 Lagoon, 365 day storage
90 50 to 805 30 to 805
lb N lb P2O5 lb K2O1502 12036 21939