dairy farm business summary, hudson and central ny...
TRANSCRIPT

AUGUST 2011 E.B. 2011-05
HUDSON AND CENTRALNEW YORK REGION
2010
Wayne A. KnoblauchGeorge J. Conneman
Linda D. PutnamJason KarszesSandy Buxton
Mariane KiralyKirk Shoen
Patricia WestenbroekJoe Walsh
Richard OvertonCathryn Dymond
Charles H. Dyson School of Applied Economics and ManagementCollege of Agriculture and Life Sciences
Cornell University, Ithaca, New York 14853-7801
DA
IRY
FA
RM
BU
SIN
ES
S S
UM
MA
RY
You can’t manage what you can’t measure. But if you measure it, you can improve it!
It is the Policy of Cornell University actively to support equality of educational and employment opportunity. No person shall be denied admission to any educational program or activity or be denied employment on the basis of any legally prohibited discrimination involving, but not limited to, such factors as race, color, creed, religion, national or ethnic origin, sex, age or handicap. The University is committed to the maintenance of affirmative action programs which will assure the continuation of such equality of opportunity. The Dairy Farm Business Summary and Analysis Project is funded in part by:
Additional funding is provided by:
For additional copies, please contact:
Linda Putnam Cornell University Charles H. Dyson School of Applied Economics and Management 305 Warren Hall Ithaca, NY 14853-7801
E-mail: [email protected] Fax: 607-255-1589 Voice: 607-255-8429
Or visit: http://www.dyson.cornell.edu/outreach/order.php © Copyright 2011 by Cornell University. All rights reserved.
2010 DAIRY FARM BUSINESS SUMMARY HUDSON AND CENTRAL NEW YORK REGION
Table of Contents
Page INTRODUCTION .................................................................................................................................................... 1 Program Objectives .................................................................................................................................... 1 Format Features .......................................................................................................................................... 1 SUMMARY AND ANALYSIS OF THE FARM BUSINESS ................................................................................. 2 Business Characteristics ............................................................................................................................. 2 Income Statement ....................................................................................................................................... 2 Profitability Analysis .................................................................................................................................. 4 Farm and Family Financial Status .............................................................................................................. 7 Statement of Owner Equity ...................................................................................................................... 10 Cash Flow Statement ................................................................................................................................ 11 Repayment Analysis ................................................................................................................................. 13 Cropping Analysis .................................................................................................................................... 15 Dairy Analysis .......................................................................................................................................... 17 Capital and Labor Efficiency Analysis ..................................................................................................... 19 COMPARATIVE ANALYSIS OF THE FARM BUSINESS ................................................................................ 21 Progress of the Farm Business.................................................................................................................. 21 Regional Farm Business Chart ................................................................................................................. 23 Supplementary Information ...................................................................................................................... 24 New York State Farm Business Chart ...................................................................................................... 27 Financial Analysis Chart .......................................................................................................................... 29 Comparisons by Type of Barn and Herd Size .......................................................................................... 30 Herd Size Comparisons ............................................................................................................................ 30 IDENTIFY AND SET GOALS .............................................................................................................................. 37 GLOSSARY AND LOCATION OF COMMON TERMS ..................................................................................... 39 INDEX .................................................................................................................................................................. 42

2010 DAIRY FARM BUSINESS SUMMARY
HUDSON AND CENTRAL NEW YORK REGION*
INTRODUCTION Dairy farm managers throughout New York State have been participating in Cornell Cooperative Extension's farm business summary and analysis program since the early 1950's. Managers of each participating farm business receive a com-prehensive summary and analysis of their farm business. The information in this report represents averages of the data sub-mitted from dairy farms in the Hudson and Central New York Region for 2010. Program Objective The primary objective of the dairy farm business summary, DFBS, is to help farm managers improve the business and financial management of their business through appropriate use of historical data and the application of modern farm business analysis techniques. This information can also be used to establish goals that enable the business to better fulfill its mission. In short, DFBS provides business and financial information needed in identifying and evaluating strengths and weaknesses of the farm business. Format Features This regional report follows the same general format as the 2010 DFBS individual farm report received by partici-pating dairy farmers. The analysis tables have an open column or section labeled My Farm. It may be used by any dairy farm manager who wants to compare his or her business with the average data of this region. The individual farm data, the regional averages and other data can then be used to establish goals for the business. Non-DFBS participants can download a DFBS Data Check-In Form at http://dfbs.cornell.edu. After collecting the data on the form, it can be entered in the U. S. Top Dairies business summary program at the same web site to obtain a summary of their business. This report features: (1) an income statement including accrual adjustments for farm business expenses and receipts, as well as measures of
profitability with and without appreciation,
(2) a complete balance sheet with analytical ratios;
(3) a statement of owner equity which shows the sources of the change in owner equity during the year;
(4) a cash flow statement and debt repayment ability analysis;
(5) an analysis of crop acreage, yields, and expenses;
(6) an analysis of dairy livestock numbers, production, and expenses;
(7) a capital and labor efficiency analysis; and
(8) progress of the farm business over the past two years.
* The Hudson and Central New York Region of New York State, with the number of participating farms in parentheses, is comprised of Albany (4), Chenango (3), Columbia (3), Delaware (25), Madison (3), Orange (1), Otsego (6), Rensselaer (10), Saratoga (7), Schenectady (2), Schoharie (1), Sullivan (2), and Washington (13) counties in New York. This report was writ-ten by Wayne A. Knoblauch and George J. Conneman, Professors, Farm Business Management. Linda Putnam was in charge of data preparation. Cathryn Dymond assisted with data and publication preparation. Farm business data were collected by Senior Extension Associate in PRO-DAIRY, Jason Karszes; Cooperative Extension Educators Sandy Buxton, Mariane Kiraly, Kirk Shoen, Joe Walsh, Patricia Westenbroek; and Richard Overton, Extension Support Specialist. We also acknowledge the cooperation of Charles Z. Radick, Consultant; Cathy Wickswat, Cargill Animal Nutrition; and Farm Credit East Association for their assistance in data collection.

2
SUMMARY AND ANALYSIS OF THE FARM BUSINESS
Business Characteristics Planning optimal management strategies is a crucial component of operating a successful farm. Various combina-tions of farm resources, enterprises, business arrangements, and management techniques are used by the dairy farmers in this region. The following table shows important farm business characteristics and the number of farms with each characteristic.
BUSINESS CHARACTERISTICS 80 Hudson and Central New York Region Dairy Farms, 2010
Type of Farm Number Milking System Number Dairy 78 Bucket & carry 0 Part-time dairy 0 Dumping station 1 Dairy cash-crop 2 Pipeline 29 Herringbone conventional exit 25 Certified organic milk producer 0 Herringbone rapid exit 6 Rotational grazing farm 9 Parallel 10 Parabone 3 Type of Ownership Number Rotary 2 Owner 71 Other 4 Renter 9 Production Records Number Type of Business Number Testing Service 64 Sole Proprietorship 38 On Farm System 5 Partnership 15 Other 1 Limited Liability Corporation 21 None 10 Subchapter S Corporation 4 Subchapter C Corporation 2 Business Record System Number Account Book 14 Type of Barn Number Accounting Service 20 Stanchion or Tie-Stall 31 On-farm computer 45 Freestall 43 Other 1 Combination 6 Milking Frequency
Number
Breed of Herd
Percent
2 times per day 56 Holstein 89 3 times per day 21 Jersey 5 Other 3 Other 5 The averages used in this report were compiled using data from all the participating dairy farms in this region unless noted otherwise. There are full-time dairy farms, dairy cash-crop farms, farms with confined herds, farms with grazing herds, farm renters, partnerships, and corporations included in the average. Average data for these specific types of farms are pre-sented in the State Business Summary.
Income Statement In order for an income statement to accurately measure farm income, it must include cash transactions and accrual adjustments (changes in accounts payable, accounts receivable, inventories, and prepaid expenses). Cash paid is the actual cash outlay during the year and does not necessarily represent the cost of goods and services actually used in 2010. Change in inventory: Increases in inventories of supplies and other purchased inputs are subtracted in computing accrual ex-penses because they represent purchased inputs not actually used during the year. Decreases in purchased inventories are added to expenses because they represent inputs purchased in a prior year and used this year.

3
CASH AND ACCRUAL FARM EXPENSES 80 Hudson and Central New York Region Dairy Farms, 2010
Expense Item
Cash Paid
-
Change in Inventory or
Prepaid Expense
+
Change in Accounts Payable
=
Accrual
Expenses Hired Labor $ 177,754 $ 101 << $ 575 $178,228 Feed Dairy grain & concentrate 361,196 2,918 -15,411 342,867 Dairy roughage 17,365 -625 1,581 19,570 Nondairy 58 0 0 58 Professional nutritional services 28 0 << 119 147 Machinery Machinery hire, rent & lease 22,617 28 << -362 22,228 Machinery repairs & farm vehicle exp. 62,954 165 168 62,957 Fuel, oil & grease 51,257 336 -469 50,452 Livestock Replacement livestock 2,065 0 << 0 2,065 Breeding 14,945 171 -49 14,725 Veterinary & medicine 42,694 482 -1,199 41,013 Milk marketing 75,486 0 << 44 75,529 Bedding 22,124 -169 -87 22,205 Milking supplies 25,942 92 381 26,231 Cattle lease & rent 345 0 << 0 345 Custom boarding 16,842 0 << -588 16,254 bST 10,976 -103 6 11,085 Livestock professional fees 3,853 139 << -62 3,652 Other livestock expense 8,530 22 389 8,896 Crops Fertilizer & lime 34,342 1,512 -1,214 31,616 Seeds & plants 27,221 587 -1,540 25,093 Spray, other crop expense 13,780 571 -776 12,433 Crop professional fees 2,231 20 << -104 2,107 Real Estate Land, building & fence repair 13,281 -1 -93 13,189 Taxes 15,690 -388 << 303 16,381 Rent & lease 20,166 229 << -2 19,936 Other Insurance 13,171 -25 << -154 13,042 Utilities (farm share) 31,740 0 << -113 31,627 Interest paid 34,407 0 << -60 34,347 Other professional fees 6,176 0 << -25 6,151 Miscellaneous 7,184 18 164 7,330
Total Operating $1,136,418 $ 6,081 $ -18,578 $1,111,760 Expansion livestock 3,543 0 << 0 3,543 Extraordinary expense 366 0 << 0 366 Machinery depreciation 47,534 Building depreciation 23,122 TOTAL ACCRUAL EXPENSES $1,186,325 Change in prepaid expenses (noted above by <<) is a net change in non-inventory expenses that have been paid in advance of their use. For example, prepaid lease expense on the beginning of year balance sheet represents last year’s payment for use of the asset during this year. End of year prepaid expense represents payments made this year for next year’s use of the asset. Adding payments made last year for this year’s use of the asset, and subtracting payments made this year for next year’s use of the asset is accomplished by subtracting the difference. Change in accounts payable: An increase in accounts payable from beginning to end of year is added when calculating accru-al expenses because these expenses were incurred (resources used) in 2010 but not paid for. A decrease is subtracted because it represents payment for resources used before 2010. Accrual expenses are an estimate of the costs of inputs, except operator/family labor and equity capital, actually used in this year's production. They are the cash paid, less changes in inventory and prepaid expenses, plus accounts payable.

4
CASH AND ACCRUAL FARM RECEIPTS 80 Hudson and Central New York Region Dairy Farms, 2010
Receipt Item
Cash
Receipts
+
Change in Inventory
+
Change in Accounts
Receivable
=
Accrual Receipts
Milk sales $1,191,585 $7,520 $1,199,105 Dairy cattle 56,442 $9,081 621 66,143 Dairy calves 6,259 4,310 -7 10,562 Other livestock 3,008 -291 795 3,512 Crops 12,039 8,440 1,266 21,745 Government receipts 11,648 -47 * -8 11,593 Custom machine work 5,215 -184 5,031 Gas tax refund 211 0 211 Other 16,632 790 17,422 Less nonfarm noncash capital** (-) 0 ** (-) 0 Total Receipts $1,303,040 $21,493 $10,793 $1,335,326 *Change in advanced government receipts. **Gifts or inheritances of cattle or crops included in inventory. Cash receipts include the gross value of milk checks received during the year plus all other payments received from the sale of farm products, services, and government programs. Nonfarm income is not included in calculating farm profitability.
Changes in inventory of assets produced by the business are calculated by subtracting beginning of year values from end of year values excluding appreciation. Increases in livestock inventory caused by herd growth and/or quality are added, and decreases caused by herd reduction and/or quality are subtracted. Changes in inventories of crops grown are also included. An increase in advanced government receipts is subtracted from cash income because it represents income received in 2010 for the 2011 crop year in excess of funds earned for 2010. Likewise, a decrease is added to cash government receipts because it represents funds earned for 2010 but received in 2009.
Changes in accounts receivable are calculated by subtracting beginning year balances from end year balances. Payments in January 2011 for milk produced in December 2010 compared to January 2010 payments for milk produced in 2009 are in-cluded as a change in accounts receivable in determining accrual milk sales.
Accrual receipts represent the value of all farm commodities produced and services actually generated by the farm business during the year.
Profitability Analysis
Farm operators* contribute labor, management, and equity capital to their businesses and the combination of these resources, and the other resources used in the business, determines profitability. Farm profitability can be measured as the return to all family resources or as the return to one or more individual resources such as labor and management.
The return to any individual resource must be viewed as an estimate because the cost of other family resources must be approximated to calculate returns to the selected resource. For example, the costs of operator and family labor and man-agement must be approximated to calculate the returns to equity capital.
* Operators are the individuals who are integrally involved in the operation and management of the farm business. They are not limited to those who are the owner of a sole proprietorship or are formally a member of the partnership or corporation.

5
Net farm income is the return to the farm operators and other unpaid family members for their labor, management, and equity capital. It is the farm family's net annual return from working, managing, and financing the farm business. This is not a measure of cash available from the year's business operation. Cash flow is evaluated later in this report. Net farm income is computed both with and without appreciation. Appreciation represents the change in values caused by annual changes in prices of livestock, machinery, real estate inventory, and stocks and certificates (other than Farm Credit stock required for loan borrowings). Appreciation is a major factor contributing to changes in farm net worth and must be included for a complete profitability analysis.
NET FARM INCOME 80 Hudson and Central New York Region Dairy Farms, 2010
Average My Farm Item Total Per Cow Total Per Cow Total accrual receipts $ 1,335,326 $ _______ Appreciation: Livestock 3,196 _______ Machinery 1,597 _______ Real Estate 22,985 _______ Other Stock & Certificates -654 _______ Total Including Appreciation $ 1,362,449 $ _______ Total accrual expenses 1,186,325 - _______ Net Farm Income (with appreciation) $ 176,125 $ 622 $ _______ $ _______ Net Farm Income (without appreciation) $ 149,001 $ 526 $ _______ $ _______
The chart below shows the relationship between net farm income per cow (without appreciation) and pounds of milk sold per cow. Higher net farm incomes can be achieved across a range of production levels as a result of different manage-ment systems, such as grazing, being utilized by the participating dairies.
-$1,000
-$500
$0
$500
$1,000
$1,500
$2,000
8,000 10,000 12,000 14,000 16,000 18,000 20,000 22,000 24,000 26,000 28,000 30,000
$ N
et F
arm
In
com
e/C
ow (
wit
hou
t ap
pre
ciat
ion
)
Pounds Milk Sold Per Cow
NET FARM INCOME PER COW AND MILK PER COW80 Hudson and Central New York Region Dairy Farms, 2010

6
Labor and management income is the return which farm operators receive for their labor and management used in the farm business. Appreciation is not included as part of the return to labor and management because it results from ownership of assets rather than management of the farm business. Labor and management income is calculated by deducting a charge for unpaid family labor and the opportunity cost of equity capital, at a real interest rate of five percent, from net farm income excluding appreciation. The interest charge of five percent reflects the long-term average rate of return above inflation that a farmer might expect to earn in comparable risk investments.
LABOR AND MANAGEMENT INCOME 80 Hudson and Central New York Region Dairy Farms, 2010
Item Average My Farm
Net farm income without appreciation $ 149,001 $ ___________
Family labor unpaid @ $2,500 per month - 6,959 - ____________
Interest on $1,654,590 average equity capital @ 5% real rate - 82,730 - ____________
Labor & Management Income per farm (1.75 Operators/farm) $ 59,312 $ ___________
Labor & Management Income per Operator/Manager $ 33,893 $ ___________
Labor and management income per operator averaged $33,893 on these 80 farms in 2010. The range in labor and management income per operator was from about $-140,810 to more than $467,000. Returns to labor and management were less than $0 on 49 percent of the farms. Labor and management incomes per operator were between $0 and $100,000 on 39 percent of the farms, while 12 percent had labor and management incomes of $100,000 or more per operator.
14%
35%
29%
10%
7%5%
0%
5%
10%
15%
20%
25%
30%
35%
40%
< -50 -50 to 0 0 to 50 50 to 100 100 to 150 > 150
Per
cen
t of
Far
ms
Labor and Managment Incomes Per Operator (thousand dollars)
DISTRIBUTION OF LABOR AND MANAGEMENT INCOMES PER OPERATOR80 Hudson and Central New York Region Dairy Farms, 2010

7
Return on equity capital measures the net return remaining for the farmer's equity or owned capital after a charge has been made for the owner-operator's labor and management. The earnings or amount of net farm income allocated to labor and management is the opportunity cost of operators' labor and management estimated by the cooperators. Return on equity capi-tal is calculated with and without appreciation. The rate of return on equity capital is determined by dividing the amount re-turned by the average farm net worth (market value) or equity capital. Rate of return on total capital is calculated by adding interest paid to the return on equity capital and then dividing by average farm assets (market value). Net farm income from operations ratio is net farm income (without appreciation) divided by total accrual receipts.
RETURN ON EQUITY CAPITAL AND RETURN ON TOTAL CAPITAL 80 Hudson and Central New York Region Dairy Farms, 2010
Item
Average
My Farm
Net farm income with appreciation $ 176,125 $ __________
Family labor unpaid @ $2,500 per month - 6,959 - __________
Value of operators’ labor & management - 70,620 - __________
Return on equity capital with appreciation $ 98,546 $ __________
Interest paid + 34,347 + _________
Return on total capital with appreciation $ 132,893 $ __________
Return on equity capital without appreciation $ 71,422 $ __________
Return on total capital without appreciation $ 105,769 $ __________
Rate of return on average equity capital:
with appreciation 4.3% __________ %
without appreciation 6.0% __________ %
Rate of return on average total capital:
with appreciation 4.1% __________ %
without appreciation 5.2% __________ % Net Farm Income from Operations Ratio 0.11 _________ Farm and Family Financial Status
The first step in evaluating the financial position of the farm is to construct a balance sheet which identifies and val-ues all the assets and liabilities of the business. The second step is to evaluate the relationship between assets, liabilities, and net worth and changes that occurred during the year.
Financial lease obligations are included in the balance sheet. The present value of all future payments is listed as a liability since the farmer is committed to make the payments by signing the lease. The present value is also listed as an asset, repre-senting the future value the item has to the business. For 2010, lease payments were discounted by 7 percent to obtain their present value.
Advanced government receipts are included as current liabilities. Government payments received in 2010 that are for partic-ipation in the 2011 program are the end year balance and payments received in 2009 for participation in the 2010 program are the beginning year balance.
Current Portion or principal due in the next year for intermediate and long term debt is included as a current liability.

8
2010 FARM BUSINESS & NONFARM MARKET VALUE BALANCE SHEET 80 Hudson and Central New York Region Dairy Farms, 2010
Farm Assets
Jan. 1
Dec. 31
Farm Liabilities & Net Worth
Jan. 1
Dec. 31
Current Current Farm cash, checking Accounts payable $ 81,604 $ 63,026 & savings $ 24,619 $ 27,551 Operating debt 75,147 63,989 Accounts receivable 78,100 88,893 Short Term 3,750 4,153 Prepaid expenses 1,519 1,622 Advanced govt. receipts 0 47 Feed & supplies 240,644 255,061 Current Portion: Intermediate 67,872 66,529 Long Term 22,288 24,119 Total Current $ 344,882 $ 373,127 Total Current $ 250,660 $ 221,863 Intermediate Intermediate Dairy cows: Structured debt owned $ 383,413 $ 395,694 1-10 years $ 357,385 $ 355,916 leased 1,176 932 Financial lease Heifers 221,948 224,721 (cattle/machinery) 7,338 7,104 Bulls & other livestock 6,034 7,276 Farm Credit stock 1,252 1,262 Mach. & equip. owned 478,923 489,938 Total Intermediate $ 365,976 $ 364,282 Mach. & equip. leased 6,163 6,172 Farm Credit stock 1,252 1,262 Other stock/certificate 43,851 45,793 Total Intermediate $ 1,142,759 $1,171,788 Long Term Long Term Land & buildings: Structured debt owned $ 1,030,302 $ 1,056,214 >10 years $ 301,473 $ 305,638 leased 130 873 Financial lease Total Long Term $ 1,030,432 $1,057,088 (structures) 130 873 Total Long Term $ 301,603 $ 306,512 Total Farm Assets $ 2,518,073 $2,602,003 Total Farm Liabilities $ 918,239 $ 892,657 FARM NET WORTH $ 1,599,833 $ 1,709,346 Nonfarm Assets, Liabilities & Net Worth (Average of 32 farms reporting)
Assets Jan. 1 Dec. 31 Liabilities & Net Worth Jan. 1 Dec. 31 Personal cash, checking & savings $ 9,374 $ 10,301
Nonfarm Liabilities $ 7,920 $ 7,316
Cash value life insurance 32,873 37,547 Nonfarm real estate 323,103 308,438 Auto (personal share) 3,953 4,359 Stocks & bonds 20,124 20,557 Household furnishings 4,219 4,297 All other nonfarm assets 22,909 22,932 Total Nonfarm Assets $416,556 $408,431
NONFARM NET WORTH $408,636 $401,114
Farm & Nonfarm Assets, Liabilities, and Net Worth*
Jan. 1
Dec. 31
Total Assets $ 2,934,629 $ 3,010,434 Total Liabilities 926,159 899,973 TOTAL FARM & NONFARM NET WORTH $ 2,008,470 $ 2,110,461
*Assumes that average nonfarm assets and liabilities for the nonreporting farms were the same as for those reporting.
9
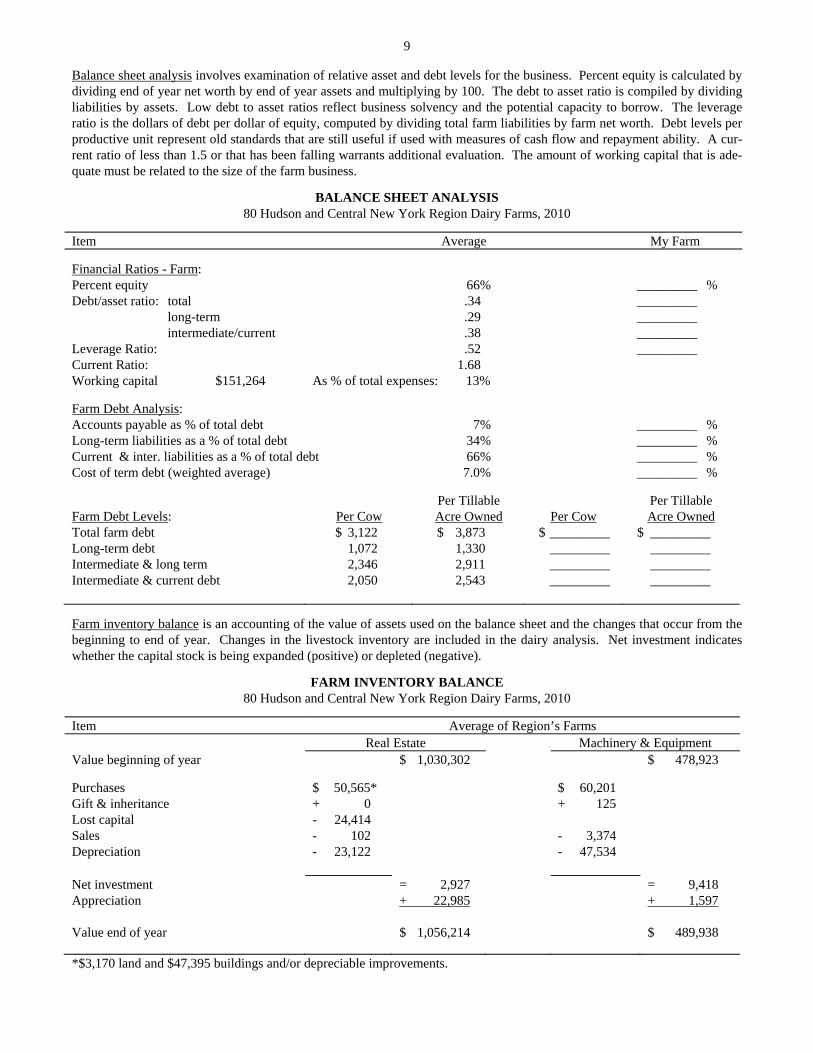
Balance sheet analysis involves examination of relative asset and debt levels for the business. Percent equity is calculated by dividing end of year net worth by end of year assets and multiplying by 100. The debt to asset ratio is compiled by dividing liabilities by assets. Low debt to asset ratios reflect business solvency and the potential capacity to borrow. The leverage ratio is the dollars of debt per dollar of equity, computed by dividing total farm liabilities by farm net worth. Debt levels per productive unit represent old standards that are still useful if used with measures of cash flow and repayment ability. A cur-rent ratio of less than 1.5 or that has been falling warrants additional evaluation. The amount of working capital that is ade-quate must be related to the size of the farm business.
BALANCE SHEET ANALYSIS 80 Hudson and Central New York Region Dairy Farms, 2010
Item Average My Farm
Financial Ratios - Farm: Percent equity 66% _________ % Debt/asset ratio: total .34 _________ long-term .29 _________ intermediate/current .38 _________ Leverage Ratio: .52 _________ Current Ratio: 1.68 Working capital $151,264 As % of total expenses: 13%
Farm Debt Analysis: Accounts payable as % of total debt 7% _________ % Long-term liabilities as a % of total debt 34% _________ % Current & inter. liabilities as a % of total debt 66% _________ % Cost of term debt (weighted average) 7.0% _________ %
Farm Debt Levels:
Per Cow
Per Tillable Acre Owned
Per Cow
Per Tillable Acre Owned
Total farm debt $ 3,122 $ 3,873 $ _________ $ _________ Long-term debt 1,072 1,330 _________ _________ Intermediate & long term 2,346 2,911 _________ _________ Intermediate & current debt 2,050 2,543 _________ _________
Farm inventory balance is an accounting of the value of assets used on the balance sheet and the changes that occur from the beginning to end of year. Changes in the livestock inventory are included in the dairy analysis. Net investment indicates whether the capital stock is being expanded (positive) or depleted (negative).
FARM INVENTORY BALANCE 80 Hudson and Central New York Region Dairy Farms, 2010
Item Average of Region’s Farms Real Estate Machinery & Equipment Value beginning of year $ 1,030,302 $ 478,923
Purchases $ 50,565* $ 60,201 Gift & inheritance + 0 + 125 Lost capital - 24,414 Sales - 102 - 3,374 Depreciation - 23,122 - 47,534 Net investment = 2,927 = 9,418 Appreciation + 22,985 + 1,597 Value end of year $ 1,056,214 $ 489,938
*$3,170 land and $47,395 buildings and/or depreciable improvements.
10
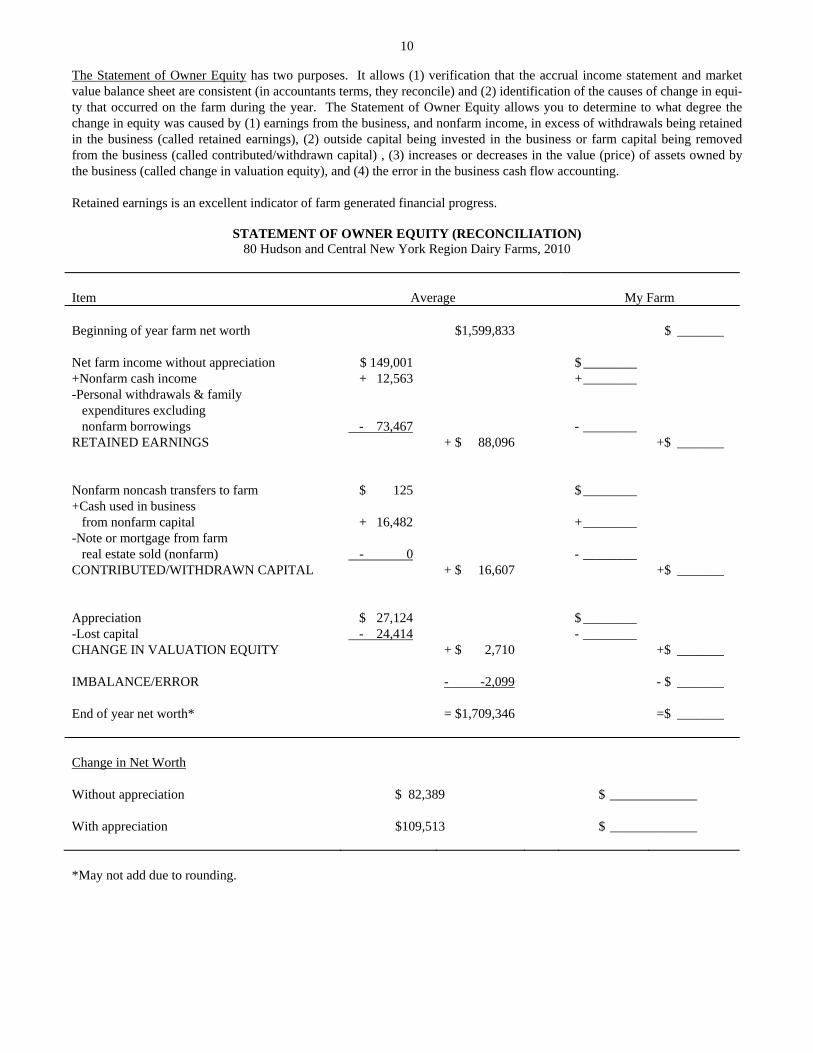
The Statement of Owner Equity has two purposes. It allows (1) verification that the accrual income statement and market value balance sheet are consistent (in accountants terms, they reconcile) and (2) identification of the causes of change in equi-ty that occurred on the farm during the year. The Statement of Owner Equity allows you to determine to what degree the change in equity was caused by (1) earnings from the business, and nonfarm income, in excess of withdrawals being retained in the business (called retained earnings), (2) outside capital being invested in the business or farm capital being removed from the business (called contributed/withdrawn capital) , (3) increases or decreases in the value (price) of assets owned by the business (called change in valuation equity), and (4) the error in the business cash flow accounting. Retained earnings is an excellent indicator of farm generated financial progress.
STATEMENT OF OWNER EQUITY (RECONCILIATION) 80 Hudson and Central New York Region Dairy Farms, 2010
Item
Average
My Farm
Beginning of year farm net worth $1,599,833 $ _______ Net farm income without appreciation $ 149,001 $ ________ +Nonfarm cash income + 12,563 + ________ -Personal withdrawals & family expenditures excluding nonfarm borrowings - 73,467 - ________ RETAINED EARNINGS + $ 88,096 +$ _______ Nonfarm noncash transfers to farm $ 125 $ ________ +Cash used in business from nonfarm capital + 16,482 + ________ -Note or mortgage from farm real estate sold (nonfarm) - 0 - ________ CONTRIBUTED/WITHDRAWN CAPITAL + $ 16,607 +$ _______
Appreciation $ 27,124 $ ________ -Lost capital - 24,414 - ________ CHANGE IN VALUATION EQUITY + $ 2,710 +$ _______
IMBALANCE/ERROR - -2,099 - $ _______ End of year net worth* = $1,709,346 =$ _______ Change in Net Worth Without appreciation $ 82,389 $ _____________ With appreciation $109,513 $ _____________ *May not add due to rounding.

11
Cash Flow Statement Completing an annual cash flow statement is an important step in understanding the sources and uses of funds for the business. Understanding last year's cash flow is the first step toward planning and managing cash flow for the current and future years. The annual cash flow statement is structured to show net cash provided by operating activities, investing activities, financing activities and from reserves. All cash inflows and outflows, including beginning and end balances, are included. Therefore, the sum of net cash provided from all four activities should be zero. Any imbalance is the error from incorrect accounting of cash inflows/outflows.
ANNUAL CASH FLOW STATEMENT
80 Hudson and Central New York Region Dairy Farms, 2010 Item Average Cash Flow from Operating Activities Cash farm receipts $ 1,303,040 - Cash farm expenses 1,136,418 - Extraordinary expense 366 = Net cash farm income $ 166,256 Personal withdrawals & family expenses including nonfarm debt payments $ 73,499 - Nonfarm income 12,563 - Net cash withdrawals from the farm $ 60,936 = Net Provided by Operating Activities $ 105,320 Cash Flow From Investing Activities Sale of assets: machinery $ 3,374 + real estate 102 + other stock & cert. 719 = Total asset sales $ 4,195 Capital purchases: expansion livestock $ 3,543 + machinery 60,201 + real estate 50,564 + other stock & cert. 3,315 - Total invested in farm assets $ 117,624 = Net Provided by Investment Activities $ -113,429 Cash Flow From Financing Activities Money borrowed (intermediate & long term) $ 113,472 + Money borrowed (short term) 4,220 + Increase in operating debt 0 + Cash from nonfarm capital used in business 16,482 + Money borrowed - nonfarm 31 = Cash inflow from financing $ 134,205 Principal payments (intermediate & long term) $ 110,289 + Principal payments (short term) 3,816 + Decrease in operating debt 11,158 - Cash outflow for financing $ 125,263 = Net Provided by Financing Activities $ 8,941 Cash Flow From Reserves Beginning farm cash, checking & savings $ 24,619 - Ending farm cash, checking & savings 27,551 = Net Provided from Reserves $ -2,932 Imbalance (error) $ -2,101

12
ANNUAL CASH FLOW STATEMENT Item My Farm Cash Flow from Operating Activities Cash farm receipts $ ___________ - Cash farm expenses ___________ - Extraordinary expense ___________ = Net cash farm income $ __________ Personal withdrawals & family expenses including nonfarm debt payments $ ___________ - Nonfarm income ___________ - Net cash withdrawals from the farm $ __________ = Net Provided by Operating Activities $ __________ Cash Flow From Investing Activities Sale of assets: machinery $ ___________ + real estate ___________ + other stock & cert. ___________ = Total asset sales $ __________ Capital purchases: expansion livestock $ ___________ + machinery ___________ + real estate ___________ + other stock & cert. ___________ - Total invested in farm assets $ __________ = Net Provided by Investment Activities $ __________ Cash Flow From Financing Activities Money borrowed (intermediate & long term) $ ___________ + Money borrowed (short term) ___________ + Increase in operating debt ___________ + Cash from nonfarm capital used in business ___________ + Money borrowed - nonfarm ___________ = Cash inflow from financing $ __________ Principal payments (intermediate & long term) $ ___________ + Principal payments (short term) ___________ + Decrease in operating debt ___________ - Cash outflow for financing $ __________ = Net Provided by Financing Activities $ __________ Cash Flow From Reserves Beginning farm cash, checking & savings $ __________ - Ending farm cash, checking & savings __________ = Net Provided from Reserves $ __________ Imbalance (error) $ __________

13
Repayment Analysis A valuable use of cash flow analysis is to compare the debt payments planned for the last year with the amount actu-ally paid. The measures listed below provide a number of different perspectives on the repayment performance of the busi-ness. However, the critical question to many farmers and lenders is whether planned payments can be made in 2011. The cash flow projection worksheet on the next page can be used to estimate repayment ability, which can then be compared to planned 2011 debt payments shown below.
FARM DEBT PAYMENTS PLANNED Same 71 Hudson and Central New York Region Dairy Farms, 2009 & 2010
Average My Farm 2010 Payments Planned 2010 Payments Planned Debt Payments Planned Made 2011 Planned Made 2011 Long term $ 38,044 $ 40,346 $ 40,947 $ ________ $ ________ $ ________ Intermediate term 86,112 109,440 98,829 ________ ________ ________ Short term 3,755 4,457 3,046 ________ ________ ________ Operating (net reduction) 18,005 17,626 3,354 ________ ________ ________ Accounts payable (net reduction) 4,296 27,283 3,592 ________ ________ ________ Total $ 150,212 $ 199,152 $ 149,767 $ ________ $ ________ $ ________ Per cow $ 505 $ 669 $ ________ $ ________ Per cwt. 2010 milk $ 2.15 $ 2.85 $ ________ $ ________ Percent of total 2010 farm receipts 11% 14% ________ ________ Percent of 2010 milk receipts 12% 16% ________ ________ The cash flow coverage ratio and debt coverage ratio measure the ability of the farm business to meet its planned debt payment schedule. The ratios show the percentage of payments planned for 2010 (as of December 31, 2009) that could have been made with the amount available for debt service in 2010. Farmers who did not participate in DFBS in 2009 have their 2010 ratios based on planned debt payments for 2011.
COVERAGE RATIOS Same 71 Hudson and Central New York Region Dairy Farms, 2009 & 2010
Item Average Item Average Cash Flow Coverage Ratio Debt Coverage Ratio Cash farm receipts $1,374,418 Net farm income (w/o appreciation) $158,379 - Cash farm expenses 1,198,924 + Depreciation 75,450 + Interest paid (cash) 36,842 + Interest paid (accrual) 36,775 - Net personal withdrawals from farm* 62,789 - Net personal withdrawals from farm* 62,789 (A) = Amount Available for Debt Service $149,547 (A’) = Repayment Capacity $207,815 (B) = Debt Payments Planned for 2010 (B) = Debt Payments Planned for 2010 (as of December 31, 2009) $150,212 (as of December 31, 2009) $150,212 (A/ B)= Cash Flow Coverage Ratio for 2010 1.00 (A’/B)= Debt Coverage Ratio for 2010 1.38 *Personal withdrawals and family expenditures less nonfarm income and nonfarm money borrowed. If family withdrawals are excluded, or inaccurately included, the ratios will be incorrect.

14
ANNUAL CASH FLOW WORKSHEET
80 Hudson and Central New York Region Dairy Farms
My Farm Per Cow/
Expected
2011
Item Per Cow Per Cwt. Per Cwt. Change Projection Average number of cows 283 Total cwt. of milk sold 66,247 Accrual Operating Receipts Milk $4,234 $18.10 $ ________ _________ $ ________ Dairy cattle 234 1.00 _________ _________ _________ Dairy calves 37 0.16 _________ _________ _________ Other livestock 12 0.05 _________ _________ _________ Crops 77 0.33 _________ _________ _________ Miscellaneous Receipts 121 0.52 _________ _________ _________ Total $4,715 $20.16 $ ________ _________ $ ________ Accrual Operating Expenses Hired labor $ 629 $ 2.69 $ ________ _________ $ ________ Dairy grain & concentrate 1,211 5.18 _________ _________ _________ Dairy roughage 69 0.30 _________ _________ _________ Nondairy feed 0 0.00 _________ _________ _________ Professional nutritional services 1 0.00 _________ _________ _________ Machinery hire, rent & lease 78 0.34 _________ _________ _________ Machinery repair & vehicle expense 222 0.95 _________ _________ _________ Fuel, oil & grease 178 0.76 _________ _________ _________ Replacement livestock 7 0.03 _________ _________ _________ Breeding 52 0.22 _________ _________ _________ Veterinary & medicine 145 0.62 _________ _________ _________ Milk marketing 267 1.14 _________ _________ _________ Bedding 78 0.34 _________ _________ _________ Milking supplies 93 0.40 _________ _________ _________ Cattle lease 1 0.01 _________ _________ _________ Custom boarding 57 0.25 _________ _________ _________ bST expense 39 0.17 Livestock professional fees 13 0.06 _________ _________ _________ Other livestock expense 31 0.13 _________ _________ _________ Fertilizer & lime 112 0.48 _________ _________ _________ Seeds & plants 89 0.38 _________ _________ _________ Spray & other crop expense 44 0.19 _________ _________ _________ Crop professional fees 7 0.03 _________ _________ _________ Land, building & fence repair 47 0.20 _________ _________ _________ Taxes 58 0.25 _________ _________ _________ Real estate rent & lease 70 0.30 _________ _________ _________ Insurance 46 0.20 _________ _________ _________ Utilities 112 0.48 _________ _________ _________ Other professional fees 22 0.09 Miscellaneous 26 0.11 _________ _________ _________ Total Less Interest Paid $3,805 $16.26 $ ________ _________ $ ________ Net Accrual Operating Income Total (without interest paid) $257,912 $ ________ $ ________ - Change in livestock /crop inventory* 21,493 _________ _________ _________ - Change in accounts receivable 10,793 _________ _________ _________ - Change in feed & supply inventory** 6,081 _________ _________ _________ + Change in accounts payable*** -18,518 _________ _________ _________ NET CASH FLOW $201,028 $ ________ $ ________ - Net family withdrawals 60,666 _________ _________ _________ Available for Farm $140,361 $ ________ _________ - Farm debt payments 186,521 _________ _________ _________ Available for Farm Investment $-46,160 $ ________ $ ________ - Capital purchases 117,624 _________ _________ _________ Additional Capital Needed $163,784 $ ________ _________ $ ________ *Includes change in advance government receipts. **Includes change in prepaid expenses. ***Excludes change in interest account payable.

15
Cropping Analysis The cropping program is an important part of the dairy farm business and often represents opportunities for im-proved productivity and profitability. A complete evaluation of what the available land resources are, how they are being used, the level of crop yields, and what it costs to produce crops is important in evaluating alternative cropping and feed pur-chasing alternatives.
LAND RESOURCES AND CROP PRODUCTION 80 Hudson and Central New York Region Dairy Farms, 2010
Item
Average
My Farm
Land Owned Rented Total Owned Rented Total Tillable 230 444 674 ______ _______ _______ Nontillable 50 22 72 ______ _______ _______ Other nontillable 122 8 130 ______ _______ _______ Total
402 474 876 ______ _______ _______
Crop Yields Farms Acres* Production/Acre Acres Production/Acre Hay crop 78 377 2.88 tons DM _____ _______ tons DM Corn silage 73 227 17.73 tons _____ _______ tons 6.16 tons DM _______ tons DM Other forage 12 70 1.72 tons DM _____ _______ tons DM Total forage 78 601 4.02 tons DM _____ _______ tons DM Corn grain 31 148 136 bushels _____ _______ bushels Oats 9 33 46 bushels _____ _______ bushels Wheat 4 30 60 bushels _____ _______ bushels Other crops 16 49 _____ Tillable pasture 9 112 _____ Idle 15 36 _____ Total Tillable Acres 80 674 _____ *This column represents the average acreage for the farms producing that crop. Average acreages including those farms not
producing were hay crop 368, corn silage 208, corn grain 57, oats 4, tillable pasture 13, and idle 7. Average crop acres and yields compiled for the region are for the farms reporting each crop. Yields of forage crops have been converted to tons of dry matter using dry matter coefficients reported by the farmers. Grain production has been converted to bushels of dry grain equivalent based on dry matter information provided. The following crop/dairy ratios indicate the relationship between forage production, forage production resources, and the dairy herd.
CROP/DAIRY RATIOS 78 Hudson and Central New York Region Dairy Farms, 2010
Item
Average*
My Farm
Total tillable acres per cow 2.40 ___________ Total forage acres per cow 2.09 ___________ Harvested forage dry matter, tons per cow 8.39 ___________ *Excludes farms that do not harvest forages.

16
Cropping Analysis (continued) Crop input costs per tillable acre are reported in the table below. The chart below shows the relationship between total forage dry matter and total crop input costs. Rotational grazing was used on nine farms in the region.
CROP RELATED ACCRUAL EXPENSES Hudson and Central New York Region Dairy Farms Reporting, 2010
Average 78 Farms My Farm
Item Total Per Tillable Acre Total Per Tillable Acre
Number of farms reporting 78 _____________ Average number of acres 691 _____________
Fertilizer & lime expenses $ 37.77 $ ____________ Seeds & plants 28.98 _____________ Spray & other crop expenses 17.78 _____________ Total $ 84.53 $ ____________
Most machinery costs are associated with crop production and should be analyzed with the crop enterprise. Total machinery expenses include the major fixed costs (interest and depreciation), as well as the accrual operating costs. Although machin-ery costs have not been allocated to individual crops, they are shown below per total tillable acre.
ACCRUAL MACHINERY EXPENSES 78 Hudson and Central New York Region Dairy Farms, 2010*
Average My Farm Machinery Expense
Total Expenses
Per Tillable Acre
Total Expenses
Per Tillable Acre
Fuel, oil & grease $ 51,603 $ 74.66 $ _________ $ __________ Mach. repair & vehicle expense 64,411 93.19 _________ __________ Machine hire, rent & lease 22,159 32.06 _________ __________ Interest (5%) 25,125 36.35 _________ __________ Depreciation 48,693 70.45 _________ __________ Total $211,991 $306.71 $ _________ $ __________ *Excludes farms that do not harvest forages.
$0$20$40$60$80
$100$120$140$160$180$200
1.0 2.0 3.0 4.0 5.0 6.0 7.0 8.0
Tot
al C
rop
Exp
ense
Per
Til
lab
le A
cre
Total Tons Forage Dry Matter Per Acre
CROP EXPENSE PER ACRE AND TOTAL FORAGE PRODUCTION PER ACRE78 Hudson and Central New York Region Dairy Farms, 2010

17
Dairy Analysis Analysis of the dairy enterprise can reveal strengths and weaknesses of the dairy farm business. Information on this page should be used in conjunction with DHI and other dairy production information. Changes in dairy herd size and market values that occur during the year are identified in the table below. The change in inventory value without appreciation is at-tributed to physical changes in herd size and quality. Any change in inventory is included as an accrual farm receipt when calculating all of the profitability measures on pages 6 and 7.
DAIRY HERD INVENTORY 80 Hudson and Central New York Region Dairy Farms, 2010
Dairy Cows Heifer Bred Open Calves Item No. Value No. Value No. Value No. Value Beg. year (owned) 274 $ 383,413 86 $ 118,026 85 $ 69,732 68 $ 34,189 + Change w/o apprec. 11,258 1,216 -3,392 4,310 + Appreciation 1,024 328 909 -598 End year (owned) 283 $ 395,694 86 $ 119,570 82 $ 67,249 75 $ 37,902 End including leased 286 Average number 283 241 (all age groups) My Farm: Beg. year (owned) _____ $ ______ _____ $ ______ _____ $ ______ ______$ ______ + Change w/o apprec. _______ _______ _______ _______ + Appreciation _______ _______ _______ _______ End year (owned) _____ $ ______ _____ $ ______ _____ $ ______ ______$ ______ End including leased _____ Average number _____ _____ (all age groups) Total milk sold and milk sold per cow are extremely valuable measures of size and productivity, respectively, on the dairy farm. These measures of milk output are based on pounds of milk marketed during the year.
MILK PRODUCTION 80 Hudson and Central New York Region Dairy Farms, 2010
Item Average My Farm Total milk sold, pounds 6,624,656 _____________ Milk sold per cow, pounds 23,393 _____________ Average milk plant test, percent butterfat 3.72% _____________
Monitoring and evaluating culling practices and experiences on an annual basis are important herd management tools. Culling rate can have an effect on both milk per cow and profitability.
ANIMALS LEAVING THE HERD 80 Hudson and Central New York Region Dairy Farms, 2010
Average My Farm Item Number Percent* Number Percent* Cows sold for beef 74 26.3 __________ _________ Cows sold for dairy 6 2.0 __________ _________ Cows died 17 5.9 __________ _________ Culling rate** 32.0 _________ *Percent of average number of cows in the herd. **Cows sold for beef plus cows died.
18
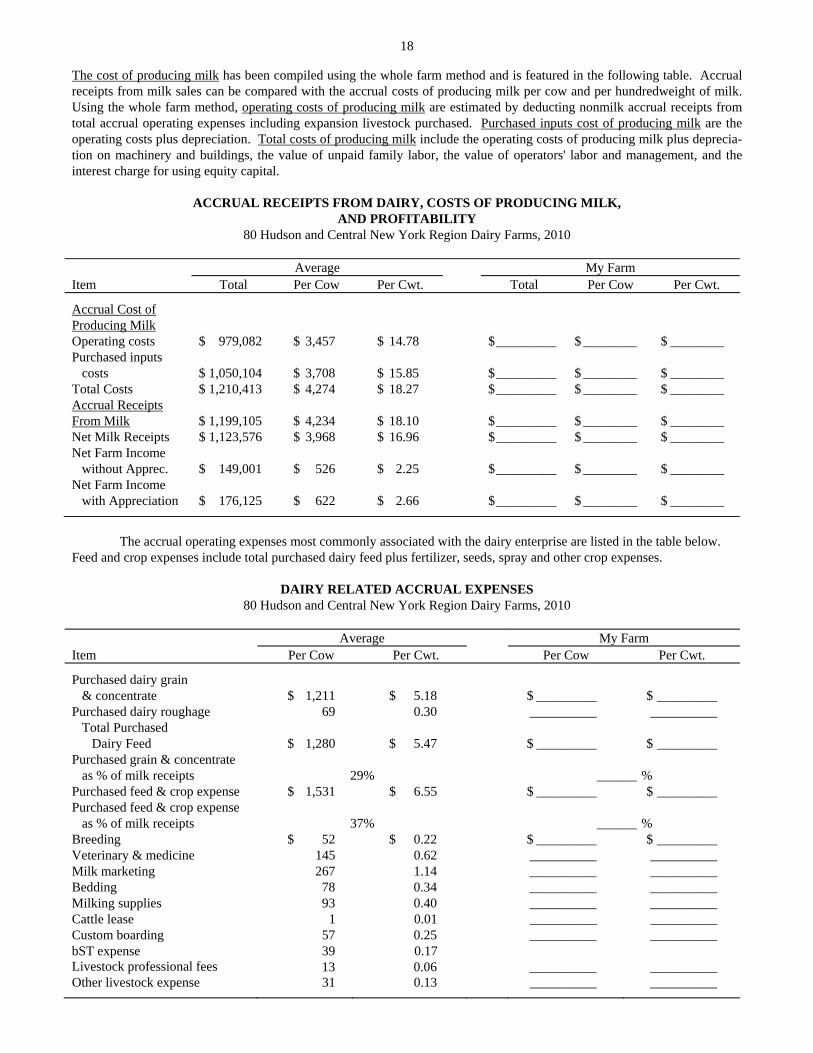
The cost of producing milk has been compiled using the whole farm method and is featured in the following table. Accrual receipts from milk sales can be compared with the accrual costs of producing milk per cow and per hundredweight of milk. Using the whole farm method, operating costs of producing milk are estimated by deducting nonmilk accrual receipts from total accrual operating expenses including expansion livestock purchased. Purchased inputs cost of producing milk are the operating costs plus depreciation. Total costs of producing milk include the operating costs of producing milk plus deprecia-tion on machinery and buildings, the value of unpaid family labor, the value of operators' labor and management, and the interest charge for using equity capital.
ACCRUAL RECEIPTS FROM DAIRY, COSTS OF PRODUCING MILK, AND PROFITABILITY
80 Hudson and Central New York Region Dairy Farms, 2010
Average My Farm Item Total Per Cow Per Cwt. Total Per Cow Per Cwt.
Accrual Cost of Producing Milk Operating costs $ 979,082 $ 3,457 $ 14.78 $ _________ $ ________ $ ________ Purchased inputs costs $ 1,050,104 $ 3,708 $ 15.85 $ _________ $ ________ $ ________ Total Costs $ 1,210,413 $ 4,274 $ 18.27 $ _________ $ ________ $ ________ Accrual Receipts From Milk $ 1,199,105 $ 4,234 $ 18.10 $ _________ $ ________ $ ________ Net Milk Receipts $ 1,123,576 $ 3,968 $ 16.96 $ _________ $ ________ $ ________ Net Farm Income without Apprec. $ 149,001 $ 526 $ 2.25 $ _________ $ ________ $ ________ Net Farm Income with Appreciation $ 176,125 $ 622 $ 2.66 $ _________ $ ________ $ ________
The accrual operating expenses most commonly associated with the dairy enterprise are listed in the table below. Feed and crop expenses include total purchased dairy feed plus fertilizer, seeds, spray and other crop expenses.
DAIRY RELATED ACCRUAL EXPENSES 80 Hudson and Central New York Region Dairy Farms, 2010
Average My Farm Item Per Cow Per Cwt. Per Cow Per Cwt.
Purchased dairy grain & concentrate $ 1,211 $ 5.18 $ _________ $ _________ Purchased dairy roughage 69 0.30 __________ __________ Total Purchased Dairy Feed $ 1,280 $ 5.47 $ _________ $ _________ Purchased grain & concentrate as % of milk receipts 29% ______ % Purchased feed & crop expense $ 1,531 $ 6.55 $ _________ $ _________ Purchased feed & crop expense as % of milk receipts 37% ______ % Breeding $ 52 $ 0.22 $ _________ $ _________ Veterinary & medicine 145 0.62 __________ __________ Milk marketing 267 1.14 __________ __________ Bedding 78 0.34 __________ __________ Milking supplies 93 0.40 __________ __________ Cattle lease 1 0.01 __________ __________ Custom boarding 57 0.25 __________ __________ bST expense 39 0.17 Livestock professional fees 13 0.06 __________ __________ Other livestock expense 31 0.13 __________ __________

19
Capital and Labor Efficiency Analysis Capital efficiency factors measure how effectively the capital is being used in the farm business. Measures of labor efficiency are key indicators of management's success in generating products per unit of labor input. When evaluating a business, the relationship between capital efficiency and labor efficiency should be explored. For example, if capital effi-ciency shows high capital investment per worker or per cow, labor efficiency should be high reflecting use of capital to make labor more effective. However, if capital investment is high per worker or per cow, and labor efficiency is low, a problem may exist on that farm.
CAPITAL EFFICIENCY 80 Hudson and Central New York Region Dairy Farms, 2010
Item
Per Worker
Per Cow
Per Tillable Acre
Per Tillable Acre Owned
Farm capital $339,528 $9,040 $3,799 $11,108 Real estate 3,686 4,529 Machinery & equipment 65,066 1,732 728 Ratios Asset turnover Operating Expense Interest Expense Depreciation Expense 0.53 0.81 0.03 0.05 My Farm Farm capital $ _________ $ __________ $ _________ $ __________ Real estate _________ __________ _________ __________ Machinery & equipment _________ __________ _________ __________ Ratios Asset turnover Operating Expense Interest Expense Depreciation Expense ________ ________ ________ ________
LABOR FORCE INVENTORY 80 Hudson and Central New York Region Dairy Farms, 2010
Labor Force
Months
Age
Years of Education
Value of Labor & Management
Operator number 1 13.1 53 14 $38,249 Operator number 2 6.7 50 14 21,751 Operator number 3 2.2 38 14 6,886 Operator number 4 1.4 42 15 3,734 Family paid 4.4 Family unpaid 2.8 Hired 59.9 Total 90.5 / 12 = 7.54 Worker Equivalent 1.75 Operator/Manager Equivalent My Farm: Total ________ / 12 = ____ Worker Equivalent Operator’s ________ / 12 = ____ Operator/Manager Equivalent

20
Small conventional stall operations of 60 or less cows should strive for labor efficiency of 600,000 or more pounds of milk sold per worker. Large conventional stall operations should strive for 850,000 or more pounds of milk sold per worker. Small free stall operations of less than 300 cows should strive for 1,000,000 pounds of milk sold per worker and large free stall operations with more than 300 cows should strive for over 1,200,000 pounds of milk sold per worker.
LABOR EFFICIENCY 80 Hudson and Central New York Region Dairy Farms, 2010
Labor Average My Farm Efficiency Total Per Worker Total Per Worker Cows, average number 283 38 __________ ___________ Milk sold, pounds 6,624,656 878,893 __________ ___________ Tillable acres 674 89 __________ ___________
Labor costs and machinery costs should also be evaluated both individually and jointly. The more machinery or technology at a worker’s disposal, the less time, and therefore cost, that should be required to get work accomplished. Striv-ing for labor and machinery costs per cow of less than $1,000 on small conventional stall barns, less than $900 on large con-ventional stall barns, less than $850 on small free stall barns and below $750 on large free stall barns should be a goal.
LABOR AND MACHINERY COSTS 80 Hudson and Central New York Region Dairy Farms, 2010
Average My Farm Labor Costs
Total
Per Cow
Per Cwt.
Total
Per Cow
Per Cwt.
Value of operator(s) labor ($2,500/month) $ 58,275 $ 206 $ 0.88 $ ________ $ ______ $ _______ Family unpaid ($2,500/month) 6,950 25 0.10 ________ ______ _______ Hired 178,228 629 2.69 ________ ______ _______ Total Labor $ 243,453 $ 860 $ 3.67 $ ________ $ ______ $ _______ Machinery Cost $ 207,701 $ 733 $ 3.14 $ ________ $ ______ $ _______ Total Labor & Mach. $ 451,154 $ 1,593 $ 6.81 $ ________ $ ______ $ _______ Hired labor expense per hired worker equivalent $ 33,231 $ ________ Hired labor expense as % of milk sales 14.9% ________%

21
COMPARATIVE ANALYSIS OF THE FARM BUSINESS
Progress of the Farm Business Comparing your business with average data from regional DFBS cooperators that participated in both of the last two years can be helpful to establishing your goals for these parameters. It is equally important for you to determine the progress your business has made over the past two or three years, to compare this progress to your goals, and to set goals for the fu-ture.
PROGRESS OF THE FARM BUSINESS Same 71 Hudson and Central New York Region Dairy Farms, 2009 & 2010
Average of 71 Farms* My Farm Selected Factors 2009 2010 2009 2010 Goal Size of Business Average number of cows 282 297 __________ _________ _________ Average number of heifers 245 254 __________ _________ _________ Milk sold, pounds 6,585,891 6,975,847 __________ _________ _________ Worker equivalent 7.64 7.80 __________ _________ _________ Total tillable acres 682 711 __________ _________ _________ Rates of Production Milk sold per cow, pounds 23,346 23,450 __________ _________ _________ Hay DM per acre, tons 2.9 2.8 __________ _________ _________ Corn silage per acre, tons 16.6 17.90 __________ _________ _________ Labor Efficiency Cows per worker 37 38 __________ _________ _________ Milk sold/worker, pounds 862,028 894,339 __________ _________ _________ Cost Control Grain & conc. purchased as % of milk sales 39% 29% ________ % _______ % _______ % Dairy feed & crop expense per cwt. milk $ 6.71 $ 6.52 $ __________ $ _________ $ _________ Labor & mach. costs/cow $ 1,561 $ 1,587 $ __________ $ _________ $ _________ Operating cost of producing cwt. of milk $ 13.97 $ 14.77 $ __________ $ _________ $ _________ Capital Efficiency** Farm capital per cow $ 9,238 $ 9,007 $ __________ $ _________ $ _________ Mach. & equipment per cow $ 1,775 $ 1,722 $ __________ $ _________ $ _________ Asset turnover ratio 0.42 0.54 __________ _________ _________ Profitability Net farm income w/o apprec. $ -66,197 $ 158,379 $ __________ $ _________ $ _________ Net farm income w/apprec. $ -85,893 $ 188,625 $ __________ $ _________ $ _________ Labor & mgmt. income per operator/manager $ -92,645 $ 37,591 $ __________ $ _________ $ _________ Rate of return on equity capital w/appreciation -9.2 6.4 ________ % _______ % _______ % Rate of return on all capital w/appreciation -4.8 5.5 ________ % _______ % _______ % Financial Summary Farm net worth, end year $1,655,995 $1,776,393 $ __________ $ _________ $ _________ Debt to asset ratio .37 .35 __________ _________ _________ Farm debt per cow $ 3,305 $ 3,158 $ __________ $ _________ $ _________ *Farms participating both years. **Average for the year.
22
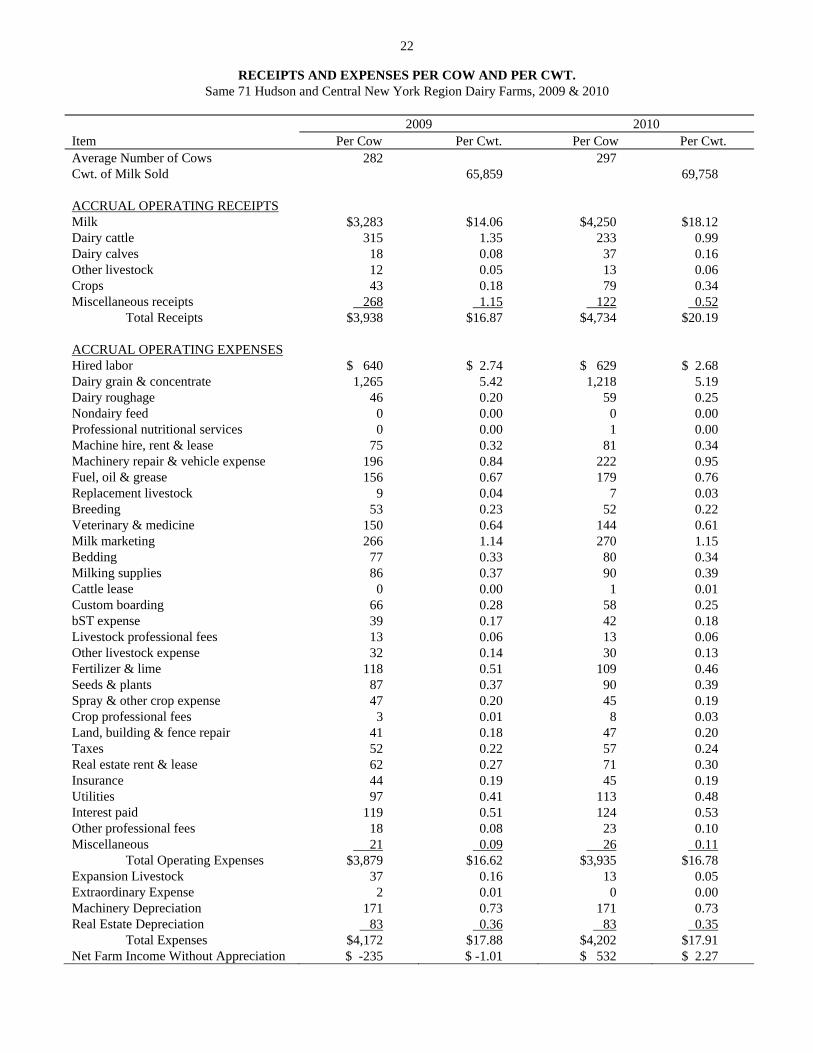
RECEIPTS AND EXPENSES PER COW AND PER CWT. Same 71 Hudson and Central New York Region Dairy Farms, 2009 & 2010
2009 2010 Item Per Cow Per Cwt. Per Cow Per Cwt. Average Number of Cows 282 297 Cwt. of Milk Sold 65,859 69,758 ACCRUAL OPERATING RECEIPTS Milk $3,283 $14.06 $4,250 $18.12 Dairy cattle 315 1.35 233 0.99 Dairy calves 18 0.08 37 0.16 Other livestock 12 0.05 13 0.06 Crops 43 0.18 79 0.34 Miscellaneous receipts 268 1.15 122 0.52 Total Receipts $3,938 $16.87 $4,734 $20.19 ACCRUAL OPERATING EXPENSES Hired labor $ 640 $ 2.74 $ 629 $ 2.68 Dairy grain & concentrate 1,265 5.42 1,218 5.19 Dairy roughage 46 0.20 59 0.25 Nondairy feed 0 0.00 0 0.00 Professional nutritional services 0 0.00 1 0.00 Machine hire, rent & lease 75 0.32 81 0.34 Machinery repair & vehicle expense 196 0.84 222 0.95 Fuel, oil & grease 156 0.67 179 0.76 Replacement livestock 9 0.04 7 0.03 Breeding 53 0.23 52 0.22 Veterinary & medicine 150 0.64 144 0.61 Milk marketing 266 1.14 270 1.15 Bedding 77 0.33 80 0.34 Milking supplies 86 0.37 90 0.39 Cattle lease 0 0.00 1 0.01 Custom boarding 66 0.28 58 0.25 bST expense 39 0.17 42 0.18 Livestock professional fees 13 0.06 13 0.06 Other livestock expense 32 0.14 30 0.13 Fertilizer & lime 118 0.51 109 0.46 Seeds & plants 87 0.37 90 0.39 Spray & other crop expense 47 0.20 45 0.19 Crop professional fees 3 0.01 8 0.03 Land, building & fence repair 41 0.18 47 0.20 Taxes 52 0.22 57 0.24 Real estate rent & lease 62 0.27 71 0.30 Insurance 44 0.19 45 0.19 Utilities 97 0.41 113 0.48 Interest paid 119 0.51 124 0.53 Other professional fees 18 0.08 23 0.10 Miscellaneous 21 0.09 26 0.11 Total Operating Expenses $3,879 $16.62 $3,935 $16.78 Expansion Livestock 37 0.16 13 0.05 Extraordinary Expense 2 0.01 0 0.00 Machinery Depreciation 171 0.73 171 0.73 Real Estate Depreciation 83 0.36 83 0.35 Total Expenses $4,172 $17.88 $4,202 $17.91 Net Farm Income Without Appreciation $ -235 $ -1.01 $ 532 $ 2.27
23
Regional Farm Business Chart
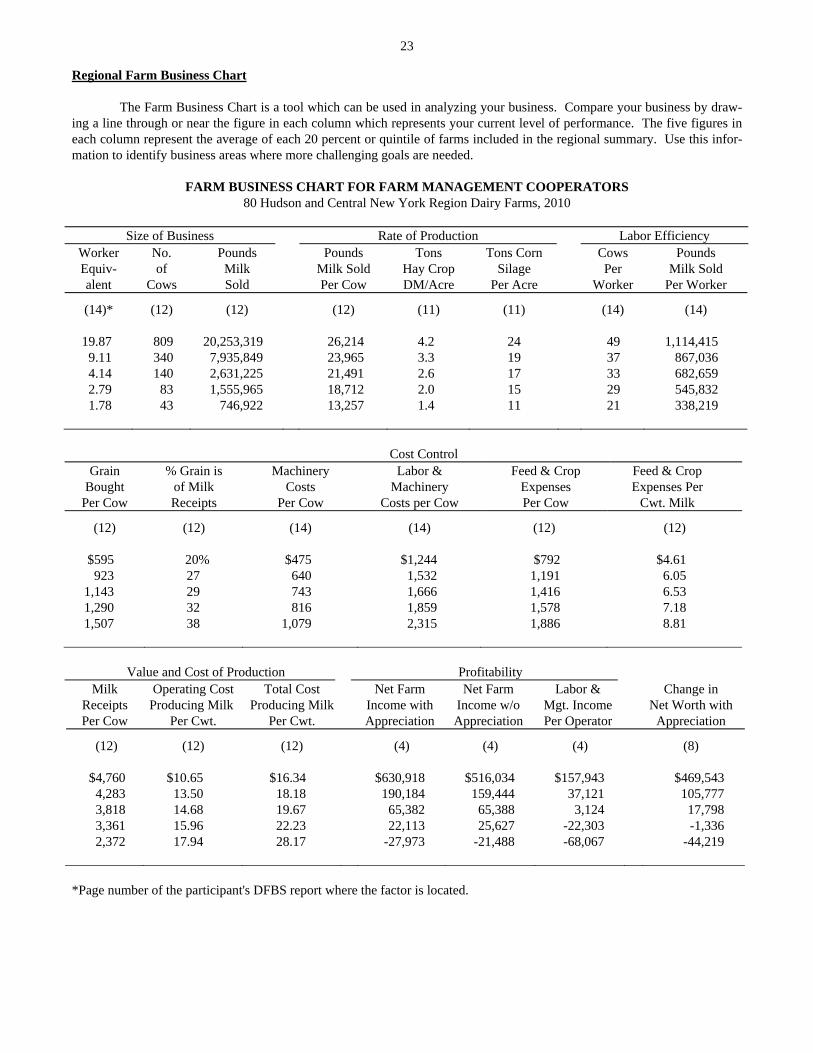
The Farm Business Chart is a tool which can be used in analyzing your business. Compare your business by draw-ing a line through or near the figure in each column which represents your current level of performance. The five figures in each column represent the average of each 20 percent or quintile of farms included in the regional summary. Use this infor-mation to identify business areas where more challenging goals are needed.
FARM BUSINESS CHART FOR FARM MANAGEMENT COOPERATORS 80 Hudson and Central New York Region Dairy Farms, 2010
Size of Business Rate of Production Labor Efficiency
Worker Equiv- alent
No. of
Cows
Pounds Milk Sold
Pounds Milk Sold Per Cow
Tons Hay Crop DM/Acre
Tons Corn Silage
Per Acre
Cows Per
Worker
Pounds Milk Sold
Per Worker
(14)* (12) (12) (12) (11) (11) (14) (14)
19.87 809 20,253,319 26,214 4.2 24 49 1,114,415 9.11 340 7,935,849 23,965 3.3 19 37 867,036 4.14 140 2,631,225 21,491 2.6 17 33 682,659
2.79 83 1,555,965 18,712 2.0 15 29 545,832 1.78 43 746,922 13,257 1.4 11 21 338,219
Cost Control Grain
Bought Per Cow
% Grain is of Milk Receipts
Machinery Costs
Per Cow
Labor & Machinery
Costs per Cow
Feed & Crop Expenses Per Cow
Feed & Crop Expenses Per
Cwt. Milk
(12) (12) (14) (14) (12) (12) $595 20% $475 $1,244 $792 $4.61 923 27 640 1,532 1,191 6.05 1,143 29 743 1,666 1,416 6.53 1,290 32 816 1,859 1,578 7.18 1,507 38 1,079 2,315 1,886 8.81
Value and Cost of Production Profitability Milk
Receipts Per Cow
Operating Cost Producing Milk
Per Cwt.
Total Cost Producing Milk
Per Cwt.
Net Farm Income with Appreciation
Net Farm Income w/o Appreciation
Labor & Mgt. Income Per Operator
Change in Net Worth with
Appreciation
(12) (12) (12)
(4) (4) (4)
(8) $4,760 $10.65 $16.34 $630,918 $516,034 $157,943 $469,543 4,283 13.50 18.18 190,184 159,444 37,121 105,777 3,818 14.68 19.67 65,382 65,388 3,124 17,798 3,361 15.96 22.23 22,113 25,627 -22,303 -1,336 2,372 17.94 28.17 -27,973 -21,488 -68,067 -44,219 *Page number of the participant's DFBS report where the factor is located.

24
Supplementary Information
Each year DFBS cooperators volunteer to complete supplementary data collection forms looking at selected man-agement aspects of the business or specific research areas being studied. This is in addition to the normal DFBS data collec-tion form. An area that was examined this year was the source of dairy replacements. Following is a summary of this in-formation.
SOURCE OF DAIRY REPLACEMENTS 29 New York Dairy Farms, 2010
Animals Entering Herd Average
Number calving in 2010 for first time 243 Animals purchased, %1 1% Animals raised by farm, %2 99%
Current Heifer Inventory
Raised on dairy, % 92% Raised by a custom grower, % 8%
1 Animals purchased are animals purchased from a different farm and were not the farm's genetics. 2 Animals raised by farm are animals that were born on the farm and entered the herd, which includes animals raised by the farm or custom grower.
On the average farm, 243 animals calved for the first time in 2010. The breakdown on these animals for source was 1 percent purchased and 99 percent raised by the farm. Of the current heifer inventory, 92 percent were raised on the dairy and 8 percent were raised by a custom grower. There is increased interest in evaluating the dairy replacement enterprise.
Milk Income and Marketing Expense Breakdown
Starting January 1st, 2000, the northeast switched to multiple components pricing, which changed the format of the milk check and how farmers received payment for their milk. To examine the breakdown of the gross milk income and the marketing expenses, 43 Hudson and Central New York farms provided data for all the different sources of income for milk sales and the milk marketing expenses on an accrual basis. This information is reported in the following two tables. The tables are divided into six different areas, each representing a different area of income or expenses.
The first section looks at the value of the milk components on a per cwt. basis. The second area looks at the Produc-er Price Differential. The third area looks at the premiums a farm receives. Any premiums not specifically noted as quality or volume-related are included in market premiums. The fourth area looks at the expenses associated with marketing milk. A new line item in this section is the expenses associated with utilizing forward contracting or hedging programs to market milk, such as commission or broker fees. The fifth area is income from forward contracting or hedging programs. The sixth area is the patronage dividends or refunds from the milk cooperatives. Equity purchased in the milk cooperative utilizing a monthly deduction from the milk check or a percent of the patronage dividend is treated as a capital purchase and is not a milk marketing expense. The cumulative total for these six areas is the net price received on farms. For participating farms, the net farm price can be found on page 12 of the DFBS report.
The table on page 25 reports the averages for these different areas. The table on page 26 contains the range for each of the individual lines of the report. This table is in farm business chart format with each item sorted independently and ranked by fifths. Numbers for the different areas will not add to the totals for that quintile or to the net price received because the highest farms for each item were averaged, not the same farms throughout the six areas. This table shows the range of income and expenses received by farms for all the different areas.
For your individual farm, compare your accrual numbers following this same format to look at how you compare to other farms in your region and to identify possible areas to generate additional revenue.

25
AVERAGE MILK INCOME AND MARKETING REPORT
43 Hudson and Central New York Region Dairy Farms, 2010
Pounds Percent Price/Pound Total $/Cwt of Milk
BASE FARM PRICE Butterfat 375,019 3.72% $1.85 $693,611 $6.88 Protein 310,853 3.08% $2.29 $712,605 $7.07 Solids 577,491 5.73% $0.17 $99,624 $0.99
Total Component Contribution $14.94
PPD 10,081,780 $201,453 $2.00
Base Farm Price $16.93
Premiums Quality $28,897 $0.29 Volume $28,852 $0.29 Market Premiums $60,492 $0.60
Total Premiums $1.17
BASE FARM PRICE + PREMIUM $18.11 Deductions Promotion $15,841 $0.16 Hauling + Stop Charges. $83,540 $0.83 Market Fees & Coop Dues $12,649 $0.13
Total Deductions $1.11
BASE FARM PRICE + PREMIUMS - DEDUCTIONS $17.00
Marketing Programs
Futures Contracts, Forward Contracting, Etc. $136 $0.00
Total Marketing Income $0.00
Patronage Dividends $5,817 $0.06
NET PRICE RECEIVED ON FARM, ALL SOURCES $17.06
PPD - Hauling, $ per cwt. $1.17
PPD - Hauling + Market Premiums, $ per cwt. $1.77 Net Marketing Value (PPD + Total Premiums - Total Deductions), $ per cwt. $2.06

26
MILK PRICE INFORMATION BY QUINTILE* (Each Category Sorted Independently)
43 Hudson and Central New York Region Dairy Farms, 2010
Lowest
Quintile Highest
Quintile Butterfat, % 3.56 3.67 3.76 3.82 4.10 Protein, % 2.96 3.04 3.07 3.12 3.34 Other Solids, % 5.58 5.69 5.72 5.75 5.79 Butterfat, $ per Cwt. 6.54 6.74 6.96 7.07 7.74 Protein, $ per Cwt. 6.72 6.99 7.08 7.19 7.55 Other solids, $ per Cwt. 0.92 1.01 1.02 1.02 1.04 Total Component Value per Cwt. $14.35 $14.72 $15.00 $15.21 $16.29 PPD, $ per Cwt. 1.74 1.92 1.98 2.05 2.30 Base Farm Price per Cwt. $16.26 $16.70 $16.93 $17.19 $18.44 Quality, $ per Cwt. 0.02 0.14 0.22 0.32 0.50 Volume, $ per Cwt. 0.00 0.03 0.14 0.30 0.57 Market premium, $ per Cwt. 0.18 0.40 0.43 0.65 1.05 Total Premium, $ per Cwt. 0.46 0.72 1.02 1.22 1.50 Base Farm Price + Premiums per Cwt. $17.16 $17.68 $17.93 $18.38 $19.25 Promotion, $ per Cwt. 0.15 0.15 0.15 0.15 0.15 Hauling, $ per Cwt. 0.47 0.65 0.81 0.97 1.21 Market fees & coop dues per Cwt. 0.05 0.10 0.13 0.16 0.25 Total Marketing Expenses per Cwt. $0.71 $0.93 $1.12 $1.27 $1.51 Base + Premiums – Deductions per Cwt. $16.01 $16.67 $16.98 $17.25 $18.02 Futures contract, forward contracting, $ per Cwt. -0.01 0.00 0.00 0.00 0.04 Total Marketing Income, $ per Cwt. $0.00 $0.00 $0.00 $0.00 $0.00 Patronage Dividends, $ per Cwt. $0.00 $0.00 $0.00 $0.02 $0.36 Net Price Received From All Sources, $ per Cwt. $16.11 $16.73 $17.01 $17.32 $18.14 PPD - Hauling, $ per cwt. 0.90 1.03 1.18 1.33 1.48 PPD - Hauling + Market Premiums, $ per cwt. 1.14 1.48 1.76 1.93 2.31 Net Marketing Value (PPD + Total Premiums - Total Deductions), $ per cwt.
1.09
1.64
1.95
2.25
2.50
*Data for each category are calculated independently of all others. Therefore, summation of individual categories will not equal total categories.

27
New York State Farm Business Charts The Farm Business Chart is a tool which can be used in analyzing a business by drawing a line through the figure in each column which represents the current level of management performance. The figure at the top of each column is the av-erage of the top 10 percent of the 204 farms for that factor. The other figures in each column are the average for the second 10 percent, third 10 percent, etc. Each column of the chart is independent of the others. The farms which are in the top 10 percent for one factor would not necessarily be the same farms which make up the top 10 percent for any other factor. The cost control factors are ranked from low to high, but the lowest cost is not necessarily the most profitable. In some cases, the "best" management position is somewhere near the middle or average. Many things affect the level of costs, and must be taken into account when analyzing the factors.
FARM BUSINESS CHART FOR FARM MANAGEMENT COOPERATORS 204 New York Dairy Farms, 2009
Size of Business Rates of Production Labor Efficiency
Worker Equiv- alent
No. of
Cows
Pounds Milk Sold
Pounds Milk Sold Per Cow
Tons Hay Crop DM/Acre
Tons Corn Silage
Per Acre
Cows Per
Worker
Pounds Milk Sold
Per Worker (14)* (12) (12) (12) (11) (11) (14) (14)
34.5 1,662 43,168,090 27,708 5.5 26 63 1,442,513 21.6 969 24,026,822 26,204 4.4 22 51 1,195,505 16.1 715 17,158,049 25,098 3.9 21 47 1,103,896 12.2 512 11,954,459 24,083 3.5 19 43 1,022,874 8.2 359 8,336,747 23,176 3.2 18 40 927,078 ----------------------------------------------------------------------------------------------------------------------------------------------------- 5.4 203 4,407,937 21,930 2.8 17 37 823,127 4.0 136 2,631,526 20,554 2.5 16 34 701,150 3.1 96 1,831,947 19,097 2.3 15 31 618,720 2.4 68 1,198,114 17,092 1.9 13 28 520,658 1.6 47 789,780 13,066 1.5 8 21 346,599
Cost Control Grain
Bought Per Cow
% Grain is of Milk Receipts
Machinery Costs
Per Cow
Labor & Machinery
Costs Per Cow
Feed & Crop Expenses Per Cow
Feed & Crop Expenses Per
Cwt. Milk (12) (12) (14) (14) (12) (12)
$556 24% $392 $1,050 $761 $4.61 827 31 507 1,241 1,073 5.39 938 33 568 1,348 1,233 5.83 1,039 36 611 1,425 1,311 6.15 1,124 37 653 1,478 1,407 6.41 ----------------------------------------------------------------------------------------------------------------------------------------------------- 1,189 39 688 1,537 1,494 6.67 1,259 41 726 1,614 1,557 6.94 1,340 43 779 1,709 1,638 7.25 1,441 46 834 1,852 1,752 7.64 1,656 52 1,044 2,273 2,045 9.01 *Page number of the participant's DFBS report where the factor is located.

28
FARM BUSINESS CHART FOR FARM MANAGEMENT COOPERATORS
204 New York Dairy Farms, 2009
Milk Receipts Per Cow
Milk Receipts Per Cwt.
Operating Cost Milk Production
Per Cow
Operating Cost Milk Production
Per Cwt.
Total Cost Milk Production Per Cow
Total Cost Milk Production Per Cwt.
(12) (12) (12) (12) (12) (12) $3,904 $15.04 $1,539 $9.36 $2,786 $14.64 3,615 14.46 2,107 11.18 3,286 15.73 3,472 14.20 2,412 12.03 3,529 16.34 3,343 13.99 2,604 12.45 3,724 17.04 3,212 13.82 2,863 13.07 3,892 17.59 ----------------------------------------------------------------------------------------------------------------------------------------------------- 3,001 13.68 3,031 13.54 4,070 18.31 2,815 13.50 3,193 14.15 4,235 18.90 2,586 13.33 3,437 14.69 4,399 19.92 2,310 13.11 3,726 15.62 4,595 21.92 1,786 12.65 4,115 17.20 5,037 25.94
Profitability Net Farm Income
Without Appreciation Net Farm Income
With Appreciation Labor &
Management Income
Total Per
Cow Operations
Ratio
Total Per
Cow Per
Farm Per
Operator (4) (12) (4) (4) (12) (4) (4)
$189,108 $621 0.17 $316,867 $689 $44,796 $29,113
50,933 261 0.08 73,223 359 -22,905 -15,857 21,392 129 0.03 32,127 166 -41,298 -27,377 4,190 25 0.01 6,546 49 -61,781 -39,543
-18,397 -107 -0.03 -19,455 -115 -89,481 -57,798 -----------------------------------------------------------------------------------------------------------------------------------------------------
-41,720 -215 -0.06 -38,756 -234 -131,913 -80,521 -70,753 -353 -0.11 -65,741 -320 -219,725 -116,887
-156,846 -502 -0.14 -138,222 -476 -322,905 -187,439 -338,128 -636 -0.19 -294,082 -645 -553,193 -302,719 -861,956 -1,025 -0.35 -945,904 -1,058 -1,234,813 -758,790
Farm Business Charts for farms with freestall barns and 150 cows or less, 151-300 cows, and more than 300 cows; and farms with conventional barns with 60 cows or less and more than 60 cows are shown on pages 32-36. Financial Analysis Chart The farm financial analysis chart on page 29 is designed just like the Farm Business Chart and may be used to assess the financial health of the farm business. Most of the financial measures used in the chart are defined on pages 6, 9, 13 and 19 of this publication. References to DFBS output page numbers for participating dairy farmers are provided in the table headings.

29
FINANCIAL ANALYSIS CHART 204 New York Dairy Farms, 2009
Liquidity (repayment)
Planned Debt
Payments Per Cow
Available
for Debt Service
Per Cow
Cash Flow Coverage
Ratio
Debt Coverage
Ratio
Debt Pay-ments
as Percent of Milk Sales
Debt Per Cow
Working Capital as % of Total Expenses
Current Ratio
(10)* (16) (10) (10) (10) (7) (7) (7) $129 $869 4.73 2.73 4% $207 48% 24.00 265 536 1.30 1.07 7 1,172 29 3.80 320 425 0.90 0.68 10 1,925 22 2.67 388 334 0.64 0.39 12 2,513 19 2.09 448 225 0.37 0.13 14 2,914 15 1.75 ----------------------------------------------------------------------------------- ------------------------------------------------------------------- 512 81 0.14 -0.03 17 3,517 11 1.48 592 -6 -0.06 -0.29 19 4,048 6 1.17 684 -132 -0.42 -0.57 22 4,632 0 0.94 841 -278 -0.73 -1.04 25 5,166 -6 0.72 1,321 -587 -1.87 -2.34 38 6,688 -25 0.30
Solvency Operational Ratios Debt/Asset Ratio Operating Interest Depreciation
Leverage Percent Current & Long Expense Expense Expense Ratio** Equity Intermediate Term Ratio Ratio Ratio
(7) (7) (7) (7) (14) (14) (14) 0.08 98% 0.02 0.00 0.73 0.00 0.02 0.19 88 0.11 0.00 0.83 0.01 0.04 0.28 81 0.22 0.03 0.86 0.02 0.05 0.39 75 0.27 0.11 0.89 0.02 0.06 0.53 69 0.35 0.22 0.91 0.03 0.07
----------------------------------------------------------------------------------- ------------------------------------------------------------------- 0.73 60 0.42 0.33 0.95 0.04 0.08 0.87 55 0.47 0.44 0.98 0.04 0.09 1.06 49 0.56 0.53 1.03 0.05 0.11 1.39 43 0.67 0.64 1.07 0.06 0.13 3.03 26 0.89 0.98 1.19 0.11 0.18
Efficiency (Capital) Profitability Asset
Turnover (ratio)
Real Estate Investment Per Cow
Machinery Investment Per Cow
Total Farm Assets
Per Cow
Change in Net Worth
With Appreciation
Percent Rate of Return with Appreciation on:
Equity Investment***
(14) (14) (14) (14) (8) (4) (4) 0.63 $1,882 $607 $6,103 $130,552 4% 4% 0.52 2,558 968 7,394 20,677 -1 1 0.48 2,940 1,229 7,972 -8,052 -3 -1 0.44 3,319 1,456 8,730 -30,384 -5 -2 0.40 3,639 1,618 9,230 -54,874 -7 -4
----------------------------------------------------------------------------------- ------------------------------------------------------------------- 0.37 4,097 1,803 9,754 -91,665 -10 -5 0.34 4,625 2,036 10,312 -168,225 -12 -7 0.30 5,339 2,255 11,366 -272,257 -15 -8 0.26 6,375 2,560 12,448 -460,184 -21 -10 0.19 8,932 3,659 15,218 -1,243,274 -46 -16
*Page number of the participant's DFBS report where the factor is located. **Dollars of debt per dollar of equity, computed by dividing total liabilities by total equity. ***Return on all farm capital (no deduction for interest paid) divided by total farm assets

30
Comparison by Type of Barn and Herd Size When analyzing a dairy farm business by comparing it to a group of farms, it is important that the group of farms have used as many of the same physical characteristics as possible as the farm being analyzed. To assist in this endeavor, dairy farms in the summary have been divided into those with freestall and those with conventional housing. Conventional housing includes stanchion and tiestall barns. Within each group, is a further classification by size of the dairy herd. The table on page 31 includes the average values for the resulting five groups of dairy farms. The average size of farms in the five groups ranges from 48 cows on the small conventional farms to 881 cows on the largest freestall farms. The largest freestall farms averaged the highest milk output per cow and per worker, the lowest total cost of produc-tion and investment per cow; however, in 2009 they had the lowest returns to labor, management and capital. Farm business charts have been computed for each of the five housing and herd size categories and are on pages 32-36. By comparing the farm's performance on the most appropriate business chart, a farm manager will be better able to eval-uate his or her business performance. Herd Size Comparisons A detailed comparison of profitability, financial situation and business analysis factors across herd sizes is contained on pages 48-60 of the 2009 State Summary*. In most years, as herd size increases, the net farm income increases (page 48)*; however, that was not the case for 2009. All herd size categories averaged a negative net farm income without appreciation. Net farm income without appreciation averaged $-1,939 per farm for the less than 60 cow farms and $-490,500 per farm for those with more than 900 cows. Return to all capital without appreciation generally increased as herd size increased. Assets, liabilities and financial measures are presented on pages 55-58*. All herd size categories saw a decrease in net worth during 2009. The largest herd size category experienced a decrease in net worth of $293,733. However, percent equity went down as assets increased. The 200 to 399 herd size category had the lowest percent equity; while the smaller herds averaged 77 percent. Crop yields showed little relationship to herd size, but fertilizer and lime expenses, and machinery cost per tillable acre generally increased as herd size increased (pages 59-60)*. The farms with more than 900 cows averaged more milk sold per cow than any other size category (page 60). With 25,229 pounds of milk sold per cow, farms in the largest herd size group averaged 8.8 percent more milk output per cow than the average of all herds in the summary with less than 900 cows. Farm capital per cow generally decreased as herd size increased. Milk sold per worker increased dramatically as herd size increased, ranging from 453,250 pounds at the lowest herd size category up to 1,217,421 pounds at the largest size category. *Wayne A. Knoblauch, Linda D. Putnam, and Jason Karszes, Dairy Farm Management Business Summary, New York, 2009, Department of Applied Economics and Management, Cornell University, R.B. 2010-02, November 2010.

31
SELECTED BUSINESS FACTORS BY TYPE OF BARN AND HERD SIZE 191 New York Dairy Farms, 2009
Conventional Freestall Item Farms with:
<= 60 Cows
>60 Cows
<=150 Cows
151-300 Cows
>300 Cows
Number of farms 23 25 27 24 92 Cropping Program Analysis Total Tillable acres 153 327 239 556 1,711 Tillable acres rented* 82 132 113 250 878 Hay crop acres* 123 228 150 319 768 Corn silage acres* 18 53 57 139 681 Hay crop, tons DM/acre 2.3 2.2 2.6 2.7 3.6 Corn silage, tons/acre 16 13.3 16.1 18.6 19.0 Oats, bushels/acre 45 73 79 55 67 Forage DM per cow, tons 8.4 8.1 7.9 8.3 8.3 Tillable acres/cow 3.3 3.5 2.7 2.7 2.0 Fertilizer & lime expense/tillable acre $27.94 $26.51 $33.97 $54.76 $48.73 Total machinery costs $34,204 $61,040 $70,419 $158,061 $585,211 Machinery cost/tillable acre $214 $187 $243 $284 $336
Dairy Analysis Number of cows 48 93 103 210 881 Number of heifers 40 79 84 179 734 Milk sold, lbs. 854,175 1,713,249 1,981,491 4,605,848 22,034,738 Milk sold/cow, lbs. 17,844 18,446 19,328 21,928 25,024 Operating cost of producing milk/cwt. $12.16 $13.13 $12.42 $13.03 $13.81 Total cost of producing milk/cwt. $21.52 $20.43 $18.51 $17.65 $16.82 Price/cwt. milk sold $13.44 $13.45 $13.81 $13.71 $13.90 Purchased dairy feed/cow $891 $1,044 $1,207 $1,155 $1,358 Purchased dairy feed/cwt. milk $5.00 $5.66 $6.24 $5.27 $5.43 Purchased grain & concentrate as % of milk receipts
35%
41%
39%
38%
38%
Purchased feed & crop expense/cwt milk $5.99 $6.58 $7.21 $6.36 $6.38
Capital Efficiency Farm capital/worker $296,563 $325,893 $313,395 $368,757 $405,869 Farm capital/cow $11,523 $11,298 $9,538 $9,481 $8,905 Farm capital/tillable acre owned $7,765 $5,385 $7,760 $6,504 $9,408 Real estate/cow $5,772 $5,506 $4,368 $3,994 $3,563 Machinery investment/cow $2,383 $2,200 $1,763 $1,741 $1,505 Asset turnover ratio 0.26 0.26 0.34 0.38 0.46
Labor Efficiency Worker equivalent 1.86 3.22 3.11 5.41 19.32 Operator/manager equivalent 1.09 1.47 1.52 2.01 2.14 Milk sold/worker, lbs. 458,823 531,652 636,283 852,014 1,140,662 Cows/worker 26 29 33 39 46 Labor cost/cow $1,124 978 $862 $800 $787 Labor cost/tillable acre $352 $278 $370 $302 $405
Profitability & Balance Sheet Analysis Net farm income (without appreciation) $-2,315 $-16,922 $-1,745 $-28,801 $-260,522 Labor & management income/operator $-31,550 $-47,833 $-29,326 $-49,465 $-239,395 Rate return on all capital with appreciation -7.0% -6.9% -5.0% -4.9% -3.2% Farm debt/cow $2,661 $3,160 $2,921 $3,177 $3,388 Percent equity 77% 72% 68% 66% 61%*Average of all farms, not only those reporting data.

32
FARM BUSINESS CHART FOR SMALL CONVENTIONAL STALL DAIRY FARMS 23 Conventional Stall Dairy Farms with 60 or Less Cows, New York, 2009
Size of Business Rates of Production Labor Efficiency
Worker Equiv- alent
No. of
Cows
Pounds Milk Sold
Pounds Milk Sold Per Cow
Tons Hay Crop DM/Acre
Tons Corn Silage
Per Acre
Cows Per
Worker
Pounds Milk Sold
Per Worker (14)* (12) (12) (12) (11) (11) (14) (14) 2.75 57 1,166,624 23,699 4.5 22 41 814,988 2.48 55 1,054,704 22,630 3.5 20 35 700,081 2.22 52 1,027,653 21,999 2.8 20 31 627,340 2.04 51 1,019,893 20,747 2.4 19 31 569,357 2.00 51 1,002,706 19,706 2.3 18 29 531,012
------------------------------------------------------------------------------------------------------------------------------------------------------- 1.79 50 965,943 18,647 2.2 16 26 469,700 1.63 47 900,255 18,247 2.0 15 25 432,381 1.58 46 736,147 15,835 1.8 15 24 391,392 1.50 43 630,256 13,205 1.7 12 21 312,985 1.25 37 423,753 10,155 1.5 7 18 232,739
Cost Control Grain
Bought Per Cow
% Grain is of Milk Receipts
Machinery Costs
Per Cow
Labor & Machinery
Costs Per Cow
Feed & Crop Expenses Per Cow
Feed & Crop Expenses Per
Cwt. Milk (12) (12) (14) (14) (12) (12)
$366 21% $444 $1,265 $466 $4.26 622 28 528 1,482 827 4.74 715 33 607 1,659 925 5.45 798 36 645 1,746 1,016 6.07 881 37 666 1,868 1,077 6.31 ------------------------------------------------------------------------------------------------------------------------------------------------------- 938 39 754 1,991 1,173 6.46 955 40 794 2,120 1,263 6.56 1,054 40 879 2,160 1,319 6.86 1,107 43 938 2,263 1,456 7.02 1,269 44 1,126 2,473 1,633 7.49
Value and Cost of Production Profitability Milk
Receipts Operating Cost Producing Milk
Total Cost Production
Net Farm Income Without Appreciation
Labor & Mgmt. Income
Change in Net Worth
Per Cow Per Cwt. Per Cwt. Total Per Cow Per Operator w/Appreciation (12) (12) (12) (4) (12) (4) (8)
$3,220 $7.64 $16.31 $44,417 $931 $10,108 $60,332 3,074 10.10 18.97 30,319 617 -6,583 34,450 2,878 11.11 20.13 16,506 327 -12,640 26,646 2,804 11.35 20.62 10,951 212 -21,467 10,692 2,660 12.26 21.20 4,899 92 -23,274 1,252 ------------------------------------------------------------------------------------------------------------------------------------------------------- 2,528 12.90 22.42 1,350 30 -26,611 -3,844 2,404 13.41 23.00 -2,281 -53 -35,102 -9,513 2,174 13.59 25.02 -10,140 -225 -37,137 -17,266 1,774 14.46 27.53 -20,302 -415 -50,867 -24,671 1,322 19.81 34.87 -58,077 -1,274 -75,119 -38,682
*Page number of the participant’s DFBS report where the factor is located.

33
FARM BUSINESS CHART FOR LARGE CONVENTIONAL STALL DAIRY FARMS 25 Conventional Stall Dairy Farms with More Than 60 Cows, New York, 2009
Size of Business Rates of Production Labor Efficiency
Worker Equiv- alent
No. of
Cows
Pounds Milk Sold
Pounds Milk Sold Per Cow
Tons Hay Crop DM/Acre
Tons Corn Silage
Per Acre
Cows Per
Worker
Pounds Milk Sold
Per Worker (14)* (12) (12) (12) (11) (11) (14) (14) 6.20 151 3,110,205 24,463 4.4 27 64 961,921 4.65 133 2,347,372 22,085 3.6 25 43 801,367 4.04 120 2,244,457 21,533 3.2 19 41 698,749 3.64 105 2,129,390 20,958 2.7 17 35 660,705 3.53 99 1,968,372 20,320 2.6 15 32 646,832
------------------------------------------------------------------------------------------------------------------------------------------------------- 3.16 85 1,671,792 19,100 2.4 15 30 579,244 2.91 79 1,463,721 17,581 2.2 12 28 530,941 2.62 75 1,320,625 15,975 2.0 9 26 483,325 2.06 67 1,036,449 14,505 1.7 8 22 357,151 1.41 64 917,955 12,439 1.1 6 18 292,357
Cost Control Grain
Bought Per Cow
% Grain is of Milk Receipts
Machinery Costs
Per Cow
Labor & Machinery
Costs Per Cow
Feed & Crop Expenses Per Cow
Feed & Crop Expenses Per
Cwt. Milk (12) (12) (14) (14) (12) (12)
$586 24% $307 $1,056 $711 $4.58 812 33 448 1,146 985 5.66 885 37 514 1,344 1,108 6.08 935 39 574 1,474 1,186 6.32 992 42 643 1,661 1,279 6.72 ------------------------------------------------------------------------------------------------------------------------------------------------------- 1,093 44 697 1,745 1,333 7.06 1,141 45 761 1,911 1,382 7.48 1,181 48 814 2,012 1,454 7.83 1,199 52 847 2,232 1,533 7.98 1,442 61 1,124 2,506 1,557 9.35
Value and Cost of Production Profitability Milk
Receipts Operating Cost Producing Milk
Total Cost Production
Net Farm Income Without Appreciation
Labor & Mgmt. Income
Change in Net Worth
Per Cow Per Cwt. Per Cwt. Total Per Cow Per Operator w/Appreciation (12) (12) (12) (4) (12) (4) (8)
$3,406 $8.50 $15.78 $71,365 $653 $-3,608 $154,271 3,074 11.50 18.04 24,951 362 -20,187 35,152 2,918 12.37 19.17 16,883 204 -24,084 16,525 2,739 13.03 20.71 9,331 107 -25,483 -3,254 2,720 13.82 21.78 -6,950 -84 -29,384 -14,599 ------------------------------------------------------------------------------------------------------------------------------------------------------ 2,605 14.27 22.40 -20,299 -201 -37,412 -23,170 2,300 15.29 22.87 -27,719 -327 -52,118 -28,093 2,175 15.98 23.43 -42,035 -459 -64,432 -50,046 1,912 16.12 23.86 -53,888 -602 -90,066 -87,164 1,695 16.80 27.23 -74,128 -768 -138,716 -130,673
*Page number of the participant’s DFBS report where the factor is located.

34
FARM BUSINESS CHART FOR SMALL FREESTALL DAIRY FARMS 27 Freestall Barn Dairy Farms with 150 or Less Cows, New York, 2009
Size of Business Rates of Production Labor Efficiency
Worker Equiv- alent
No. of
Cows
Pounds Milk Sold
Pounds Milk Sold Per Cow
Tons Hay Crop DM/Acre
Tons Corn Silage
Per Acre
Cows Per
Worker
Pounds Milk Sold
Per Worker (14)* (12) (12) (12) (11) (11) (14) (14) 4.46 148 3,266,103 25,870 4.7 21 46 1,035,790 4.22 138 2,853,280 23,508 4.5 19 39 872,668 3.96 132 2,555,275 22,143 3.8 18 36 746,248 3.55 122 2,428,802 20,385 3.1 18 35 677,152 3.35 107 2,104,906 20,109 2.8 17 34 647,301
------------------------------------------------------------------------------------------------------------------------------------------------------- 3.12 100 1,911,494 19,133 2.7 17 33 617,446 2.87 95 1,719,822 18,025 2.5 15 32 589,966 2.61 86 1,484,959 17,310 2.3 15 31 546,787 2.29 74 1,300,764 16,502 1.8 14 29 501,267 1.85 61 1,099,570 13,877 1.5 9 26 426,547
Cost Control Grain
Bought Per Cow
% Grain is of Milk Receipts
Machinery Costs
Per Cow
Labor & Machinery
Costs Per Cow
Feed & Crop Expenses Per Cow
Feed & Crop Expenses Per
Cwt. Milk (12) (12) (14) (14) (12) (12)
$467 21% $314 $1,023 $787 $4.48 769 30 479 1,273 1,128 5.87 896 34 514 1,380 1,210 6.43 987 38 545 1,449 1,250 6.80 1,069 40 607 1,507 1,293 7.18 ------------------------------------------------------------------------------------------------------------------------------------------------------- 1,119 43 698 1,569 1,449 7.51 1,172 45 749 1,658 1,564 7.91 1,319 47 833 1,769 1,649 8.79 1,415 51 910 1,864 1,774 9.06 1,614 53 935 1,985 2,386 11.07
Value and Cost of Production Profitability Milk
Receipts Operating Cost Producing Milk
Total Cost Production
Net Farm Income Without Appreciation
Labor & Mgmt. Income
Change in Net Worth
Per Cow Per Cwt. Per Cwt. Total Per Cow Per Operator w/Appreciation (12) (12) (12) (4) (12) (4) (8)
$3,523 $8.77 $15.39 $66,096 $703 $7,874 $68,524 3,279 10.02 15.68 45,760 439 7,181 43,616 3,072 10.81 17.07 41,317 385 1,281 20,745 2,880 11.65 17.91 32,225 302 -13,034 679 2,764 12.26 18.43 22,419 203 -14,720 -19,767 ------------------------------------------------------------------------------------------------------------------------------------------------------- 2,569 13.18 18.92 11,144 121 -33,906 -40,170 2,423 13.81 19.94 -14,163 -183 -45,973 -49,207 2,337 14.52 22.96 -36,946 -350 -55,457 -57,158 2,287 14.84 23.70 -54,221 -482 -63,526 -85,191 1,983 16.03 25.89 -78,278 -876 -83,719 -136,978 *Page number of the participant’s DFBS report where the factor is located.
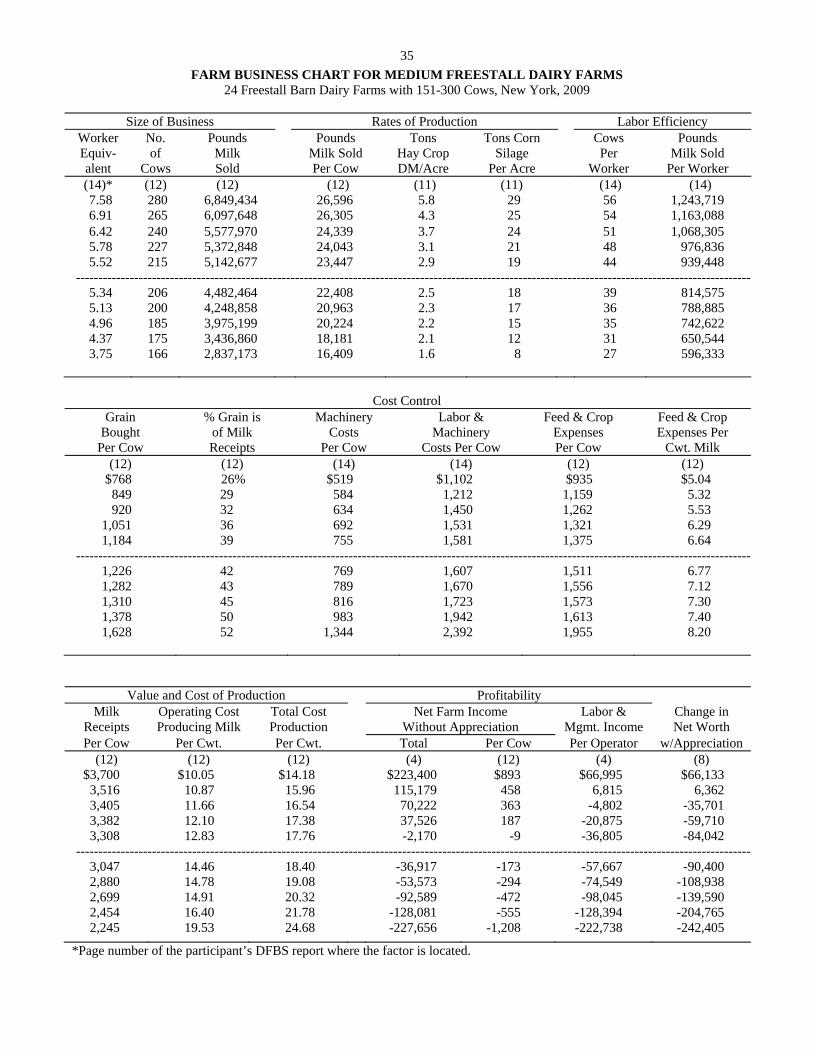
35
FARM BUSINESS CHART FOR MEDIUM FREESTALL DAIRY FARMS 24 Freestall Barn Dairy Farms with 151-300 Cows, New York, 2009
Size of Business Rates of Production Labor Efficiency
Worker Equiv- alent
No. of
Cows
Pounds Milk Sold
Pounds Milk Sold Per Cow
Tons Hay Crop DM/Acre
Tons Corn Silage
Per Acre
Cows Per
Worker
Pounds Milk Sold
Per Worker (14)* (12) (12) (12) (11) (11) (14) (14) 7.58 280 6,849,434 26,596 5.8 29 56 1,243,719 6.91 265 6,097,648 26,305 4.3 25 54 1,163,088 6.42 240 5,577,970 24,339 3.7 24 51 1,068,305 5.78 227 5,372,848 24,043 3.1 21 48 976,836 5.52 215 5,142,677 23,447 2.9 19 44 939,448
------------------------------------------------------------------------------------------------------------------------------------------------------- 5.34 206 4,482,464 22,408 2.5 18 39 814,575 5.13 200 4,248,858 20,963 2.3 17 36 788,885 4.96 185 3,975,199 20,224 2.2 15 35 742,622 4.37 175 3,436,860 18,181 2.1 12 31 650,544 3.75 166 2,837,173 16,409 1.6 8 27 596,333
Cost Control Grain
Bought Per Cow
% Grain is of Milk Receipts
Machinery Costs
Per Cow
Labor & Machinery
Costs Per Cow
Feed & Crop Expenses Per Cow
Feed & Crop Expenses Per
Cwt. Milk (12) (12) (14) (14) (12) (12)
$768 26% $519 $1,102 $935 $5.04 849 29 584 1,212 1,159 5.32 920 32 634 1,450 1,262 5.53 1,051 36 692 1,531 1,321 6.29 1,184 39 755 1,581 1,375 6.64 ------------------------------------------------------------------------------------------------------------------------------------------------------- 1,226 42 769 1,607 1,511 6.77 1,282 43 789 1,670 1,556 7.12 1,310 45 816 1,723 1,573 7.30 1,378 50 983 1,942 1,613 7.40 1,628 52 1,344 2,392 1,955 8.20
Value and Cost of Production Profitability Milk
Receipts Operating Cost Producing Milk
Total Cost Production
Net Farm Income Without Appreciation
Labor & Mgmt. Income
Change in Net Worth
Per Cow Per Cwt. Per Cwt. Total Per Cow Per Operator w/Appreciation (12) (12) (12) (4) (12) (4) (8)
$3,700 $10.05 $14.18 $223,400 $893 $66,995 $66,133 3,516 10.87 15.96 115,179 458 6,815 6,362 3,405 11.66 16.54 70,222 363 -4,802 -35,701 3,382 12.10 17.38 37,526 187 -20,875 -59,710 3,308 12.83 17.76 -2,170 -9 -36,805 -84,042 ------------------------------------------------------------------------------------------------------------------------------------------------------- 3,047 14.46 18.40 -36,917 -173 -57,667 -90,400 2,880 14.78 19.08 -53,573 -294 -74,549 -108,938 2,699 14.91 20.32 -92,589 -472 -98,045 -139,590 2,454 16.40 21.78 -128,081 -555 -128,394 -204,765 2,245 19.53 24.68 -227,656 -1,208 -222,738 -242,405
*Page number of the participant’s DFBS report where the factor is located.

36
FARM BUSINESS CHART FOR LARGE FREESTALL DAIRY FARMS 92 Freestall Barn Dairy Farms with 300 or More Cows, New York, 2009
Size of Business Rates of Production Labor Efficiency
Worker Equiv- Alent
No. of
Cows
Pounds Milk Sold
Pounds Milk Sold Per Cow
Tons Hay Crop DM/Acre
Tons Corn Silage
Per Acre
Cows Per
Worker
Pounds Milk Sold
Per Worker (14)* (12) (12) (12) (11) (11) (14) (14) 41.78 2,143 56,150,342 28,614 5.9 26 63 1,607,559 29.50 1,301 33,356,512 26,931 4.6 23 53 1,315,236 23.66 1,084 27,294,228 26,276 4.2 21 50 1,233,968 21.32 936 23,124,149 25,815 3.9 20 48 1,168,917 18.51 816 20,257,627 25,133 3.6 19 47 1,121,327
------------------------------------------------------------------------------------------------------------------------------------------------------- 16.17 696 17,283,563 24,540 3.4 18 44 1,076,082 14.05 616 14,313,270 23,967 3.1 17 42 1,031,329 12.57 513 12,324,387 23,353 2.9 16 40 980,946 10.33 445 10,402,631 22,582 2.6 15 37 920,130 7.60 362 8,623,291 20,199 1.9 13 33 791,677
Cost Control Grain
Bought Per Cow
% Grain is of Milk Receipts
Machinery Costs
Per Cow
Labor & Machinery
Costs Per Cow
Feed & Crop Expenses Per Cow
Feed & Crop Expenses Per
Cwt. Milk (12) (12) (14) (14) (12) (12)
$1,735 28% $441 $1,115 $1,203 $4.99 1,522 32 555 1,252 1,380 5.63 1,446 33 593 1,339 1,446 5.88 1,372 36 631 1,381 1,507 6.11 1,294 37 661 1,432 1,558 6.30 ------------------------------------------------------------------------------------------------------------------------------------------------------- 1,258 38 685 1,470 1,620 6.56 1,212 40 709 1,512 1,688 6.83 1,157 42 751 1,583 1,755 7.12 1,074 44 797 1,675 1,834 7.49 907 50 890 1,872 2,115 8.65
Value and Cost of Production Profitability
Milk Receipts
Operating Cost Producing Milk
Total Cost Production
Net Farm Income Without Appreciation
Labor & Mgmt. Income
Change in Net Worth
Per Cow Per Cwt. Per Cwt. Total Per Cow Per Operator w/Appreciation (12) (12) (12) (4) (12) (4) (8)
$4,050 $11.23 $14.31 $267,895 $335 $30,240 $195,183 3,782 12.23 15.39 81,042 118 -49,213 -11,763 3,648 12.62 15.91 13,375 22 -87,226 -83,254 3,561 13.08 16.29 -40,315 -65 -117,198 -190,702 3,494 13.49 16.70 -97,798 -146 -166,437 -262,591 ------------------------------------------------------------------------------------------------------------------------------------------------------- 3,395 13.90 17.14 -206,354 -246 -212,462 -313,100 3,319 14.37 17.50 -310,032 -432 -266,975 -399,069 3,234 14.82 18.15 -411,532 -545 -374,959 -609,554 3,087 15.71 18.66 -584,504 -640 -503,718 -855,267 2,865 16.60 19.36 -1,178,954 -920 -1,046,215 -1,681,781
*Page number of the participant's DFBS report where the factor is located.

37
IDENTIFY AND SET GOALS If businesses are to be successful, they must have direction. Written goals help provide businesses with an identifia-ble direction over both the long and short term. Goal setting is as important on a dairy farm as it is in other businesses. Writ-ten goals are a tool which farm operators can use to ensure that the business continues to move in the desired direction. Goals should be SMART: 1. Goals should be Specific. 2. Goals should be Measurable. 3. Goals should be Achievable but challenging. 4. Goals should be Rewarding. 5. Goals should be Timed with a designated date by which the goal will be achieved. Goal setting on a dairy farm should be a process for writing down and agreeing on goals that you have already given some thought to. It is also important to remember that once you write out your goals they are not cast in concrete. If a change takes place which has a major impact on the farm business, the goals should be reworked to accommodate that change. Refer to your goals as often as necessary to keep the farm business progressing. It is important to identify both objectives (long-range) and goals (short-range) when looking at the future of your farm business. A suggested format for writing out your goals is as follows:
a. Begin with a mission statement which describes why the business exists based on the preferences and val-
ues of the owners. b. Identify 4-6 objectives. c. Identify SMART goals.
Worksheet for Setting Goals I. Mission and Objectives

38
Worksheet for Setting Goals (Continued) II. Goals What How When Who is Responsible Summarize Your Business Performance The Farm Business and Financial Analysis Charts on pages 23 and 27-29 can be used to help identify strengths and weaknesses of your farm business. Identify three major strengths and three areas of your farm business that need improve-ment. Strengths: Needs improvement:

39
GLOSSARY AND LOCATION OF COMMON TERMS Accounts Payable - Open accounts or bills owed to feed and supply firms, cattle dealers, veterinarians and other pro-viders of farm services and supplies. Accounts Receivable - Outstanding receipts from items sold or sales proceeds not yet received, such as the payment for December milk sales received in January. Accrual Expenses - (defined on page 3) Accrual Receipts - (defined on page 4) Annual Cash Flow Statement - (defined on page 11) Appreciation - (defined on page 5) Asset Turnover Ratio - The ratio of total farm income to total farm assets, calculated by dividing total accrual operat-ing receipts plus appreciation by average total farm assets. Balance Sheet - A "snapshot" of the business financial position at a given point in time, usually December 31. The bal-ance sheet equates the value of assets to liabilities plus net worth. bST Usage - An estimate of the percentage of herd, on average, that was supplemented with bovine somatotropin during the year. Capital Efficiency - The amount of capital invested per production unit. Relatively high investments per worker with low to moderate investments per cow imply efficient use of capital. Cash From Nonfarm Capital Used in the Business - Transfers of money from nonfarm savings or investments to the farm business where it is used to pay operating expenses, make debt payments and/or capital purchases. Cash Flow Coverage Ratio - (defined on page 13) Cash Paid - (defined on page 2) Cash Receipts - (defined on page 4) Change in Accounts Payable - (defined on page 3) Change in Accounts Receivable - (defined on page 4) Change in Inventory - (defined on page 2) Cost of Term Debt - A weighted average of the cost of borrowed capital to the farm. Calculate by multiplying end of year principal of each loan that is borrowed by the interest rate for each loan at that time. Add up each amount that is calculated for each loan and then divide by total amount of borrowed funds. Do not include accounts payable, operating debt or advanced government receipts. This information is found on pages 8 & 9 of the data entry form. Culling Rate - (defined on page 17) Current Portion - (defined on page 7) Current Ratio – Measures the extent to which current farm assets, if liquidated, would cover current farm liabilities. Calculated as current farm assets at end year divided by current farm liabilities at end year. Dairy (farm) - A farm business where dairy farming is the primary enterprise, operating and managing this farm is a full-time occupation for one or more people and cropland is owned. Dairy Cash-Crop (farm) - Operating and managing this farm is the full-time occupation of one or more people, cropland is owned but crop sales exceed 10 percent of accrual milk receipts.

40
Debt Coverage Ratio – (defined on page 13) Debt Per Cow - Total end-of-year debt divided by end-of-year number of cows. Debt to Asset Ratios - (defined on page 9) Depreciation Expense Ratio – Machinery and building depreciation divided by total accrual receipts. Dry Matter - The amount or proportion of dry material that remains after all water is removed. Commonly used to measure dry matter percent and tons of dry matter in feed. Equity Capital - The farm operator/manager's owned capital or farm net worth. Expansion Livestock - Purchased dairy cattle and other livestock that cause an increase in herd size from the beginning to the end of the year. Farm Debt Payments as Percent of Milk Sales - Amount of milk income committed to debt repayment, calculated by dividing planned debt payments by total milk receipts. A reliable measure of repayment ability, see page 14. Farm Debt Payments Per Cow - Planned or scheduled debt payments per cow represent the repayment plan scheduled at the beginning of the year divided by the average number of cows for the year. This measure of repayment ability is used in the Financial Analysis Chart. Financial Lease - A long-term non-cancelable contract giving the lessee use of an asset in exchange for a series of lease payments. The term of a financial lease usually covers a major portion of the economic life of the asset. The lease is a substitute for purchase. The lessor retains ownership of the asset. Hired Labor Expense per Hired Worker Equivalent – The total cost to the farm per hired worker equivalent. Divide accrual hired labor expense by number of hired plus family paid worker equivalents. Hired Labor Expense as % of Milk Sales – The percentage of the gross milk receipts that is used for labor expense. Divide accrual hired labor expense by accrual milk sales. Income Statement - A complete and accurate account of farm business receipts and expenses used to measure profita-bility over a period of time such as one year or one month. Interest Expense Ratio – Accrual interest expense divided by total accrual receipts. Labor and Management Income - (defined on page 6) Labor and Management Income Per Operator - The return to the owner/manager's labor and management per full-time operator. Labor Efficiency - Production capacity and output per worker. Leverage Ratio - (defined on page 9) Liquidity - Ability of business to generate cash to make debt payments or to convert assets to cash. Net Farm Income - (defined on page 5) Net Farm Income from Operations Ratio - (defined on page 7) Net Milk Receipts – Accrual milk receipts less milk marketing expense. Net Worth - The value of assets less liabilities equal net worth. It is the equity the owner has in owned assets. Operating Costs of Producing Milk - (defined on page 18)

41
Operating Expense Ratio – Total accrual expenses less interest and machinery and building depreciation, divided by total accrual receipts. Opportunity Costs - The cost or charge made for using a resource based on its value in its most likely alternative use. The opportunity cost of a farmer's labor and management is the value he/she would receive if employed in his/her most qualified alternative position. Other Livestock Expenses - All other dairy herd and livestock expenses not included in more specific categories. Oth-er livestock expenses include; DHIC, registration fees and transfers. Part-Time Dairy (farm) - Dairy farming is the primary enterprise, cropland is owned but operating and managing this farm is not a full-time occupation for one or more people. Personal Withdrawals and Family Expenditures Including Nonfarm Debt Payments - All the money removed from the farm business for personal or nonfarm use including family living expenses, health and life insurance, income taxes, nonfarm debt payments, and investments. Profitability - The return or net income the owner/manager receives for using one or more of his or her resources in the farm business. True "economic profit" is what remains after deducting all the costs including the opportunity costs of the owner/manager's labor, management, and equity capital. Purchased Inputs Cost of Producing Milk - (defined on page 18) Renter - Farm business owner/operator owns no tillable land and commonly rents all other farm real estate. Repayment Analysis - An evaluation of the business' ability to make planned debt payments. Replacement Livestock - Dairy cattle and other livestock purchased to replace those that were culled or sold from the herd during the year. Return on Equity Capital - (defined on page 7) Return on Total Capital - (defined on page 7) Solvency - The extent or ability of assets to cover or pay liabilities. Debt/asset and leverage ratios are common measures of solvency. Total Costs of Producing Milk - (defined on page 18) Whole Farm Method - A procedure used to calculate costs of producing milk on dairy farms without using enterprise cost accounts. All non-milk receipts are assigned a cost equal to their sale value and deducted from total farm expenses to determine the costs of producing milk. Working Capital – A theoretical measure of the amount of funds available to purchase inputs and inventory items after the sale of current farm assets and payment of all current farm liabilities. Calculated as current farm assets at end year less current farm liabilities at end year.

42
INDEX Page(s) Page(s) Accounts Payable ..................................................... 3,8 Accounts Receivable ............................................... 4,8 Accrual Expenses ..................................................... 3,5 Accrual Receipts ...................................................... 4,5 Acreage ..................................................................... 15 Advanced Government Receipts .............................. 7,8 Age ........................................................................... 19 Amount Available for Debt Service ......................... 13 Annual Cash Flow Statement ................................... 11 Appreciation .........................................................10,17 Asset Turnover Ratio ................................................ 19 Balance Sheet ............................................................. 8 Barn Type ................................................................... 2 bST Usage ................................................................... 2 Business Type ............................................................. 2 Capital Efficiency ..................................................... 19 Cash From Nonfarm Capital Used in the Business ..................................................... 11 Cash Flow Coverage Ratio ....................................... 13 Cash Paid .................................................................... 2 Cash Receipts ........................................................ 4,11 Certified Organic Milk Producer ................................ 2 Change in Accounts Payable ...................................... 3 Change in Accounts Receivable ................................. 4 Change in Inventory ................................................ 2,3 Change in Net Worth ................................................ 10 Cost of Term Debt .................................................... 9 Crop Expenses ....................................................... 3,16 Crop/Dairy Ratios ..................................................... 15 Culling Rate .............................................................. 17 Current Portion ........................................................ 7,8 Current Ratio .............................................................. 9 Dairy (farm) ................................................................ 2 Dairy Cash-Crop (farm) .............................................. 2 Dairy Replacements .................................................. 24 Debt Coverage Ratio ................................................. 13 Debt per Cow .............................................................. 9 Debt to Asset Ratios ................................................... 9 Deferred Taxes............................................................ 9 Depreciation ............................................................ 3, 9 Depreciation Expense Ratio ...................................... 19 Dry Matter ................................................................ 15 Education .................................................................. 19 Equity Capital ............................................................. 7 Expansion Livestock .............................................. 3,11 Expenses ..................................................................... 3 Farm Business Chart ........................... 23, 27-29, 32-36 Farm Debt Payments as Percent of Milk Sales ................................................... 12 Farm Debt Payments Per Cow .................................. 12 Financial Analysis Chart ........................................... 29 Financial Lease ........................................................... 8
Hired Labor Expenses per Hired Worker Equivalent ........................................................ 20 Hired Labor Expense as % of Milk Sales .................. 20 Income Statement ........................................................ 2 Inflows ....................................................................... 11 Interest Expense Ratio ............................................... 19 Labor & Management Income ..................................... 6 Labor & Management Income Per Operator ............... 6 Labor Efficiency ........................................................ 19 Land Resources ......................................................... 15 Leverage Ratio ............................................................. 9 Liquidity ...................................................................... 9 Lost Capital ................................................................. 9 Machinery Expenses ............................................... 3,16 Marketing Report ....................................................... 25 Milk Price ............................................................ 25, 26 Milk Production ......................................................... 17 Milking Frequency ...................................................... 2 Milking System ........................................................... 2 Money Borrowed ....................................................... 11 Net Farm Income ......................................................... 5 Net Farm Income from Operations Ratio .................... 7 Net Investment ............................................................. 9 Net Milk Receipts ...................................................... 18 Net Worth .................................................................... 8 Number of Cows ........................................................ 17 Operating Costs of Prod. Milk ................................... 18 Operating Expense Ratio ........................................... 19 Opportunity Cost ......................................................... 6 Other Livestock Expenses ........................................... 3 Outflows .................................................................... 11 Part-Time Cash-Crop Dairy (farm) .............................. 2 Part-Time Dairy (farm) ................................................ 2 Percent Equity ............................................................. 9 Personal Withdrawals and Family Expenditures Including Nonfarm Debt Payments .................. 11 Principal Payments .................................................... 11 Profitability .................................................................. 4 Purchased Inputs Cost ............................................... 18 Receipts ....................................................................... 4 Record System ............................................................. 2 Repayment Analysis .................................................. 13 Replacement Livestock ................................................ 3 Retained Earnings ...................................................... 10 Return on Equity Capital ............................................. 7 Return on Total Capital ............................................... 7 Rotational Grazing .................................................. 2,16 Solvency ...................................................................... 9 Total Costs of Producing Milk .................................. 18 Whole Farm Method .................................................. 18 Worker Equivalent ..................................................... 19 Working Capital .......................................................... 9 Yields Per Acre .......................................................... 15

EB No Title Author(s)
OTHER A.E.M. EXTENSION BULLETINS
Fee(if applicable)
Dairy Farm Business Summary, New York SmallHerd Farms, 120 Cows or Fewer, 2010
Knoblauch, W., Putnam, L., Karszes, J.,Kiraly, M. and C. Dymond
2011-04 ($16.00)
Cost of Establishment and Production of ViniferaGrapes in the Finger Lakes Region of New York -2010
White, G.2011-03
Dairy Farm Business Summary, Western NewYork Region, 2010
Knoblauch, W., Putnam, L., Karszes, J.,Hanchar, J., Grace, J., Carlberg., V.,Petzen, J., Welch, D., Overton, R. andC. Dymond
2011-02 ($12.00)
Dairy Farm Business Summary, New York LargeHerd Farms, 300 Cows or Larger, 2010
Karszes, J., Knoblauch, W., Putnam, L.and A. Angell
2011-01 ($16.00)
Legislative Actions on Overtime Pay and CollectiveBargaining and Their Implications for FarmEmployers In New York State, 2009-2010
Telega, L. and T. Maloney2010-19
Dairy Farm Business Summary, New York DairyFarm Renters, 2009
Knoblauch, W. and L. Putnam2010-18 ($16.00)
New York Economic Outlook, 2011 Extension Staff2010-17
A Compilation of Smart Marketing Articles January2008 – October 2010
Park, K. and T. Schmitt2010-16
Economic analysis of the financial impact of thegrape leafroll virus (GLRV) in the Finger Lakesregion of New York
Gómez, M., Atallah, S., Martinson, T.,Fuchs, M. and G. White
2010-15
An Economic Examination of Alternative OrganicCropping Systems in New York State
Chan, S., Caldwell, B. and B. Rickard2010-14
Organic Agriculture in New York State Henehan, B. and J. Li2010-13
2010 Federal Reference Manual for RegionalSchools, Income Tax Management and Reportingfor Small Businesses and Farms
Bouchard G. and J. Bennett2010-12 ($25.00)
2010 New York State Reference Manual forRegional Schools, Income Tax Management andReporting for Small Businesses and Farms.
Bennett, J. and K. Bennett2010-11 ($25.00)
Paper copies are being replaced by electronic Portable Document Files (PDFs). To request PDFs of AEM publications, write to (be sure toinclude your e-mail address): Publications, Department of Applied Economics and Management, Warren Hall, Cornell University, Ithaca,NY 14853-7801. If a fee is indicated, please include a check or money order made payable to Cornell University for the amount of yourpurchase. Visit our Web site (http:/ /aem.cornell.edu/outreach/materials.htm) for a more complete list of recent bulletins.