dairy/ china china dairy sector - oriental patron dairy sector - fresh.pdf · equity research china...
TRANSCRIPT

Tue, 06 Nov 2012
Equi ty Research China Dairy Sector Dairy/ China
Fresh!
We initiate coverage on the China Dairy sector (3 companies) with positive
outlook and the market size will expect to be double over the next 8-10 years,
implying overall volume growth rate with a high single digit and continuous
product mix toward value-added categories. We recommend China Modern
Dairy (1117 HK, BUY) as our top pick for its fast expansion pace and organic
growth from constant raw milk yield improvement. We also favor Biostime
International (1112 HK, BUY) and seeing it as a niche fast-moving premium
baby product player in China. Its unique Mama100 membership platform
promoted strong consumer loyalty and led to a rising cross selling. As lack of
positive catalysts in short-term and lower-than-expected recovery progress, we
rate Mengniu (2319 HK, HOLD) with neutral.
Upstream: raw milk
Our preference is based on i) strong demand from downstream dairy operators
for high quality raw milk; ii) undergoing industry consolidation and expansion in
standardized large-scale dairy farms pushed by government and targeting to
reach~48mn tons of production in 2013E with a 15% CAGR over 2011-2013E; iii)
supportive government policies, like exemptions on agricultural tax, VAT and
income tax. Raw milk price is projected to trend up moderately due to more
sourcing from large-scale farms which charge premium price and supporting from
increasing feed costs.
Downstream: Liquid milk
Liquid milk accounts for 80% of total dairy industry and is dominated by domestic
brands. The top three players, Mengniu, Yili (600887 CH, NR) and Bright Dairy
(600597 CH, NR) have an aggregate market share of about 68%. High-end liquid
milk sales growth will outpace that of mid-to-low-end driven by consumers’ trade
up after 2008 melamine scandal. Lactic acid drinks, baby and toddler milk and
flavored milk are expected to record the fastest growth rates in 2011-2014E
among liquid milk segment.
Downstream: infant formula
We believe this sub-sector will be fueled by i) the 4th baby boom; ii) atypical
consumer behavior among customs of relatively low price sensitivity; and iii)
Relaxation of China’s one-child policy. In our conservative case projection, we
expect the Chinese infant formula market to grow at a CAGR of 9% between
2012-2020E assuming no change in one-child policy application, and that of 13%
in the scenario with relaxation of one-child policy and outpace the whole dairy
market in China.
Tracy Sun
Analyst
+852 2135 0214
Sector Report
Exhibit1: Recommendat ions summary Company Stock code Rating Closed Price Target Price Upside (%)
China Modern Dairy 1117 BUY 2.02 2.64 +31%
Biostime 1112 BUY 19.98 24.60 +23%
Mengniu 2319 HOLD 23.50 24.20 +3%
Closing price as at 5 November 2012
Source: Bloomberg, OP Research

Tue, 06 Nov 2012
China Dairy Sector
Page 2 of 66
Table of Contents
What are our recommendations? ................................................................................................................. 3
Cast a glance at the China Dairy Industry .................................................................................................... 5
Major players in this markets........................................................................................................................ 7
Upstream: raw milk, the key of dairy industry ............................................................................................... 8
Downstream: Liquid milk, biggest category .................................................................................................12
Downstream: Infant formula, attractive growth prospect ..............................................................................14
China Modern Dairy (1117 HK) – Enjoy the taste of High Growth ................................................................19
Investment thesis .............................................................................................................................20
Financial analysis .............................................................................................................................28
Key risks...........................................................................................................................................30
Valuation ..........................................................................................................................................31
Financial Summary - China Modern Dairy (1117 HK) ........................................................................35
Biostime International (1112 HK) - A premium story .....................................................................................36
Investment thesis .............................................................................................................................37
Robust 1H12 results .........................................................................................................................43
Earning forecast ...............................................................................................................................44
Valuation ..........................................................................................................................................46
Key risks...........................................................................................................................................48
Financial Summary - Biostime (1112 HK) .........................................................................................51
Mengniu Dairy (2319 HK) - No surprise ......................................................................................................52
Investment thesis .............................................................................................................................53
Earnings forecast .............................................................................................................................58
Key risks...........................................................................................................................................59
Valuation ..........................................................................................................................................60
Financial Summary - Mengniu Dairy (2319 HK) ................................................................................63
Tue, 06 Nov 2012
China Dairy Sector
Page 3 of 66
What are our recommendations?
China Modern Dairy (1117 HK) – Enjoy the taste of High Growth (BUY)
TP: HK$2.64
We forecast CMD could enjoy the net profit growth at a CAGR of 34% for
FY12-FY15E. Key earnings drivers should come from i) top line growth boosted
by strong demand from downstream dairy operators for high quality raw milk as
well as 10-year take off agreement with Mengniu to secure the long-term sales
volume growth and premium selling price; ii) operating leverage generates from
its modernization and scale operation; iii) supportive government policies (i.e.
exemption on certain tax and subsidies) for the modernization of dairy farming.
Its advanced breeding, feeding and herd management techniques enable CMD to
produce the high-quality raw milk with a high double digit premium over the
industry average price. CMD targets the milk yield per milkable cow is at about
9.0 tons/annum in FY15E and 9.4 in FY17E, ultimately up to 10 tons/annum,
driven by increasing proportion of mature cows and genetic improvement.
Based on a blending DCF/PEG model, we estimate a fair value of HK$2.64 per
share, which implies 30.7% potential upside. We give a BUY rating.
Biostime International (1112 HK) - A premium story (BUY) TP:
HK$24.60
We project that Biostime could enjoy the net profit growth at a CAGR of 24% for
2011-2014E. Key earnings drivers come from top line growth boosted by infant
formula segment and consequent SG&A/sales ratio decline.
As a player in premium market, Biostime was able to achieve superior margin
over its peer average at 20% over the past five years. All its products are sourcing
from overseas to guarantee quality and safety. Its real time and effective channel
management can monitor distributors’ inventory and sales level, resulting in the
account receivables turnover days at 1 day. Its Mama 100 membership platform
promoted strong consumer loyalty, leading to a rising cross selling and saving the
expense of selling and distribution each year.
Our TP is based on a blending SOTP/DCF model, we estimate a fair value of
HK$24.60 per share, which implies undemanding 2013E PE of 14.5x and
suggests 23.1% potential upside.

Tue, 06 Nov 2012
China Dairy Sector
Page 4 of 66
Mengniu Dairy (2319 HK) - No surprise (HOLD) TP: HK$24.20
We forecast Mengniu net profit to grow at a CAGR of 10.8% for FY11-FY14E and
revenue to rise from RMB37.4bn in FY11 to RMB49.13bn in FY14E, equating to a
CAGR of 10% and led by a 7% CAGR in sales volume and a 3% CAGR of APS
hike.
It appears to us that Mengniu’s high growth era is behind us. Its brand value and
consumer loyalty are undermined after the melamine crisis in 2008 and M1
scandal in 2011. Although the new strategies initiated by new management team
can pave the way for long-term earnings growth, near-term headwind from
internal restructuring is visibility. We like Mengniu’s prudent cost control and
outstanding operating efficiency combined with continuing product mix shift
towards high-value added categories, however, all above are fully reflected in
current valuation, with 21x PE in 2013. We found the Bloomberg-consensus EPS
forecast has been revised down since December 2011 and even speed up after
Mengniu’s interim results, partly due to their concerns about recovery pace and
disappointing result of 1H12. The market bearish mood also reflected our
downside risk cautions.
Based on a blending DCF/PER model, we estimate a fair value of HK$24.20 per
share, which implies 2013E PE of 19.0x and suggests 2.98% potential upside.
We give a HOLD rating.

Tue, 06 Nov 2012
China Dairy Sector
Page 5 of 66
Cast a glance at the China Dairy Industry
Looking back, China dairy industry has growth at a rapid pace in both a
demand and supply perspective driven by continued rising rate of urbanization
and increasing disposable incomes. According to China Dairy Associate, per
capita consumption of major dairy products has increased from 2.7kg per capita
in 2000 to 16.2kg per capita in 2011, a CAGR of 17.8%.
Exhibit 2: Major dairy products per capita consumption in China, 1990-2011
Source: CEIC, OP Research
A structural problem of human being
While the CAGR was impressive, per capita consumption in China falls further
behind other developed countries and remains only one-third of developed
countries globally. We believe the major reason of consumption per capita is a
structural problem due to high prevalence of lactose intolerance of Chinese
people. Lactose intolerance individuals have insufficient level of lactase to digest
lactose, a sugar in milk. It is estimated that 75% of adults worldwide show some
decrease in lactase activity during adulthood. The frequency of decreased
lactase activity ranges from 5% in northern Europe and more than 90% in some
Asian countries. It appears to us that high prevalence of lactose intolerance is the
key bottleneck for liquid milk market growth, while high quality and value added
milk products supply (i.e. yogurt, low lactose milk, low fat milk) is like an antidote
to the genetic composition of Chinese people. The situation of Japanese can
provide us with some guidance on where China’s dairy industry will go. The per
capita of Japanese is more than double of Chinese, and studies show its level of
lactose intolerance is not significantly different in China.
1.7 1.9 1.9 1.8 1.8 1.92.6 2.8 2.6 3.0 2.7
3.6
4.9
7.3 7.7
11.3
13.3
14.6
13.112.713.5
16.2
0
2
4
6
8
10
12
14
16
18
1990 1992 1994 1996 1998 2000 2002 2004 2006 2008 2010
(kg)
1990-2000: 4.7% CAGR2000-2011: 17.8% CAGR
Melamine incident impacted the consumer confidence

Tue, 06 Nov 2012
China Dairy Sector
Page 6 of 66
Exhibit 3: Per capita consumption of dairy product (kg/year)
Source: China Dairy Yearbook, OP Research
Outlook
According to Euromonitor, China dairy industry is estimated to grow at a CAGR of
9% in 2011-2015E. We observed an 81% correlation between the Chinese dairy
market growth and the Chinese GDP per capita growth in 1998-2011. Thus, we
conclude that as a country becomes more developed, the people tend to beef up
dairy product intake as a part of their protein needs. Thanks to the product mix
shift to high-value-added categories, a 10% CAGR growth of China dairy industry
over the next 5 years is achievable.
119
107
9289
83
44 44
35
16
Holland Australia Canada EU USA Korea Argentina Japan China

Tue, 06 Nov 2012
China Dairy Sector
Page 7 of 66
Major players in this markets
Exhibit 4: comparison of key operating statistics for domestic dairy players listing in HK markets
Upstream: Raw milk Downstream Liquid Milk/Milk Beverage Downstream Milk Powder
Company China Modern Dairy Mengniu Dairy Yili Bright Dairy Biostime Yashili Feihe Beingmate
Logo
Year Established 2005 1999 1993 1952 1999 1983 1962 1999
Products Raw milk
Liquid Milk/
Ice Cream/
Others
Liquid Milk/
Ice Cream/
Others
Liquid Milk/
Others
Infant formula/
Probiotic
Supplements/
Others
Infant formula/
Nutrition products/
Others
Infant
formula/Nutrition
products/others
Infant
formula/Others
Brands Modern Farming Mengniu Yili Bright Biostime
BM Care
Yashil
Scient Feihe, Firmus Beingmate
Milk sources n.a. Domestic Domestic Mainly Domestic Imported Imported Domestic Mainly
Domestic
Major milk source locations n.a. Inner Mongolia Inner Mongolia Shanghai Europe New Zealand Heilongjiang Heilongjiang
Production Base Anhui/Heibei Mainly Inner Mongolia Mainly Inner Mongolia Shanghai Guangdong
Guangdong
Shanxi
Heilongjiang
Heilongjiang Hangzhou
Source: Company data, OP Research

Tue, 06 Nov 2012
China Dairy Sector
Page 8 of 66
Upstream: raw milk, the key of dairy industry
Impressive growth
Raw milk as the key raw material for the dairy industry, has grown dramatically in
the past 20 years, with total production up to 36.6mn tons in 2011 from 4mn tons
in 1986, representing a CAGR of 11%. China’s primary raw milk production
regions are located between the latitudes of 35 degree and 48 degree in Northern
China where the climate is temperate with a high level of sunshine, and the
environment is more conductive to dairy farming and provides higher quality feed.
Inner Mongolia and Heilongjiang total accounted for 40% of China raw milk
production in 2010, followed by Hebei and Shandong at 12% and 7%,
respectively. Dairy industry giants Mengniu and Yili both are mainly sourcing the
raw milk from Inner Mongolia.
Exhibit 5: Raw milk production in China, 1989-2011
Source: CEIC, OP Research
Exhibit 6: Raw milk production by region, 2010
Source: CEIC, OP Research
0
5,000
10,000
15,000
20,000
25,000
30,000
35,000
40,000
1989 1991 1993 1995 1997 1999 2001 2003 2005 2007 2009 2011
1989-2011: 11% CAGR2000-2007: 23% CAGR
(th tons)
Beijing2%
Hebei12%
Shanxi2%
Inner mongolia25%
Helongjiang15%Shandong
7%
Shaanxi4%
Xinjiang4%
Others29%
Tue, 06 Nov 2012
China Dairy Sector
Page 9 of 66
Price
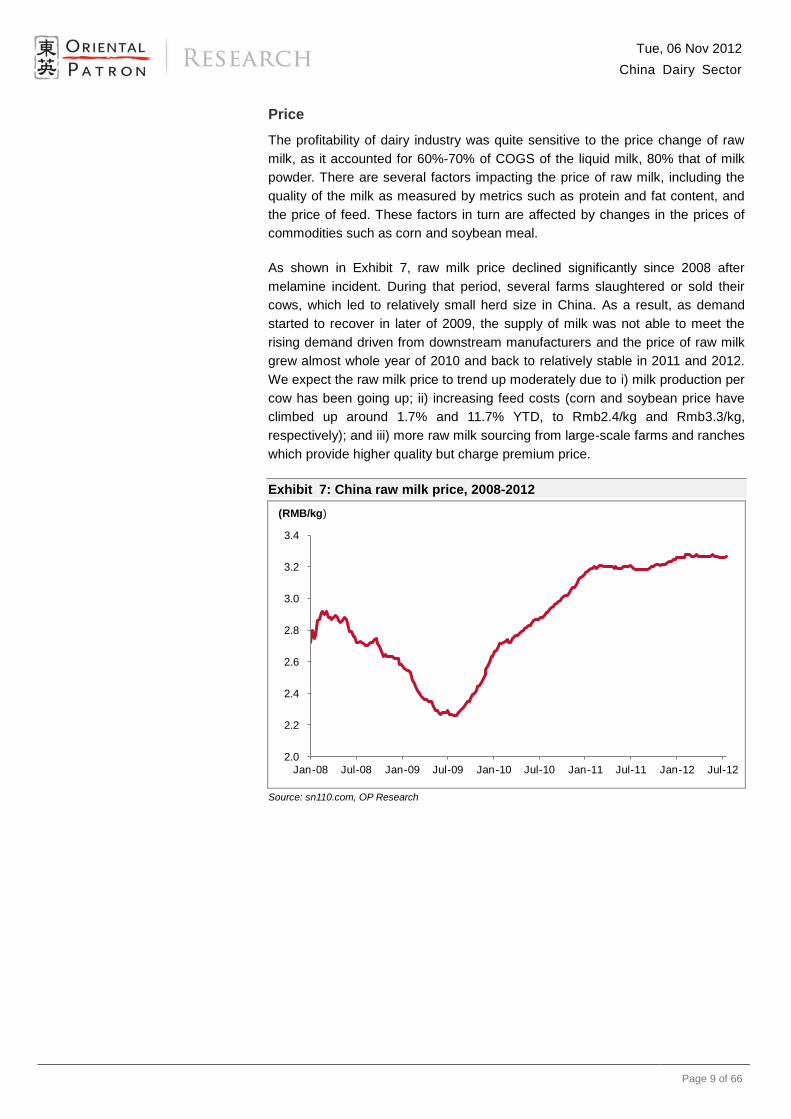
The profitability of dairy industry was quite sensitive to the price change of raw
milk, as it accounted for 60%-70% of COGS of the liquid milk, 80% that of milk
powder. There are several factors impacting the price of raw milk, including the
quality of the milk as measured by metrics such as protein and fat content, and
the price of feed. These factors in turn are affected by changes in the prices of
commodities such as corn and soybean meal.
As shown in Exhibit 7, raw milk price declined significantly since 2008 after
melamine incident. During that period, several farms slaughtered or sold their
cows, which led to relatively small herd size in China. As a result, as demand
started to recover in later of 2009, the supply of milk was not able to meet the
rising demand driven from downstream manufacturers and the price of raw milk
grew almost whole year of 2010 and back to relatively stable in 2011 and 2012.
We expect the raw milk price to trend up moderately due to i) milk production per
cow has been going up; ii) increasing feed costs (corn and soybean price have
climbed up around 1.7% and 11.7% YTD, to Rmb2.4/kg and Rmb3.3/kg,
respectively); and iii) more raw milk sourcing from large-scale farms and ranches
which provide higher quality but charge premium price.
Exhibit 7: China raw milk price, 2008-2012
Source: sn110.com, OP Research
2.0
2.2
2.4
2.6
2.8
3.0
3.2
3.4
Jan-08 Jul-08 Jan-09 Jul-09 Jan-10 Jul-10 Jan-11 Jul-11 Jan-12 Jul-12
(RMB/kg)

Tue, 06 Nov 2012
China Dairy Sector
Page 10 of 66
Policy support
Generally speaking, China’s dairy farming market is still in an early stage and
highly fragmented, as only approximately 7% of dairy herds in China were reared
by large-scale dairy farms which own more than 1,000 cows in 2008 vs.46.9% in
the US. There is great potential for industry consolidation.
After the melamine milk scandal in 2008, the government pushed for
modernization and expansion in standardized large-scale dairy farms as well as
consolidation of the upstream dairy industry. The government has set a target to
reach~48mn tons of cow milk production and 15mn heads of dairy cows in 2013,
which represents 15%/2.1% CAGRs, according to the National Dairy Industry
Development Guideline (2009-2013) . The government has adopted both national
and regional policies to encourage the development of large scale farms by i)
issuing new set of policies to governing the dairy industry; ii) subsidies for
purchasing quality dairy cows from oversea; iii) allowing large-scale operators to
lease agriculture or forestry land; iv) exemptions on agricultural tax, VAT and
income tax.
Those industry’s early movers and large-scale dairy farms, like China Modern
Dairy (1117HK, BUY) will directly be benefited from the industry consolidation
pushed by government, in our view.
Exhibit 8: Milk supply market share by dairy farm size
Source: China Dairy Yearbook, OP Research
1-4 cows25%
5-19 cows32%
20-99 cows18%
100-1000 cows18%
>1000 cows
7%
Tue, 06 Nov 2012
China Dairy Sector
Page 11 of 66
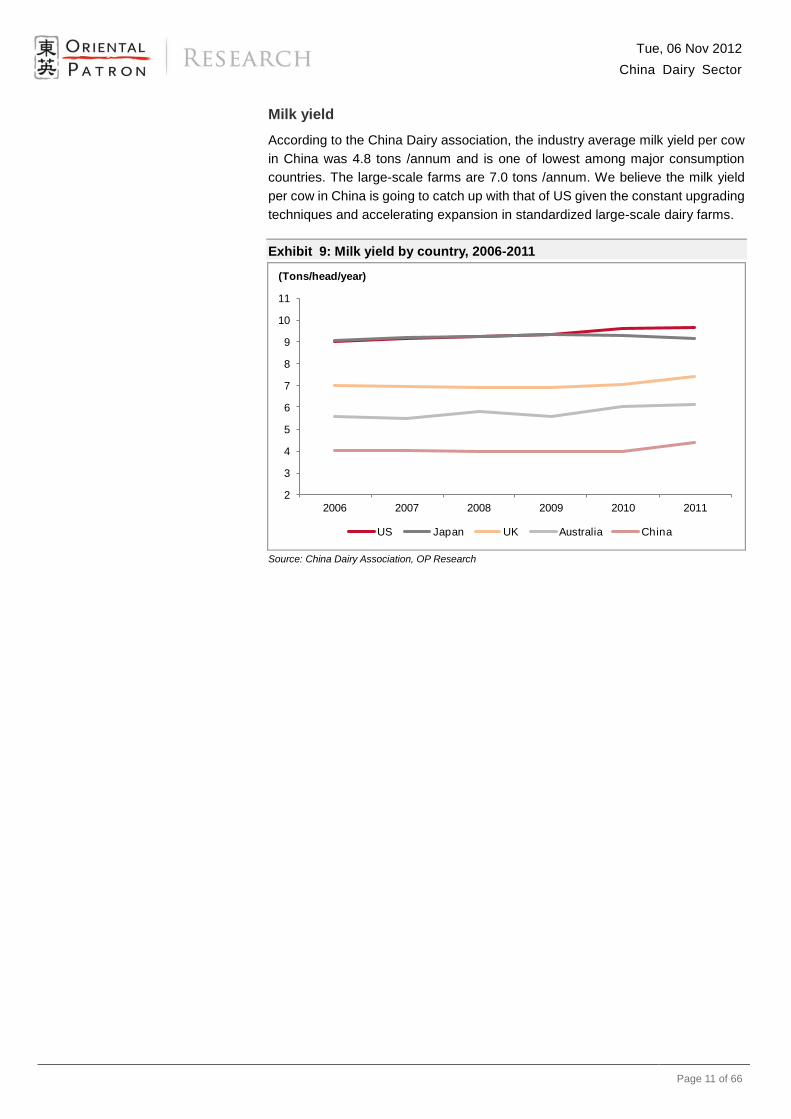
Milk yield
According to the China Dairy association, the industry average milk yield per cow
in China was 4.8 tons /annum and is one of lowest among major consumption
countries. The large-scale farms are 7.0 tons /annum. We believe the milk yield
per cow in China is going to catch up with that of US given the constant upgrading
techniques and accelerating expansion in standardized large-scale dairy farms.
Exhibit 9: Milk yield by country, 2006-2011
Source: China Dairy Association, OP Research
2
3
4
5
6
7
8
9
10
11
2006 2007 2008 2009 2010 2011
US Japan UK Australia China
(Tons/head/year)

Tue, 06 Nov 2012
China Dairy Sector
Page 12 of 66
Downstream: Liquid milk, biggest category
Liquid milk is composed of UHT milk, milk beverage, and yogurt, accounting for
largest portion of total dairy consumption (~80% in 2011).
Still the domestic brands’ market
After the melamine incident in 2008, unlike in the infant formula market, the
domestic brands recovered quickly in liquid milk market, where the foreign brands
were restricted by high transportation costs and have not successfully involved.
The domestic brands still dominate the liquid milk market in terms of sales. The
top three giants Mengniu, Yili and Bright Dairy with aggregate market share of
about 68% in China liquid milk market in 2011.
Shift to premium
We appreciate that the customers’ propensity to upgrade for high-end products
after 2008 melamine scandal. The market share of liquid milk priced above
RMB10/litre was ~24.7% in 2009 from 3.9% in 2005, according to China dairy
yearbook. The rapid consumption growth in the past years was mainly driven by
ASP increment and product mix improvement, in our view. We believe the
high-end liquid milk sales growth will outpace that of mid-to-low-end. Mengniu
(2319 HK, BUY), with 28% of revenue generated from high-end products, is one
of big beneficiaries of this trend.
Industry output slowdown?
Some investors may concern the slowing down of industry sales in 1H12. We
have to admit the domestic production volumes for liquid milk firstly recorded
negative figures for Jul and Aug since 2009. We believe the weak supply is partly
due to i) the hike feeding cost eroded profitability of smaller farms and force them
out of the industry; ii) a series of food safety incidents. However, we positively
detect that industry output rebounded to 13.1% yoy in Sep, according to Dairy
Association of China. We believe that resilience output is largely contributed from
the premium products as customer’s trade up.
Exhibit 10: Liquid milk production volume yoy % growth
Source: CEIC, OP Research
(40)
(20)
0
20
40
60
Feb-08 Aug-08 Feb-09 Aug-09 Feb-10 Aug-10 Feb-11 Aug-11 Feb-12 Aug-12

Tue, 06 Nov 2012
China Dairy Sector
Page 13 of 66
Value-added categories likely cut a figure
As we mentioned before that high prevalence of lactose intolerance is the key
bottleneck for liquid milk market growth, while high quality and value added milk
products supply (i.e. yogurt, low lactose milk, low fat milk) is like an antidote to the
genetic composition of Chinese people. Thus the products, like yogurt, flavored
milk and lactic Acid milk, will grow faster in our point of view.
According to Tetra Pak (the world’s leading food processing and packaging
solutions and suppliers with a 70.2% market share in China), China’s liquid dairy
product consumption is forecasted to rise by round 10.2% (CAGR) in 2011-2014E.
Lactic acid drinks, baby and toddler milk and flavored milk are expected to record
the fastest growth rates in 2011-2014E. Lactic acid drinks is expected to notch up
the highest growth rate, a CAGR of 11.9%, followed by baby and toddler milk with
a CAGR of 9.0%. Flavored milk is expected to record a CAGR of 4.8%. White
milk sales, the biggest category by volume, are expected to post a CAGR of 1.6%
in 2011-2014E.
Exhibit 11: Liquid dairy product sub categories growth
Source: Tetra Pak 2011, OP Research
1.3%
4.5%
9.5%
12.5%
4.5%
3.1%
1.9%
3.2%
2.7%
-0.6%
-5% 0% 5% 10% 15%
white Milk
Flavored Milk
Baby&Toddler Milk
Lactic Acid Drinks
Traditional Cultured Milk
Drinking Yoghurt
Liquid Cream
Sweetened Condensed Milk
Buttermilk
Evaporated Milk2008-2011 CAGR
1.6%
4.8%
9.0%
11.9%
4.1%
4.7%
1.4%
2.6%
4.5%
1.0%
0% 4% 8% 12% 16%
white Milk
Flavored Milk
Baby&Toddler Milk
Lactic Acid Drinks
Traditional Cultured Milk
Drinking Yoghurt
Liquid Cream
Sweetened Condensed Milk
Buttermilk
Evaporated Milk2011-2014E CAGR

Tue, 06 Nov 2012
China Dairy Sector
Page 14 of 66
Downstream: Infant formula, attractive growth prospect
Infant formula market of China experienced a 19% CAGR in the past 10 years,
supported by the urbanization of the Chinese population, the development of the
middle class and the increasing participation of women in the workforce.
Euromonitor forecasts the average market growth of 17% in 2010-2015 and
outpace the whole dairy market of China.
Atypical consumer behavior: low bargaining power among
consumers
The market for infant products is unique: parents are the buyers and the infants
are the consumers, thus the key decision maker is the buyer, not the consumer.
Quality, nutritional value and brand are the three most important considerations
when parents choose products for their children. A market survey conducted by
sina.com (SINA US, NR) indicated that 99% and 95% of parents care most about
quality and nutritional value of infant formula, while 89% also take into account
the brand. Unlike the other consumer goods, price is not a major consideration for
83% of the respondents. That means the bargaining power of consumers in the
infant formula market is relatively low, and we expect that the industry’s margins
are likely to remain solid or even improve.
Exhibit 12: Consumer considerations in purchase of infant formula, 2009
Source: Sina.com, OP Research
99%95%
89%
82%
75%
13%
3%
Quality Nutritional value
Brand Great taste Convenient to feed
Price Others

Tue, 06 Nov 2012
China Dairy Sector
Page 15 of 66
Growth by ASP hike, Foreign brands charge premium
The per capita consumption of infant formula climbed up by 18% in 2011 yoy,
largely driven by ASP increment. The ASP for domestic brand infant formula has
climbed up by 6.8% YTD, followed by foreign brand at 3.6%. As shown in Exhibit
13, its price no matter foreign or domestic kept low single-digit mom growth since
June 2009.
Exhibit 13: Milk powder ASP mom growth by category, 2009- 2011
Source: CEIC, OP Research
The 2008 melamine scandal led to a shift in market shares from local to foreign
brands and foreign brands are structurally more expensive than the domestic
producers at a 25%-35% premium as their perceived higher quality. We believe
improving awareness of food safety and high brand loyalty, in addition with
relatively low price sensitivity, are the key driving forces for sustainable upside
trend. Any growth in the high-end milk market will continue to be seized by foreign
brands due to better brand perceptions and quality raw milk source. Biostime,
Nestle (NESN VX, NR) and Mead Johnson (MJN US, NR) are all the likely
winners, in our view.
Exhibit 14: Milk powder Price by category and Price Premium, 2009- 2011
Source: CEIC, OP Research
-1%
0%
1%
2%
Jun-09 Dec-09 Jun-10 Dec-10 Jun-11 Dec-11 Jun-12
Domestic Brand Infant Formula Foreign Brand Infant Formula
100
150
200
250
May-09 Feb-10 Nov-10 Aug-11 May-12
Adult Milk Powder Foreign Brand Infant Formula
(RMB/kg)
42
46
50
54
May-09 Nov-09 May-10 Nov-10 May-11 Nov-11 May-12
(RMB/kg)

Tue, 06 Nov 2012
China Dairy Sector
Page 16 of 66
The 4th baby boom is happening in the PRC
According to a National Population Development Strategy report, women born
during the third baby boom (1982-1992) have entered their most active
childbearing years (20 to 29 years old). We forecast 2012E-2020E the number of
annual births in the range from 17 to 18.5mn (see Exhibit 15).
Exhibit 15: Birth rate, 1949 - 2011
Source: CEIC, OP Research
Relaxation of China’s one-child policy
After thirty-three years enforcement of the one-child policy, China’s birth rate has
gradually slowed down to around 1.19% in 2011 from 4.34% in 1963 (see
Exhibit15 gray line). Not only has the one-child policy led to a significant decline
in the population growth but it has also impacted by the pyramid of age structure
and the country sex ratio in less desirable ways. The ageing of the population,
4-2-1 family phenomenon and economic sluggish have led several experts to
consider abandonment the one-child policy. The Chinese authorities have taken a
cautious approach, launched several pilot programs and enforce new rules in
different provinces.
In the case of Chinese government could allow all couples to have two children in
2013 and 50% of women in most active childbearing years choose to have the
second child, we project 2012E-2020E number of annual births will increase to
22mn to 23mn based on our model.
0
5
10
15
20
25
30
35
0.0
0.5
1.0
1.5
2.0
2.5
3.0
3.5
4.0
4.5
5.0
1949 1952 1955 1958 1961 1964 1967 1970 1973 1976 1979 1982 1985 1988 1991 1994 1997 2000 2003 2006 2009
Annual Birth (LHR) Birth rate (RHS)
(%) (mn)2010-2020 The 4th
Baby Boom
1952-1957 The 1st
Baby
1962-1970 The 2nd
Baby
1982-1992The 3th
Baby Boom

Tue, 06 Nov 2012
China Dairy Sector
Page 17 of 66
Case study: China baby formula market
Without projecting the relaxation of China’s one-child policy, as shown in Exhibit
16, our rough calculation reveals that the infant formula market can reach
Rmb95bn in 2015 based on the assumptions of :1) low-single digit growth of ASP;
2) gradually increase in penetration rate; 3) the average consumption volume per
children under three years ago is 2-3.5 cans per month. One-child policy
relaxation’s assumption will further bring approximately Rmb28bn increment in
2015E to RMB123bn. On our conservative case projection, Chinese infant
formula market is to grow at a CAGR of 9% between 2012-2020E assuming no
change in one-child policy application, and that of 13% in the scenario with
relaxation of one-child policy.
Exhibit 16: China infant formula sales forecast-Scenario 1: One-child policy
2012E 2013E 2014E 2015E
Age (years) 1 2 3 1 2 3 1 2 3 1 2 3
Population 18 16 16 18 18 16 17 18 18 17 17 18
No. of cans consumption per month 3.50 2.50 2.00 3.50 2.50 2.00 3.50 2.50 2.00 3.50 2.50 2.00
Average ASP 144 144 144 153 153 153 162 162 162 170 170 170
Duration of consumption (months) 6 12 12 6 12 12 6 12 12 6 12 12
Penetration rate 35% 35% 35% 38% 38% 38% 41% 41% 41% 43% 43% 43%
Infant formula market value (mn) 63,095 76,150 88,854 95,263
Source: OP Research
Exhibit 17: China infant formula sales forecast-Scenario 2: Two-Children policy
2012E 2013E 2014E 2015E
Age (years) 1 2 3 1 2 3 1 2 3 1 2 3
Population 18 16 16 23 18 16 22 23 18 22 22 23
No. of cans consumption per month 3.50 2.50 2.00 3.50 2.50 2.00 3.50 2.50 2.00 3.50 2.50 2.00
Average ASP 144 144 144 153 153 153 162 162 162 170 170 170
Duration of consumption (months) 6 12 12 6 12 12 6 12 12 6 12 12
Penetration rate 35% 35% 35% 38% 38% 38% 41% 41% 41% 43% 43% 43%
Infant formula market value (mn) 63,095 82,669 106,716 123,842
Source: OP Research
Exhibit 18: China Infant formula sales forecast, 2012E- 2020E
Source: OP Research
50,000
70,000
90,000
110,000
130,000
150,000
170,000
2012E 2013E 2014E 2015E 2016E 2017E 2018E 2019E 2020E
Two-child policy One-child policy
(RMB mn)

Tue, 06 Nov 2012
China Dairy Sector
Page 18 of 66
Exhibit 19: Infant formula retail price of major brands in China market
Source: Walmart , Taobao.com, Watsons, OP Research
0
100
200
300
400
500
600
700
(RMB/900g)

Tue, 06 Nov 2012
China Dairy Sector
Page 19 of 66
China Modern Dairy (1117 HK) – Enjoy the taste of High Growth
We see strong total revenue growth prospects ahead; total revenue could maintain a CAGR of 42% from FY12-FY15E.
CMD will continue benefits from the policy of exemption on agricultural tax.
The company’s cash can catch up with CAPEX and generate positive free cash flow in FY14.
China modern dairy (CMD) is largest large-scale modern farm operator in China,
with 20 scalable farms and 159,347 dairy cows. Its duplicable business model
speeds up its expansion pace and target to 27 by FY15E with 240,000 cows. Its
high capital intensive and long-term pay-back business model creates a high
entry barrier for new rivals.
The advanced breeding, feeding and herd management techniques enable CMD
to produce the high-quality raw milk. And the price commands a high double digit
premium over the industry average level. To ensure the quality of raw milk, CMD’s
farms are strategically located closed to downstream milk processing plants.
CMD targets the milk yield per milkable cow is at about 9.0 tons/annum in FY15E
and 9.4 in FY17E, ultimately up to 10 tons/annum, driven by increasing proportion
of mature cows and genetic improvement. Continuing improvement in milk yield
will further boost the production volume growth, in our view. Thanks to its
economies of scale, cash cost of raw milk per ton declined by 7.24% in FY12
despite of surging commodities’ price.
A 10-year off-take agreement with Mengniu is mutually beneficial for both parties,
in our view. Sales to Mengniu accounted for 96.4% of its total sales in FY12, and
represented 12% of Mengniu’s raw milk demand.
Initial BUY. We forecast CMD could enjoy the net profit growth at a CAGR of 34%
for FY12-FY15E. Based on a blending DCF/PEG model, we estimate a fair value
of HK$2.64 per share, which implies 30.7% potential upside. We give a BUY
rating.
Initial Coverage
BUY
Close price: HK$2.02
Target Price: HK$2.64 (+30.7%)
Key Data
HKEx code 1117
12 Months High (HK$) 2.45
12 Month Low (HK$) 1.51
3M Avg Dail Vol. (mn) 3.33
Issue Share (mn) 4,800.00
Market Cap (HK$mn) 9,696.00
Fiscal Year 06/2012
Major shareholder (s) Advanced Dairy (24.01%)
Source: Company data, Bloomberg, OP Research Closing price are as of 5/11/2012
Price Chart
1mth 3mth 6mth
Absolute % 0.0 -4.3 -0.5
Rel. MSCI CHINA % -7.1 -13.8 -6.0
PE
Company Profi le Established in 2005, China modern dairy is
the largest modernized dairy farm operator
in China. It operated 20 scalable farms in
China with 159,347 dairy cows. Two more
new farms are under construction, planning
to reach a total of 27 by FY15E. Its milk
yield of 8.09 against the industry average of
4.8. Sales to Mengniu accounted for
96.4% of its total sales in FY12, and
represented 12% of Mengniu’s raw milk
demand.
Exhibit 20: Forecast and Valuation Year to Jun (RMB mn) FY10A FY11A FY12A FY13E FY14E
Revenue 590 1,113 1,678 2,685 3,832
Growth (%) 77% 89% 51% 60% 43%
Net Profit 107 225 398 541 732
Growth (%) 152% 109% 77% 36% 35%
Diluted EPS (RMB) 0.025 0.052 0.082 0.112 0.151
EPS growth (%) n.a. 103% 60% 36% 35%
Change to previous EPS (%) n.a. n.a. n.a. n.a. n.a.
Consensus EPS (RMB)
0.119 0.164
ROE (%) 7.5 4.8 7.9 9.7 11.5
P/E (x) 64.7 31.9 20.0 14.7 10.9
P/B (x) 4.8 1.5 1.6 1.4 1.3
Yield (%) 0.0 0.0 0.0 0.0 0.7
DPS (HK$) 0.000 0.000 0.000 0.000 0.015
Source: Bloomberg, OP Research
0.0
0.5
1.0
1.5
2.0
2.5
3.0
Nov/11 Feb/12 May/12 Aug/12
HK$1117 HK MSCI CHINA
0
10
20
30
40
50
60
Jan/11 Jul/11 Jan/12 Jul/12
Forward P/E Ratio
+1std.
avg.
-1std.

Tue, 06 Nov 2012
China Dairy Sector
Page 20 of 66
Investment thesis
The largest dairy farming company
As China largest large-scale modern farm operator, China modern dairy (CMD)
established in 2005 and has been recognized by the China Dairy Association as
the best-in-class dairy farm operator in China. It operated 20 scalable farms in
China with 159,347 dairy cows. Two more new farms are under construction,
planning to reach a total of 27 by FY15. According to the China Dairy yearbook,
the number of milkable cows was 14.4mn in 2011.By milkable cow size, China
Modern Dairy’s market share was only ~1%, despite its position the largest dairy
farm operator in China.
Exhibit 21: The top-four largest dairy farms in China
Company No. of farms No. of Dairy Cows No. of Milkable Cows
China Modern Dairy 20 159,347 70,793
Beijing Sanyuan Luhe Dairy Farming 25 45,000 23,000
Huishan 50 109,000 45,000
Shanghai Dairy Group 18 37,000 19,000
Source: Company data, OP Research
Standardized farm, speed up its expansion pace
CMD’s dairy farms are designed and constructed using a modern and scientific
layout to maximize yield and productivity, making the farms easily duplicable and
scalable to speed up its expansion pace. Thanks to its duplicable business model,
the number of farms of CMD has surged to 20 in FY12 from 3 in FY08, while the
number of cows is rapidly increasing from 24,358 in FY08 to 159,347 in FY12, a
CAGR of 60%. In FY13E, CMD plans to complete the construction of two farms
located in Bengbu farms (Anhui province), and targets to 27 by FY15E with
240,000 cows in total.
Exhibit 22: Number of cows and farms, FY08-FY12
Source: Company data, OP Research
14,964 20,427 26,607
46,267
70,793
9,394
23,532
45,584
61,309
88,554
3
6
11
16
20
0
5
10
15
20
25
10,000
50,000
90,000
130,000
170,000
FY08 FY09 FY10 FY11 FY12
No. of Milkable cows No. of Heifers and calves No. of farms

Tue, 06 Nov 2012
China Dairy Sector
Page 21 of 66
Exhibit 23: Layout of CMD’s standard dairy farm design
Source: Company data, OP Research
High entry barrier from capital intensive
Building up a large scale-farms is quite capital intensive, with around RMB300mn
capital expenditure comprising of RMB180mn for fixed asset investment and
RMB120mn for purchase 6000 heifers (RMB20,000/head). As the production of
raw milk will not commence in the first 2 years, thus a single farm will generate
positive free cash flow till third year based on our model. High capital investment
requirement and long-term pay-back time create a high entry barrier for new
rivals.
Exhibit 24: Free cash flow of a single large-scale farm
Source: Company data, OP Research
-400
-300
-200
-100
0
100
200
300
Year1 year2 Year3 Year4 Year5 Year6 Year7 Year8 Year9 Year10 Year11
Payback

Tue, 06 Nov 2012
China Dairy Sector
Page 22 of 66
Raw milk provider, premium quality oriented
Frequent quality scandals that happened in the past years have make consumers
more willing to pay for high-quality and health dairy products. Modern and
scientific practices and advanced breeding, feeding and herd management
techniques enable CMD to produce the high-quality and safe raw milk. Somatic
cell Count and Microbe Count are two of the major indicators used to determine
milk quality. As shown in Exhibit40, the quality of CMD’s raw milk is significantly
higher than China and EU standard, and higher than China’s other large scale
farms. Meanwhile, CMD’s protein and fat content of raw milk are 3.1% and 3.7%,
richer than China’s industry standards which are 2.8% and 3.1%, respectively.
Exhibit 25: Milk quality ratios comparison
China Modern
Dairy
Other large scale
farms in China
China
Standard
EU
Standard
Microbe Count <50k/ml N/A <=2,000k/ml <=100k/ml
Somatic Cell Count <300k/ml 592k/ml N/A <=400k/ml
Note: Generally a lower somatic cell count indicates better animal health, while a lower microbe plate count indicates improved sanitation.
Source: China Dairy Statistical Summary 2010
Unlike the individual farmers and small scale farms, CMD’s farms are strategically
located closed to downstream milk processing plants (1-3 hours transportation
time) and directly deliver to milk processor after the raw milk produced. This
“one-stop” procedure shortens the transportation process and reduces the risk of
contamination and product tampering, thus secures the quality of raw milk.
Exhibit 26: The pipeline of raw milk delivery
Source: Company data, OP Research
High quality combined with consumer’s low price sensitivity enables CMD to
charge a high double digit premium over the industry average price. We expect
the ASP hike 1% in FY13E-15E supporting by rising feed cost, in line with the
management guidance. Based on our sensitivity analysis, every 1% increase in
raw milk price could boost by 3.6% in net profit in FY13E (see exhibit 33).
Individual
farmers
Milk collation
stations
Intermediated
stationsTraders Agents Truck drivers Producers
China Modern
DairyProducers
VS.

Tue, 06 Nov 2012
China Dairy Sector
Page 23 of 66
Exhibit 27: Raw milk price(RMB/kg), 2008-2012
Source: sn110.com, Company data, OP Research
Higher milk yield
According to the China Dairy association, the industry average milk yield per cow
in China was 4.8 tons /annum and the average milk yield per cow for large-scale
farms was 7.0 tons/annum. Thanks to the continuous importing high quality
heifers and scientific breeding and feeding herd management, CMD’s average
milk yield per milkable cow achieved 8.09 tons/annum and the mature farms
average was 9.0 tons/annum in FY12. CMD targets the milk yield per milkable
cow is 9.0 tons/annum in FY15E and 9.4 in 2017E, ultimately up to 10
tons/annum, in the view of management. This is mainly driven by:
Heifers become milkable cows and increasing proportion of mature cows
(4-5 years old) with higher milk yield. According to the management, the
average age of CMD’s cows was around 3.5 years.
Genetic improvement and advanced herd upgrade the milk yield in the
subsequent lactation period. CMD imported its first generation Holstein
dairy heifers (>8tons/annum milk yield) from New Zealand and Australia,
and imported semen from high-quality bulls (born by the milkable cow with
15 tons/annum milk yield) from several international suppliers, to improve
the yield of the next few generations and ultimately to 10 tons/annum.
Continuing improvement in milk yield will further boost the production volume
growth, in our point of view.
2.0
2.5
3.0
3.5
4.0
4.5
2008 2009 2010 2011 2012
Industry average China Modern Dairy

Tue, 06 Nov 2012
China Dairy Sector
Page 24 of 66
Exhibit 28: Economics of a Dairy Farm: Milk yield
Source: Company data, OP Research
Exhibit 29: Average milk yield (tons/head/year), FY2008-FY2012
Source: Company data, OP Research
3
4
5
6
7
8
9
10
1 4
Breeding –
No Milk
Produced
Rapid Yield
Improvement
–Cows
Maturing
Gradual Yield
Improvement –
Improvements in
Herd Quality,
Feed Mix etc.
Year
Milk Y
ield
(to
ns/a
nn
um
)
6.10
6.90
7.30 7.56
8.09
9.00
9.40
4.0
6.0
8.0
10.0
2008 2009 2010 2011 2012 2015E 2017E

Tue, 06 Nov 2012
China Dairy Sector
Page 25 of 66
Scale operation bring cost efficiency
The milk quality and yield are primarily determined by the nutritional composition
of the feed. Feed cost, as the largest and fixed expense, account for 88.3% of
farm operating expense in FY12. The cash cost of raw milk per ton declined by
7.24% from RMB3,190 in FY10 to RMB2,959 in FY12 despite of surging
commodities’ price, indicating CMD’s constant improvement in milk yield and
reduction on feed transportation.
Cost advantages also came from CMD’s economies of scale and market leading
position as well as good relationships with the upstream suppliers, which lower
the purchase price for feed but can still guarantee the quality. CMD’s feeding
includes concentrates and forages. Concentrates, representing 60% of total feed
consumption, consist of corn, soybean meal, beer pulp and cotton meal; forages,
accounting for 40% of total feed consumption, consist of corn silage, sheep grass
and alfalfa. In order to ensure and improve the quality of raw milk, CMD
purchases concentrates from large national supplier, like Jilin COFCO (accounts
for 10% of concentrates), and sources forages from local farmers. CMD also plan
to improve the labor efficiency, the long-term target ratio of 60:1 dairy cows to
employees in the coming 5 years from 30:1 in FY2010.
Exhibit 30: Cash cost of raw milk per ton (RMB), FY2010-FY2012
Source: Company data, OP Research
We do not expect the cash cost of raw milk per ton to rise substantially over the
next three years, as i) CMD optimizes of the feed mix and uses cheaper
substitutes with a similar content; ii) the major raw material price of corn and
soybean (accounting for 36% of total feed cost) declined from the peak since mid
of 2012 and downward trend will continue, in our point of view. We estimate 5%
increment of the blended feed cost price in line with the trend of inflation. Our
sensitivity analysis reveals that CMD’s earnings are not highly affected by feed
cost fluctuations, and every 1% hike in feed costs price would lead to a 2.7% drop
in net profit (see exhibit 33).
3,190
2,841
2,959
2010 2011 2012
Cash cost= Farm operating
expense + labor cost

Tue, 06 Nov 2012
China Dairy Sector
Page 26 of 66
Exhibit 31: Feed cost constructure
Source: Company data, OP Research
Exhibit 32: Raw material price, 2011-2012
Source: Bloomberg, OP Research
10-year agreement, strategic partnership with Mengniu
In October 2008, CMD entered into a 10-year off-take agreement with Mengniu.
Under the agreement, both parties shall discuss annual procurement volume of
raw milk 3 months prior to each calendar year and mengniu is required to
purchase all raw milk production of CMD in the upcoming calendar year if the
parities fail to reach an agreed amount. This agreement also allows CMD to sell
up 30% of daily raw milk production to third parties, except for Inner Mongolia Yili
(600887 CH, NR) and Bright dairy (600597 CH, NR). The pricing of the raw milk
sold to Mengniu is determined by a formula, base price plus upward adjustment.
Base price refers to the price of Mengniu buys raw milk from other mid-to
large-scale dairy farms or, if no relevant comparison, use other comparable dairy
farms in nearby regions with adjustments. The upward adjustment depends on
certain quality standards.
Corn30%
Soybean meal6%
Alfalfa20%
Others 44%
2,000
2,500
3,000
3,500
4,000
4,500
Jan-09 Oct-09 Jul-10 Apr-11 Jan-12 Oct-12
(Soybean Meal (RMB/Ton))
1.0
1.5
2.0
2.5
3.0
Jan-09 Jul-09 Jan-10 Jul-10 Jan-11 Jul-11 Jan-12 Jul-12
(Corn (RMB/KG))

Tue, 06 Nov 2012
China Dairy Sector
Page 27 of 66
CMD’s strategic partnership with Mengniu is mutually beneficial for both parties,
in our view. Long-term partnership ensures CMD’s strong demand from market
leading player. For Mengniu, CMD’s high quality raw milk can reduce consumer’s
concerns about its product safety, especially for high-end products, i.e. deluxe
milk.
From FY08 to FY12, sales to Mengniu accounted for 98.9%, 99.6%, 97.6%, 97.4%
and 96.4% of CMD’s total sales, respectively. So far, CMD’s supply represented
12% of Mengniu’s raw milk demand from 10% in FY11.

Tue, 06 Nov 2012
China Dairy Sector
Page 28 of 66
Financial analysis
We forecast CMD could enjoy the net profit growth at a CAGR of 33% for
FY12-FY15E, corresponding to net profit of RMB541mn (or RMB0.11/share) for
2013E, RMB732mn (or RMB0.15/share) for 2014E, and RMB956mn (or
RMB0.20/share) for 2015E.
Key earnings drivers should come from i) top line growth boosted by strong
demand from downstream dairy operators for high quality raw milk as well as
10-year take off agreement with Mengniu to secure the long-term sales volume
growth and premium selling price; ii) operating leverage generates from its
modernization and scale operation; and iii) government policies supporting (i.e.
exemption on certain tax and subsidies) for the modernization of dairy farming.
We see strong total revenue growth prospects ahead, and total revenue could
maintain a CAGR of 42% from FY12-FY15E, driven by i) a 35% CAGR in raw milk
sales volume (led by a 5% CAGR in improvement of milk yield and the rest
generate from the increment of milkable cows; ii) a 1% CAGR of raw milk selling
price, tracking on the trend of feed price and strong consumption of high quality
milk products; iii) contribution from own brand products and selling excess cows
which are project to happen in FY15E on our model.
Our base case’s assumptions are 1% hike of ASP and 5% increase of feed cost.
The sensitivity analysis reveals that our net profit is not quite sensitive to the
change of feed cost and ASP. Assuming no change in feed cost, we estimate that
1% increase in ASP would boost the FY13E net profit by 3.6%. On the cost side,
we estimate that 1% increase in feed costs would drag down the net profit by 2.7%
in net profit of FY13E. We conclude CMD can improve its net profit margin if they
can adjust ASP in-line with change of feed cost.
Exhibit 33: Sensitivie Analysis of net profit change to change of Feed cost (%) and change of ASP (%)
Change of Feed cost (%)
2.3 3.0% 4.0% 5.0% 6.0% 7.0%
Change of ASP (%)
-1.0% -2.0% -4.6% -7.3% -9.9% -12.6%
0.0% 1.7% -1.0% -3.6% -6.3% -8.9%
1.0% 5.3% 2.7% 0.0% -2.7% -5.3%
2.0% 8.9% 6.3% 3.6% 1.0% -1.7%
3.0% 12.6% 9.9% 7.3% 4.6% 2.0%
4.0% 16.2% 13.6% 10.9% 8.2% 5.6%
Source: OP Research
The management expects the gain arising from changes in fair value less costs to
sell of dairy cows will decline to RMB70mn and RMB50mn in FY13/14E as fair
value changes will decrease with herd maturation. Meanwhile the cow
import-related government grants will slowdown as cow imports will cease. These
two items will drop down CMD’s operating profit margin and net profit margin in
FY13/14E.
We group the farm operating expenses, staff cost, depreciations and other
expenses as the operating expenses. The EBIT margin (excluding the non-cash
fair value of biological assets) is forecasted to be 19.4%, 19.5% and 19.6% in
FY13E, FY14E and FY15E, respectively, largely due to i) its economies of scale
further drop down the farm operating expenses, especially the cash cost of raw

Tue, 06 Nov 2012
China Dairy Sector
Page 29 of 66
milk per ton (commodity price increase is largely hedged by higher milk yield); ii)
staff cost ratio drops to 7.0% in FY13E, 6.9% in FY14E and 6.8% in FY15E on
operating leverage; iii) depreciation ratio accounts for 3.7%-5.3% of sales for
FY13E to FY15E.
Exhibit 34: Operating expense breakdown , FY13E
Source: Company data, OP Research
Income tax rate=0%
The Chinese government has implemented a plenty of policies to support the
development of large-scale dairy farms, including exemptions on agricultural tax,
VAT and income tax. The management expects CMD will continue benefits from
this tax policy, thus we expect the income tax expense to be equal to zero in our
model.
CAPEX
CMD is still in the stage of high growth, and large capital investment is required.
In FY13, CMD plans to complete the construction of two farms located in Bengbu
farms (Anhui province), and targets to have 180,000 cows from 159,347 in FY12,
11,000 of net increment would be imported. The management expects to be
self-sufficient in the supply of heifers by FY14E. We believe it is
achievable. Based on 15% organic cattle growth and 180,000 cows target base,
CMD can transfer excess heifers from mature farms to meet 6,000 cows per new
farm’s requirement. The excess cows could be sold to other dairy farms as
CMD’s another mid-term revenue contributor. By FY15E, CMD targets to lift up
the number of cows to 240,000 by expanding the size and utilization rate of the
existing farms, and the total number of farms will reach 27. The management
indicated that the capital expenditure (CAPEX) for building a large-scale dairy
farm with 10,000 dairy cows comprises is approximately RMB300mn, comprising
of RMB180mn for fixed asset investment and RMB120mn for purchase of heifers.
We forecast the annual CAPEX of RMB1.2bn, RMB0.9bn, and RMB0.8bn, for
FY13-FY15E, respectively. We believe the company’s cash can catch up with
CAPEX and generate positive free cash flow in FY14E, in line with management
guidance.
Feed costs
Other farm operating expenses
Employee benefits expense
Depreciation
Other expenses
Tue, 06 Nov 2012
China Dairy Sector
Page 30 of 66
Key risks
Line-up of famous brand, but strong reliance on this single customer.
Based on the 10 year off-take agreement, over 95% of CMD’s revenue is
contributed by its largest customer, Mengniu Dairy. CMD only has the
flexibility of selling no more than 30% of raw milk to other dairy processors
(excluding Yili and Bright Dairy) and directly to end-customers, which could
potentially hinder CMD’s ability to expand the customer base. The
management expects the sales to Mengniu will continue to represent a large
portion of its annual sales of milk produced in the future. CMD is directly
subjected to Mengniu’s operating risks.
Significantly reliance on one product, raw milk. Over 95% of revenue is
generated from raw milk. The management also anticipates the production of
raw milk will continue to be CMD’s primary business. Its sales volume is
highly dependent on and sensitive to fluctuation in raw milk production
volume and pricing.
Feed cost inflation. Feed cost accounted for 60.4% of total sales, and 88.3%
of total farm operating expense in FY12. Like most agricultural products, the
cost and supply of feed are largely subjected to market condition, which may
be affected by adverse weather conditions, various plant diseases, pests and
other acts of nature. The company may be unable to obtain sufficient
quantities of feed or purchase with high cost in unfavorable environment,
which will erode the margin.
Outbreak of any major diseases among cows The quality and healthy of
the dairy cows the important factors in production of raw milk. Any major
outbreak of any illness and disease (such as foot and mouth disease, bovine
tuberculosis) among cows could significantly impact on the raw milk
production capacity and volume. The company carries insurance to hedge
the losses related to cow diseases, will receive government compensation in
the event of an outbreak of a disease. However, it might be not sufficient to
cover all of the losses, including damage of the brand value and relation with
the upstream players.

Tue, 06 Nov 2012
China Dairy Sector
Page 31 of 66
Valuation
DCF Model
Given its cash flow-generative business nature and no direct listed peers for
comparison, we use DCF-based methodology to derive the 12-month target price
of HK$2.62for CMD. We use cost of equity of 10.2%, based on the assumptions
are:i) risk free rate of 3%; ii) market risk premium of 9%; iii) beta of 0.8 to reflect
its stock’s volatility relative to the Hang Seng Index; iv) 2% terminal growth rate
from 2023 onward, in line with our long-term growth assumption for China
consumer players.
We also conduct sensitivity analysis to quantify how target price changes in
different scenarios of cost of equity and terminal growth rate.
Exhibit 35: Sensitivity analysis of target price to Cost of Equity and Terminal growth rate assumption
Perpetual growth rate (%)
2.3 1.0% 1.5% 2.0% 2.5% 3.0%
Cost of Equity (%)
9.2% 2.84 2.98 3.14 3.33 3.55
9.7% 2.60 2.73 2.87 3.02 3.21
10.2% 2.40 2.50 2.62 2.76 2.91
10.7% 2.21 2.31 2.41 2.52 2.65
11.2% 2.05 2.13 2.22 2.31 2.42
11.7% 1.90 1.97 2.04 2.13 2.22
Source: OP Research
PEG Model
We also derive our 12-month target price of HK$2.67 from a PEG-based
methodology. The FY13 P/E multiple is 0.6x, based on a 25% discount to the
China dairy sector average on back of its unique business risk of strong reliance
on its single customer and high sensitivity to major diseases among cows.
Based on a blending DCF/PEG model, we estimate a fair value of HK$2.64 per
share, which implies 30.7% potential upside. We give a BUY rating.

Tue, 06 Nov 2012
China Dairy Sector
Page 32 of 66
Appendix
Company information
As of 30 June 2012, CMD operated 20 farms across China with 159,347 dairy
cows (70,793 milkable cows) producing 431,394 tonnes of raw milk annually. The
farms are located in the provinces of Anhui, Shandong, Hebei, Sichuan, Shaanxi,
Inner Mongolia, Heilongjiang, and Hubei. All of farms have a designed capacity of
10,000 dairy cows each and are strategically located within approximately 200
kilometers from Mengniu processing factories to ensure the quality and reduce
transportation expense.
Exhibit 36: China Modern Dairy farms distribution (As of 30 June 2012)
Source: Company data, OP Research
Shangzhi Farm
Tongliao Farm
Saibei Farm, I, II & III
Chabei Farm, I, II & III)
Wenshang Farm
Bengbu Farm III& IV
Maanshan Farm
Hengsheng Farm
Helingeer Farm
Baoji Farm I
Baoji Farm II
Hongya Farm
Bengbu Farm I&II
Feidong Farm I&II
TongshanFarm

Tue, 06 Nov 2012
China Dairy Sector
Page 33 of 66
Exhibit 37: Sales volume of raw milk, FY08-FY12
Source: Company data, OP Research
Exhibit 38: Shareholding Structure
#Jinmu owned by Ms.Gao Lina, Mr Sun yugang and other management
Source: Company data, OP Research
55,888
96,306
158,081
288,620
431,394
0
100,000
200,000
300,000
400,000
500,000
FY08 FY09 FY10 FY11 FY12
(tonne)
Yinmu15%
Xinmu15%
Advanced Dairy company
24%
Cystal Dairy Holdings (CDH)
8%
Jinmu5%
Public Shareholders
33%

Tue, 06 Nov 2012
China Dairy Sector
Page 34 of 66
Management profile
Mr. WOLHARDT Julian Juul (39) - Chairman, non-executive Director
He is currently a partner of KKR Asia Limited focusing on private equity
transactions in the Greater China region. He has been actively involved in
advising on investments Yageo Corporation (2327 TT), Tianrui Group Cement
Company limited and International Far Eastern Leasing Company limited since
he joined KKR Asia limited in 2006. Before joining KKR Asia limited, Mr. Wolhardt
was with Morgan Stanley Private Equity from 1998 to 2006. He is also a
non-executive director of Mengniu.
Mr. Deng Jiuqiang (61) - Founder, Executive director
He has more than 10 years experience in dairy industry and 15 years of
experience in dairy-related industries in China. He joined the Group in December
2006 and was appointed as an executive Director of the Company on 14
November 2008. Mr. Deng was a co-founder and former vice chairman of inner
Mongolia Mengniu Dairy (Group) Company Limited, a subsidiary of Mengniu from
August 1999 to May 2008. He has ceased to hold any positions with Mengniu
since May 2008. Mr. Deng was also the founder of Inner Mongolia Jiuqiang
Machinery Company Limited and has been its chairman since 1999.
Ms. Gao Lina (55) - Executive Director, CEO
Ms. Gao is one of the founders of the Group and has significant experience in
cross-border trading, resource integration and administrative management. Prior
to joining the Group, Ms. Gao was the general manager of Taian Foreign General
Trade Corporation between October 1993 to June 2005.
Mr. Han Chunlin (40) - Executive Director, COO
Mr. Han has more than 15 years of experience in food and beverage industry in
China and join the Group in September 2008. Mr. Han worked as the marketing
vice general manager of Nowara Shinnosuke (Fujian) Food industry Company
from February 2006 to July 2008. From January 1999 to September 2004, he
served at the liquid milk Department of Mengniu as marketing manager. Prior to
that, Mr Han was a branch-plant manager at Milk Powder Department of Inner
Mongolia Yili Industrial Group Company Limited from July 1994 to January 1999.
Company Milestone
Exhibit 39: China modern dairy milestone
2005-09 Commenced business under the name of “leading farming”
2006 First farm became operational in Maanshan, Anhui province.
2007-2008 New dairy farms in Hebei and Shandong provinces commenced operation
2008-07 Modern Farm was incorporated and acquired all the business and assets of Leading farming for RMB202mn
2008-11 First round of Equity Financing for purchases of heifers and as general working capital
2008-12 Second round of Equity Financing for purchase of heifers
2008-12 Acquisition of Helingeer Modern Farm in Inner Mongolia
2009-03 and 2009-06 Third and fourth rounds of Equity Financings for construction of dairy farms in Feidong
2009-2010 New dairy farms in Sichuan, Shanxi, Hubei, and Henglongjiang provinces commenced operation
2010-11 Listed on the Main Board of The Stock Exchange of Hong Kong Limited
Source: Company data, OP Research
Tue, 06 Nov 2012
China Dairy Sector
Page 35 of 66
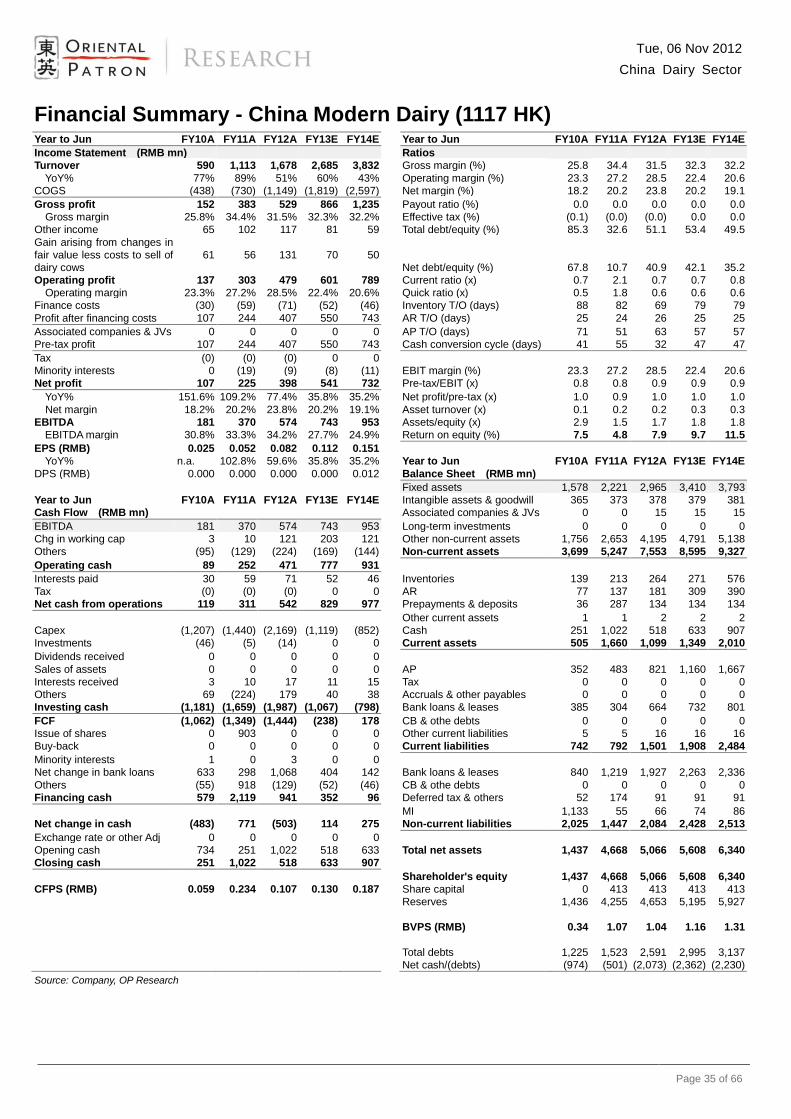
Financial Summary - China Modern Dairy (1117 HK) Year to Jun FY10A FY11A FY12A FY13E FY14E
Year to Jun FY10A FY11A FY12A FY13E FY14E
Income Statement (RMB mn)
Ratios
Turnover 590 1,113 1,678 2,685 3,832
Gross margin (%) 25.8 34.4 31.5 32.3 32.2
YoY% 77% 89% 51% 60% 43%
Operating margin (%) 23.3 27.2 28.5 22.4 20.6
COGS (438) (730) (1,149) (1,819) (2,597)
Net margin (%) 18.2 20.2 23.8 20.2 19.1
Gross profit 152 383 529 866 1,235
Payout ratio (%) 0.0 0.0 0.0 0.0 0.0
Gross margin 25.8% 34.4% 31.5% 32.3% 32.2%
Effective tax (%) (0.1) (0.0) (0.0) 0.0 0.0
Other income 65 102 117 81 59
Total debt/equity (%) 85.3 32.6 51.1 53.4 49.5
Gain arising from changes in
fair value less costs to sell of
dairy cows
61 56 131 70 50
Net debt/equity (%) 67.8 10.7 40.9 42.1 35.2
Operating profit 137 303 479 601 789
Current ratio (x) 0.7 2.1 0.7 0.7 0.8
Operating margin 23.3% 27.2% 28.5% 22.4% 20.6%
Quick ratio (x) 0.5 1.8 0.6 0.6 0.6
Finance costs (30) (59) (71) (52) (46)
Inventory T/O (days) 88 82 69 79 79
Profit after financing costs 107 244 407 550 743
AR T/O (days) 25 24 26 25 25
Associated companies & JVs 0 0 0 0 0
AP T/O (days) 71 51 63 57 57
Pre-tax profit 107 244 407 550 743
Cash conversion cycle (days) 41 55 32 47 47
Tax (0) (0) (0) 0 0 Minority interests 0 (19) (9) (8) (11)
EBIT margin (%) 23.3 27.2 28.5 22.4 20.6
Net profit 107 225 398 541 732
Pre-tax/EBIT (x) 0.8 0.8 0.9 0.9 0.9
YoY% 151.6% 109.2% 77.4% 35.8% 35.2%
Net profit/pre-tax (x) 1.0 0.9 1.0 1.0 1.0
Net margin 18.2% 20.2% 23.8% 20.2% 19.1%
Asset turnover (x) 0.1 0.2 0.2 0.3 0.3
EBITDA 181 370 574 743 953
Assets/equity (x) 2.9 1.5 1.7 1.8 1.8
EBITDA margin 30.8% 33.3% 34.2% 27.7% 24.9%
Return on equity (%) 7.5 4.8 7.9 9.7 11.5
EPS (RMB) 0.025 0.052 0.082 0.112 0.151 YoY% n.a. 102.8% 59.6% 35.8% 35.2%
Year to Jun FY10A FY11A FY12A FY13E FY14E
DPS (RMB) 0.000 0.000 0.000 0.000 0.012
Balance Sheet (RMB mn)
Fixed assets 1,578 2,221 2,965 3,410 3,793
Year to Jun FY10A FY11A FY12A FY13E FY14E
Intangible assets & goodwill 365 373 378 379 381
Cash Flow (RMB mn)
Associated companies & JVs 0 0 15 15 15
EBITDA 181 370 574 743 953
Long-term investments 0 0 0 0 0
Chg in working cap 3 10 121 203 121
Other non-current assets 1,756 2,653 4,195 4,791 5,138
Others (95) (129) (224) (169) (144)
Non-current assets 3,699 5,247 7,553 8,595 9,327
Operating cash 89 252 471 777 931 Interests paid 30 59 71 52 46
Inventories 139 213 264 271 576
Tax (0) (0) (0) 0 0
AR 77 137 181 309 390
Net cash from operations 119 311 542 829 977
Prepayments & deposits 36 287 134 134 134
Other current assets 1 1 2 2 2
Capex (1,207) (1,440) (2,169) (1,119) (852)
Cash 251 1,022 518 633 907
Investments (46) (5) (14) 0 0
Current assets 505 1,660 1,099 1,349 2,010
Dividends received 0 0 0 0 0 Sales of assets 0 0 0 0 0
AP 352 483 821 1,160 1,667
Interests received 3 10 17 11 15
Tax 0 0 0 0 0
Others 69 (224) 179 40 38
Accruals & other payables 0 0 0 0 0
Investing cash (1,181) (1,659) (1,987) (1,067) (798)
Bank loans & leases 385 304 664 732 801
FCF (1,062) (1,349) (1,444) (238) 178
CB & othe debts 0 0 0 0 0
Issue of shares 0 903 0 0 0
Other current liabilities 5 5 16 16 16
Buy-back 0 0 0 0 0
Current liabilities 742 792 1,501 1,908 2,484
Minority interests 1 0 3 0 0 Net change in bank loans 633 298 1,068 404 142
Bank loans & leases 840 1,219 1,927 2,263 2,336
Others (55) 918 (129) (52) (46)
CB & othe debts 0 0 0 0 0
Financing cash 579 2,119 941 352 96
Deferred tax & others 52 174 91 91 91
MI 1,133 55 66 74 86
Net change in cash (483) 771 (503) 114 275
Non-current liabilities 2,025 1,447 2,084 2,428 2,513
Exchange rate or other Adj 0 0 0 0 0 Opening cash 734 251 1,022 518 633
Total net assets 1,437 4,668 5,066 5,608 6,340
Closing cash 251 1,022 518 633 907
Shareholder's equity 1,437 4,668 5,066 5,608 6,340
CFPS (RMB) 0.059 0.234 0.107 0.130 0.187
Share capital 0 413 413 413 413
Reserves 1,436 4,255 4,653 5,195 5,927
BVPS (RMB) 0.34 1.07 1.04 1.16 1.31
Total debts 1,225 1,523 2,591 2,995 3,137
Net cash/(debts) (974) (501) (2,073) (2,362) (2,230)
Source: Company, OP Research

Tue, 06 Nov 2012
China Dairy Sector
Page 36 of 66
Biostime International (1112 HK) - A premium story
The total revenue could maintain a CAGR of 31% from 2011-2014E
the blended gross profit margin further erode to 65.1%, 64.7% and 64.4% in 2012E- 2014E, largely due to the product mix changes
Selling & distribution expense ratio is projected to decline to around 32% in 2012E-2015E, driven by the effective cross selling marketing.
As a player in premium market, Biostime international (Biostime) is a provider
of premium pediatric nutritional and baby products in China, with 85% market
share in children probiotic supplement and 44% in that of supreme infant formula
market. Biostime was able to achieve superior margin over its peer average at 20%
over the past five years. As the fast growing segment, Infant formula has replaced
the probiotic supplement and become the largest revenue contributor, accounting
for over 80% of total revenue. All its products are sourcing from overseas to
guarantee quality and safety.
Its real time and effective channel management can monitor distributors’
inventory and sales level, leading to the account receivables turnover days at 1
day, while its POS machines can track sales information and consumer purchase
behavior. Its Mama 100 membership platform promoted strong consumer
loyalty, resulting in a rising cross selling and saving the expense of selling and
distribution each year. We believe Biostime can better grasp the market trend to
better prepare the orders through this effective channel management and Mama
100 membership.
Initial BUY with undemanding valuation We forecast Biostime could enjoy the
net profit growth at a CAGR of 24% for 2011-2014E. Key earnings drivers come
from top line growth boosted by infant formula segment and consequent
SG&A/sales ratio decline driven by effective cross selling marketing strategy. Our
TP is based on a blending SOTP/DCF model, we estimate a fair value of
HK$24.60 per share, which implies undemanding 2013E PE of 14.5x and
suggests 23.1% potential upside.
Initial Coverage
BUY
Close price: HK$19.98
Target Price: HK$24.60 (+23.1%)
Key Data
HKEx code 1112
12 Months High (HK$) 22.95
12 Month Low (HK$) 10.35
3M Avg Dail Vol. (mn) 0.67
Issue Share (mn) 602.29
Market Cap (HK$mn) 12,033.83
Fiscal Year 12/2011
Major shareholder (s) Biostime Pharm. (74.7%)
Source: Company data, Bloomberg, OP Research Closing price are as of 5/11/2012
Price Chart
1mth 3mth 6mth
Absolute % 3.3 8.9 -5.1
Rel. MSCI CHINA % -3.8 -0.6 -10.6
PE
Company Profi le Biostime international holdings Ltd. provides
pediatric nutrition and baby care products.
Their products include probiotic supplement
for children, infant formulas, dried baby food,
and nutritional supplements. The products
under the brand names “Biostime” and
“BMcare”.
Exhibit 40: Forecast and Valuation Year to Dec (RMB mn) FY10A FY11A FY12E FY13E FY14E
Revenue 1,234 2,189 3,078 4,024 4,924
Growth (%) 121% 77% 41% 31% 22%
Net Profit 266 527 644 824 1,000
Growth (%) 145% 98% 22% 28% 21%
Diluted EPS (RMB) 0.580 0.864 1.054 1.347 1.636
EPS growth (%) 142% 49% 22% 28% 21%
Change to previous EPS (%) n.a. n.a. n.a. n.a. n.a.
Consensus EPS (RMB)
1.100 1.385 1.650
ROE (%) 16.0 26.7 27.7 27.4 26.5
P/E (x) 27.9 18.7 15.3 12.0 9.9
P/B (x) 4.5 5.0 4.2 3.3 2.6
Yield (%) 1.4 3.8 2.7 3.4 4.1
DPS (HK$) 0.273 0.761 0.529 0.676 0.821
Source: Bloomberg, OP Research
0.0
5.0
10.0
15.0
20.0
25.0
Nov/11 Feb/12 May/12 Aug/12
HK$1112 HK MSCI CHINA
0
5
10
15
20
25
Feb/11 Aug/11 Feb/12 Aug/12
Forward P/E Ratio
+1std.
avg.
-1std.

Tue, 06 Nov 2012
China Dairy Sector
Page 37 of 66
Investment thesis
A player in premium market
Biostime international (Biostime), founded in 1999 and listed in 2010, is a
provider of premium pediatric nutritional and baby products in China. With 85%
market share in children probiotic supplement market, Biostime leveraged its
solid market position and started to expand its business to baby formula in July
2008 and baby care products in 1H10. Its blended gross profit margin is higher
than the peers approximately by 20%.
Exhibit 41: Gross profit margin comparison, 2007-2011
Source: Company data, OP Research
Infant formulas, the main catalyst
According to Nielson, Biostime has become the No.1 infant formula player in the
supreme tier segment (over Rmb300/can) with a market share of 44% in 1H11(vs.
32% in 1H10). In high-tier segment (RMB 200-300/can), Biostime have 7.4%
market share and ranked 6th
in 1H11. Infant formula, as the fast growing segment,
has replaced the probiotic supplement and became the largest revenue
contributor, accounting for 80.3% of total revenue with 65% gross profit margin in
1H12.
30%
40%
50%
60%
70%
80%
90%
2007 2008 2009 2010 2011
Biostime Yashili Feihe Beingmate

Tue, 06 Nov 2012
China Dairy Sector
Page 38 of 66
Exhibit 42: Infant formula industry in China in 1H11
Source: AC Nelson, OP Research
Under the 4-2-1 phenomenon, today’s China parents, especially the generation
born in 1980s, who exhibit relatively lower price sensitivity and higher value
awareness are willing to spend on premium products for their children. This
consumption preference shift was more visible in infant formula, especially after
the scandal happened on late 2008. As such, we estimate Biostime to maintain
fast growth momentum for revenue with 31% CAGR in 2012-2015E driven by i)
the 4th baby boom and potential one-child policy relaxation; ii) the effect from
“dragon baby” concept; iii) launching stage 4 infant formula by the year end of
2012.
Probiotic supplement, traditional and dominate the market
As Biostime’s traditional product, probiotic supplement was firstly launched in
China in 2001 and contributed approximately 12.6% of total revenue with 76.4%
gross profit margin in 1H12. According to Euromonitor, Biostime has a 85%
market share in children’s probiotic supplement sector in China in 2009. The
company soured probiotic from Lallemand, a leading bacteria producer in France,
and packed products in Guangzhou plant which has an annual capacity of 103mn
sachets with 84% utilization rate.
The revenue generated from probiotic supplements grew at a CAGR of 9% in
2008-2011. We expect the Biostime to maintain a relatively stable growth and
register a 7% CAGR of revenue in 2012-2015E driving from rising custom base of
mama 100 active members and conversion rate of member points.
Nestle1%
Wyeth9%
Beingmate19%
Ausnutria25%
Biostime44%
Others2%
Supreme tier
Mead Johnson,
27%
Dumex, 13%
Abbott, 11%
Wyeth, 11%
Beingmate, 10%
Biostime, 7%
Others, 21%
High tier

Tue, 06 Nov 2012
China Dairy Sector
Page 39 of 66
Real time and effective channel management
Biostime’s products are sold through 87 nationwide sales offices to connect the
371 regional distributors, which further place the products to 8,321 VIP baby
specialty stores (69.7% of products sold in 1H12), 3,336 supermarkets (23.1% of
products sold in 1H12) and 601 pharmacies with Mama 100 Member zone.
Biostime plans to further expand its distribution channels, aiming to cover 10,000
VIP baby specialty stores, 800 pharmacies with Mama100 Member’s Zones, and
4,000 supermarkets by the end of 2012.
All the end retailers have to sign contracts with Biostime and regional distributors
are only responsible for logistics and can only delivery products to the contractual
retail outlets. The company also requires the regional distributors to settle the
payment before delivering products, resulting in the account receivables turnover
days at 1 day in 1H12. Its real-time logistics management system can monitor
distributors’ inventory and sales level, while its POS machines, installed in their
retail outlets, can track sales information and consumer purchase behavior. We
believe Biostime can better grasp the market trend to better prepare the orders
through this effective channel management.
Exhibit 43: Channel management model
Source: Company data, OP Research

Tue, 06 Nov 2012
China Dairy Sector
Page 40 of 66
Exhibit 44: Multi-channel distribution network
Source: Company data, OP Research
Mama100 membership, a real VIP platform
Biostime’s Mama 100 membership system consists of membership point
accumulation program, nursing consultancy, and sharing information via
mama100.com website. It has approximately 1.18mn active members as June 30
of 2012, contributing 87.8% of total revenue (vs. 81% in 1H11). The active
member registered a CAGR 105% from 2007 to 2011; and the management
expects the figure will reach 1.5mn till 2014, representing a CAGR 22% for
2011-2014E. The same store membership points have successfully recorded
high double digit growth (~29% to ~40%) for the mature store which has
cooperated with Biostime over 2 years. Through this unique system, Bisotime
have already promoted strong consumer loyalty and better understood
consumers’ needs to enhance customer services, in our point of view.
Exhibit 45: Number of Active number, 2007-2014E
Source: Company data, OP Research
We are positive to aware the per cent of selling and distribution expense of sales
declined by 3.1% in 1H12, especially the promotional & advertising expenses
(15.7% in 1H12 vs. 19.6% in 1H11). It appears to us this downward trend of
operating expense was an evidence of effective marketing from Mama100
Nationwide sales office (87)
Regional distributors (371)
Specialty
storesSupermarkets Pharmacies
VIP Baby
stores
General
pharmacies
Pharmacy
stores with
Mama 100
Member
Zone
Rapid growth of Stores No.
Jun 30,
2011
Jun 30,
2012
Sep 30,
2012
2012
Target
VIP Baby Specialty stores 4,399 8,321 9,343 10,000
Supermarkets 2,126 3,336 3,849 4,000
Pharmacies with Mama100 Member Zone 389 601 640 800
46,373 93,171
214,452
322,225
465,536
685,458
825,230
1,179,732
1,500,000
0
400,000
800,000
1,200,000
1,600,000
Dec-07 Dec-08 Dec-09 Jun-10 Dec-10 Jun-11 Dec-11 Jun-12 Dce-14

Tue, 06 Nov 2012
China Dairy Sector
Page 41 of 66
membership. Mama100 membership platform successful led to a rising cross
selling and average expense per active member, thus reducing its spending on
traditional media to build brand awareness.
Exhibit 46: Cross selling rate, 2011-2012
Source: Company data, OP Research
Mother
formulas
Infant
formulas
Baby
cereals
Probio-tic
sachet
Baby
diapers
Mother
formulas
2.08% 2.06% 2.29% 2.30%
Infant
formulas
24.11% 15.84% 15.11% 10.02%
Baby
cereals
15.28% 12.73% 11.49% 13.85%
Probio-tic
sachet
13.85% 13.76% 16.15% 12.61%
Baby
diapers
8.29% 5.95% 7.89% 6.20%
A
B
Cross selling rate (end of Jun, 2011)
Mother
formulas
Infant
formulas
Baby
cereals
Probio-tic
sachet
Baby
diapers
Mother
formulas
2.25% 3.02% 2.59% 3.23%
Infant
formulas
26.53% 18.16% 13.90% 13.18%
Baby
cereals
12.85% 11.06% 10.02% 14.64%
Probio-tic
sachet
16.26% 15.91% 20.41% 18.25%
Baby
diapers
7.64% 5.03% 8.05% 5.41%
A
B
Cross selling rate (end of Jun, 2012)

Tue, 06 Nov 2012
China Dairy Sector
Page 42 of 66
Sourcing from overseas to guarantee quality
Supplier of infant formula: Laiterie de Montaigu, Isigny Sainte Mere, and Alra
Food
Laiterie de Montaigu, a French dairy company established in 1932, sources milk
from Appellation d’Origine Contreolee (AOC) Charentes-Poitou. Montaigu
produces the formulas based on Biostime’s formula profiles and applies a
patented full-formulation spray drying technique to optimize the nutritional quality.
The products supplied with original packing. Biostime is by far the biggest client of
Montaigu (~80% of its capacity), purchasing 10,000-12,000 tons of infant formula
each year for supreme series.
Isigny Sainte Mere, as the second infant formula supplier of Biostime, also
sources milk from AOC. Like Montaigu, Isigny Saite Mere will produce based on
Biostime’s formula and apply spray drying technique. Biostime will purchase
5,000-6,000 tons of infant formula from Isigny Sainte Mere per year.
Biostime signed 10-year financing and supply JV development agreement with
Arla Food and introduced Arla Food as its third infant formula supplier in June
2012. Arla Food is a global dairy company and also entered a strategic
cooperation with China Mengniu (2319.HK, Hold). Based on the agreement, Arla
Foods borrowed HKD108mn loans from Bisotime for capacity expansion, and
repay the loan by delivering infant formula starting from 2013 (cap to 20,000 tons
per year) combining with financing interest (~2%). According to the management,
Arla Foods is expected to supply thousands of tons infant formula in 2013E for
stage 4 formula, cap to 20,000 tons in 2015E. The management also articulated
that the amount of infant formula supplied by Arla will be more than 20,000 tons
after 2015E depending on their future strategy plan.
Supplier of probiotic supplements: Lallemand
Lallemand is a privately-held Canadian company, established at the end of the
19th century, specializing in the development, production, and marketing of
yeasts and bacteria. Biostime started business with Lallemand since 2000,
importing probiotic powder from Lallemand and packing in its Guangzhou
GMP-certified plants.
Supplier of dried baby food: Diana Naturals and Kerry Ingredients & Flavors
Biostime imported vegetable and fruit natural extracts in powder from Diana
Naturals, a worldwide natural ingredients supplier with sales of more than
US$150mn. Rice, oat and multi-grain cereal with original packing are imported
from Kerry Ingredients, which produces over 15,000 ingredients, flavors and
integrated solutions. Both Kerry and Diana manufacture and supply products
base on Biostime’s specification.
Supplier of baby care: Sarbec and First Quality
Biostime import toiletry products made by Sarbec (a French cosmetic company
established in 1972) with original packing since 2009. These toiletry products are
based on Biostime’s design and formulas. First Quality, a US consumer paper
product supplier operating over 20 years, provides Bisotime baby diapers with
original packing since 2009.

Tue, 06 Nov 2012
China Dairy Sector
Page 43 of 66
Robust 1H12 results
Revenue surged 57% yoy to RMB1,363mn in 1H12, mainly driven by strong
growth in infant formula, which represented 80.3% of total revenue. Excluding
nutrition supplements contribution (launched on Sep 2011), the top-line
climbed up by 55.2% yoy. Probiotic supplement only registered 3% yoy
growth in 1H12, the proportion has decrease to 12% from 18.4% in 1H11.
Gross profit margin shrank 2.4% to 65.6%, largely due to the rising
proportion of infant formula (vs. 73.4% in 1H11), also partly due to the
purchasing price of infant formula and labor cost hike.
EBIT margin expanded 0.3ppt to 25.8%, reflecting i) 3.1% contracted in
selling and distribution expense driven by effective cross selling marketing ; ii)
0.1ppt decline in administrative expenses.
Net profit margin contracted 2.4% to 20.1% due in part to the higher
effective tax rate with lower foreign exchange gain. The company still
maintains high pay-out ratio policy, and declared 40% for 1H12.
Its solid balance sheet was underpinned by RMB 1.382mn of net cash as
June of 2012, with 1 day account receivables turnover days and 126 days for
that of inventory. High ROA (28.4%) and ROE (20.3%) also approved its
strong profitability.
Exhibit 47: Interim results of 1H12
1H11 1H12 yoy%
Revenue 867,550 1,362,742 57%
Probiotic supplements 159,296 164,461 3%
Infant formulas 636,550 1,094,732 72%
Dried Baby food products 53,631 54,361 1%
Baby care products 18,073 32,760 81%
Nutrition supplements
16,428 n.a.
Cost of sales (277,856) (469,146) 69%
Gross profit 589,694 893,596 52%
Other income and gains 29,736 21,633 -27%
Selling and distribution costs (330,045) (475,382) 44%
Administrative expense (32,813) (49,825) 52%
Other expenses (6,879) (16,958) 147%
EBIT 221,132 351,861 59%
Finance costs
(175) n.a.
PBT 249,693 372,889 49%
Income tax expense (54,067) (98,963) 83%
Net profit 195,626 273,926 40%
Key ratios 1H11 1H12 difference %
Margins %
Gross profit 68.0% 65.6% -2.4%
EBIT 25.5% 25.8% 0.3%
Net profit 22.5% 20.1% -2.4%
Turnover days
Accounts receivable 1 1 0
Inventory 86 126 40
Accounts payable 47 38 -9
Profitability
ROA 18.9% 20.6% 1.7%
ROE 22.4% 28.4% 6.0%
Source: Company data, OP Research

Tue, 06 Nov 2012
China Dairy Sector
Page 44 of 66
Earning forecast
We forecast Biostime could enjoy the net profit growth at a CAGR of 24% for
2011-2014E, corresponding to net profit of RMB644mn (or RMB1.05/share) for
2012E, RMB824mn (or RMB1.35/share) for 2013E, and RMB1,000mn (or
RMB1.64/share) for 2014E. Key earnings drivers should come from top line
growth boosted by infant formula segment and consequent SG&A/sales ratio
decline driven by effective cross selling marketing strategy.
The total revenue could maintain a CAGR of 31% from 2011-2014E. Key driving
forces include: i) robust revenue growth in infant formula segment, which will
register a CAGR of 36% in 2011-2014E, accounting for 84% of total sales in
2013E; ii) continual launching new products each year to enrich its product
portfolio; iii) dramatically rising in the number of active members; iv) expansion of
distribution network in VIP baby specialty stores, pharmacies with Mama100
Member’s Zones, and supermarkets.
We expect the proportion of probiotic supplements will further decline to 11.3%,
9.6% and 8.3% of the total sales for 2012E, 2013E and 2014E although the
management will redistribute the resource to rejuvenate this traditional segment.
The declining contribution in sales was mainly caused by a rising proportion of
revenue from the sales of infant formula.
Exhibit 48: Revenue forecast, 2011-2014E
Source: Company data, OP Research
We expect the blended gross profit margin to erode to 65.1%, 64.7% and 64.4%
in 2012E, 2013E and 2014E, respectively, largely due to i) the product mix
changes, especially the high-end infant formula (GPM: ~62%) rising faster than
the supreme series (GPM: ~68%); ii) higher conversation rate of member points
pull the probiotic supplements’ GPM down to 75-76% in 2012e-2014e; iii) modest
purchasing price hike without ASP upsides adjustment. Base on our sensitivity
analysis, every 0.5% decrease in the sales proportion of probiotic supplements
could lead to 0.1% drop in blended GPM in FY13E.
We expect the EBIT margins to be stable at 27%-27.7% in 2012-2014E. The
ratio of selling & distribution expense/sales is projected to decline to around 32%
0
1,000
2,000
3,000
4,000
5,000
6,000
2011 2012E 2013E 2014E
Probiotic supplements Infant formulas Dried Baby food products
Baby care products Nutrition supplements
(RMB mn)

Tue, 06 Nov 2012
China Dairy Sector
Page 45 of 66
in 2012-2014E, driven by the effective cross selling marketing.
Exhibit 49: Gross profit margin, 2011-2014E
Source: Company data, OP Research
30%
40%
50%
60%
70%
80%
90%
2011 2012E 2013E 2014E
Probiotic supplements Infant formulas
Dried Baby food products Baby care products
Nutrition supplements Blended GP margin%

Tue, 06 Nov 2012
China Dairy Sector
Page 46 of 66
Valuation
Sum-of-the-parts Model
We derive our 12-month price target of HK$23.58 from a sum-of-the-parts based
methodology, given Biostime diversified portfolio. Our valuation entitles 5.00x
targeted 2013 EV/EBIT for the company’s probiotic supplements segment, 4.98x
targeted 2013 EV/EBIT for the infant formulas business, 6.93x/4.85x/5x for dried
baby food products, baby care products and nutrition supplements, respectively.
The peers for infant formula projected in our valuation are Yashili (1230 HK, NR),
Beingmate international (002570 CH, NR), Feihe international (ADY US, NR),
Nestle Danone (BN FP, NR) and Mead Johnson. Given Biostime oversea
sourcing and domestic customer base business model, we think using both
foreign and domestic players is a comparable approach to forecast its infant
formula business.
Chr Hansen (CHR DC, NR) was used as our probiotic supplements’ competitor,
and we applied a 30% discount of this segment multiple as we think Biostime’s
probiotic supplements products lack awareness global brand name and low
single digit growth in 2012-2014E, in our view.
Exhibit 50: Sum-of-the-parts Model
EV/EBIT Projected Multiple EBIT(RMB mn) EV
Probiotic supplements 5.00 271 1,354
Infant formulas 4.98 1,945 9,679
Dried Baby food products 6.93 61 426
Baby care products 4.85 22 105
Nutrition supplements 5.00 31 157
Total
2,330 11,721
Plus: Net cash
1,791
Less: MI
0
Outstanding share('000'000)
612
Share price (RMB)
19.17
Share price (HK$)
23.58
Notes: The peers of dried baby food and baby care products peers are Kerry group (KYGA LN) and (JNJ US), with 40% discount of multiple.
Source: Bloomberg, OP Research

Tue, 06 Nov 2012
China Dairy Sector
Page 47 of 66
DCF Model
Given its cash flow-generative business nature and strong earnings growths, we
also use DCF-based methodology to derive the 12-month target price of
HK$25.60 for Biostime. The assumptions are: i) risk free rate of 3%, based on the
annual yield on China’s 10-year government bond; ii) market risk premium of 9%;
iii) beta of 1.2 higher than the China dairy sector average to reflect its stock’s
volatility relative to the Hang Seng Index (China dairy sector beta: 1.05) and its
business model; iv) cost of equity 13.8%; v) 2% terminal growth rate, in line with
our long-term growth assumption for China consumer players.
We also conduct sensitivity analysis to quantify how target price changes in
different scenarios of cost of equity and terminal growth rate.
Exhibit 51: Sensitivity analysis of target price to Cost of Equity and Terminal growth rate assumption
Perpetual growth rate (%)
2.3 1.0% 1.5% 2.0% 2.5% 3.0%
Cost of Equity (%)
11.8% 28.9 29.5 30.1 30.8 31.6
12.8% 26.7 27.2 27.7 28.2 28.8
13.8% 24.9 25.3 25.6 26.0 26.5
14.8% 23.3 23.6 23.9 24.2 24.6
15.8% 22.0 22.2 22.5 22.7 23.0
16.8% 20.8 21.0 21.2 21.4 21.6
Source: OP Research
Based on a blending SOTP/DCF model, we estimate a fair value of HK$24.60 per
share, which implies undemanding 2013E PE of 14.5x and suggests 23.1%
potential upside. We give a BUY rating.

Tue, 06 Nov 2012
China Dairy Sector
Page 48 of 66
Key risks
Food safety issue
The major concern of food and beverage sector is safety and quality issues,
especially infant food. Any news, no matter real or suspected, regardless of
Biostime or the competitors, related to product’s safety and quality will spread
quickly across the whole industry and result in sales weakness or cost relate to
inventory write-off.
Strong reliance on suppliers
In order to secure the quality and safety, all of Biostime’s raw materials are
sourcing from oversea. Infant formula, representing 80% of total revenue, is
original packaged from its three suppliers. Its top 5 suppliers accounted over 90%
of total procurement in 1H12. Although Bisotime has established stable and
longer relationship with the upstream suppliers, any disruption will cause supply
issue. As a result, Biostime’s business is heavily dependent on its suppliers.
High competition
We believe the competitive landscape of milk powder is more severe than that of
liquid milk and most other dairy products due to the large number of suppliers.
The foreign players, like Dumex, Mead Johnson, and Wyeth, have dominative
positions in the premium market and the per cent of market shares are continually
rising. Biostime needs to keep innovation to differentiate itself from the other
competitors in such steep environment.
Regulation risk
Infant formula industry is subject to extensive laws and regulations promulgated
by the State Council, the Ministry of Health, the State Food and Drug
Administration, and other national and local regulatory authorities in China.
Regulatory changes could potentially bring negative impact on Biostime’s sales.
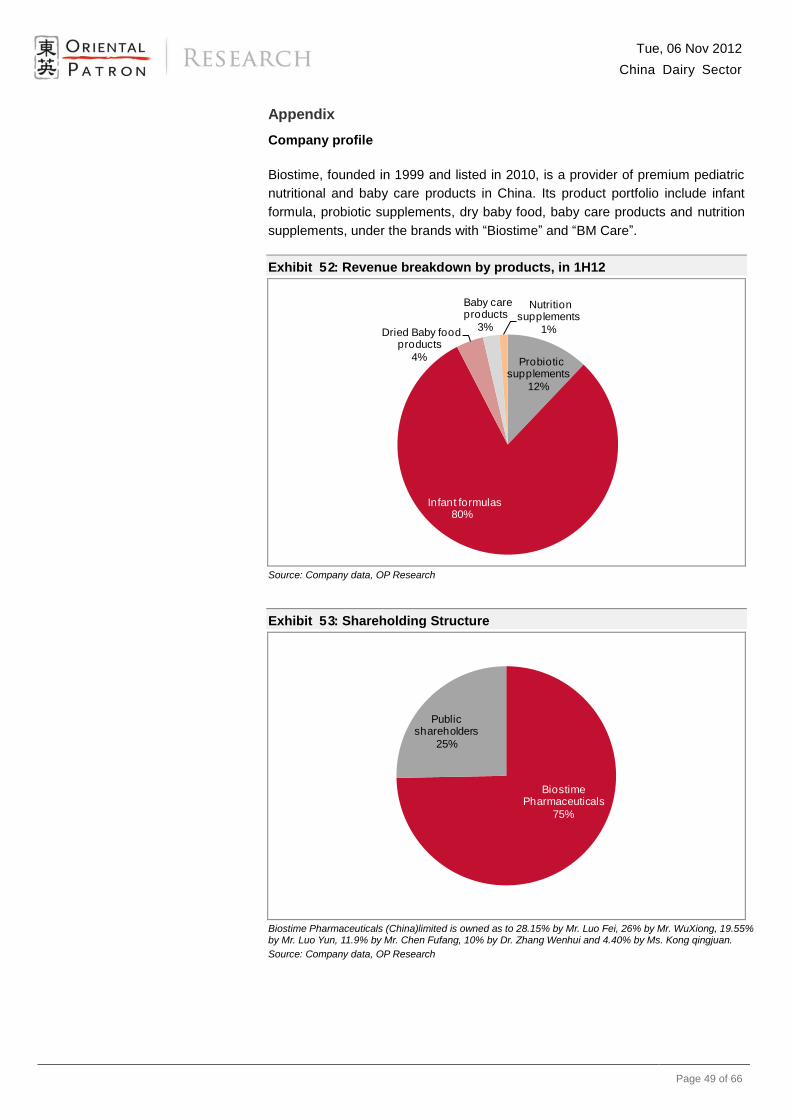
Tue, 06 Nov 2012
China Dairy Sector
Page 49 of 66
Appendix
Company profile
Biostime, founded in 1999 and listed in 2010, is a provider of premium pediatric
nutritional and baby care products in China. Its product portfolio include infant
formula, probiotic supplements, dry baby food, baby care products and nutrition
supplements, under the brands with “Biostime” and “BM Care”.
Exhibit 52: Revenue breakdown by products, in 1H12
Source: Company data, OP Research
Exhibit 53: Shareholding Structure
Biostime Pharmaceuticals (China)limited is owned as to 28.15% by Mr. Luo Fei, 26% by Mr. WuXiong, 19.55% by Mr. Luo Yun, 11.9% by Mr. Chen Fufang, 10% by Dr. Zhang Wenhui and 4.40% by Ms. Kong qingjuan.
Source: Company data, OP Research
Probiotic supplements
12%
Infant formulas80%
Dried Baby food products
4%
Baby care products
3%
Nutrition supplements
1%
Biostime Pharmaceuticals
75%
Public shareholders
25%

Tue, 06 Nov 2012
China Dairy Sector
Page 50 of 66
Management profile
Mr. Luo Fei (47) - Founder, Chairman and CEO
He is primarily responsible for overall strategies, planning and business
development. He is also a director of Biostime Guangzhou, Biostime Health and
BMcare Baby. He has approximately 18 years of experience in the industry of
products of biotechnology. In August 1999, he established Biostime Guangzhou.
Dr. Patrice Malard (57) - Chief Scientific Officer
He is primarily responsible for providing technical support and advice to the
research and development of its products. He was the scientific consultant of
Biostime Guangzhou from Mar 2008 to Sep 2010. He joined Biostime in October
2010 and has approximately 20 years of experience in the nutrition products
industry.
Ms. Kong Qingjuan (49) - Executive Director, COO
She is primarily responsible for the overall procurement, logistics, production, as
well as internal compliance and control. She has over 16 years of experience in
the industry of products of biotechnology and joined the company in 2000.
Milestone
Exhibit 54: Biostime milestone
1999 Establishment of Biostime Inc., Guangzhou
2000-08 Launch of the Biostime™ brand.
2002-05 Commencement of strategic cooperation with Lallemand to develop Biostime™
branded probiotic supplements in the PRC.
2003-01 Launch of Biostime™ branded probiotic supplement products in China
2006-03 Construction of production facilities in Guangzhou.
2007-09 Launch of dried baby food products series and of the Mama100 web portal
2008-05 Accreditation of GMP certification for production facilities in Guangzhou
2009-05 Launch of baby cereal products
2010-05 Launch of BMcare™ branded baby care products
2010-12 Listed on the Main Board of The Stock Exchange of Hong Kong Limited
2011-09 Launching of BIOSTIME™ branded DHA and microencapsulated milk calcium products
Source: Company data, OP Research

Tue, 06 Nov 2012
China Dairy Sector
Page 51 of 66
Financial Summary - Biostime (1112 HK) Year to Dec FY10A FY11A FY12E FY13E FY14E
Year to Dec FY10A FY11A FY12E FY13E FY14E
Income Statement (RMB mn)
Ratios
Probiotic supplements 304 332 349 387 410
Gross margin (%) 71.1 66.5 65.1 64.7 64.4
Infant formulas 794 1,685 2,527 3,411 4,264
Operating margin (%) 27.1 32.6 28.2 27.7 27.5
Dried Baby food products 98 97 112 123 135
Net margin (%) 21.5 24.1 20.9 20.5 20.3
Baby care products 38 48 54 57 59
Selling & dist'n exp/Sales (%) (36.4) (32.4) (32.1) (32.2) (32.1)
Nutrition supplements 0 27 37 46 56
Admin exp/Sales (%) (7.1) (3.7) (3.8) (3.9) (3.9)
Turnover 1,234 2,189 3,078 4,024 4,924
Payout ratio (%) 38.2 70.6 40.0 40.0 40.0
YoY% 121% 77% 41% 31% 22%
Effective tax (%) (20.5) (26.1) (25.5) (26.0) (26.0)
COGS (356) (733) (1,074) (1,421) (1,753)
Total debt/equity (%) 0.0 0.0 3.5 2.7 2.2
Gross profit 877 1,456 2,004 2,603 3,171
Net debt (Cash)/equity (%) (104.1) (91.7) (76.9) (76.9) (79.6)
Gross margin 71.1% 66.5% 65.1% 64.7% 64.4%
Current ratio (x) 7.9 5.2 4.6 4.8 5.1
Other income 4 72 16 24 26
Quick ratio (x) 7.4 4.5 3.9 4.0 4.3
Selling & distribution (449) (709) (988) (1,296) (1,578)
Inventory T/O (days) 96 100 115 115 115
Admin (88) (82) (117) (155) (190)
AR T/O (days) 1 1 1 1 1
Other opex (10) (23) (46) (60) (74)
AP T/O (days) 54 33 33 33 33
Total opex (547) (814) (1,151) (1,511) (1,842)
Cash conversion cycle (days) 43 69 84 84 84
Operating profit 334 714 868 1,116 1,355 Operating margin 27.1% 32.6% 28.2% 27.7% 27.5%
EBIT margin (%) 27.1 32.6 28.2 27.7 27.5
Finance costs 0 0 (3) (3) (3)
Pre-tax/EBIT (x) 1.0 1.0 1.0 1.0 1.0
Profit after financing costs 334 714 865 1,113 1,352
Net profit/pre-tax (x) 0.8 0.7 0.7 0.7 0.7
Associated companies & JVs 0 0 0 0 0
Asset turnover (x) 0.6 0.9 1.1 1.1 1.1
Pre-tax profit 334 714 865 1,113 1,352
Assets/equity (x) 1.1 1.2 1.3 1.2 1.2
Tax (68) (187) (221) (289) (351)
Return on equity (%) 16.0 26.7 27.7 27.4 26.5
Minority interests 0 0 0 0 0 Net profit 266 527 644 824 1,000
Year to Dec FY10A FY11A FY12E FY13E FY14E
YoY% 145.3% 98.5% 22.2% 27.9% 21.4%
Balance Sheet (RMB mn)
Net margin 21.5% 24.1% 20.9% 20.5% 20.3%
Fixed assets 31 59 87 139 232
EBITDA 337 655 871 1,121 1,379
Intangible assets & goodwill 1 1 2 2 2
EBITDA margin 27.3% 29.9% 28.3% 27.9% 28.0%
Associated companies & JVs 0 0 0 0 0
EPS (RMB) 0.580 0.864 1.054 1.347 1.636
Long-term investments 0 0 108 108 108
YoY% 141.7% 48.9% 22.0% 27.9% 21.4%
Other non-current assets 7 227 238 253 270
DPS (RMB) 0.222 0.618 0.430 0.550 0.668
Non-current assets 40 288 435 501 612
Year to Dec FY10A FY11A FY12E FY13E FY14E
Inventories 106 297 382 517 592
Cash Flow (RMB mn)
AR 5 10 11 16 17
EBITDA 337 655 871 1,121 1,379
Prepayments & deposits 23 29 43 123 126
Chg in working cap 75 (72) 28 (92) 38
Other current assets 0 0 172 172 172
Others 13 56 6 7 8
Cash 1,728 1,814 1,872 2,393 3,089
Operating cash 425 639 904 1,037 1,425
Current assets 1,862 2,150 2,480 3,221 3,996
Interests paid 0 0 3 3 3 Tax (44) (123) (303) (289) (351)
AP 66 67 128 130 188
Net cash from operations 381 516 604 750 1,076
Tax 28 83 0 0 0
Accruals & other payables 142 265 332 458 517
Capex (18) (39) (55) (93) (158)
Bank loans & leases 0 0 82 82 82
Investments 0 (484) (280) 0 0
CB & othe debts 0 0 0 0 0
Dividends received 0 0 0 0 0
Other current liabilities 0 0 0 0 0
Sales of assets 0 0 0 0 0
Current liabilities 236 415 541 670 786
Interests received 1 2 14 5 11 Others 8 (9) (10) 7 1
Bank loans & leases 0 0 0 0 0
Investing cash (9) (529) (331) (82) (146)
CB & othe debts 0 0 0 0 0
FCF 372 (13) 273 669 930
Deferred tax & others 6 45 45 45 45
Issue of shares 1,413 21 0 0 0
MI 0 0 0 0 0
Buy-back 0 0 0 0 0
Non-current liabilities 6 45 45 45 45
Minority interests 0 0 0 0 0 Dividends paid (146) (180) (293) (145) (231)
Total net assets 1,660 1,978 2,328 3,007 3,777
Net change in bank loans (1) 0 82 0 0 Others (36) (10) (3) (3) (3)
Shareholder's equity 1,660 1,978 2,328 3,007 3,777
Financing cash 1,231 (169) (215) (148) (234)
Share capital 5 5 5 5 5
Reserves 1,655 1,972 2,323 3,002 3,772
Net change in cash 1,603 (182) 58 520 696 Exchange rate or other Adj (8) (56) 0 0 0
BVPS (RMB) 3.63 3.24 3.81 4.92 6.18
Opening cash 134 1,728 1,490 1,549 2,069 Closing cash 1,728 1,490 1,549 2,069 2,766
Total debts 0 0 82 82 82
CFPS (RMB) 3.778 2.441 2.533 3.384 4.522
Source: Company, OP Research

Tue, 06 Nov 2012
China Dairy Sector
Page 52 of 66
Mengniu Dairy (2319 HK) - No surprise
Revenue is projected to grow at a CAGR of 10% in 2011-2014E and led by a 7% CAGR in sales volume and a 3% CAGR of APS hike
GPM inches down 0.1% in FY12E and improves to 26.4% and 26.7% in FY13/14E by product mix improvement and raw milk price modest hike
OPM trims 0.2% in FY12E and rises by 30/30bps in FY13/14E due to Mengniu’s prudent cost control
The product mix improvement is Mengniu’s core strategy to maintain a healthy
profit growth. Premium products (GPM higher than 28%) represent around 28%
of the total revenue in 1H12. We believe continuous product mix shift towards
high-margin items will likely be accelerated as Mengniu has started to cut down
its low-margin products, thus the proportion of high-end products is expected to
rise by 2ppt-3ppt in the next few years.
Mengniu’s earning is highly vulnerable to raw milk price (45% of COGS) volatility.
We do not expect the raw milk price to increase significantly over the next three
years, as it sourced 84% of its raw milk from large-scale dairy farms and ranches
which charge relative stable price. It strengthens its procurement capacities and
saves cost of packaging (24% of COGS) by signing long-term contracts with
major suppliers and the tie up with COFCO.
It appears to us that Mengniu’s high growth era is behind us. Its brand value
and consumer loyalty are undermined after experiencing the melamine crisis in
2008 and M1 scandal in 2011. Although the new strategies initiated by new
management team can pave the way for long-term earnings growth, near-term
headwind from internal restructuring is visibility. We like Mengniu’s prudent cost
control and outstanding operating efficiency combined with continuing product
mix shift towards high-value added categories, however, all above are reflected in
current valuation, with 21x PE in 2013E. It strategically alliances with Arla
Food to generate RMB3bn sales from milk powder by 2015, and we classify it as
mid-to-long term catalyst.
Initial HOLD. We forecast Mengniu net profit growth at a CAGR of 11.2% for
FY11-FY14E. Based on a blending DCF/PER model, we estimate a fair value of
HK$24.20 per share, which implies 2013E PE of 19.0 x and suggests 2.98%
potential upside.
Initial Coverage
HOLD
Close price: HK$23.50
Target Price: HK$24.20 (+2.98%)
Key Data
HKEx code 2319
12 Months High (HK$) 28.00
12 Month Low (HK$) 18.02
3M Avg Dail Vol. (mn) 3.35
Issue Share (mn) 1,768.07
Market Cap (HK$mn) 41,549.55
Fiscal Year 12/2011
Major shareholder (s) COFCO (28.06%)
Source: Company data, Bloomberg, OP Research Closing price are as of 5/11/2012
Price Chart
1mth 3mth 6mth
Absolute % 1.7 2.6 -0.6
Rel. MSCI CHINA % -5.4 -6.9 -6.1
PE
Company Profi le Established in 1999, China Mengniu Dairy
(Mengniu) is one of the leading dairy-product
manufactures in China. It manufactures and
distributes dairy products in China primarily
under its core Mengniu brand. Its product
portfolio includes UHT milk, milk beverages
and yogurt, ice cream and milk powder.
Exhibit 55: Forecast and Valuation Year to Dec (RMB mn) FY10A FY11A FY12E FY13E FY14E
Revenue 30,265 37,388 39,764 44,343 49,133
Growth (%) 18% 24% 6% 12% 11%
Net Profit 1,237 1,589 1,504 1,841 2,161
Growth (%) 11% 28% -5% 22% 17%
Diluted EPS (RMB) 0.711 0.905 0.851 1.042 1.223
EPS growth (%) 5% 27% -6% 22% 17%
Change to previous EPS (%) n.a. n.a. n.a. n.a. n.a.
Consensus EPS (RMB)
0.848 1.077 1.274
ROE (%) 12.7 13.9 11.7 12.7 13.2
P/E (x) 26.8 21.1 22.4 18.3 15.6
P/B (x) 3.2 2.9 2.6 2.3 2.1
Yield (%) 0.9 1.0 1.0 1.2 1.4
DPS (HK$) 0.2 0.2 0.2 0.3 0.3
Source: Bloomberg, OP Research
0.0
5.0
10.0
15.0
20.0
25.0
30.0
Nov/11 Feb/12 May/12 Aug/12
HK$2319 HK MSCI CHINA
0
5
10
15
20
25
30
35
40
Dec/08 Sep/09 Jun/10 Mar/11 Dec/11 Sep/12
Forward P/E Ratio
+1std.
avg.
-1std.

Tue, 06 Nov 2012
China Dairy Sector
Page 53 of 66
Investment thesis
From plain to high-end
We reveal the customers’ propensity to upgrade for premium products after 2008
melamine scandal. The product mix improvement is Mengniu’s core strategy to
maintain a healthy profit growth, in our view. Besides hike ASP of exiting pillar
products, Mengniu continually optimizes its product portfolio by rolling out new
high premium products and targets different customer groups. Its premium
ultra-high temperature (UHT) milk brand Milk Deluxe caters to high income
consumer, for instance, commands more than double retail price of the
mid-to-low-end UHT pure milk series. Gross profit margin for high-end UHT
products such as Milk Deluxe, Future Star Milk (targets at children) and Xin Yang
Dao low-lactose Milk (tailor makes for white collar) are approximately
30%/35%/28% vs 20% for the mid-to low-end categories.
In 1H12, high-end products with gross profit margin higher than 28% represent
around 28% of the total revenue, increased by 5ppt yoy. This mix upgrade was
mainly due to high margin milk products that were less affected by the flavacin M1
incident in December 2012, growing up 14% yoy vs negative growth of lower
margin products. Continuing product mix shift towards high-margin items will
likely be faster as Mengniu has started to cut down its low-margin products (i.e.
gross margins below 20%) and focused on optimizing the product mix, thus the
proportion of high-end products is expected to rise by 2ppt-3ppt per year to
30%/33% in FY13/FY14, in our view.
Exhibit 56: High-end product proportion, FY09-1H12
Source: Company data, OP Research
15% 19% 23%28%
85% 81% 77%72%
FY09 1H10 1H11 1H12
High-end product Mid-to-low end product

Tue, 06 Nov 2012
China Dairy Sector
Page 54 of 66
Raw material price, STABLE
Raw milk is an important ingredient for Mengniu, accounting for 46% of COGS
based on our estimates. Thus Mengniu’s earning is highly vulnerable to raw milk
price volatility. We estimate that every 1 % hike in raw milk ASP will drop down
FY13E net profit by around 6.5%, other things being equal. The raw milk price
bottomed out dramatically in 2010 mainly due to i) rising cow feeding costs,
especially the corn price rose by 15% yoy; ii) milk supply shortage caused by
over-killing in cows after the melamine incident. We do not expect the raw milk
price to increase significantly over the next three years, as it strategically
cooperates with large-scale dairy farms and ranches, and the supply contracts
with them are usually long term and the price relatively stable. The company
currently sources c.84% of its raw milk from large-scale dairy farms and ranches,
targeting to 100% by 2015E. We also reveal that the cow feeding cost pressure
for famers has eased and the downward trend will continue in 2013.
Another major raw material cost is packaging, accounting for 24% of total COGS.
We expect the price of packaging materials to be stable in FY13, because
Mengniu has long-term contracts with its major suppliers (i.e. Tetra Pak, SIG
Combibloc and Greatview Aseptic). The tie up with COFCO could also help to
strengthen Mengniu’s raw material procurement capabilities and save cost of raw
material like sugar and packaging materials.
Exhibit 57: Raw material price
Source: sn110.com, alibaba.com, OP Research
SOE background: Like or not like?
Following the placement of a 20% stake to COFCO and Hopu on Jul 6, 2009,
COFCO is now the group’s largest shareholder with more than 28% of the
company stake after further acquiring 8% from the founders in July 2011. With a
state-owned enterprise (SOE) background, we caution about Mengniu’s future
earnings growth as SOEs do not have a successful track record of running
efficient operations and profitability is not their first priority but top-line growth.
Over the long term, we see positive synergies from this alliance. Mengniu has
started to leverage COFCO’s resources, such as i) sharing sales network to
12,000
12,500
13,000
13,500
14,000
14,500
15,000
15,500
Nov-11 Feb-12 May-12 Aug-12
(RMB/ton)
PET
2.0
2.2
2.4
2.6
2.8
3.0
3.2
3.4
Jan-08 Oct-08 Jul-09 Apr-10 Jan-11 Oct-11 Jul-12
(RMB/kg)
Raw milk

Tue, 06 Nov 2012
China Dairy Sector
Page 55 of 66
expand its footprint; ii) using COFCO’s network to source its raw materials; iii)
detecting the potential overseas partners based on COFCO’s platform. New
CEO’s solid experience in the beverage industry (more than 10 years at
Coca-Cola) and new mission and strategy for Mengniu are also in our favorable
list.
Quality control goes first
The group is now targeting to build a system to fully control of the entire industry
chain from upstream to retail, instead of separated quality control divisions as in
the past. However, it is a time-consuming process and operating expense
intensive project for Mengniu to build system and organization restructure, in our
view.
Currently, the company sources 84% of its raw milk from large-scale dairy farms,
and targets to 100% by 2015E. The management indicated that it would invest a
total of RMB3bn-3.5bn in upstream dairy farms to build six self-owned large scale
farms with 10k cows each(RMB2bn) and make minority investment (10-20%
stakes 1-1.5bn) in cattle ranches in 2012-2015E. It is also on track to achieve
1.5k tons of raw milk per day by 2015E. Sourcing high quality milk from
large-scale dairy farms will enable the company to roll out more premium
products and drive up the blended gross profit margin further.
Apple-to-apple comparison
We like Mengniu and mark it as the leader in China dairy industry as the reasons
of:
Mengniu has been the largest dairy-products supplier in China since 2007
with 26.1% and 22.9% market share in liquid milk and yogurt products as
June 30 of 2012, in terms of revenue. Its revenue registered at a CAGR of
21% from 2009-2011 after the melamine crisis in 2008. As the first Chinese
diary company among the world’s top-20, Mengniu was ranked 16th among
global dairy companies in 2010, up from 19th in 2009.
Exhibit 58: Market share of liquid milk and yogurt product in China, June 30 of 2012
Source: Company data, OP Research
Mengniu26%
Yili22%
Wahaha13%
Bright dairy
8%
Want want5%
Others26%
Liquid milk product market share as June 30of 2012
Mengniu23%
junlebao8%
Bright dairy22%
Yili 18%
sanyuan 3%
weiquan4%
others23%
Yogurt product market share as June 30 of 2012

Tue, 06 Nov 2012
China Dairy Sector
Page 56 of 66
After comparing with its closest peers Yili (600887 CH, NR) and Bright Dairy
(600597 CH, NR), we found Mengniu’s revenue were largely generated
from liquid milk and has around 6% gap with Yili in milk powder segment.
Co-operation with Arla and launching more milk powder products under
Mengniu own brands and Arla’s brands will narrow the gap in the coming
years, in our view.
Mengniu recorded the lowest gross profit margin while highest EBIT margin,
due in part to different accounting principles adopted by these three
companies for listing in different stock market. Thus we think it is
meaningless to use EBIT margin or gross profit margin as standards to
compare their profitability. Mengniu delivered the lowest SG&A expense
ratio versus Yili and Bright Dairy, reflecting its prudent cost control and
outstanding operating efficiency in this industry.
Mengniu’s best-in-breed inventory management ability is demonstrated by
its low inventory turnover days of 19 days versus Yili’s 41 day and Bright
Dairy’s 44 days.
The solid balance sheet is underpinned by RMB5.8 of net cash at FY11 with
48% net-cash-to-equity ratio, versus Yili’s 12% and Bright Dairy’s -27 %.
Exhibit 59: Comparisions between Mengniu, Yili and Bright Dairy, 2011
(RMB mn) Mengniu (2319 HK) Yili (600887 CH) Bright Dairy (600597 CH)
Revenue 37,388 37,218 11,725
Revenue mix
Liquid milk 90% 72% n.a.
Milk powder 9% 15% n.a.
Others 1% 12% n.a.
Margin %
Gross profit 25.7 28.8 32.9
EBIT 4.6 3.9 2.1
Net profit 4.3 4.9 2
Operating expense ( as % of total revenue)
Selling and distribution expense 17.90% 19.50% 27.50%
Administrative expense 2.97% 5.26% 3.01%
Working capital
A/R days 7 3 33
A/P days 30 54 53
Inventory days 19 41 44
Cash Conversion Cycle -4 -10 24
Balance sheet
Cash 4,360 3,921 1,114
Net Cash 5,838 779 -754
Net Cash/Equity (%) 48 12 -27
Source: Company data, OP Research
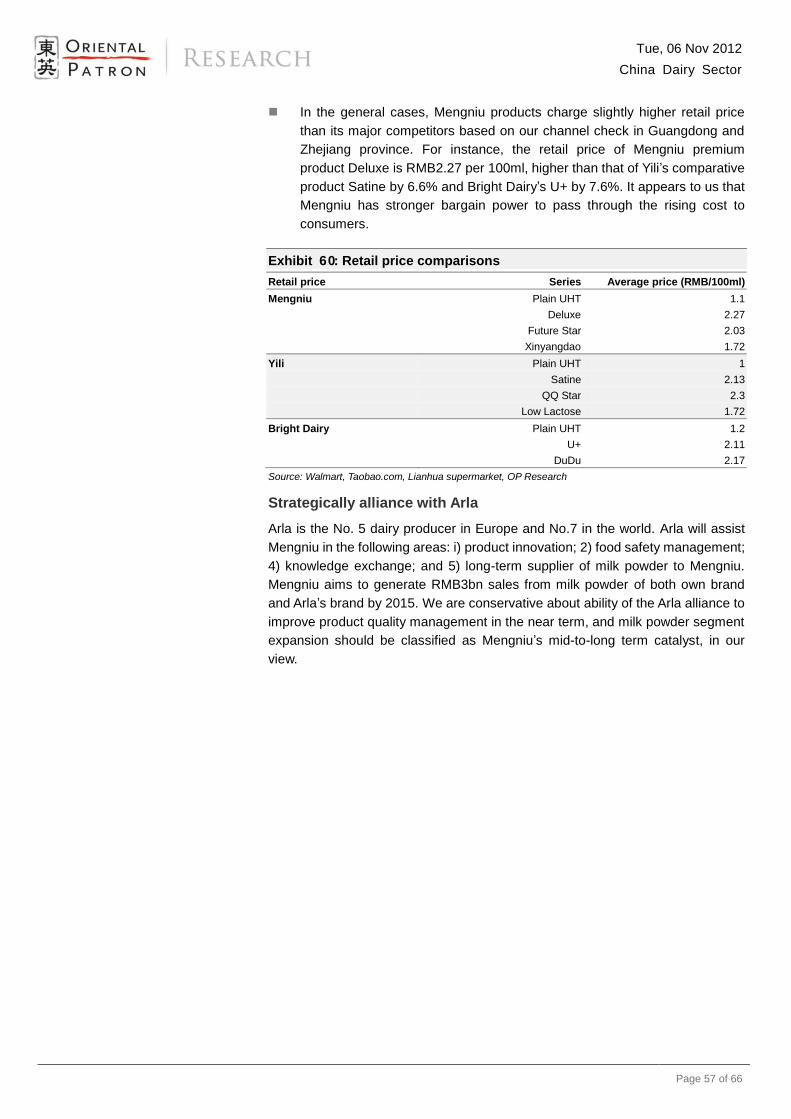
Tue, 06 Nov 2012
China Dairy Sector
Page 57 of 66
In the general cases, Mengniu products charge slightly higher retail price
than its major competitors based on our channel check in Guangdong and
Zhejiang province. For instance, the retail price of Mengniu premium
product Deluxe is RMB2.27 per 100ml, higher than that of Yili’s comparative
product Satine by 6.6% and Bright Dairy’s U+ by 7.6%. It appears to us that
Mengniu has stronger bargain power to pass through the rising cost to
consumers.
Exhibit 60: Retail price comparisons
Retail price Series Average price (RMB/100ml)
Mengniu Plain UHT 1.1
Deluxe 2.27
Future Star 2.03
Xinyangdao 1.72
Yili Plain UHT 1
Satine 2.13
QQ Star 2.3
Low Lactose 1.72
Bright Dairy Plain UHT 1.2
U+ 2.11
DuDu 2.17
Source: Walmart, Taobao.com, Lianhua supermarket, OP Research
Strategically alliance with Arla
Arla is the No. 5 dairy producer in Europe and No.7 in the world. Arla will assist
Mengniu in the following areas: i) product innovation; 2) food safety management;
4) knowledge exchange; and 5) long-term supplier of milk powder to Mengniu.
Mengniu aims to generate RMB3bn sales from milk powder of both own brand
and Arla’s brand by 2015. We are conservative about ability of the Arla alliance to
improve product quality management in the near term, and milk powder segment
expansion should be classified as Mengniu’s mid-to-long term catalyst, in our
view.

Tue, 06 Nov 2012
China Dairy Sector
Page 58 of 66
Earnings forecast
The dairy industry in China is expected to grow 9% CAGR over 2011-2014E,
according to Euromonitor, and Mengniu’s pace will be faster at 10-12%, in the
view of management. We think the sales target is undemanding as Mengniu’s
niche market positioning and sourcing raw milk from large scale farms to roll out
high quality premium products to secure its top-line growth.
We forecast Mengniu’s revenue to rise from RMB37.4bn in FY11 to RMB49.13bn
in FY14E, equating to a CAGR of 10% and led by a 7% CAGR in sales volume
and a 3% CAGR of APS hike. Liquid milk is still the major revenue-growth driver
over the next three years, in our calculation.
Exhibit 61: Revenue forecast, 2012E-2014E
Sales (RMB mn) FY12E FY13E FY14E
Liquid milk 35,324 39,392 43,519
yoy % 4.8% 11.5% 10.5%
Ice-cream 3,922 4,324 4,903
yoy % 20% 10% 13%
Other dairy 518 627 711
yoy % 21% 21% 13%
Total sales 39,764 44,343 49,133
yoy % 6.4% 11.5% 10.8%
Source: Company data, OP Research
Gross profit margin: we project gross profit margin inched down 0.1% in FY12
to 25.6% from 25.7% in FY11 as bigger discount to distributors to recover sales
after the safety incident. We forecast the gross profit margin to remain relatively
flattish and improve by 80/30bps in FY13E/14E to 26.4% and 26.7% on the back
of i) continuing product mix shift towards high-margin items; ii) cost saving from
the tie up with COFCO; iii) modest hike of raw milk price due to rising proportion
of sourcing from large scale farms which charge premium price for high quality
raw milk.
Operating profit margin: we expect the operating profit margin will trim 0.2% to
4.9% in FY12 from 5.1% in FY11 due to extra A&P expense to revive sales. We
estimate that the operating profit margin rose by 30/30bps in FY13E/14E to
5.2%/5.5%, factoring in i) Mengniu’s prudent cost control and outstanding
operating efficiency; ii) upside risk for opex in building a system to fully control of
the entire industry chain from upstream to retail; iii) manageable share option
expense (the management expects a share option expense of
RMB210mn/150mn in FY12E/13E).
We forecast Mengniu net profit to rise at a CAGR of 10.8% for FY11-FY14E,
corresponding to net profit of RMB1,504mn (or RMB0.85/share) for 2012E,
RMB1,841mn (or RMB1.04/share) for 2014E, and RMB2,161mn (or
RMB1.22/share) for 2015E.

Tue, 06 Nov 2012
China Dairy Sector
Page 59 of 66
Key risks
Food safety issues
Any national food safety issues could negatively impact the consumer’s
confidence for Mengniu’s products and further lead to slowdown the growth of
sales volume and inventory write-offs, like melamine incident in 2008 and M1
scandal in 2011. Bigger discount for distributors to recover the sales will bring
upside risk of operating expense.
Slowing the growth of liquid milk consumption
Approximately 87% of revenue is generated from liquid milk. We anticipate the
production of liquid milk will continue to be Mengniu’s primary business. Its sales
growth is highly dependent on and sensitive to market demand for liquid milk. The
industry output has first recorded negative growth (-8.4%) in July 2012 since
2009, on back of food safety incidents and hiking feeding cost to drive smaller
farmers out of the business. While the industry rebounded quickly in Sep 2012.
Mengniu possesses the highest market share (26.1%) in the liquid market; China
liquid milk industry slowdown does not a good single for Mengniu, in our view.
Rising raw material price
With raw milk and packing total accounting for 70% of Mengniu’s cost of goods
sold, thus Mengniu’s earnings are highly affected by price of these two major raw
materials. Thus, in the event that cost increases are not passed through to
consumers, Mengniu’s earnings will be undermined. Based on our sensitivity
analysis, every 1% increase in raw milk price could lead to a 6.3% decline of net
profit in FY12, all else equal.
Outbreak of any major diseases among cows may disruption of raw
milk supply
84% of Mengniu’s raw milk are sourcing from large scale farms, and thus
maintains relatively stable and sufficient supply. Any major outbreak of any illness
and disease among cows could lead to shortage of raw milk supply and directly
hurt the sales growth.

Tue, 06 Nov 2012
China Dairy Sector
Page 60 of 66
Valuation
It appears to us that Mengniu’s high growth era is behind us. Its brand value and
consumer loyalty are undermined after experienced the melamine crisis in 2008
and M1 scandal in 2011. Although the new strategies initiated by new
management team can pave the way for long-term earnings growth, near-term
headwind from internal restructuring is visible. We like Mengniu’s prudent cost
control and outstanding operating efficiency combined with continuing product
mix shift towards high-value added categories, however, all above are fully
reflected in current valuation, with 21x PE in 2013. We found the
Bloomberg-consensus EPS forecast has been revised down since December
2011 and this trend even speeded up after Mengniu’s interim results, partly due to
their concerns about its recovery pace and disappointing result of 1H12. The
market relative bearish mood reflected our downside risk concerns.
Exhibit 62: Earning revisions
Source: Bloomberg, OP Research
DCF Model
Given its cash flow-generative business nature and long-term development
company, we use DCF-based methodology to derive the 12-month target price of
HK$23.40 for Mengniu. We use cost of equity of 12%, based on the assumptions
are: i) risk free rate of 3%, based on the annual yield on China’s 10-year
government bond; ii) market risk premium of 9%; iii) beta of 1.03 to factor in the
stock’s volatility relative to the Hang Seng Index; iv) 2% terminal growth rate from
2022 onward, in line with our long-term growth assumption for China consumer
plays.
0.6
0.8
1
1.2
1.4
1.6
1.8
Jun-09 Dec-09 Jun-10 Dec-10 Jun-11 Dec-11 Jun-12
FY12 FY13
(RMB)

Tue, 06 Nov 2012
China Dairy Sector
Page 61 of 66
We also conduct sensitivity analysis to quantify how target price changes in
different scenarios of cost of equity and terminal growth rate.
Exhibit 63: Sensitivity analysis of target price to Cost of Equity and Terminal growth rate assumption
FCFE Sensitive Analysis Perpetual growth rate (%)
23.4 1.0% 1.5% 2.0% 2.5% 3.0%
Cost of Equity (%)
11.3% 24.4 24.9 25.4 26.0 26.7
11.8% 23.5 23.9 24.4 24.9 25.5
12.3% 22.6 23.0 23.4 23.9 24.4
12.8% 21.9 22.2 22.6 23.0 23.4
13.3% 21.2 21.5 21.8 22.1 22.5
13.8% 20.5 20.8 21.1 21.4 21.7
Source: OP Research
PER model
We also derive our 12-month target price of HK$25.00 from a PER based
methodology. The 2013E P/E multiple is 19.5x, based on a 20% discount to the
staple large cap average (24.5x for FY13E) on back of i) Mengniu modest
earnings growth for FY11-FY14E; ii) relatively low dividend yield 0.8% versus 1.6%
for industry average; iii) high sensitivity to food safety incident.
Exhibit 64: Peer group valuation comparison @ Nov 5, 2012
Company Ticker Price Mkt cap (US$ mn) PER FY1 (x) PER FY2 (x) 3-Yr EPS Cagr (%) Div yld FY1 (%) P/B FY1 (x)
China Mengniu Dairy* 2319 HK 23.50 5,361 23.4 19.0 10.8 0.8 2.6
Tingyi Hldg Co 322 HK 22.50 16,237 33.4 27.1 21.0 1.3 6.57
Want Want China 151 HK 11.22 19,150 35.3 28.4 24.4 1.6 11.96
China Res Enterp 291 HK 27.00 8,363 25.4 22.7 6.5 1.7 1.69
Tsingtao Brew-H 168 HK 43.00 7,173 25.4 21.8 12.9 0.7 3.62
China Foods 506 HK 7.86 2,836 23.7 19.2 29.6 1.3 2.95
Uni-President 220 HK 9.86 4,579 32.0 26.8 60.1 0.3 3.75
*OP estimate
Source: Bloomberg, OP Research
Based on a blending DCF/PER model, we estimate a fair value of HK$24.20 per
share, which implies 2013E PE of 19.0x and suggests 2.98% potential upside.
We give a HOLD rating.

Tue, 06 Nov 2012
China Dairy Sector
Page 62 of 66
Appendix
Company information
In 1999, Mr Niu Gensheng along with nine other founders, including the former
CEO Mr YANG Wenjun established Mengniu. Mengniu is the largest dairy
product manufacturer in China, with MENGNIU as the core brand. Its product
portfolio includes liquid milk (such as UHT milk, milk beverage, and yogurt)
accounting for 86.8% of total revenue, ice cream and other dairy products (i.e.
milk powder and cheese).
The company was listed in HKEx in Jun 2004. In Jul 2009, COFCO and Hopu
investment became joint controlling shareholder with a 20.0% stake. Then on July
2011, COFCO acquired 8% from the founders and becomes the largest
shareholder. Ms. Sun Yiping, appointed as the new CEO of Mengniu on 12 April
2012, meanwhile the former CEO Mr. YANG Wenjun resigned on 30 July 2012.
Exhibit 65: Revenue mix and Capacity
Source: Company data, OP Research
5.575.76
6.5
7.05
7.39
4.0
5.0
6.0
7.0
8.0
2008 2009 2010 2011 1H2012
(mn ton)
UHT Milk52%
Milk beverage
22%
Yogurt13%
Ice Cream12%
Other dairy products
1%

Tue, 06 Nov 2012
China Dairy Sector
Page 63 of 66
Financial Summary - Mengniu Dairy (2319 HK) Year to Dec FY10A FY11A FY12E FY13E FY14E
Year to Dec FY10A FY11A FY12E FY13E FY14E
Income Statement (RMB mn)
Ratios
Liquid Milk 26,872 33,701 35,324 39,392 43,519
Gross margin (%) 25.7 25.7 25.6 26.4 26.7
Ice Cream 3,112 3,259 3,922 4,324 4,903
Operating margin (%) 4.8 5.1 4.9 5.2 5.5
Other Dairy Products 282 428 518 627 711
Net margin (%) 4.1 4.3 3.8 4.2 4.4
Turnover 30,265 37,388 39,764 44,343 49,133
Selling & dist'n exp/Sales (%) (17.9) (17.9) (18.3) (18.7) (18.7)
YoY% 18% 24% 6% 12% 11%
Admin exp/Sales (%) (3.4) (3.0) (2.5) (2.5) (2.5)
COGS (22,479) (27,796) (29,602) (32,656) (36,037)
Payout ratio (%) 22.5 22.0 22.0 22.0 22.0
Gross profit 7,786 9,592 10,162 11,687 13,097
Effective tax (%) (9.6) (12.4) (15.0) (16.0) (17.0)
Gross margin 25.7% 25.7% 25.6% 26.4% 26.7%
Total debt/equity (%) 8.6 5.7 6.6 5.9 5.2
Other income 193 296 123 137 151
Net debt(Cash)/equity (%) (30.1) (32.3) (34.8) (41.4) (46.9)
Selling & distribution (5,429) (6,695) (7,284) (8,300) (9,203)
Current ratio (x) 1.5 1.4 1.5 1.6 1.6
Admin (1,036) (1,110) (989) (1,125) (1,222)
Quick ratio (x) 1.4 1.2 1.3 1.4 1.4
Other opex (60) (187) (80) (89) (98)
Inventory T/O (days) 15 19 22 21 19
Total opex (6,525) (7,992) (8,352) (9,513) (10,523)
AR T/O (days) 7 7 7 7 7
Operating profit (EBIT) 1,455 1,896 1,932 2,311 2,725
AP T/O (days) 36 35 34 33 33
Operating margin 4.8% 5.1% 4.9% 5.2% 5.5%
Cash conversion cycle (days) (13) (10) (5) (5) (7)
Interest income 88 173 148 179 220 Finance costs (45) (61) (79) (79) (79)
EBIT margin (%) 4.8 5.1 4.9 5.2 5.5
Profit after financing costs 1,498 2,009 2,001 2,411 2,866
Pre-tax/EBIT (x) 1.1 1.1 1.0 1.1 1.1
Associated companies & JVs 40 52 0 55 57
Net profit/pre-tax (x) 0.8 0.8 0.8 0.7 0.7
Pre-tax profit 1,538 2,061 2,001 2,466 2,924
Asset turnover (x) 1.7 1.9 1.8 1.8 1.8
Tax (182) (276) (330) (420) (523)
Assets/equity (x) 1.8 1.8 1.7 1.7 1.7
Minority interests (119) (195) (167) (205) (240)
Return on equity (%) 12.7 13.9 11.7 12.7 13.2
Net profit 1,237 1,589 1,504 1,841 2,161 YoY% 10.9% 28.4% -5.4% 22.4% 17.4%
Year to Dec FY10A FY11A FY12E FY13E FY14E
Net margin 4.1% 4.3% 3.8% 4.2% 4.4%
Balance Sheet (RMB mn)
EBITDA 2,168 2,760 2,920 3,412 3,952
Fixed assets 6,400 8,279 9,040 9,884 10,808
EBITDA margin 7.2% 7.4% 7.3% 7.7% 8.0%
Intangible assets & goodwill 673 707 699 692 687
EPS (RMB) 0.711 0.905 0.851 1.042 1.223
Associated companies & JVs 114 153 153 208 265
YoY% 4.6% 27.3% -6.0% 22.4% 17.4%
Long-term investments 302 539 539 539 539
DPS (RMB) 0.170 0.199 0.187 0.229 0.269
Other non-current assets 153 137 137 137 137
Non-current assets 7,642 9,815 10,568 11,459 12,436
Year to Dec FY10A FY11A FY12E FY13E FY14E Cash Flow (RMB mn)
Inventories 1,176 1,685 1,849 1,900 1,943
EBITDA 2,168 2,760 2,920 3,412 3,952
AR 575 836 791 858 951
Chg in working cap 153 7 551 554 530
Prepayments & deposits 1,215 1,342 1,609 1,725 1,884
Others 305 (4) 134 83 67
Other current assets 2,923 2,163 2,163 2,163 2,163
Operating cash 2,626 2,763 3,605 4,049 4,550
Cash 3,775 4,360 5,319 6,853 8,550
Interests paid (39) (46) (79) (79) (79)
Current assets 9,664 10,387 11,732 13,500 15,491
Tax (102) (196) (330) (420) (523) Net cash from operations 2,485 2,520 3,196 3,551 3,949
AP 3,548 3,685 3,793 4,230 4,687
Tax 43 103 103 103 103
Capex (1,136) (2,381) (1,739) (1,939) (2,149)
Accruals & other payables 1,941 2,763 3,036 3,385 3,751
Investments (416) (223) (558) 0 0
Bank loans & leases 551 538 732 732 732
Dividends received 13 11 0 0 0
CB & othe debts 140 119 119 119 119
Interests received 82 168 148 179 220
Other current liabilities 15 19 19 19 19
Others (748) 780 67 75 83
Current liabilities 6,238 7,226 7,802 8,589 9,412
Investing cash (2,204) (1,645) (2,082) (1,685) (1,846) FCF 281 875 1,114 1,865 2,102
Bank loans & leases 150 0 0 0 0
Issue of shares 13 521 0 0 0
CB & othe debts 0 0 0 0 0
Buy-back 0 0 0 0 0
Deferred tax & others 700 927 927 927 927
Minority interests 0 0 0 0 0
MI 459 578 745 949 1,190
Dividends paid (273) (331) (350) (331) (405)
Non-current liabilities 1,309 1,505 1,672 1,877 2,117
Net change in bank loans (130) (280) 195 0 0 Others (6) (148) 0 0 0
Total net assets 9,758 11,471 12,826 14,494 16,399
Financing cash (396) (238) (155) (331) (405)
Shareholder's equity 9,758 11,471 12,826 14,494 16,399
Net change in cash (115) 637 959 1,534 1,697
Share capital 2,229 3,255 4,409 5,920 7,675
Exchange rate or other Adj (96) (52) 0 0 0
Reserves 7,529 8,216 8,417 8,574 8,724
Opening cash 3,987 3,775 4,360 5,319 6,853 Closing cash 3,775 4,360 5,319 6,853 8,550
BVPS (RMB) 5.96 6.53 7.26 8.20 9.28
CFPS (RMB) 2.306 2.482 3.009 3.877 4.837
Total debts 841 657 851 851 851
Net cash/(debts) 2,934 3,703 4,468 6,002 7,699
Source: Company, OP Research
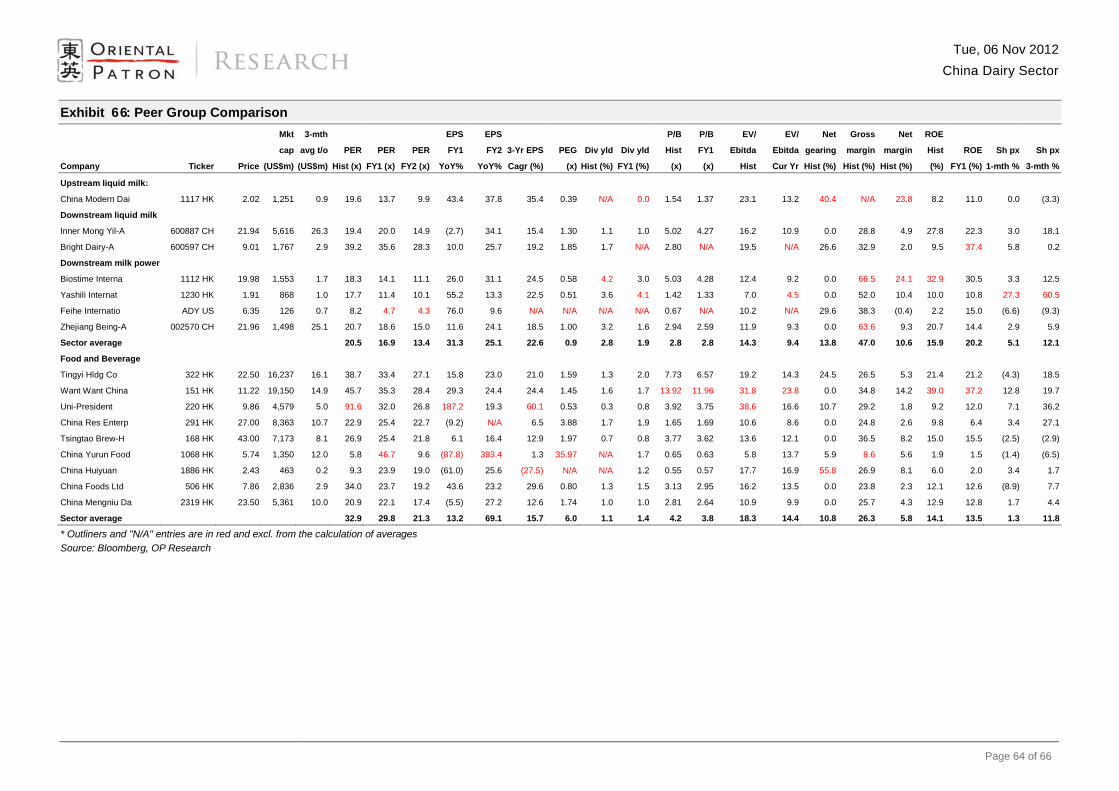
Tue, 06 Nov 2012
China Dairy Sector
Page 64 of 66
Exhibit 66: Peer Group Comparison
Company Ticker Price
Mkt
cap
(US$m)
3-mth
avg t/o
(US$m)
PER
Hist (x)
PER
FY1 (x)
PER
FY2 (x)
EPS
FY1
YoY%
EPS
FY2
YoY%
3-Yr EPS
Cagr (%)
PEG
(x)
Div yld
Hist (%)
Div yld
FY1 (%)
P/B
Hist
(x)
P/B
FY1
(x)
EV/
Ebitda
Hist
EV/
Ebitda
Cur Yr
Net
gearing
Hist (%)
Gross
margin
Hist (%)
Net
margin
Hist (%)
ROE
Hist
(%)
ROE
FY1 (%)
Sh px
1-mth %
Sh px
3-mth %
Upstream liquid milk:
China Modern Dai 1117 HK 2.02 1,251 0.9 19.6 13.7 9.9 43.4 37.8 35.4 0.39 N/A 0.0 1.54 1.37 23.1 13.2 40.4 N/A 23.8 8.2 11.0 0.0 (3.3)
Downstream liquid milk
Inner Mong Yil-A 600887 CH 21.94 5,616 26.3 19.4 20.0 14.9 (2.7) 34.1 15.4 1.30 1.1 1.0 5.02 4.27 16.2 10.9 0.0 28.8 4.9 27.8 22.3 3.0 18.1
Bright Dairy-A 600597 CH 9.01 1,767 2.9 39.2 35.6 28.3 10.0 25.7 19.2 1.85 1.7 N/A 2.80 N/A 19.5 N/A 26.6 32.9 2.0 9.5 37.4 5.8 0.2
Downstream milk power
Biostime Interna 1112 HK 19.98 1,553 1.7 18.3 14.1 11.1 26.0 31.1 24.5 0.58 4.2 3.0 5.03 4.28 12.4 9.2 0.0 66.5 24.1 32.9 30.5 3.3 12.5
Yashili Internat 1230 HK 1.91 868 1.0 17.7 11.4 10.1 55.2 13.3 22.5 0.51 3.6 4.1 1.42 1.33 7.0 4.5 0.0 52.0 10.4 10.0 10.8 27.3 60.5
Feihe Internatio ADY US 6.35 126 0.7 8.2 4.7 4.3 76.0 9.6 N/A N/A N/A N/A 0.67 N/A 10.2 N/A 29.6 38.3 (0.4) 2.2 15.0 (6.6) (9.3)
Zhejiang Being-A 002570 CH 21.96 1,498 25.1 20.7 18.6 15.0 11.6 24.1 18.5 1.00 3.2 1.6 2.94 2.59 11.9 9.3 0.0 63.6 9.3 20.7 14.4 2.9 5.9
Sector average
20.5 16.9 13.4 31.3 25.1 22.6 0.9 2.8 1.9 2.8 2.8 14.3 9.4 13.8 47.0 10.6 15.9 20.2 5.1 12.1
Food and Beverage
Tingyi Hldg Co 322 HK 22.50 16,237 16.1 38.7 33.4 27.1 15.8 23.0 21.0 1.59 1.3 2.0 7.73 6.57 19.2 14.3 24.5 26.5 5.3 21.4 21.2 (4.3) 18.5
Want Want China 151 HK 11.22 19,150 14.9 45.7 35.3 28.4 29.3 24.4 24.4 1.45 1.6 1.7 13.92 11.96 31.8 23.8 0.0 34.8 14.2 39.0 37.2 12.8 19.7
Uni-President 220 HK 9.86 4,579 5.0 91.6 32.0 26.8 187.2 19.3 60.1 0.53 0.3 0.8 3.92 3.75 38.6 16.6 10.7 29.2 1.8 9.2 12.0 7.1 36.2
China Res Enterp 291 HK 27.00 8,363 10.7 22.9 25.4 22.7 (9.2) N/A 6.5 3.88 1.7 1.9 1.65 1.69 10.6 8.6 0.0 24.8 2.6 9.8 6.4 3.4 27.1
Tsingtao Brew-H 168 HK 43.00 7,173 8.1 26.9 25.4 21.8 6.1 16.4 12.9 1.97 0.7 0.8 3.77 3.62 13.6 12.1 0.0 36.5 8.2 15.0 15.5 (2.5) (2.9)
China Yurun Food 1068 HK 5.74 1,350 12.0 5.8 46.7 9.6 (87.8) 393.4 1.3 35.97 N/A 1.7 0.65 0.63 5.8 13.7 5.9 8.6 5.6 1.9 1.5 (1.4) (6.5)
China Huiyuan 1886 HK 2.43 463 0.2 9.3 23.9 19.0 (61.0) 25.6 (27.5) N/A N/A 1.2 0.55 0.57 17.7 16.9 55.8 26.9 8.1 6.0 2.0 3.4 1.7
China Foods Ltd 506 HK 7.86 2,836 2.9 34.0 23.7 19.2 43.6 23.2 29.6 0.80 1.3 1.5 3.13 2.95 16.2 13.5 0.0 23.8 2.3 12.1 12.6 (8.9) 7.7
China Mengniu Da 2319 HK 23.50 5,361 10.0 20.9 22.1 17.4 (5.5) 27.2 12.6 1.74 1.0 1.0 2.81 2.64 10.9 9.9 0.0 25.7 4.3 12.9 12.8 1.7 4.4
Sector average
32.9 29.8 21.3 13.2 69.1 15.7 6.0 1.1 1.4 4.2 3.8 18.3 14.4 10.8 26.3 5.8 14.1 13.5 1.3 11.8
* Outliners and "N/A" entries are in red and excl. from the calculation of averages
Source: Bloomberg, OP Research

Tue, 06 Nov 2012
China Dairy Sector
Page 65 of 66
Our recent reports Date Company / Sector Stock Code Title Rating Analyst
05/11/2012 China Oil & Gas Sector - The New Gas Consumption Policy - Alan Lau
05/11/2012 China Solar Sector - Who's next ? - Alan Lau
01/11/2012 Hong Kong Jewellery
Retailers
- Weak consumption demand in mid-term - Terence Lok
29/10/2012 TCL COMM 2618 Loss making 3Q12 SELL Yuji Fung
29/10/2012 TCL Multimedia 1070 In-line 9M12 results BUY Yuji Fung
26/10/2012 Great Wall Motor 2333 Higher ASP and lower admin cost boost 3Q12
earnings
HOLD Vivien Chan
24/10/2012 Dongfeng Motor 489 New JV set up BUY Vivien Chan
22/10/2012 Sunny Optical 2382 Sept shipments on track BUY Yuji Fung
19/10/2012 China Auto Sector - Eye On 2013 BUY Vivien Chan
11/10/2012 Man Wah 1999 Key takeaway from site visit NR -
11/10/2012 TCL COMM 2618 Sept shipments remain weak SELL Yuji Fung
11/10/2012 TCL Multimedia 1070 Sept LCD TV shipments hit record high BUY Yuji Fung
09/10/2012 Comtec Solar 712 Unlikely to be affected by US anti-dumping NR Alan Lau
24/09/2012 China Lilang 1234 Sales orders came with negative surprise HOLD Daniel Wong
21/09/2012 Sunny Optical 2382 Handset camera module shipments break 8mn
threshold in Aug
BUY Yuji Fung
14/09/2012 Highlights of Zhuhai Energy
Tour
- Key takeaways - -
11/09/2012 Highlights of Macau Gaming
Tour
- Gambling situation - -
07/09/2012 TCL COMM 2618 Aug shipments remain weak HOLD Yuji Fung
07/09/2012 TCL Multimedia 1070 Aug Shipments on track BUY Yuji Fung
07/09/2012 Smartone 315 Challenging ahead HOLD Yuji Fung
06/09/2012 Future Bright 703 Largest restaurant chain with local wise NR Daniel Wong
06/09/2012 China All Access 633 1H12 results miss on delay in revenue recognition BUY Yuji Fung
04/09/2012 ASR Holdings 1803 1H12 results broadly in-line BUY Yuji Fung
31/08/2012 Dongfeng Motor 489 1H12 Results Review NR Vivien Chan
30/08/2012 Want Want China 151 Robust 1H12 results NR Daniel Wong
30/08/2012 Emperor W&J 887 1H12 results review NR -
30/08/2012 Brilliance China 1114 1H12 Results Review NR Vivien Chan

TERMS FOR PROVISION OF REPORT, DISCLAIMERS AND DISCLOSURES
By accepting this report, you represent and warrant that you are entitled to receive such report in accordance with the restrictions set forth below and agree to be bound by the limitations contained herein. Any failure to comply with these limitations may constitute a violation of law or termination of such services provided to you.
Disclaimer
Research distributed in Hong Kong is intended only for institutional investors whose ordinary business activities involve investing in shares, bonds and associated securities and/or derivative securities and who have professional experience in such investments. Any person who is not an institutional investor must not rely on this communication.
The information and material presented herein are not directed at, or intended for distribution to or use by, any person or entity who is a citizen or resident of or located in any jurisdiction where such distribution, publication, availability or use would be contrary to applicable law or regulation or which would subject Oriental Patron Securities Limited (“OPSL”) and/or its associated companies and/or its affiliates (collectively “Oriental Patron”) to any registration or licensing requirement within such jurisdiction.
The information and material presented herein are provided for information purposes only and are not to be used or considered as an offer or a solicitation to sell or an offer or solicitation to buy or subscribe for securities, investment products or other financial instruments, nor to constitute any advice or recommendation with respect to such securities, investment products or other financial instruments.
This research report is prepared for general circulation. It does not have regard to the specific investment objectives, financial situation and the particular needs of any specific person who may receive this report. This report is not to be relied upon in substitution for the exercise of independent judgment. Oriental Patron may have issued other reports that are inconsistent with, and reach different conclusions from, the information presented in this report. Those reports reflect the different assumptions, views and analytical methods of the analysts who prepared them. You should independently evaluate particular investments and you should consult an independent financial adviser before making any investments or entering into any transaction in relation to any securities mentioned in this report.
Information and opinions presented in this report have been obtained or derived from sources believed by Oriental Patron to be reliable, but Oriental Patron makes no representation as to their accuracy or completeness and Oriental Patron accepts no liability for loss arising from the use of the material presented in this report where permitted by law and/or regulation. Further, opinions expressed in this report are subject to change without notice. Oriental Patron does not accept any liability whatsoever whether direct or indirect that may arise from the use of information contained in this report.
The research analyst(s) primarily responsible for the preparation of this report confirm(s) that (a) all of the views expressed in this report accurately reflects his or their personal views about any and all of the subject securities or issuers; and (b) that no part of his or their compensation was, is or will be, directly or indirectly, related to the specific recommendations or views he or they expressed in this report.
Past performance should not be taken as an indication or guarantee of future performance, and no representation or warranty, express or implied, is made regarding future performance.
Oriental Patron, its directors, officers and employees may have investments in securities or derivatives of any companies mentioned in this report, and may make investment decisions that are inconsistent with the views expressed in this report.
General Disclosure
Oriental Patron, its directors, officers and employees, including persons involved in the preparation or issuance of this report, may, to the extent permitted by law, from time to time participate or invest in financing transactions with the issuer(s) of the securities mentioned in this report, perform services for or solicit business from such issuers, and/or have a position or holding, or other material interest, or effect transactions, in such securities or options thereon, or other investments related thereto. In addition, it may make markets in the securities mentioned in the material presented in this report. Oriental Patron may, to the extent permitted by law, act upon or use the information presented herein, or the research or analysis on which they are based, before the material is published. One or more directors, officers and/or employees of Oriental Patron may be a director of the issuers of the securities mentioned in this report. Oriental Patron may have, within the last three years, served as manager or co-manager of a public offering of securities for, or currently may make a primary market in issues of, any or all of the entities mentioned in this report or may be providing, or have provided within the previous 12 months, significant advice or investment services in relation to the investment concerned or a related investment or investment banking service to the issuers of the securities mentioned in this report.
Regulatory Disclosures as required by the Hong Kong Securities and Futures Commission
Oriental Patron (inclusive of OPSL) which are carrying on a business in Hong Kong in investment banking, proprietary trading or market making or agency broking are not a market maker in the securities of the subject companies mentioned in this report. Unless otherwise specified, Oriental Patron does not have any investment banking relationship with the companies mentioned in this report within the last 12 months. As at the date of this report, Oriental Patron do not have any interests in the subject company(ies) aggregating to an amount equal to or more than 1% of the subject company(ies) market capitalization.
Analyst Certification:
The views expressed in this research report accurately reflect the analyst’s personal views about any and all of the subject securities or issuers; and no part of the research analyst’s compensation was, is or will be, directly or indirectly, related to the specific recommendations or views expressed in the report.
Rating and Related Definitions
Buy (B) We expect this stock outperform the relevant benchmark greater than 15% over the next 12 months. Hold (H) We expect this stock to perform in line with the relevant benchmark over the next 12 months. Sell (S) We expect this stock to underperform the relevant benchmark greater than 15% over the next 12 month. Relevant Benchmark Represents the stock closing price as at the date quoted in this report.
Copyright © 2012 Oriental Patron Financial Group. All Rights Reserved
This report is being supplied to you strictly on the basis that it will remain confidential. Except as specifically permitted, no part of this presentation may be reproduced or distributed in any manner without the prior written permission of Oriental Patron. Oriental Patron accepts no liability whatsoever for the actions of third parties in this respect.
CONTACT
27/F, Two Exchange Square, www.oriental-patron.com.hk Tel: (852) 2135 0214
8 Connaught Place, Central, Hong Kong [email protected] Fax: (852) 2135 0295