dainalli signalling annual report
DESCRIPTION
disclosure dalam pelaporan keuangan internasionalTRANSCRIPT
Advances in Accounting, incorporating Advances in International Accounting 29 (2013) 267–277
Contents lists available at ScienceDirect
Advances in Accounting, incorporating Advances inInternational Accounting
j ourna l homepage: www.e lsev ie r .com/ locate /ad iac
Signaling strategies in annual reports: Evidence from the disclosure ofperformance indicators
Francesco Dainelli ⁎, Laura Bini 1, Francesco Giunta 2
Department of Accounting and Economics, University of Florence, via delle Pandette 9, 50127 Florence, Italy
⁎ Corresponding author. Tel.: + 39 0554374733; fax: +E-mail addresses: [email protected] (F. Dainel
[email protected] (F. Giunta).1 Tel.: +39 0554374689; fax: +39 0554374910.2 Tel.: +39 0554374709; fax: +39 0554374910.
0882-6110/$ – see front matter © 2013 Elsevier Ltd. All rihttp://dx.doi.org/10.1016/j.adiac.2013.09.003
a b s t r a c t
a r t i c l e i n f oKeywords:
Signaling theoryVoluntary disclosurePerformance indicatorsBusiness reviewIn voluntary annual report communication, empirical results of signaling theory are contrasting, mainly owing toproblems in disclosuremeasurements.We focus on a specific piece of incremental information and study the sig-naling strategies in annual reports by analyzing the disclosure of performance indicators that provide incremen-tal information. In this paper, we scrutinize the business review of a sample of 120 listed Italian companies forfiscal year 2010. After controlling for size, risk, and industry, our analysis confirms that the number of indicatorspublished is positively related to firm profitability. Our results help clarify the signaling strategies in annual re-port communication. Operatively, our evidence can help regulators and standard setters to better disciplinethe communication of relevant and private information in annual reports, particularly performance indicators.
© 2013 Elsevier Ltd. All rights reserved.
1. Introduction
Market contractual relations reflect economic decisions that, whenapproached rationally, are based on the quality, reliability, and timeli-ness of information (Armstrong, Guay, & Weber, 2010; Grossman &Stiglitz, 1980; Laffont, 1989; Rasmusen, 1987). To reduce informationasymmetries and avoid adverse selection mechanisms, managers mustrelease information to present and potential investors. This assumptionis supported by the signaling theory. In particular, firms that considerthemselves undervalued by the market have incentives to signal theiractual value by releasing private information. To be reliable, a signalhas to convey relevant incremental information to market players (forall see Beyer, Cohen, Lys, & Walther, 2010). Thus, the signaling theoryposits a positive relationship between a firm's performance and thelevel of its private information communicated to the market.
Among different communication channels, the annual report is con-sidered themost reliable vehicle, even if not timely, for conveying infor-mation (Botosan & Plumlee, 2002; Eccles & Coleman, 1998; Francis &Schipper, 1999; Watts, 2006). To overcome the limitations of mandato-ry financial information and reduce the information asymmetriesamong investors, firms have begun to include an increasing level of dis-cretionary disclosure in annual reports over time (Deloitte, 2007;PricewaterHouseCoopers (PwC), 2008).
Several studies have investigated these voluntary disclosures toconfirm signaling strategies and empirical evidence shows conflicting
39 0554374910.li), [email protected] (L. Bini),
ghts reserved.
results. Certain studies highlight a positive relationship between a firm'sprofitability and its level of disclosure (Gamerschlag, Moller, &Verbeeten, 2011; Haniffa & Cooke, 2002; Lim, Matolcsy, & Chow,2007; Wang, Sewon, & Claiborne, 2008), while other literature findsno such relationship (Alsaeed, 2006; Cahan, Rahman, & Perera, 2005;Chau & Gray, 2002, 2010; Eng & Mak, 2003; Ho & Wong, 2001;Hossain & Hammami, 2009; Malone, Fries, & Jones, 1993; McNally,Eng, & Hasseldine, 1982; Meek, Roberts, & Gray, 1995; Patelli &Prencipe, 2007; Raffournier, 1995). There are two main causes forthese inconclusive results. First, because these studies aim to investigatehow corporate characteristics influence the amount of disclosure in-cluded in annual reports, they develop disclosure indexes that encom-pass different topics (see Botosan, 1997; Meek et al., 1995; Wallace &Naser, 1995). Assuming that different disclosure topics are managedusing different communication strategies, these indexes might haveobstructed the clear identification of signaling strategies. Moreover,the presence of disclosure items that are not considered to provide in-cremental value information (i.e., public information), probably con-tributes to obfuscate any signaling mechanism as well (Botosan, 1997;Chau & Gray, 2002, 2010; Lim et al., 2007; Meek et al., 1995).
In order to overcome the limitationsmentioned above and thus bet-ter understand signaling strategies, we focus on a specific piece of incre-mental value information–performance indicators–which represent thecrux of the relationship between insiders and investors (see, amongothers: Gibson, 1987; Matsumoto, Shivaswamy, & Hoban, 1995; Amir& Lev, 1996; Behn & Riley, 1999; Accounting Standard Board (ASB),2006; Coram, Mock, & Monroe, 2011).
Since the beginning of the 1990s, performance indicators togetherwith other narrative information have been identified as necessary inte-grative information that helps to improve the usefulness of annualreports for users (American Institute of Certified Public Accountants
268 F. Dainelli et al. / Advances in Accounting, incorporating Advances in International Accounting 29 (2013) 267–277
(AICPA), 1994; Association for Investment Management, Research(AIMR), 2000; Campbell & Slack, 2008; Eccles & Coleman, 1998;Hooks, Coy, &Howard, 2002). Thus, themost important standard settershave established several projects to develop disclosure frameworks forthis integrative information, which is usually referred to as manage-ment commentary reporting.3 All these frameworks highlight the op-portunity to disclosure performance indicators (Accounting StandardBoard (ASB), 2006; Canadian Institute of Chartered Accountants(CICA), 2002; Group of 100 (G100), 2003; International AccountingStandard Board (IASB), 2010). At the same time, most developed coun-tries, such us the US, Canada, Australia, the UK, and the EU have startedmaking it mandatory for companies to publish performance indicatorsin annual reports through specific regulation regarding managementcommentary reporting.
To better identify performance indicators that are able to convey sig-nals to the market, we analyze performance indicators that are relevantfor the decision process and private, in the management's hand.
Our aim is to verify the presence of signaling mechanisms in annualreport disclosure. Specifically, we expect that the higher a firm's profit-ability, the higher the number of indicators of incremental value infor-mation released to the market.
To this end, we have chosen to investigate signaling mechanismsin the Italian context owing to its regulatory environment. On onehand, Italy implemented Directive 2003/51/EC that made it manda-tory for annual reports to “include both financial, and where appro-priate, non-financial key performance indicators relevant to theparticular business”. Because much existing literature has documentedthat mandatory interventions improvemanagement commentary disclo-sure (Beattie, Dhanani, & Jones, 2008; Beattie & McInnes, 2006), Italianfirms should pay more attention to performance indicator disclosureafter the Directive. However, the Directive provides only a general pre-scription related to the disclosure of key performance indicators anddoes not determine disclosing modalities and contents. In such a context,performance indicator disclosure is completely discretional. Therefore,signaling strategies are not constrained and are better observable thanin highly regulated countries.
We scrutinized the Italian management commentary reports(i.e., Relazione sulla Gestione) of a sample of 120 listed Italian compa-nies for fiscal year 2010. To collect all the indicators with incrementalinformative power,we referred to both the Recommendation on Alterna-tive PerformanceMeasure issuedby the European Securities andMarketsAuthority (ESMA) in 2005 and the US Securities and ExchangeCommission's (SEC) rules for non-GAAP financial measures.
After controlling for size, risk, and industry, our resultswere found tosupport the signaling theory hypothesis. According to the literature,firm size, expressed by market capitalization, seems to play an impor-tant role as well.
Our results clarify the signaling strategies in annual report commu-nication:firmswith better results provide themarketwith higher incre-mental value information than do other firms. Therefore, as theorizedsince thebeginning of the 1970s,we conclude that themarket seems ca-pable of autonomously and gradually controlling the production anduse of information–see Verrecchia (1983) and subsequent literature–to reduce information asymmetries (incremental information theory).
From the operative perspective, our evidence can help regulatorsand standard setters to better discipline management commentaryreporting regarding performance indicator disclosure. Our results indi-cate that in those contexts characterized by signaling strategies, likethe Italian one, a system of specific rules that identifies the perspectivesof performance that firms must report on (i.e., market, growth, internalprocesses, etc.) and clearly defines how this information must bedisclosed could be more effective in increasing the level of useful
3 “Management commentary encompasses reporting that jurisdictionsmay describe asManagement's Discussion and Analysis (MD&A), Operating and Financial Review (OFR),business review or management's report” (IASB, 2010).
information in annual reports. In fact, detailed rules might reduce therisk of manipulation by less profitable firms and, on the other hand,stimulate profitable firms to voluntarily provide more indicators thanothers, thereby sending signals to the market.
2. Literature review and research hypothesis
The signaling theory was formulated at the beginning of the 1970sand is based on two main research contributions, Arrow (1972) andSpence (1973). To overcome the limitations of the classic theory,above all the perfect competition hypothesis, Spence (1973) analyzesthe workforce market with the aim of drawing some general conclu-sions regarding information economics. The author's reasoning is sim-ple: when in search for a job, potential employees may benefit fromsending signals to the market, thus keeping their talents in the publiceye in order to prevail over other jobseekers.
This theory has been successively applied in a number of other areas,including corporate communication. In this case, firms are supposed touse voluntary communication to overcome the adverse selectionmech-anism: high performance firms aremotivated to disclose information inorder to favorably distinguish themselves from other firms (Dye, 1985;Grossman, 1981; Milgrom, 1981; Pae, 2002; Verrecchia, 1983; Welker,1995).
Penman (1980) applies the basic signaling hypothesis to the disclo-sure of earnings forecasts and finds that firms with good news moreoften disclose earnings forecasts voluntarily. Similarly, Clarkson, Dontoh,Richardson, and Sefcik (1992) investigate a sample of Canadian IPOfirms and indicate that firms that disclose earnings forecasts tend to pos-sess better news than non-disclosing firms. Moreover, Miller (2002) fo-cuses on earnings announcements and documents a strong relationshipbetween earnings performance and the quantity, venue, and type of dis-closure by firms.
However, most of the research concerning the relationship betweenfirm profitability and disclosure centers on annual report communica-tion. Lang and Lundholm (1993) investigate the determinants of volun-tary disclosure choice and find that disclosure scores are higher forfirmsthat perform well. This positive relationship between disclosure andprofitability has been confirmed by Haniffa and Cooke (2002), Limet al. (2007),Wang et al. (2008), Gamerschlag et al. (2011) for voluntarydisclosure of listed Malaysian, Australian, Chinese, and German firms,respectively. On the contrary, numerous studies show no significant re-lationship between disclosure and firm profitability (Alsaeed, 2006;Cahan et al., 2005; Chau & Gray, 2002, 2010; Eng & Mak, 2003; Ho &Wong, 2001; Hossain & Hammami, 2009; Malone et al., 1993; McNallyet al., 1982; Meek et al., 1995; Patelli & Prencipe, 2007; Raffournier,1995).
All these studies are based onvoluntary disclosure indexes comprisingspecific disclosure items, including both accounting figures and narrativeinformation. However, these contrasting results are also highlighted in lit-erature that focuses only on narrative information. The meta-analysisconducted by Merkl-Davies and Brennan (2007) on narrative disclosurestudies explores whether, why, and how those who prepare corporatenarrative reports use discretionary disclosures. The authors report thatsignaling strategies are evident for some studies and in certain areasand are absent for others.
These inconclusive results are mainly related to measuring prob-lems. First, disclosure indexes usually encompass wide aspects of com-munications (i.e., historical and strategic information), which are drivenby different factors and confound the analysis of disclosure determi-nants (Ahmed & Courtis, 1999; Miller, 2002). Moreover, the same in-dexes usually comprise numerous and different items (Botosan, 1997;Meek et al., 1995; Wallace & Naser, 1995) that do not necessarily con-vey incremental value information. For example, the disclosure indexdeveloped by Meek et al. (1995) and successively adopted by other re-searchers (Chau & Gray, 2002; Chau & Gray, 2010; Lim et al., 2007)
269F. Dainelli et al. / Advances in Accounting, incorporating Advances in International Accounting 29 (2013) 267–277
comprises 85 different items that include, among others, general corpo-rate information and historical financial results.
In order to overcome these limitations and, thus, better isolate signal-ing strategies, we focus only on incremental value information thatshould be preferably used to convey the signal to the market.
To be attractive for market players, the signaled information has topossess two characteristics: a) be relevant for the decision process andb) be private, in the management's hand. This represents incrementalvalue information (Beyer et al., 2010).
A large amount of literature documents that financial and non-financial performance indicators represent relevant information in in-vestment decisions. A first line of research observes the behavior ofanalysts. The results clearly show that the main tool that analysts useto evaluate the performance of a company is fundamental analysis(Gibson, 1980, 1987; Gomes, Yasin, & Lisboa, 2004, 2007; Matsumotoet al., 1995;Weetman & Beattie, 1999). From another viewpoint, the lit-erature indicates that some financial indicators are highly correlatedwith stock market return, thereby confirming the strong informativepower of these measures (e.g. Beaver, Kettler, & Scholes, 1970; Hill &Stonde, 1980; Lewellen, 2004; Martikainen, 1989; Salmi, Virtanen, &Yli-Olli, 1997). Moreover, some studies demonstrate that non-financialindicators represent high content information sources, particularlywhen presented systematically with financial indicators (Amir &Lev, 1996; Behn & Riley, 1999; Coram et al., 2011; Liedtka, 2002;Riley, Preason, & Trompeter, 2003).
Because of its relevance in investment decisions, performance indi-cator disclosure is considered necessary for improving the usefulnessof annual reports for users (American Institute of Certified Public Ac-countants (AICPA), 1994; Association for Investment Management,Research (AIMR), 2000; Campbell & Slack, 2008; Eccles & Coleman,1998; Hooks et al., 2002). The Jenkins Committee clearly identifies per-formance indicator disclosure as one of the methods to satisfy users'need to gain a forward-looking perspective (American Institute of Cer-tified Public Accountants (AICPA), 1994). Analogously, the surveyconducted by Hooks et al. (2002) ranks segmental financial measures,efficiency measures, and market measures among the most important“information gaps” in annual report disclosure.
All the disclosure frameworks on management commentaryreporting, considered integrative and complementary information tomandatoryfinancial statements, highlight the relevance of performanceindicator disclosure (Accounting Standard Board (ASB), 2006; CanadianInstitute of Chartered Accountants (CICA), 2002; Group of 100 (G100),2003; International Accounting Standard Board (IASB), 2010). In partic-ular, the IASB, in the Practice Statement on Management Commentary,asserts “Explanations of the performance and development of the entityduring the period and its position at the end of that period. Those expla-nations provide users of the financial reports with insight into themaintrends and factors affecting the business” (International AccountingStandard Board (IASB), 2010, §34).
At the same time, the most developed countries mandatorily requirethe inclusion of performance indicators in annual reports through specificregulation onmanagement commentary reporting. In the US, the SEC in-cludes a prescription related to themost relevant performance indicatorsin the regulation regarding the Management's Discussion and Analysis ofFinancial Condition and Results of Operations (MD&A). Analogously, theReview of Operations and Activities: Listing Rule 4.10.17 issued by theAustralian Securities Exchange (ASX) in 1993 and reviewed in 2003 statesthat to explain the financial dynamics of a company, performance indica-tors must be published and examined. In Canada, the Ontario SecuritiesCommission (OSC)mandatorily requires the inclusion of performance in-dicators in the Canadian MD&A document. Lastly, in 2003, the EU Direc-tive 51 made it mandatory for European firms to “include both financial,and where appropriate, non-financial key performance indicators rele-vant to the particular business” in their annual report.
Apart from being relevant, indicators must be private and includedin the management's decision system to be considered incremental
information. All the international regulations of performance indicatordisclosure clearly affirm this assumption stating the “Through the eyesof management” principle. The US MD&A requires the publication ofthemost relevant indicators utilized by themanagement for controllingpurposes (Security Exchange Commission (SEC), 2003). The IASB re-quires an entity to publish “the critical performancemeasures and indi-cators thatmanagementuses to assess andmanage performance againstthe stated objectives” (International Accounting Standard Board (IASB),2010, §24). The EU assumes the same stance in regulating performanceindicator disclosure through Directive 2003/51/EC.
Considering that performance indicators are actually capable of pro-viding incremental information to stakeholders, we propose the follow-ing research hypothesis on the basis of the signaling theory framework:HP: The number of indicators of incremental value information pub-lished in a firm's annual report is positively related to the firm'sprofitability.
Few existing studies investigate the disclosure practices of perfor-mance indicators in annual reports. However, they are based only on fi-nancial measures and, above all, they do not consider the incrementalinformative power of these indicators. Watson, Shrives, and Marston(2002) analyze financial indicator publication strategies in the UK andfind no relation between profitability performance and ratio disclosure,with the exception of the year 1989. Moreover, Morrison and Harrison(2009) focus on listed Australian companies to understand how differ-ent disclosure theories can explain voluntary ratio disclosure in annualreports. They find support for the signaling theory only for investmentratios (dividends per share, dividend payout, total shareholder return,and net asset backing per share) with more profitable firms devotinggreater space to their disclosure. Lastly, Abdullah and Ku Ismail (2008)find that the number of ratios published in Malaysian annual reportsis influenced by size, industry, and liquidity, while profitability doesnot appear to have any effect.
3. Research design
3.1. Information environment of performance indicator disclosure in Italy
Italian regulators opted for amainly voluntary regime regarding per-formance indicator disclosure in annual reports. Unlike the US, inEurope, the regulation of performance indicator disclosure is quite a re-cent event. It was introduced in 2003 through Article 14 of the EUDirec-tive 2003/51/EC, the Modernization Directive, which obliges Europeanfirms to “include both financial and, where appropriate, non-financialkey performance indicators relevant to the particular business” intheir annual reports. In 2007, this Europeanprescriptionwas introducedin Italy by integrating Article 2428 of the Civil Code, which regulatesmanagement commentary reporting (Relazione sulla Gestione). How-ever, this requirement is extremely concise, neither specifying howmany performance indicators must be published, nor mandating anyparticular indicator to report on. Thus, the selection and number of indi-cators that are included in the Relazione sulla Gestione is left to the dis-cretion of the company's directors. In 2007, the National Council ofChartered Accountants (NCCA) issued a consulting document that pro-vides some operative suggestions to enable listed and non-listed firmsto comply with the new Article 2428 (National Council of CharteredAccountants (NCCA, Consiglio Nazionale Dei Dottori Commercialisti,CNDCEC), 2009). This document suggests the inclusion of certain fi-nancial indicators that are considered important for assessing firmperformance; however it does not provide a framework for perfor-mance indicator disclosure, specifically for non-financial disclosures.In the absence of any guidance, the Italian disclosure practices ofperformance indicators are essentially voluntary and thus open tomanagement discretion. In this context, signaling strategies are notconstrained and, thus, better observable than in highly regulatedcountries.
270 F. Dainelli et al. / Advances in Accounting, incorporating Advances in International Accounting 29 (2013) 267–277
3.2. Dataset
Our study focuses on a sample of 120 listed Italian companies fromthe manufacturing and service industries. Banks and insurance compa-nies were excluded because they have different reporting and legal re-quirements as well as different disclosure practices (Hossain, Tan, &Adams, 1994). The analysis of performance indicator disclosure wasconducted on the 2010 annual report of each sample firm.
The Italian financial market is relatively small, although it has a di-versified composition. Some Italian firms are multinationals, competein globalized markets, and raise capital in international financial mar-kets. On the other hand, a large proportion of listed firms show highownership concentration, with blockholders who are often families(Zattoni, 1999). In such firms, members are also typically involved inthe Board of Directors, thus confusing the distinction between ownersand managers (Hall & Soskice, 2001). Further, bank loans represent animportant source of capital (Deeg, 2005).
Based on the list available on Italian StockMarketWeb site, therewere267 listed Italian companies as of December 2010. To represent the het-erogeneity that characterizes this population, we divided companiesfollowing the threemain national stock indexes based onmarket capital-ization: the FTSE MIB, the FTSE Italia Mid Cap, and the FTSE Italia SmallCap. The FTSE MIB index includes 40 companies and represents the pri-mary benchmark index for the Italian equity market. Capturing approxi-mately 80% of domestic market capitalization, the index compriseshighly liquid, leading companies. Further, the FTSE Italia Mid Cap com-prises the top 60 companies ranked by full market capitalization outsidethe FTSE MIB index. Finally, the FTSE Small Cap index captures all othersmall companies outside the FTSE MIB and FTSE Italia Mid Cap indexes.
Excluding financial and insurance companies, the total number oflisted companies as of December 2010 was 206. Here, we consider asample of 120 listed companies comprising all the companies includedin the FTSE MIB, all the companies included in the FTSE Italia Mid Cap,and a subsample of companies casually extracted from the FTSE ItaliaSmall Cap. Table 1 reports the sample composition by market indexand sector of activity.
We downloaded the 2010 annual reports for the sample companiesfrom the respective company Web sites or, alternatively, from the Ital-ian Stock Market Web site. Since Italian law requires firms to includekey performance indicator disclosure within the Relazione sullaGestione, we focus our analysis on this document and collect the num-ber of performance indicators disclosed by each firm in the sample.
3.3. Procedure for collecting date on performance indicators
To be considered incremental value information, the first character-istic the indicator has to possess is to be a piece of private information.Following national regulation, Italian firms are required to disclose allthe measures used by the management. Thus, all the indicators pub-lished can be considered private information for investors who are in-terested in knowing about the measures utilized for internal purposes.However, not all the indicators published can be considered relevant(second characteristic) for the investor decision process. In fact, certain
Table 1Sample size by stock index and sector of activity.
SectorFTSEMIB
FTSEMID-CAP
FTSESMALL-CAP
TOTAL
Consumer Goods 7 7 10 24Consumer Services 4 8 11 23Energy, Chemicals and Mining 3 5 4 12Utilities 3 4 0 7ICT 2 0 8 10Industrial Goods and Services 8 19 17 44Total 27 43 50 120
measures can be autonomously calculated from financial statement fig-ures. For example, this holds true for the return on equity (ROE) index. IfROE is part of themanagement's internal control system, the disclosureof this indicator in a firm's annual report could be considered private in-formation. However, it is doubtful if this indicator conveys signals to fi-nancial markets because it does not effectively add new incrementalinformation.
To identify indicators of incremental value information, we beginwith the definition proposed by the ESMA in the Recommendation on Al-ternative Performance Measure. Performance measures are identified asthose quantitative measurements that “can either be derived from theaudited financial statements or stem from other sources or alternativemethodology to conventional accounting. The first category includes,for instance, ‘operating earnings’, ‘cash earnings’, ‘earnings before one-time charges’, ‘EBITDA—earnings before interest, taxes, depreciation,and amortization’ and similar terms denoting adjustments to line itemsof income statement, balance sheet, or cash flow statement. The secondcategory includes additional performance indicators reflecting businessactivity (e.g. production or activity levels), projection of future cashflows or forward-looking indicators” (European Securities and MarketsAuthority (ESMA), 2005: §1). However, to provide incremental informa-tion to the market these adjustments must be significant, that is, theymust not be autonomously calculable by users. Thus, following SEC'srule for non-GAAP financial measures included in Section 401(1b) ofthe Sarbanes–Oxley Act of 2002, we define relevant performance indica-tors as numerical measures that exclude (include) amounts, or aresubject to adjustments that have the effect of excluding (including)amounts, that are included (excluded) in the most directly comparablemeasure calculated and presented in accordance with GAAP in the state-ment of income, balance sheet, or statement of cash flows (or equivalentstatements) of the company.
According to this definition, we develop our coding procedures inthe following manner.
1. We collected both financial and non-financial historical performanceindicators:
a. Financial performance indicators are defined as voluntarilydisclosed quantitativemeasurements of financial performance, fi-nancial position, or cash-flows which imply significant adjust-ments to line items of income statement, balance sheet, or cashflow statements. These measurements can be either expressedin absolute value or in an index. This definition comprises everyformulation that indicates alternative measures including “ad-justed,” “normalized,” or “recurring,” that is, “adjusted EBIT,” “re-curring EBITDA,” or “normalized earnings.” For example, weconsider the non-GAAP EBITDA as relevant when it is defined inthe following manner: “EBITDA on an adjusted basis is calculatedby adding amortization and depreciation charges to adjusted op-erating profit, which is also modified to take into account the im-pact associated with certain derivatives instruments as discussedbelow” (ENI, Annual report 2010). Lastly, we collected all the ra-tios built on the abovementioned measures. For example, we col-lected “adjusted ROE,” based on adjusted net income, but we didnot collect ROE based on net income and equity figures reportedin financial statements.
b. Non-financial indicators are defined as voluntarily disclosedquantitative measurements of performances that are not basedon conventional accounting figures. The indicators collected canbe related to the different perspectives defined by the main mul-tidimensional performance models (Kaplan & Norton, 1992;Lynch & Cross, 1991; Wright & Keegan, 1997): market perspec-tive (i.e., market share, retention rate, satisfaction level, numberof new clients, loyal customers); internal processes perspective(i.e., production capacity, order backlog, volumes traded; per-centage of directly operating stores); growth perspective (i.e.,new orders, new products in the pipeline, number of new patents
271F. Dainelli et al. / Advances in Accounting, incorporating Advances in International Accounting 29 (2013) 267–277
registered, hours of training per employee). Additionally, we col-lected environmental and social performance indicators (i.e., em-ployee injury frequency rate; emission reduction rate; energysaving rate) because these measures are recognized to influencefirm value (Al-Tuwaijri, Christensen, & Hughes, 2004; Ruf,Muralidhar, Brown, Janney, & Paul, 2001).
2. We collected financial and non-financial performance indicators thatreport expected targets. For example, expected sales growth,projected earnings, target debt to equity ratio, expected productionvolume, and carbon emission reduction target.
3. We collectedmeasures related to both overall and segmental perfor-mance. When the same performance measure is repeated for differ-ent sectors of activity or geographical areas, it was collected once.
4. When the same measure was provided both in absolute value andratio form, it was collected once.
5. When the same figure was repeated in the same document, it wascollected once.
Two of three authors of this paper separately analyzed the annualreport's section that is devoted to management commentary reporting(Relazione sulla Gestione) for each annual report in the sample. Further,there are different stages in the coding procedure. First, two coders se-lected a pre-sample of 10 documents from the original sample andaccurately read and identified the disclosed performance indicators, fol-lowing the definition proposed above. Each author reported the perfor-mance indicators recognized for each firm on a list and the two listswere successively compared. Inconsistencies were resolved throughdiscussion, and coding instructions were documented in a codingman-ual. The same coders applied the coding rules to the remainder of thesample. The reliability levelwasfinally assessed by calculating an agree-ment ratio. The overall rate of agreementwas over 95%,which is consid-ered to be satisfactory and in line with prior research (Clatworthy &Jones, 2003; Milne & Adler, 1999).
3.4. Measurement and method
Weusedmultiple regression analysis to test the relationship betweenthe number of performance indicators disclosed and thefirmprofitability.
Several profitability measures have been used in disclosure litera-ture to measure a firm's profitability (Appendix A). Most of them arecapital return measures; the “net profit on equity” is the most wide-spread index (Cahan et al., 2005; Chau & Gray, 2010; Chavent, Ding,Fu, Stolowy, & Wang, 2006; Eng & Mak, 2003; Haniffa & Cooke, 2002;Ho & Wong, 2001; Inchausti, 1997; Lim et al., 2007; McNally et al.,1982; Owusu-Ansah, 1998; Patton & Zelenka, 1997; Raffournier, 1995;Singhvi & Desai, 1971), followed by the “net profit on total assets”(Cahan et al., 2005; Eng & Mak, 2003; McNally et al., 1982; Wanget al., 2008). Occasionally, researchers choose different income mea-sures to assess the return of capital: “operative income” (Inchausti,1997; Patelli & Prencipe, 2007), “profit before tax” (Wallace & Naser,1995; Wallace, Naser, & Mora, 1994), and profit before extraordinaryitems (Chen & Jaggi, 2000). Measures of the return of capital are oftentested alternatively with profit margin measures, above all the “netprofit on sales” (Chavent et al., 2006; Malone et al., 1993; Owusu-Ansah, 1998; Singhvi & Desai, 1971). On the basis this literature review,two different measures were selected and alternatively included in ourregression model: net profit on equity (NP/E) and operative profit ontotal assets (OP/TA). The figures for NP/E and OP/TA as at the end of fis-cal year 2010 have been extracted from the AIDA databank.
In keeping with existing literature, we included the following con-trol variables in the model:
1. firm size,2. market capitalization,3. degree of risk, and4. industry.
There is general agreement regarding the existence of a positive rela-tionship between the size of a company and the extent of its disclosure,which is supported by several reasons. Firm size affects voluntary finan-cial disclosure by influencing themagnitude of agency costs (Holthausen& Leftwich, 1983; Kelly, 1983; Leftwich et al., 1981). In addition, largerfirms are considered able to afford both direct and indirect disclosurecosts better than smaller firms (Meek et al., 1995). Lastly, financial ana-lysts and other stakeholders observe larger companies more closelythan others; thus, the pressure on the company to release informationis supposedly stronger (Schipper, 1991). From the signaling viewpoint,it is generally agreed that the larger the company, the greater theinformation asymmetry with current and prospective fund providers(Prencipe, 2004). Consequently, larger firms should resort more to sig-naling strategies than small firms. Research investigating financial indi-cators highlights a positive relationship between firm size and thenumber of indicators disclosed (Abdullah & Ku Ismail, 2008; Watsonet al., 2002). Analogously, we hypothesize that firm size is positively re-lated to the number of performance indicators disclosed. We considertwo variables to assess firm size: total sales (SALES) and marketcapitalization (MKTCAP). Even if they are related measures, marketcapitalization is considered to better represent the level of firm interna-tionalization and external visibility (Chen & Jaggi, 2000; Leventis &Weetman, 2004). SALES is measured using the total sales figure for fiscalyear 2010 (Chau & Gray, 2010; Li, Pike, & Haniffa, 2008; Meek et al.,1995). Owing to positive skewness in the rawmeasure, a log transforma-tion of this variable is used in the model. Further, MKTCAP is measuredusing two dummy variables: one representing the Italian Stock Index-es: FTSE MIB, FTSE Italia Mid Cap, and another representing theFTSE Italia Small Cap index. Company groupings based on thisstock index classification are presented in Table 1.
According to the agency theory, a positive relationship between therisk level and the extent of disclosure may be expected: owing to higherproprietary costs, higher risk firms are likely to disclose more informa-tion than others. However, the little empirical evidence in disclosure lit-erature shows conflicting results regarding this relationship. Garsombke(1979) and Firth (1984) do not find any correlation between the risklevel, measured by the beta index, and the amount of voluntary commu-nication in the annual report. Patton and Zelenka (1997) include risk intheir regression model that investigates the determinants of disclosurein annual reports in the Czech Republic. They divide the level of riskinto two components: 1) operational risk, measured by the weight of in-tangible assets and 2) financial risk, measured by leverage ratio. Their re-sults indicate that neither of the two risk proxies is significantly relatedto disclosure practices. However, these studies consider the generallevel of voluntary disclosure. Because performance indicator disclosureis considered highly relevant information, a positive relationship be-tween risk level, measured by the beta index, and the number of perfor-mance indicators disclosed is hypothesized. In this study, risk (RISK) ismeasured by the firm's beta index at the end of fiscal year 2010. Thedata were drawn from the Bloomberg database.
According to the signaling theory, industry is considered a signifi-cant factor in influencing disclosure practices since companies wish toshow that they are aligned with the best disclosure practices (Cooke,1992;Wallace et al., 1994;Watson et al., 2002). Investigating index dis-closure in UK annual reports, Watson et al. (2002) find that industry isan important predictor of ratio disclosure; in particular, their evidenceindicates that companies in the media and utilities industries are lesslikely to disclose information than those in other industries. Based onthese considerations, we posit that performance indicator disclosurevaries across industries. Industry groupings based on the classificationproposed by the Italian Stock Exchange are presented in Table 1.Dummy variables are employed in multiple regression analysis for thefollowing six industry groups (IND):
1. consumer goods,2. consumer services,

Table 3Descriptive statistics for independent variables.
Mean Median Max Min Std. dev.
NP/E 0.03 0.04 0.31 −0.36 0.08
OP/TA (000€) 0.04 0.05 0.33 −0.41 0.07
SALES 3,525,074 680,578 98,864,000 10,623 11,910,855
MKTCAP (000€) 2,459,178 471,470 68,970,960 90,700 7,742,383
RISK 0.76 0.75 1.20 0.40 0.19
Variable description:NP/E is the firm profit on equity for the fiscal year 2010.OP/TA is the firm operative profit on total assets for the fiscal year 2010.SALES is the firm total sales for the fiscal year 2010.MKTCAP is the firm market capitalization at the end of the fiscal year 2010.
272 F. Dainelli et al. / Advances in Accounting, incorporating Advances in International Accounting 29 (2013) 267–277
3. energy, chemicals and mining,4. utilities,5. ICT, and6. industrial goods and services.
The following two equations were consequently formulated to testthe relationship between the number of performance indicators andprofitability:
PIs ¼ α0 þ β1PROF OP=TAð Þ þ β2SALESþ β3MKTCAP T:MID½ �þβ4MKTCAP T:SMALL½ � þ β5RISKþ β6IND T:Consumer Goods½ �þβ7IND T:Consumer Services½ � þ β8IND T:ICT½ �þβ9IND T:Industrial Goods and Services½ �þβ10IND½T:Energy;Chemical and Miningþβ11IND T:Utilities½ � þ ε
ð1Þ
PIs ¼ α0 þ β1PROF NP=Eð Þ þ β2SALESþ β3MKTCAP T:MID½ �þβ4MKTCAP T:SMALL½ �þ β5RISKþ β6IND T:Consumer Goods½ �þβ7IND T:Consumer Services½ � þ β8IND T:ICT½ �þβ9IND T:Industrial Goods and Services½ �þβ10IND½T:Energy;Chemical and Mining�þβ11IND T:Utilities½ � þ ε;
ð2Þ
where:
PIs number of performance indicators disclosed in the annualreport
PROF(OP/TA) operative profit on total assetsPROF(NP/E) net profit on equitySALES natural log of total salesMKTCAP is measured using three dummies representing Italian Stock
Indexes: one dummy variable [T.MIB] for firms included inthe FTSE MIB index (the benchmark), one dummy variable[T.MID] for firms included in the FTSE Italia Mid Cap index,and one dummy variable [T.SMALL] for firms included in theFTSE Italia Small Cap index.
RISK firm's beta indexat the end of fiscal year 2010 from theBloomberg database.
IND is measured using six dummy variables for industry groups:[T.Consumer Goods], [T.Consumer Services], [T.ICT], [T.Indus-trial Goods and Services], [T.Energy, Chemical and Mining],and [T.Utilities].
4. Results
4.1. Descriptive statistics and univariate analysis
The descriptive statistics for the number of performance indicators(PIs) are reported in Table 2. On average, firms disclose few indicators,6.51, including both financial and non-financial ones. However, disclo-sure practices vary in the sample,with aminimumvalue of 1 and amax-imum value of 19. As expected, market capitalization influences
Table 2Descriptive statistics for performance indicators (PIs).
Mean Median Min Max Std. dev.
PIs TOTAL sample 6.51 6 1 19 3.67PIs FTSE/MIB 9.30 8 3 19 4.75PIs FTSE/MID-CAP 6.44 6 3 16 2.95PIs FTSE/SMALL-CAP 5.06 4 1 13 2.63
disclosure practices, with FTSE MIB firms disclosing a higher numberof indicators than other firms.
Table 3 presents the descriptive statistics for the quantitative inde-pendent variables, both primary and control variables.
On average, companies in the sample report 3525 million euro oftotal sales and 2459 million euro of market capitalization. The sample'sheterogeneity was confirmed by high variability reported for marketcapitalization and total sales. The average net profit on equity (NP/E)is 2.92% with 28 (23.3% of the total sample) companies reporting a neg-ative net profit. The average risk level is considerably under the marketthreshold, with a maximum of 1.20 and a low standard deviation level.
4.2. Multivariate analysis
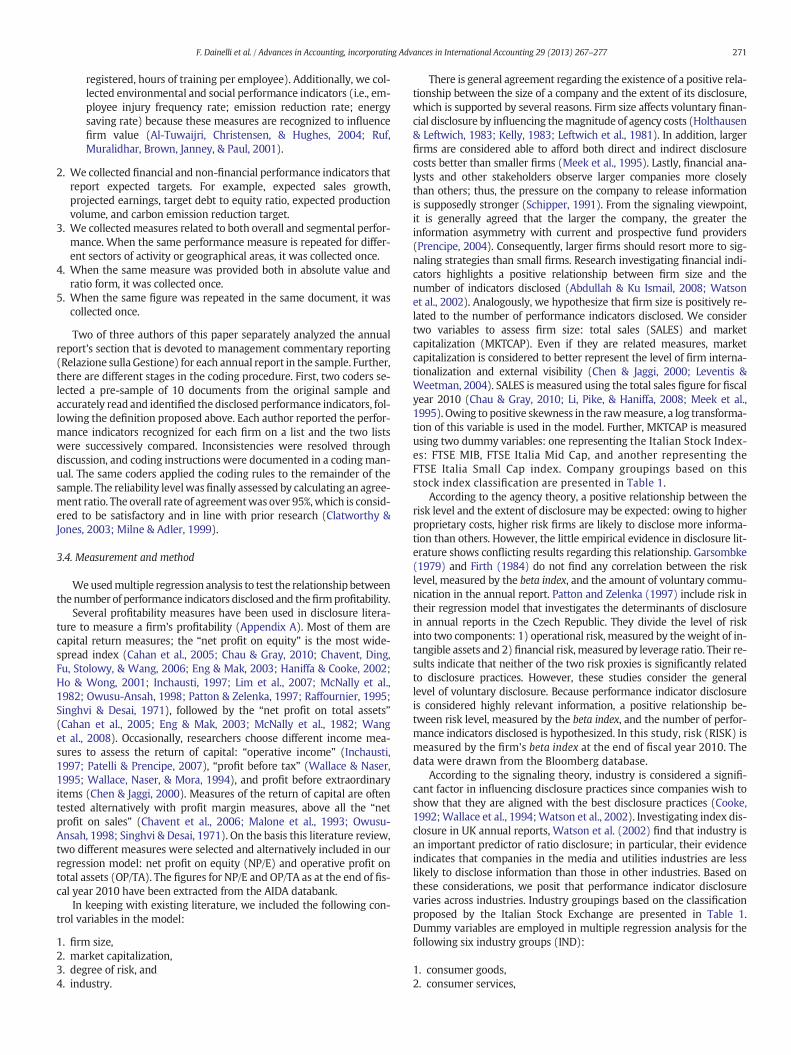
The correlationmatrix is reported in Table 4. As expected, significantcorrelations exist between the two measures of profitability (NP/E andOP/TA) and the number of performance indicators (PIs). A significantcorrelation is also revealed between the number of performance indica-tors and control variables, excluding risk level (RISK).
Profitability measures are clearly highly correlated, but this does notcause any collinearity problems since they are alternatively included inthe regressionmodel. On the contrary, the correlations among indepen-dent variables, including control variables, are relatively low so they areunlikely to pose a serious problem in the interpretation of the results(Hossain, Perera, & Rahman, 1995).We showMKTCAP in the correlationmatrix, even if this variable is included in the regression model usingdummies, to check the correlation between the two measures of firmsize, SALES, and MKTCAP. As expected, a significant correlation isfound between the two variables, but is not excessively high.
To further assess the potential formulticollinearity, regressions of allexplanatory variables on PIs (not reported) were conducted and vari-ance inflation factors (VIF) have been calculated. The VIF figures for allthe independent variables are below 10, thereby indicating that thereis no serious multicollinearity problem.4
The results of the regressions for Eqs. (1) and (2) are presented inTables 5 and 6.5
The total variability captured by our variables varies from 25.94% forthe model that employs NP/E to 28.42% for the model including OP/TA.
These results reveal a positive correlation between profitability andthe number of performance indicators for each model: firms withhigher profitability are likely to pay more attention when disclosingtheir results through performance measures. Analogously, studies on
4 VIFmeasures thedegree towhich each explanatory variable is explained by the othersand “very large VIF values indicate high collinearity: a common cut-off threshold is VIFvalues above 10” (Hair, Anderson, Tatham, & Black, 1995:127).
5 First thegeneral linearmodel (GLM)was employed tofit the data, given the character-istics of the dependent variable. The GLM analysis has led to substantially similar results.Hence, we can conclude that the results are not sensitive to the estimation technique.
Table 4Pearson's correlation matrix.
PIs NP/E OP/TA RISK SALES MKTCAP
PIs 1NP/E 0.28⁎⁎ 1OP/TA 0.34⁎⁎⁎ 0.77⁎⁎⁎ 1RISK 0.18 −0.12 −0.05 1SALES 0.43⁎⁎⁎ 0.18 0.32⁎⁎⁎ 0.44⁎⁎⁎ 1MKTCAP 0.39⁎⁎⁎ 0.17 0.15 0.17 0.56⁎⁎⁎ 1
***, ** and * indicate statistical significance at 1%, 5% and 10% levels (two-tailed)respectively.Variable description:PIs is the number of performance indicators disclosed by each sample firm in 2010 annualreport.PROF(NP/E) is the firm profit on equity for the fiscal year 2010.PROF(OP/TA) is the firm operative profit on total assets for the fiscal year 2010.SALES is the firm total sales for the fiscal year 2010.MKTCAP is the firm market capitalization at the end of the fiscal year 2010.
Table 6Regression results for Model 2 with profitability measured as PROF(NP/E).
Model 2: PIs = α0 + β1PROF(NP/E) + β2SALES + β3MKTCAP[T.MID] +β4MKTCAP[T.SMALL] + β5RISK + β6IND[T.Consumer Goods] +β7IND[T.Consumer Services] + β8IND[T.ICT] + β9IND[T.Industrial Goods andServices] + β10IND[T.Energy, Chemical and Mining] + β11 IND[T.Utilities] + ε
Variables Pred. sign Coeff. p-value
(Intercept) 20.988 0.6018PROF(NP/E) + 97.607 0.0168⁎SALES + 0.6916 0.2696⁎⁎RISK + 0.7888 0.6429⁎⁎⁎IND[T.Consumer Goods] 10.282 0.2678IND[T.Consumer Services] 16.557 0.4683IND[T.ICT] 0.7056 0.5886IND[T.Industrial Goods and Services] 13.789 0.0873IND[T.Energy, Chem. and Mining] 21.148 0.0721IND[T.Utilities] 34.761 0.0127⁎MKTCAP[T.MID] −23.260 0.0111⁎MKTCAP[T.SMALL] −19.842 0.1049
Adjusted R-squared: 0.2594
F-statistic: 4.598 p-value: 1.17E − 02
***, ** and * indicate statistical significance at 1%, 5% and 10% levels (two-tailed)respectively.Variable description:PIs is the number of performance indicators disclosed by each sample firm in its 2010annual report.PROF(NP/E) is the firm profit on equity for the fiscal year 2010.SALES is the natural log of firm total sales for the fiscal year 2010.MKTCAP[T.MID] is a dummy variable for firms included in the FTSE Italia Mid Cap index.MKTCAP[T.SMALL] is a dummy variable for firms included in the FTSE Italia Small Capindex.
273F. Dainelli et al. / Advances in Accounting, incorporating Advances in International Accounting 29 (2013) 267–277
impression management in narrative disclosure report how firms withpositive results provide more explanations regarding their results thanother firms (Aerts & Cheng, 2012; Brennan, Guillamon-Saorin, & Pierce,2009; Clatworthy & Jones, 2003).
With regard the control variables, size–measured as total sales(SALES)–does not show any significant results in both the models,which is contrary to our expectation. In contrast, market capitalizationis found to significantly influence the number of performance indicatorsdisclosed. Most capitalized firms, included in FTSE MIB, show a signifi-cantly higher number of performance indicators than other firms. This
Table 5Regression results for Model 1 with profitability measured as PROF(OP/TA).
Model 1: PIs = α0 + β1PROF(OP/TA) + β2SALES + β3MKTCAP[T.MID] +β4MKTCAP[T.SMALL] + β5RISK + β6IND[T.Consumer Goods] +β7IND[T.Consumer Services] + β8IND[T.ICT] + β9IND[T.Industrial Goods andServices] + β10IND[T.Energy, Chemical and Mining] + β11 IND[T.Utilities] + ε
Variables Pred. sign Coeff. p-value
(Intercept) 17.404⁎⁎⁎ 0.6794PROF(OP/TA) + 111.912 0.0193⁎SALES + 0.7889 0.2186RISK + 0.4737 0.7858IND[T.Consumer Goods] 14.509 0.1332IND[T.Consumer Services] 15.018 0.5241IND[T.ICT] 12.030 0.3714IND[T.Industrial Goods and Services] 15.176 0.0671IND[T.Energy, Chem. and Mining] 33.442 0.0049⁎⁎IND[T.Utilities] 34.402 0.0166⁎MKTCAP[T.MID] −27.886 0.0029⁎⁎MKTCAP[T.SMALL] −25.148 0.0440⁎
Adjusted R-squared: 0.2842
F-statistic: 5.115 p-value: 2.37E − 03
***, ** and * indicate statistical significance at 1%, 5% and 10% levels (two-tailed)respectively.Variable description:PIs is the number of performance indicators disclosed by each sample firm in its 2010annual report.PROF(OP/TA) is the firm operating profit on total assets for the fiscal year 2010.SALES is the natural log of firm total sales for the fiscal year 2010.MKTCAP[T.MID] is a dummy variable for firms included in the FTSE Italia Mid Cap index.MKTCAP[T.SMALL] is a dummy variable for firms included in the FTSE Italia Small Capindex.RISK is the firm's beta index at the end of fiscal year 2010 from the Bloomberg database.IND[i] is a dummy variable representing industry classification, where i assumes sixdifferent industry groups based on the classification proposed by the Italian StockExchange: [T.Consumer Goods], [T.Consumer Services], [T.ICT], [T.Industrial Goods andServices], [T.Energy, Chemical and Mining], and [T.Utilities].
RISK is the firm's beta index at the end of fiscal year 2010 from the Bloomberg database.IND[i] is a dummy variable representing industry classification, where i assumes sixdifferent industry groups based on the classification proposed by the Italian StockExchange: [T.Consumer Goods], [T.Consumer Services], [T.ICT], [T.Industrial Goods andServices], [T.Energy, Chemical and Mining], and [T.Utilities].
result corroborates the influence of the level of internationalizationand external visibility on firm disclosure strategies (Cahan et al., 2005).
In line with the findings of Watson et al. (2002), we found that in-dustry is an important predictor of ratio disclosure. However, contraryto UK reality, Italian companies operating in utilities, energy, and chem-ical and mining industries disclose more performance indicators thanother industries. Lastly, we found a positive sign for the RISK coefficient,thereby confirming that higher risk firms are more inclined to publishperformance indicators. Nevertheless, this variable is not a significantdeterminant for performance indicator disclosure.
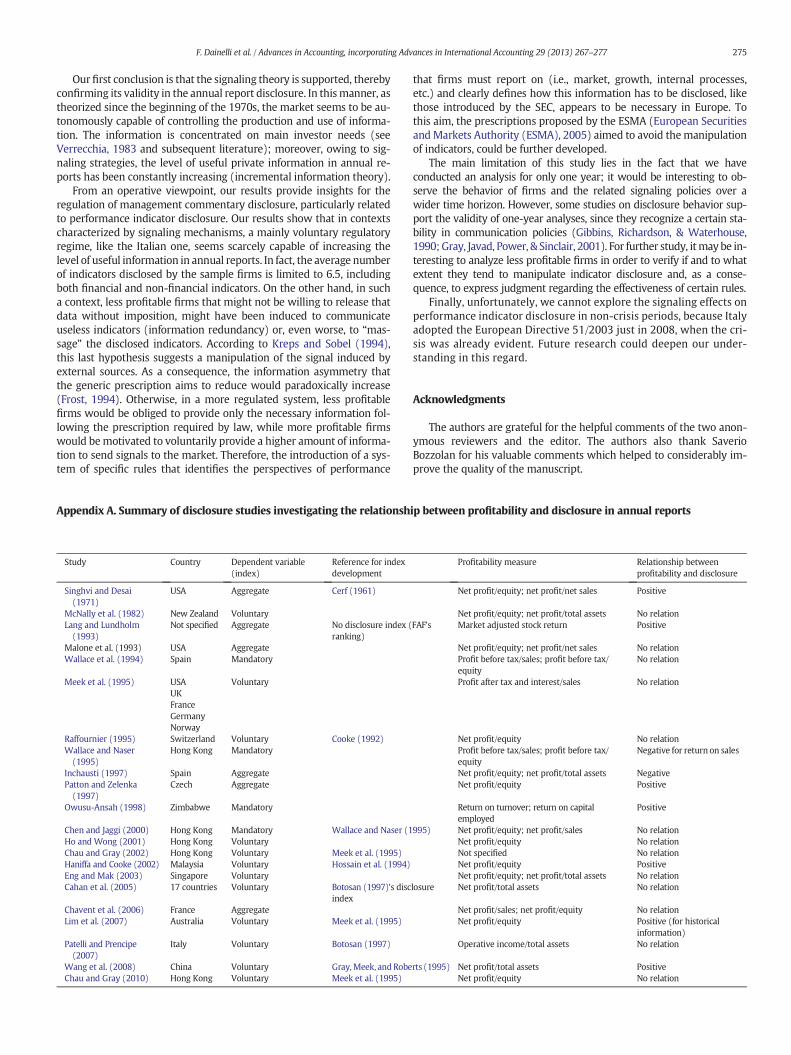
4.3. Sensitivity analysis
To test the sensitivity of the results, we repeated the analy-sis with two other different performance measures used in theliterature: Net Profit on Total Assets (NP/TA) and Net Profit onSales (NP/S). The results (not reported) are aligned with thefindings discussed above.
Moreover, some studies document the existence of a close associationbetween profitability measures and cash-flow measures (Gombola &Ketz, 1983). For this reason, we also tested Cash Flow on Sales (CF/S)as an independent variable using the following equation:
PIs ¼ α0 þ β1PROF CF=Sð Þ þ β2SALESþ β3MKTCAP T:MID½ �þβ4MKTCAP T:SMALL½ � þ β5RISKþ β6IND T:ConsumerGoods½ �þβ7IND T:ConsumerServices½ � þ β8IND T:ICT½ �þβ9IND T:IndustrialGoodsandServices½ �þβ10IND½T:Energy;Chemicaland Mining�þβ11IND T:Utilities½ � þ ε:
ð3Þ
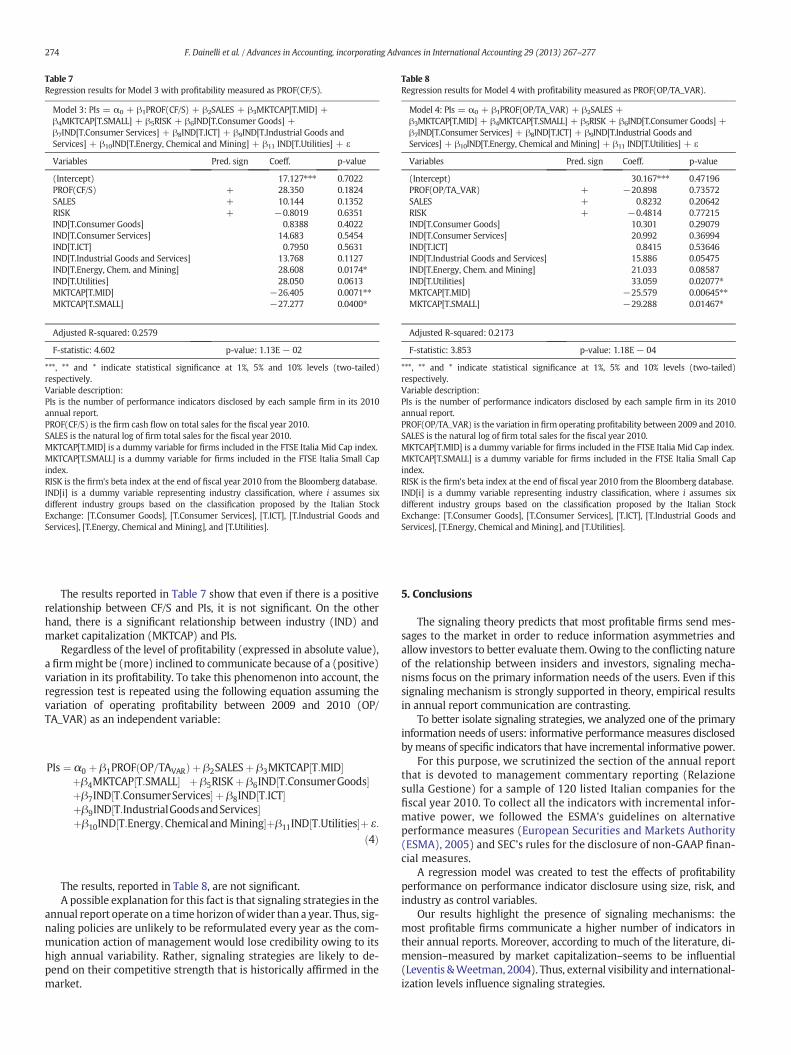
Table 8Regression results for Model 4 with profitability measured as PROF(OP/TA_VAR).
Model 4: PIs = α0 + β1PROF(OP/TA_VAR) + β2SALES +β3MKTCAP[T.MID] + β4MKTCAP[T.SMALL] + β5RISK + β6IND[T.Consumer Goods] +β7IND[T.Consumer Services] + β8IND[T.ICT] + β9IND[T.Industrial Goods andServices] + β10IND[T.Energy, Chemical and Mining] + β11 IND[T.Utilities] + ε
Variables Pred. sign Coeff. p-value
(Intercept) 30.167⁎⁎⁎ 0.47196PROF(OP/TA_VAR) + −20.898 0.73572SALES + 0.8232 0.20642RISK + −0.4814 0.77215IND[T.Consumer Goods] 10.301 0.29079IND[T.Consumer Services] 20.992 0.36994IND[T.ICT] 0.8415 0.53646IND[T.Industrial Goods and Services] 15.886 0.05475IND[T.Energy, Chem. and Mining] 21.033 0.08587IND[T.Utilities] 33.059 0.02077⁎MKTCAP[T.MID] −25.579 0.00645⁎⁎MKTCAP[T.SMALL] −29.288 0.01467⁎
Adjusted R-squared: 0.2173
F-statistic: 3.853 p-value: 1.18E− 04
***, ** and * indicate statistical significance at 1%, 5% and 10% levels (two-tailed)respectively.Variable description:PIs is the number of performance indicators disclosed by each sample firm in its 2010annual report.PROF(OP/TA_VAR) is the variation in firm operating profitability between 2009 and 2010.SALES is the natural log of firm total sales for the fiscal year 2010.MKTCAP[T.MID] is a dummy variable for firms included in the FTSE Italia Mid Cap index.MKTCAP[T.SMALL] is a dummy variable for firms included in the FTSE Italia Small Capindex.RISK is the firm's beta index at the end of fiscal year 2010 from the Bloomberg database.IND[i] is a dummy variable representing industry classification, where i assumes sixdifferent industry groups based on the classification proposed by the Italian StockExchange: [T.Consumer Goods], [T.Consumer Services], [T.ICT], [T.Industrial Goods andServices], [T.Energy, Chemical and Mining], and [T.Utilities].
Table 7Regression results for Model 3 with profitability measured as PROF(CF/S).
Model 3: PIs = α0 + β1PROF(CF/S) + β2SALES + β3MKTCAP[T.MID] +β4MKTCAP[T.SMALL] + β5RISK + β6IND[T.Consumer Goods] +β7IND[T.Consumer Services] + β8IND[T.ICT] + β9IND[T.Industrial Goods andServices] + β10IND[T.Energy, Chemical and Mining] + β11 IND[T.Utilities] + ε
Variables Pred. sign Coeff. p-value
(Intercept) 17.127⁎⁎⁎ 0.7022PROF(CF/S) + 28.350 0.1824SALES + 10.144 0.1352RISK + −0.8019 0.6351IND[T.Consumer Goods] 0.8388 0.4022IND[T.Consumer Services] 14.683 0.5454IND[T.ICT] 0.7950 0.5631IND[T.Industrial Goods and Services] 13.768 0.1127IND[T.Energy, Chem. and Mining] 28.608 0.0174⁎IND[T.Utilities] 28.050 0.0613MKTCAP[T.MID] −26.405 0.0071⁎⁎MKTCAP[T.SMALL] −27.277 0.0400⁎
Adjusted R-squared: 0.2579
F-statistic: 4.602 p-value: 1.13E − 02
***, ** and * indicate statistical significance at 1%, 5% and 10% levels (two-tailed)respectively.Variable description:PIs is the number of performance indicators disclosed by each sample firm in its 2010annual report.PROF(CF/S) is the firm cash flow on total sales for the fiscal year 2010.SALES is the natural log of firm total sales for the fiscal year 2010.MKTCAP[T.MID] is a dummy variable for firms included in the FTSE Italia Mid Cap index.MKTCAP[T.SMALL] is a dummy variable for firms included in the FTSE Italia Small Capindex.RISK is the firm's beta index at the end of fiscal year 2010 from the Bloomberg database.IND[i] is a dummy variable representing industry classification, where i assumes sixdifferent industry groups based on the classification proposed by the Italian StockExchange: [T.Consumer Goods], [T.Consumer Services], [T.ICT], [T.Industrial Goods andServices], [T.Energy, Chemical and Mining], and [T.Utilities].
274 F. Dainelli et al. / Advances in Accounting, incorporating Advances in International Accounting 29 (2013) 267–277
The results reported in Table 7 show that even if there is a positiverelationship between CF/S and PIs, it is not significant. On the otherhand, there is a significant relationship between industry (IND) andmarket capitalization (MKTCAP) and PIs.
Regardless of the level of profitability (expressed in absolute value),a firmmight be (more) inclined to communicate because of a (positive)variation in its profitability. To take this phenomenon into account, theregression test is repeated using the following equation assuming thevariation of operating profitability between 2009 and 2010 (OP/TA_VAR) as an independent variable:
PIs ¼ α0 þ β1PROF OP=TAVARð Þ þ β2SALESþ β3MKTCAP T:MID½ �þβ4MKTCAP T:SMALL½ � þ β5RISKþ β6IND T:ConsumerGoods½ �þβ7IND T:ConsumerServices½ � þ β8IND T:ICT½ �þβ9IND T:IndustrialGoodsandServices½ �þβ10IND½T:Energy;ChemicalandMining�þβ11IND T:Utilities½ �þ ε:
ð4Þ
The results, reported in Table 8, are not significant.A possible explanation for this fact is that signaling strategies in the
annual report operate on a time horizon ofwider than a year. Thus, sig-naling policies are unlikely to be reformulated every year as the com-munication action of management would lose credibility owing to itshigh annual variability. Rather, signaling strategies are likely to de-pend on their competitive strength that is historically affirmed in themarket.
5. Conclusions
The signaling theory predicts that most profitable firms send mes-sages to the market in order to reduce information asymmetries andallow investors to better evaluate them. Owing to the conflicting natureof the relationship between insiders and investors, signaling mecha-nisms focus on the primary information needs of the users. Even if thissignaling mechanism is strongly supported in theory, empirical resultsin annual report communication are contrasting.
To better isolate signaling strategies, we analyzed one of the primaryinformation needs of users: informative performance measures disclosedbymeans of specific indicators that have incremental informative power.
For this purpose, we scrutinized the section of the annual reportthat is devoted to management commentary reporting (Relazionesulla Gestione) for a sample of 120 listed Italian companies for thefiscal year 2010. To collect all the indicators with incremental infor-mative power, we followed the ESMA's guidelines on alternativeperformance measures (European Securities and Markets Authority(ESMA), 2005) and SEC's rules for the disclosure of non-GAAP finan-cial measures.
A regression model was created to test the effects of profitabilityperformance on performance indicator disclosure using size, risk, andindustry as control variables.
Our results highlight the presence of signaling mechanisms: themost profitable firms communicate a higher number of indicators intheir annual reports. Moreover, according to much of the literature, di-mension–measured by market capitalization–seems to be influential(Leventis &Weetman, 2004). Thus, external visibility and international-ization levels influence signaling strategies.
275F. Dainelli et al. / Advances in Accounting, incorporating Advances in International Accounting 29 (2013) 267–277
Ourfirst conclusion is that the signaling theory is supported, therebyconfirming its validity in the annual report disclosure. In thismanner, astheorized since the beginning of the 1970s, the market seems to be au-tonomously capable of controlling the production and use of informa-tion. The information is concentrated on main investor needs (seeVerrecchia, 1983 and subsequent literature); moreover, owing to sig-naling strategies, the level of useful private information in annual re-ports has been constantly increasing (incremental information theory).
From an operative viewpoint, our results provide insights for theregulation of management commentary disclosure, particularly relatedto performance indicator disclosure. Our results show that in contextscharacterized by signaling mechanisms, a mainly voluntary regulatoryregime, like the Italian one, seems scarcely capable of increasing thelevel of useful information in annual reports. In fact, the average numberof indicators disclosed by the sample firms is limited to 6.5, includingboth financial and non-financial indicators. On the other hand, in sucha context, less profitable firms that might not be willing to release thatdata without imposition, might have been induced to communicateuseless indicators (information redundancy) or, even worse, to “mas-sage” the disclosed indicators. According to Kreps and Sobel (1994),this last hypothesis suggests a manipulation of the signal induced byexternal sources. As a consequence, the information asymmetry thatthe generic prescription aims to reduce would paradoxically increase(Frost, 1994). Otherwise, in a more regulated system, less profitablefirms would be obliged to provide only the necessary information fol-lowing the prescription required by law, while more profitable firmswould bemotivated to voluntarily provide a higher amount of informa-tion to send signals to the market. Therefore, the introduction of a sys-tem of specific rules that identifies the perspectives of performance
Study Country Dependent variable(index)
Reference for indexdevelopment
Singhvi and Desai(1971)
USA Aggregate Cerf (1961)
McNally et al. (1982) New Zealand VoluntaryLang and Lundholm(1993)
Not specified Aggregate No disclosure index (ranking)
Malone et al. (1993) USA AggregateWallace et al. (1994) Spain Mandatory
Meek et al. (1995) USAUKFranceGermanyNorway
Voluntary
Raffournier (1995) Switzerland Voluntary Cooke (1992)Wallace and Naser(1995)
Hong Kong Mandatory
Inchausti (1997) Spain AggregatePatton and Zelenka(1997)
Czech Aggregate
Owusu-Ansah (1998) Zimbabwe Mandatory
Chen and Jaggi (2000) Hong Kong Mandatory Wallace and Naser (1Ho and Wong (2001) Hong Kong VoluntaryChau and Gray (2002) Hong Kong Voluntary Meek et al. (1995)Haniffa and Cooke (2002) Malaysia Voluntary Hossain et al. (1994)Eng and Mak (2003) Singapore VoluntaryCahan et al. (2005) 17 countries Voluntary Botosan (1997)'s disc
indexChavent et al. (2006) France AggregateLim et al. (2007) Australia Voluntary Meek et al. (1995)
Patelli and Prencipe(2007)
Italy Voluntary Botosan (1997)
Wang et al. (2008) China Voluntary Gray,Meek, andRobeChau and Gray (2010) Hong Kong Voluntary Meek et al. (1995)
Appendix A. Summary of disclosure studies investigating the relationsh
that firms must report on (i.e., market, growth, internal processes,etc.) and clearly defines how this information has to be disclosed, likethose introduced by the SEC, appears to be necessary in Europe. Tothis aim, the prescriptions proposed by the ESMA (European SecuritiesandMarkets Authority (ESMA), 2005) aimed to avoid themanipulationof indicators, could be further developed.
The main limitation of this study lies in the fact that we haveconducted an analysis for only one year; it would be interesting to ob-serve the behavior of firms and the related signaling policies over awider time horizon. However, some studies on disclosure behavior sup-port the validity of one-year analyses, since they recognize a certain sta-bility in communication policies (Gibbins, Richardson, & Waterhouse,1990; Gray, Javad, Power, & Sinclair, 2001). For further study, itmay be in-teresting to analyze less profitable firms in order to verify if and to whatextent they tend to manipulate indicator disclosure and, as a conse-quence, to express judgment regarding the effectiveness of certain rules.
Finally, unfortunately, we cannot explore the signaling effects onperformance indicator disclosure in non-crisis periods, because Italyadopted the European Directive 51/2003 just in 2008, when the cri-sis was already evident. Future research could deepen our under-standing in this regard.
Acknowledgments
The authors are grateful for the helpful comments of the two anon-ymous reviewers and the editor. The authors also thank SaverioBozzolan for his valuable comments which helped to considerably im-prove the quality of the manuscript.
Profitability measure Relationship betweenprofitability and disclosure
Net profit/equity; net profit/net sales Positive
Net profit/equity; net profit/total assets No relationFAF's Market adjusted stock return Positive
Net profit/equity; net profit/net sales No relationProfit before tax/sales; profit before tax/equity
No relation
Profit after tax and interest/sales No relation
Net profit/equity No relationProfit before tax/sales; profit before tax/equity
Negative for return on sales
Net profit/equity; net profit/total assets NegativeNet profit/equity Positive
Return on turnover; return on capitalemployed
Positive
995) Net profit/equity; net profit/sales No relationNet profit/equity No relationNot specified No relationNet profit/equity PositiveNet profit/equity; net profit/total assets No relation
losure Net profit/total assets No relation
Net profit/sales; net profit/equity No relationNet profit/equity Positive (for historical
information)Operative income/total assets No relation
rts (1995) Net profit/total assets PositiveNet profit/equity No relation
ip between profitability and disclosure in annual reports

276 F. Dainelli et al. / Advances in Accounting, incorporating Advances in International Accounting 29 (2013) 267–277
References
Abdullah, A.B., & Ku Ismail, K. N. I. (2008). Disclosure of voluntary accounting ratios byMalaysian listed companies. Journal of Financial Reporting and Accounting, 6(1), 1–20.
Accounting Standard Board (ASB) (2006). Reporting statement: Operating and financial re-view, accounting standard board London.
Aerts,W., & Cheng, P. (2012). Self-serving causal disclosures and short term IPO valuation—Evidence from China. Accounting and Business Research, 42(1), 49–75.
Ahmed, K., & Courtis, J. K. (1999). Associations between corporate characteristics and disclosurelevels in annual reports: A meta-analysis. The British Accounting Review, 31(1), 35–61.
Alsaeed, K. (2006). The association between firm-specific characteristics and disclosure:The case of Saudi Arabia. Managerial Auditing Journal, 21(5), 476–496.
Al-Tuwaijri, S., Christensen, T. H., & Hughes, K., II (2004). The relations among environ-mental disclosure, environmental performance, and economic performance: A simul-taneous equations approach. Accounting, Organizations and Society, 29(5–6), 447–471.
American Institute of Certified Public Accountants (AICPA) (1994). Improving businessreporting—A customer focus: Meeting the information needs of investors and creditors.New York: American Institute of Certified Public Accountants.
Amir, E., & Lev, B. (1996). Value-relevance of non-financial information: The wirelesscommunications industry. Journal of Accounting and Economics, 22(1–3), 3–30.
Armstrong, C., Guay,W., &Weber, J. (2010). Role of information and financial reporting in cor-porate governance and debt contracting. Journal of Accounting and Economics, 50, 179–234.
Arrow, K. J. (1972). Some models of racial discrimination in the labor market. In A. H.Pascal (Ed.), Racial discrimination in economic life. Lexington (MA): Heath.
Association for Investment Management, Research (AIMR) (2000). AIMR corporate disclo-sure survey. St. Louis: Fleishman-Hillard Inc.
Beattie, V., Dhanani, A., & Jones, M. J. (2008). Investigating presentational change in UKannual reports: A longitudinal perspective. Journal of Business Communication, 45,181–222.
Beattie, V., & McInnes, B. (2006). Narrative reporting in the UK and in the US—Which systemworks best? London: Institute of Chartered Accountants of England and Wales(ICAEW).
Beaver, W. H., Kettler, P., & Scholes, M. (1970). The association between market deter-mined and accounting determined risk measures. The Accounting Review, 45(4),654–682.
Behn, B. K., & Riley, R. A. (1999). Using nonfinancial information to predict financialperformance: The case of the U.S. airline industry. Journal of Accounting, Auditing &Finance, 14(1), 29–56.
Beyer, A., Cohen, D., Lys, T., & Walther, B. (2010). The financial reporting environment:Review of the recent literature. Journal of Accounting and Economics, 50(2–3),296–343.
Botosan, C. A. (1997). Disclosure level and the cost of equity capital. The AccountingReview, 72(3), 323–349.
Botosan, C. A., & Plumlee, M.A. (2002). A re-examination of disclosure level and theexpected cost of equity capital. Journal of Accounting Research, 40(1), 21–40.
Brennan, N. M., Guillamon-Saorin, E., & Pierce, A. (2009). Impressionmanagement: Devel-oping and illustrating a scheme of analysis for narrative disclosures—A methodolog-ical note. Accounting, Auditing & Accountability Journal, 22(5), 789–833.
Cahan, S. F., Rahman, A., & Perera, H. (2005). Global diversification and corporate disclo-sure. Journal of International Accounting Research, 4(1), 73–93.
Campbell, D., & Slack, R. (2008). Social and environmental narrative reporting analysts'perceptions. Research report no. 104. London: Association of Chartered Certified Ac-countants (ACCA).
Canadian Institute of Chartered Accountants (CICA) (2002). Management's discussion andanalysis: Guidance on preparation and disclosure. Toronto, Ontario: Canadian Instituteof Chartered Accountants.
Cerf, A.R. (1961). Corporate reporting and investment decisions. Berkeley: University ofCalifornia Press.
Chau, G., & Gray, S. J. (2002). Ownership structure and corporate voluntary disclosure inHong Kong and Singapore. The International Journal of Accounting, 37(2), 247–265.
Chau, G., & Gray, S. J. (2010). Family ownership, board independence and voluntarydisclosure: Evidence from Hong Kong. Journal of International Accounting, Auditingand Taxation, 19(2), 93–109.
Chavent, M., Ding, Y., Fu, L., Stolowy, H., & Wang, H. (2006). Disclosure and determinantsstudies: An extension using the divisive clustering method. The European AccountingReview, 15(2), 181–218.
Chen, C., & Jaggi, B. (2000). Association between independent non-executive directors,family control and financial disclosures in Hong Kong. Journal of Accounting andPublic Policy, 19, 285–310.
Clarkson, P.M., Dontoh, A., Richardson, G., & Sefcik, S. E. (1992). The voluntary inclusion ofearnings forecasts in IPO prospectuses. Contemporary Accounting Research, 8,601–616.
Clatworthy, M.A., & Jones, M. J. (2003). Financial reporting of good news and bad news: Ev-idence from accounting narratives. Accounting and Business Research, 33(3), 171–185.
Cooke, T. (1992). The impact of size, stock market listing and industry type on disclosurein the annual reports of Japanese listed corporations. Accounting and BusinessResearch, 22, 229–237.
Coram, P. J., Mock, T. J., & Monroe, G. S. (2011). Financial analysts' evaluation of enhanceddisclosure of non-financial performance indicators. The British Accounting Review,43(2), 87–101.
Deeg, R. (2005). Remaking Italian capitalism? The politics of corporate governance re-form. West European Politics, 28(3), 521–548.
Deloitte (2007). In the dark II: What many boards and executives still don't know aboutthe health of their businesses. London: Deloitte.
Dye, R. A. (1985). Disclosure of non-proprietary information. Journal of AccountingResearch, 23, 123–145.
Eccles, R. G. J., & Coleman, I. (1998). Pursuing value: The information reporting gap in theUnited Kingdom. Londra: PricewaterhouseCoopers.
Eng, L. L., & Mak, Y. T. (2003). Corporate governance and voluntary disclosure. Journal ofAccounting and Public Policy, 22, 325–345.
European Securities and Markets Authority (ESMA) (2005). Recommendation on alterna-tive performance measures (CESR/05-178b). Paris: European Securities and MarketsAuthority Committee of European Securities Regulators.
Firth, M. (1984). The extent of voluntary disclosure in corporate annual reports and its as-sociation with security risk measures. Applied Economics, 16, 269–277.
Francis, J., & Schipper, K. (1999). Have financial statements lost their relevance? Journal ofAccounting Research, 37(2), 319–352.
Frost, C. A. (1994). Discussion of the effects of accounting diversity: Evidence from theEuropean Union. Journal of Accounting Research, 32, 169–175 (Supplement).
Gamerschlag, R., Moller, K., & Verbeeten, F. (2011). Determinants of voluntary CSR disclo-sure: Empirical evidence from Germany. Review of Managerial Science, 5(2–3), 233–262.
Garsombke, H. (1979). The relationship between corporate disclosure and firm risk.Journal of Business Finance & Accounting, 6(1), 53–70.
Gibbins, M., Richardson, A., &Waterhouse, J. (1990). The management of corporate finan-cial disclosure: Opportunism, ritualism, policies, and process. Journal of AccountingResearch, 28, 121–143.
Gibson, C. H. (1980). Financial ratios in annual reports. CPA Journal, 52, 18–29.Gibson, C. H. (1987). How chartered financial analysts view financial ratios. Financial
Analysts Journal, 74–76.Gombola, M. J., & Ketz, J. E. (1983). Financial ratio patterns in retail and manufacturing or-
ganizations. Financial Management, 12(2), 45–56.Gomes, F. C., Yasin, M. M., & Lisboa, G. V. (2004). An examination of manufacturing organiza-
tions' performance evaluation's analysis, implications and a framework for future research.International Journal of Productivity and Performance Management, 24(5), 488–513.
Gomes, F. C., Yasin, M. M., & Lisboa, G. V. (2007). An empirical investigation ofmanufacturing performance measures utilization. The perspectives of executivesand financial analysts. International Journal of Productivity and PerformanceManagement, 56(3), 187–204.
Gray, R., Javad, M., Power, D.M., & Sinclair, C. D. (2001). Disclosure and corporate charac-teristics: A research note and extension. Journal of Business Finance & Accounting,28(3–4), 327–356.
Gray, S. J., Meek, G., & Roberts, C. B. (1995). International capital market pressure and vol-untary disclosures by U.S. and U.K. multinationals. Journal of International FinancialManagement and Accounting, 6, 43–68.
Grossman, S. (1981). The role of warranties and private disclosure about product quality.Journal of Law and Economics, 24, 461–483.
Grossman, S., & Stiglitz, J. (1980). Stockholder unanimity inmaking production and finan-cial decisions. Quarterly Journal of Economics, 94(3), 543–566.
Group of 100 (G100) (2003). Guide to review of operations and financial condition.Southbank (VIC): Group of 100 Inc.
Hair, J. F., Anderson, R. E., Tatham, R. L., & Black, W. C. (1995). Multivariate data analysiswith readings. New Jersey: Prentice-Hall Press.
Hall, P. A., & Soskice, D. (2001). Varieties of capitalism. Oxford: Oxford University Press.Haniffa, R. M., & Cooke, T. E. (2002). Culture, corporate governance, and disclosure in
Malaysian corporations. Abacus, 38(3), 317–349.Hill, N. C., & Stonde, B. K. (1980). Accounting betas, systematic operating risk, and finan-
cial leverage: A risk-composition approach to the determinants of systematic risk.Journal of Financial and Quantitative Analysis, 15(3), 595–637.
Ho, S. S. M., & Wong, K. S. (2001). A study of the relationship between corporate gover-nance structures and the extent of voluntary disclosure. Journal of InternationalAccounting, Auditing and Taxation, 10, 139–156.
Holthausen, R. W., & Leftwich, R. W. (1983). The economic consequences of accountingchoice: Implications of costly contracting and monitoring. Journal of Accounting andEconomics, 5, 77–117.
Hooks, J., Coy, D., & Howard, D. (2002). The information gap in annual reports. Accounting,Auditing & Accountability Journal, 4, 501–522.
Hossain, M., & Hammami, H. (2009). Voluntary disclosure in the annual reports of anemerging country: The case of Qatar. Advances in Accounting, 25(2), 255–265.
Hossain, M., Perera, M. H. B., & Rahman, A.R. (1995). Voluntary disclosure in the annualreports of New Zealand companies. Journal of International Financial Managementand Accounting, 6, 69–87.
Hossain, M., Tan, L. M., & Adams,M. B. (1994). Voluntary disclosure in an emerging capitalmarket: Some empirical evidence from companies listed on the Kuala Lumpur stockexchange. The International Journal of Accounting, 29(4), 334–351.
Inchausti, B. G. (1997). The influence of company characteristics and accounting regula-tion on information disclosed by Spanish firms. The European Accounting Review,6(1), 45–68.
International Accounting Standard Board (IASB) (2010). IFRS practice statement on man-agement commentary. London: International Accounting Standard Board.
Kaplan, R. S., & Norton, D. P. (1992). The balanced scorecard: Measures that drive perfor-mance. Harvard business review, 70(1), 71–79.
Kelly, L. (1983). The development of a positive theory of corporate management's role inexternal financial reporting. Spring. Journal of Accounting Literature, 111–150.
Kreps, D.M., & Sobel, J. (1994). In R. Aumann, & S. Hart (Eds.), Signalling. Handbook of gametheory, Volume II. (pp. 849–868). New York: Elsevier.
Laffont, J. J. (1989). The economist of uncertainty and information. Cambridge: The MIT Press.Lang, M. H., & Lundholm, R. J. (1993). Cross sectional determinants of analysts rating of
corporate disclosure. Journal of Accounting Research, 31(2), 246–271.Leftwich, R. W., Watts, R. L., & Zimmerman, J. L. (1981). Voluntary corporate disclosure:
The case of interim reporting. Journal of Accounting Research, 19, 50–77 (Suppl.).Leventis, S., & Weetman, P. (2004). Impression management: Dual language reporting
and voluntary disclosure. Accounting Forum, 28, 307–328.
277F. Dainelli et al. / Advances in Accounting, incorporating Advances in International Accounting 29 (2013) 267–277
Lewellen, J. (2004). Predicting returns with financial ratios. Journal of Financial Economics,74(2), 209–235.
Li, J., Pike, R., & Haniffa, R. (2008). Intellectual capital disclosure and corporate governancestructure in UK firms. Accounting and Business Research, 38(2), 137–159.
Liedtka, S. (2002). The information content of non-financial measures in the airline indus-try. Journal of Business Finance & Accounting, 29, 1105–1121.
Lim, S., Matolcsy, Z., & Chow, D. (2007). The association between board composition and dif-ferent types of voluntary disclosure. The European Accounting Review, 16(3), 555–583.
Lynch, R. L., & Cross, K. F. (1991). Measure up! Mandarin, London: The Essential Guide toMeasuring Business Performance.
Malone, D., Fries, C., & Jones, T. (1993). An empirical investigation of the extent of corpo-rate financial disclosure in the oil and gas industry. Journal of Accounting and Auditing& Finance, 8, 249–273.
Martikainen, T. (1989). Modelling stock price behaviour by financial ratios. Decisions inEconomics and Finance, 12(1), 119–138.
Matsumoto, K., Shivaswamy, M., & Hoban, J. (1995). Security analysts' views of the finan-cial ratios of manufacturers and retailers. Financial practice & education, 44–55.
McNally, G. M., Eng, L. H., & Hasseldine, C. R. (1982). Corporate financial reporting in NewZealand: An analysis of user preferences, corporate characteristics and disclosurepractices for discretionary information. Accounting and Business Research, 13(49),11–20.
Meek, G. K., Roberts, C. B., & Gray, S. J. (1995). Factors influencing voluntary annual reportdisclosures by U.S., U.K. and continental Europeanmultinational corporations. Journalof International Business Studies, 26(3), 555–572.
Merkl-Davies, D.M., & Brennan, N. M. (2007). Discretionary disclosure strategies in corpo-rate narratives: Incremental information or impression management? Journal ofAccounting Literature, 26, 116–194.
Milgrom, P. (1981). Good news and bad news: Representation theorems and applications.Bell Journal of Economics, 12, 380–391.
Miller, G. S. (2002). Earnings performance and discretionary disclosure. Journal ofAccounting Research, 40(1), 173–204.
Milne, M., & Adler, R. (1999). Exploring the reliability of social and environmentaldisclosures content analysis. Accounting, Auditing & Accountability Journal,12(2), 237–256.
Morrison, A., & Harrison, J. (2009). Explaining voluntary ratio disclosures at the categorylevel, working paper presented at the Accounting and Finance Association of Australiaand New Zealand (AFAANZ) annual conference. Australia: Adelaide.
National Council of Chartered Accountants (NCCA, Consiglio Nazionale Dei DottoriCommercialisti, CNDCEC) (2009). The management reporting document in the light ofthe new features introduced by legislative decree 32/2007 enacted. Original title: LaRelazione sulla Gestione dei bilanci d'esercizio alla luce delle novità introdotte dalD.lgs 32/2007. Rome: Consiglio Nazionale Dei Dottori Commercialisti.
Owusu-Ansah, S. (1998). The impact of corporate attributes on the extent of mandatorydisclosure and reporting by listed companies in Zimbabwe. The International Journalof Accounting, 33(5), 605–631.
Pae, S. (2002). Optimal disclosure policy in oligopoly markets. Journal of AccountingResearch, 40–3, 901–932.
Patelli, L., & Prencipe, A. (2007). The relationship between voluntary disclosure and inde-pendent directors in the presence of a dominant shareholder. The European Account-ing Review, 16(1), 5–33.
Patton, J., & Zelenka, I. (1997). An empirical analysis of the determinants of the extent ofdisclosure in annual reports of joint stock companies in the Czech Republic. TheEuropean Accounting Review, 6, 605–626.
Penman, S. (1980). An empirical investigation of the voluntary disclosure of corporateearnings forecasts. Journal of Accounting Research, 18(1), 132–160.
Prencipe, A. (2004). Proprietary costs and determinants of voluntary segment disclosure:Evidence from Italian listed companies. The European Accounting Review, 13(2),319–340.
PricewaterHouseCoopers (PwC) (2008). Joining the dots. A summary of the narrativereporting practices of the FTSE 350. London: PricewaterHouseCoopers PLC.
Raffournier, B. (1995). The determinants of voluntary financial disclosure by Swiss listedcompanies. The European Accounting Review, 4(2), 261–280.
Rasmusen, B. (1987). Games and information: An introduction to game theory.Oxford-Cambridge: Blackwell.
Riley, R. A., Preason, T., & Trompeter, G. (2003). The value relevance of non-financial per-formance variables: The case of the airline industry. Journal of Accounting and PublicPolicy, 22, 231–254.
Ruf, B.M., Muralidhar, K., Brown, R. M., Janney, J. J., & Paul, K. (2001). An empirical inves-tigation of the relationship between change in corporate social performance and finan-cial performance: A stakeholder theory perspective. Journal of Business Ethics, 143–156.
Salmi, T., Virtanen, I., & Yli-Olli, P. (1997). The generalized association between financialstatements and security characteristics. Scandinavian Journal of Management, 13(2),121–136.
Schipper, K. (1991). Commentary on analysts' forecasts. Accounting Horizons,105–121.
Security Exchange Commission (SEC) (2003). Interpretation: Commission guidance re-garding management's discussion and analysis of financial condition and resultsof operations, 17 CFR Parts 211, 231 and 241. Release nos. 33-8350; 34-48960;FR-72.
Singhvi, S. S., & Desai, H. B. (1971). An empirical analysis of the quality of corporate finan-cial disclosure. The Accounting Review, 46(1), 129–138.
Spence, A.M. (1973). Job market signalling. Quarterly Journal of Economics, 87(3),355–374.
Verrecchia, R. E. (1983). Discretionary disclosure. Journal of Accounting and Economics, 5,179–194.
Wallace, R. S. O., & Naser, K. (1995). Firm-specific determinants of the comprehensivenessof mandatory disclosure in the corporate annual reports of firms listed on the stockexchange of Hong Kong. Journal of Accounting & Public Policy, 14(4), 311–368.
Wallace, R. S. O., Naser, K., & Mora, A. (1994). The relationship between the comprehen-siveness of corporate annual reports and firm characteristics in Spain. Accounting andBusiness Research, 25(97), 41–53.
Wang, K., Sewon, O., & Claiborne, M. C. (2008). Determinants and consequences of volun-tary disclosure in an emerging market: Evidence from China. Journal of InternationalAccounting, Auditing and Taxation, 17(1), 14–30.
Watson, A., Shrives, A. P., & Marston, C. (2002). Voluntary disclosure of accounting ratiosin the UK. The British Accounting Review, 34(4), 289–313.
Watts, R. L. (2006).What has the invisible hand achieved? Accounting & Business Research,Special Issue, 36, 51–61.
Weetman, P., & Beattie, A. (1999). Corporate communication: Views of institutional inves-tors and lenders. Edinburgh: Institute of Chartered Accountants of Scotland.
Welker, M. (1995). Disclosure policy, information asymmetry, and liquidity in equitymarkets. Contemporary Accounting Research, 11(2), 801–827.
Wright, P. D., & Keegan, D. P. (1997). Pursuing value: The emerging art of reporting on thefuture. London: Price Waterhouse.
Zattoni, A. (1999). The structure of corporate groups: The Italian case. CorporateGovernance: An International Review, 7(1), 38–48.