daily operations briefingcontent.govdelivery.com/attachments/usdhsfema/2016/01/12/file... · - 140...
TRANSCRIPT

•Daily Operations BriefingTuesday, January 12, 2016
8:30 a.m. EST

Significant Activity: Jan 11-12Significant Events: None
Significant Weather:• Flooding – Lower MS Valley• Heavy snow – Northeast and Great Lakes• Snow/rain – Pacific Northwest• Cold temperatures – Upper Midwest/Great Lakes• Red Flag Warnings / Elevated Fire Weather conditions: None• Space Weather Storms: No space storms observed the past 24 hours;
Minor/G1 – Geomagnetic storms likely in the next 24 hours
Declaration Activity: None

National Weather Forecast Day 1
TomorrowToday
http://www.wpc.ncep.noaa.gov/national_forecast/natfcst.php

Active Watches/Warnings
http://www.nws.noaa.gov/largemap.php
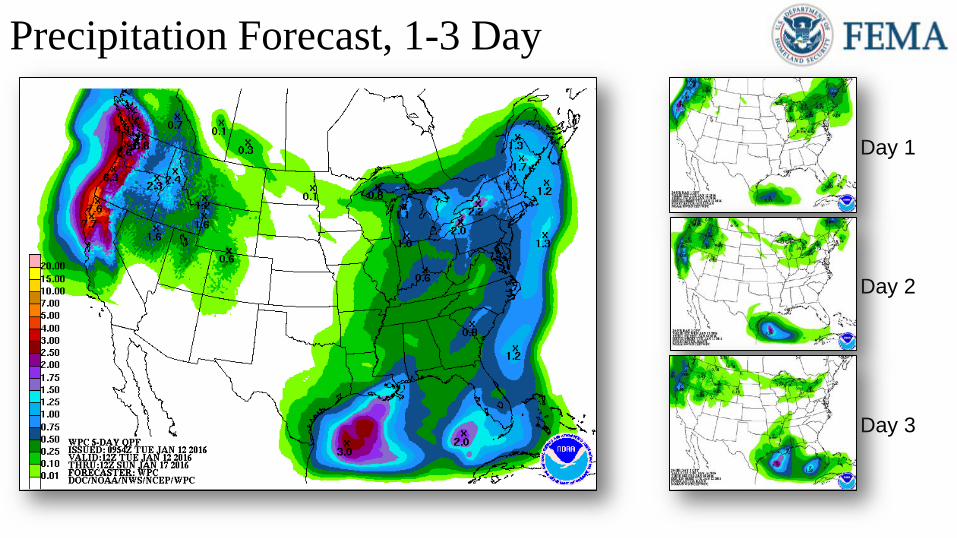
http://www.wpc.ncep.noaa.gov/qpf/qpf2.shtml
Day 3
Day 2
Day 1
Precipitation Forecast, 1-3 Day

Mississippi River
Mississippi River @ Vicksburg:Current Level: 49.32Forecast Peak 50.5 (Jan 15)- 140 homes currently threatened @
current level
Mississippi River @ Baton Rouge:Current Level: 40.58Forecast Peak 42.4 (Jan 15)- Bonnet Carre Spillway slowly opening
as of Jan 10; 20 gates currently open- Gates will continue to be opened until
the 17/18th, with a max of 200 gates- Morganza Spillway will NOT open
Mississippi River @ Arkansas City:Current Level: 44.2Forecast Peak 44.2 (Jan 12)- Southern portions of the city become
flooded

Hazard Outlook, Jan 14-18
http://www.cpc.ncep.noaa.gov/products/predictions/threats/threats.php

http://spaceweather.com/
Past24 Hours Current Next
24 HoursSpace Weather Activity None None MinorGeomagnetic Storms None None G1Solar Radiation Storms None None NoneRadio Blackouts None None None
Space Weather
HF Communication Impact Sunspot Activity
http://www.swpc.noaa.gov/communities/space-weather-enthusiasts
http://www.swpc.noaa.gov/products/geophysical-alert-wwv-text

Declaration Requests in ProcessRequests
APPROVED(since last report)
Requests DENIED(since last report)
2 Date Requested 0 0
LA – EM Severe Storms and Flooding January 8, 2016
WA – DR Severe Winter Storms, Straight-Line winds, Landslides, Mudslides, and Flooding January 8, 2016
Disaster Requests & Declarations

Open Field Offices as of January 12

Joint Preliminary Damage Assessments
Region State / Location Event IA/PA
Number of CountiesStart – End
Requested Complete
IV AL Severe Weather & FloodingDecember 23, 2015 – continuing PA 43 30 1/7 – TBD
VI
TX Severe StormsDecember 26, 2015 – continuing
IA 5 5 12/30 – 1/6PA 7 5 12/31 – TBD
AR Severe Storms & FloodingDecember 26, 2015 – continuing
IA 19 (+1) 0 1/11 – TBD PA 42 10 (+5) 1/6 – TBD
OK Severe Winter StormsDecember 26, 2015 – continuing PA 34 (+2) 8 (+5) 1/5 –TBD
VII MO Flooding & Flash FloodingDecember 22, 2015 - continuing
IA 41 10 1/6 – TBDPA 14 0 1/13 – TBD
XOR Storm and Flooding
December 7-23, 2015 PA 13 0 1/11 – TBD
WA Wind Storms, Landslides, Mudslide, FloodingDecember 1-14, 2015
IA 23 23 1/5 – 1/8PA 23 0 1/11 – TBD

0
10
20
30
40
50
60
1971-AL 4020-NY 4145-CO 4175-MS 4227-WY 4240-CA 4237-SD
Total Households in FEMA Direct Housing per StatePast Year per Week, 1/12/2015 – 1/11/2016, Projected to 7/11/2016
There are currently 49 Households Occupying 51 Temporary Units
Direct Housing
States with Currently Occupied Units
Based On Projected Move Outs per DR
1/11/201649 (+4)
7/11/2016
WY
CA
DR IA Declaration Date
Program End Date
Current # of Households in Direct Housing
(Weekly Change)
4227-WY 7/7/2015 1/7/2017 11 (0)
4240-CA 9/22/2015 3/22/2017 38 (+4)
49 (+4)
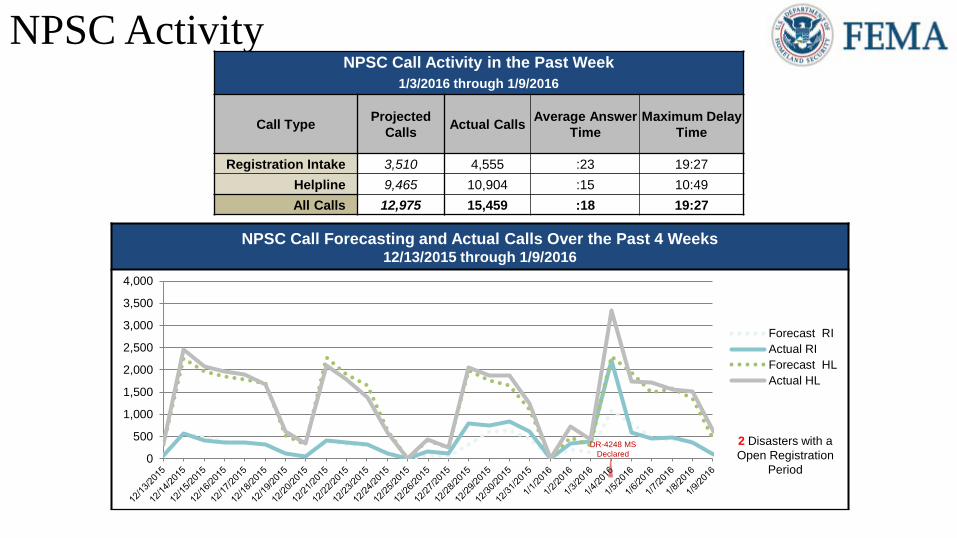
NPSC Call Forecasting and Actual Calls Over the Past 4 Weeks12/13/2015 through 1/9/2016
NPSC Activity
2 Disasters with a Open Registration
Period
NPSC Call Activity in the Past Week1/3/2016 through 1/9/2016
Call Type Projected Calls Actual Calls Average Answer
TimeMaximum Delay
Time
Registration Intake 3,510 4,555 :23 19:27Helpline 9,465 10,904 :15 10:49All Calls 12,975 15,459 :18 19:27
0
500
1,000
1,500
2,000
2,500
3,000
3,500
4,000
Forecast RIActual RIForecast HLActual HL
DR-4248 MS Declared

IHP Approved per CategoryIn the Past 2 Weeks – 12/28/2015 through 1/11/2016
Individual Assistance ActivityIndividuals and Households Program Activity
as of 01/11/2016 at 0000 ESTIn Past 7 Days Cumulative
Applicants Approved
Amount Approved
Applicants Approved
Amount Approved
Ope
n R
egis
trat
ion
Perio
d
4241-SC Declared 10-05-2015 End Of Reg Period 01-04-2016
Housing Assistance 956 $1,722,234.42 23,946 $70,325,700.83
Other Needs Assistance 150 $283,009.22 7,138 $10,861,533.16
Total IHP $2,005,243.64 $81,187,233.99
4245-TX Declared 11-25-2015 End Of Reg Period 01-25-2016
Housing Assistance 194 $567,309.95 2,262 $12,669,842.48
Other Needs Assistance 127 $269,312.74 1,186 $2,884,074.80
Total IHP $836,622.69 $15,553,917.28
4248-MS Declared 01-04-2016 End Of Reg Period 03-04-2016
Housing Assistance 72 $562,594.87 72 $562,594.87
Other Needs Assistance 35 $156,313.80 35 $156,313.80
Total IHP $718,908.67 $718,908.67
Oth
er IH
P Ac
tive
7 Declarations IHP Programmatically Open - Closed Registration *
Housing Assistance 62 $168,903.56
Other Needs Assistance 19 $32,987.30
Total IHP $201,890.86
Total IHP Approved in Past Week $3,762,665.86
$0
$500,000
$1,000,000
$1,500,000
$2,000,000
$2,500,000
$3,000,000
$3,500,000
$4,000,000
Housing - Rental
Housing -Repair/ReplaceHousing - Other
Other Needs -Personal PropertyOther Needs -Medical/DentalOther Needs -TransportationOther Needs -Other
Last Week This Week
$2,207,857 $3,762,666

FEMA Readiness – Deployable Teams /Assets Deployable Teams/Assets
Resource Status Total FMCAvailable
Partially Available
Not Available
Detailed,Deployed,Activated
Comments Rating Criterion
FCO 39 21 54% 0 3 15 Only 2 Type1 FCOs are available OFDC Readiness:FCO Green Yellow RedType 1 3+ 2 1Type 2 4+ 3 2Type 3 4 3 2
FDRC 3 2 1FDRC 8 3 38% 0 0 5
US&R 28 27 96% 0 1 0 NM-TF1 (Red) - Personnel shortages• Green = Available/FMC• Yellow = Available/PMC• Red = Out-of-Service• Blue = Assigned/Deployed
National IMAT 3 3 100% 0 0 0
• Green: 3 avail • Yellow: 1-2 avail• Red: 0 avail (Individual N-IMAT red if 50% of
Section Chiefs and/or Team Leader is unavailable for deployment.)
Regional IMAT 13 5 38% 0 1 7
Deployed: RIII (Team 1) On alert (available) in support of SOTUARIV (Team 2) Deployed to MSRVI (Team 1) Deployed to LARVI (Team 2) Deployed to TXRVII Deployed to MORVIII Deployed to OST, SD (Available to re-deploy as needed) RIX (Team 2) Deployed to CA; RX Deployed to WANMC:RV (Team 1) Red – Personnel Shortages
• Green: 7 or more avail• Yellow: 4 - 6 teams available• Red: > 8 teams deployed/unavailable
R-IMAT also red if TL Ops/Log Chief is unavailable & has no qualified replacement
MCOV 59 38 64% 0 12 9 4 MCOVs deployed to TX (FEMA-4245-DR)5 MCOVs deployed to MS (FEMA – 4248-DR)
• Green = 80 – 100% avail• Yellow = 33 – 66% avail• Red = 59% or below avail• Readiness remains 95%
MERS 18 15 83% 0 0 31 Team deployed to ID (FEMA-4246-DR)2 Teams deployed to MS (FEMA-4248-DR)
• Green = >66% available• Yellow = 33% to 66% available• Red = <33% available

FEMA Readiness – National/Regional TeamsNational/Regional Teams
Resource Status Total FMCAvailable
Partially Available
Not Available Status Comments Rating
Criterion
NWC 5 5 100% 0 0 Not Activated Enhanced Watch (1pm – 11pm) for SOTUA• Green = FMC• Yellow = PMC• Red = NMCNRCC 2 344 89% 0 44 Not Activated
HLT 1 N/A N/A 0 0 Not Activated
DEST Not Activated
RRCCs 10 10 100% 0 0 Activated Region VI at Level III (Day shift)Region VII at Level III (Day shift)
RWCs/MOCs 10 10 100% 0 0 Activated Region VI at Enhanced Watch (Night shift)
