daiichi pharmaceutical co., ltd
TRANSCRIPT

Daiichi Pharmaceutical Co., Ltd.Annual Report 1998
Brought to you by Global Reports

Since its establishment in 1915, Daiichi Pharmaceutical Co., Ltd., has been guided by its commitment to provide
valuable pharmaceuticals that help to enrich the quality of life. This commitment remains as strong as ever and is
expressed through our pursuit of excellence in offering prescription drugs, over-the-counter products, animal health
products, and fine chemicals.
Having earned a strong reputation in Japan, Daiichi is gaining increasing recognition abroad through its indepen-
dent marketing network as well as through its licensing tie-ups with renowned pharmaceutical manufacturers in
other countries.
Daiichi has advanced steadily over the years by developing innovative pharmaceuticals that have a wealth of clinical
and commercial potential. The Company is now sharpening the focus of its R&D programs to emphasize therapeutic
and diagnostic areas that reflect both Daiichi’s strengths and the needs of the market.
CONTENTS �
FINANCIAL HIGHLIGHTS ................................................................................ 1A MESSAGE FROM THE PRESIDENT ............................................................. 2OUR MISSION ................................................................................................. 4
TO BECOME AN INNOVATION-DRIVEN GLOBAL ENTERPRISE .............. 4DEVELOPING FLAGSHIP PRODUCTS FOR CONTINUED GROWTH ........ 6LEADING THE WORLD IN SYNTHETIC ANTIBACTERIALS........................ 8OVERSEAS DEVELOPMENT AS THE KEY TO WINNING IN GLOBAL MARKETS...................................................... 10
RESEARCH AND DEVELOPMENT..................................................................12 MANUFACTURING......................................................................................... 14
CONTENTS �
MARKETING AND DISTRIBUTION................................................................. 15REVIEW OF OPERATIONS..............................................................................16
PRESCRIPTION DRUGS ............................................................................ 16OTC PRODUCTS........................................................................................ 17ANIMAL HEALTH PRODUCTS AND FINE CHEMICALS & OTHERS.......... 18
COMMUNITY ACTIVITIES .............................................................................. 19SUBSIDIARIES’ AND PRINCIPAL AFFILIATED COMPANIES’ ACTIVITIES ... 20BOARD OF DIRECTORS ................................................................................ 22FINANCIAL SECTION..................................................................................... 23GENERAL INFORMATION.............................................................................. 41
PROFILE �
Brought to you by Global Reports
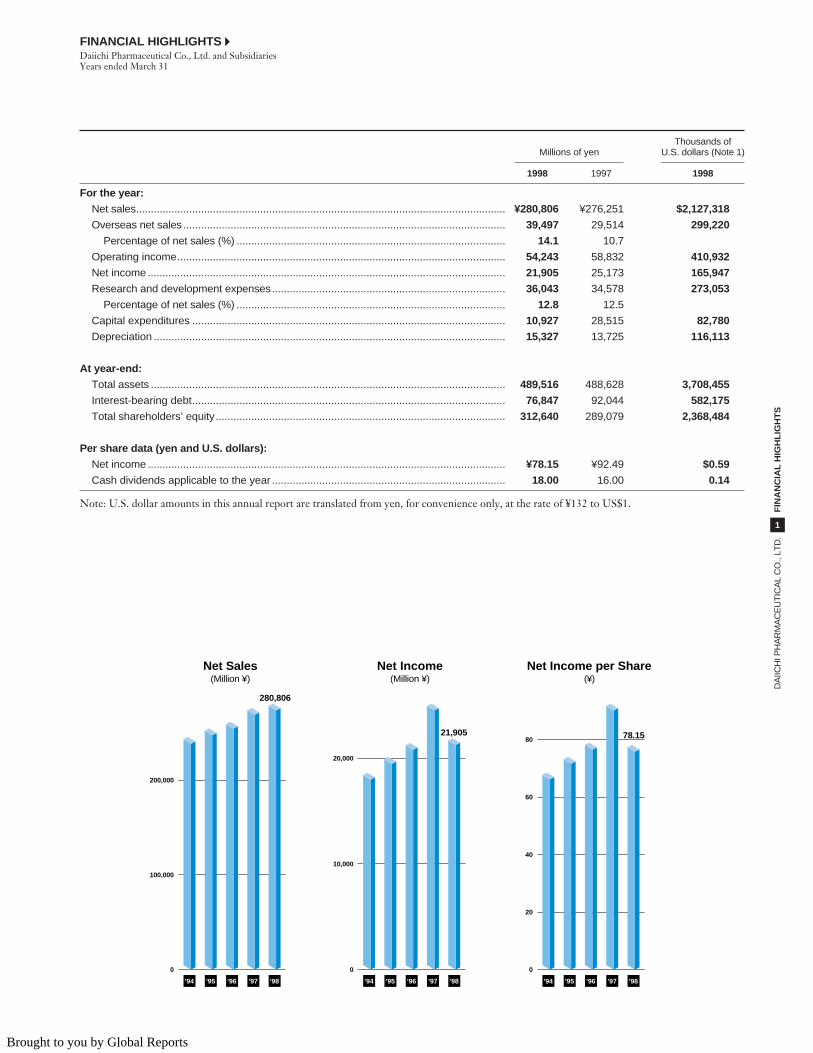
Thousands ofMillions of yen U.S. dollars (Note 1)
1998 1997 1998
For the year:
Net sales............................................................................................................................. ¥280,806 ¥276,251 $2,127,318
Overseas net sales ............................................................................................................. 39,497 29,514 299,220
Percentage of net sales (%) ........................................................................................... 14.1 10.7
Operating income............................................................................................................... 54,243 58,832 410,932
Net income......................................................................................................................... 21,905 25,173 165,947
Research and development expenses............................................................................... 36,043 34,578 273,053
Percentage of net sales (%) ........................................................................................... 12.8 12.5
Capital expenditures .......................................................................................................... 10,927 28,515 82,780
Depreciation ....................................................................................................................... 15,327 13,725 116,113
At year-end:
Total assets ........................................................................................................................ 489,516 488,628 3,708,455
Interest-bearing debt.......................................................................................................... 76,847 92,044 582,175
Total shareholders’ equity.................................................................................................. 312,640 289,079 2,368,484
Per share data (yen and U.S. dollars):
Net income......................................................................................................................... ¥78.15 ¥92.49 $0.59
Cash dividends applicable to the year ............................................................................... 18.00 16.00 0.14
Note: U.S. dollar amounts in this annual report are translated from yen, for convenience only, at the rate of ¥132 to US$1.
FINANCIAL HIGHLIGHTS �Daiichi Pharmaceutical Co., Ltd. and SubsidiariesYears ended March 31
DA
IICH
I PH
AR
MA
CE
UT
ICA
L C
O.,
LTD
.F
INA
NC
IAL
HIG
HL
IGH
TS
1
’94 ’95 ’96 ’97 ’98’94 ’95 ’96 ’97 ’98 ’94 ’95 ’96 ’97 ’98
280,806
78.1521,905
Net Income(Million ¥)
0
10,000
20,000
Net Sales(Million ¥)
0
100,000
200,000
Net Income per Share(¥)
0
20
40
60
80
Brought to you by Global Reports

DA
IICH
I PH
AR
MA
CE
UT
ICA
L C
O.,
LTD
.A
ME
SS
AG
E F
RO
M T
HE
PR
ES
IDE
NT
2
Dear Fellow Shareholders,
would like to begin this letterto you by outlining the busi-ness environment surround-
ing Daiichi Pharmaceutical Co., Ltd.,during fiscal 1997, ended March 31,1998. The year under review beganwith revisions to National Health Insur-ance (NHI) drug reimbursement pricesfor the second consecutive year, whichhave resulted in an approximate 4.4%reduction in these prices industrywide.
In September 1997, the Japanese government introduced revisions toNHI regulations that included an increasein out-of-pocket expenses for patients.Moreover, in April 1998 the governmentmade yet another cut in NHI drug re-imbursement prices, this time averaging9.7%. These cost-containment policiesadversely affected the Japanese pharma-ceutical industry in terms of both pricesand shipment volumes and led to negativegrowth for the industry as a whole. Whilewe anticipated these changes, they none-theless set the tone for very tight busi-ness conditions now and into the future.
Performance Highlights
aiichi employees worked in concert to deliver, on a timelybasis, the academic informa-
tion required by doctors and pharma-cists and bolstered overseas marketingactivities. Through such efforts toexpand and develop the markets forcore Daiichi products, the Companyposted a 1.6% increase in consolidatednet sales, to ¥280.8 billion (US$2,127.3million). The reduction in NHI drugreimbursement prices and our aggres-sive investment in both R&D and
D
I
A MESSAGE FROM THE PRESIDENT �
Brought to you by Global Reports

DA
IICH
I PH
AR
MA
CE
UT
ICA
L C
O.,
LTD
.A
ME
SS
AG
E F
RO
M T
HE
PR
ES
IDE
NT
3
information infrastructure, however,caused operating income to fall 7.8%,to ¥54.2 billion (US$410.9 million).Net income was down 13.0%, to ¥21.9billion (US$165.9 million), comparedwith the previous term. We recognized a¥2.6 billion extraordinary gain on thesale of real estate in the previous fiscalyear, which is reflected in the sharp year-on-year decline in net income. Cashdividends for the fiscal year were ¥18(US$0.14 million) per share.
By segment, sales of prescription phar-maceuticals decreased 2.3%, to ¥211 bil-lion (US$1,595.7 million), while sales ofDaiichi’s over-the-counter (OTC) products rose 1.4%, to ¥10.7 billion(US$81.0 million). Animal health prod-uct sales fell 7.3%, to ¥4.2 billion(US$31.8 million). Meanwhile, sales ofbulk fine chemical products for use inpharmaceuticals, food additives, andfeeds grew 21.2%, to ¥55.3 billion(US$418.8 million).
Overseas sales soared 33.8%, to ¥39.5billion (US$299.2 million), reflectingsteady growth in bulk shipments oflevofloxacin to the United States as wellas a rise in patent licensing income—thanks to strong sales growth in Europe—and foreign exchange gains arising froma relatively weaker yen.
Significant Events
during the Fiscal Year
ew products introduced in the domestic market duringfiscal 1997 included in the
prescription pharmaceutical segment anew package formulation for Omnipaquenonionic contrast medium in plastic bottles, introduced in August 1997. In
the OTC segment, we launched KaroyanApogeeca �, a new product in our tri-chogenous agent line, in August 1997,and Senlock Ace, a combination switch-OTC H2 blocker and compound gas-trointestinal agent that combines the H2
blocker cimetidine with three antacids,in September 1997.
Debuting in overseas markets in February 1998 was Floxin Otic (ofloxacinotic solution) for treating ear infections.Marketed by our U.S. subsidiary DaiichiPharmaceutical Corporation (DPC),Floxin Otic is the first new quinolone pre-paration approved for otic use and thefirst new otic preparation in the UnitedStates in 20 years. Furthermore, in May1998 we formed Daiichi Pharmaceutical(Beijing) Co., Ltd. (DPP), a joint ven-ture with Beijing General Pharmaceu-tical Corp., to work in cooperation withDaiichi Pharmaceutical (China) Co.,Ltd. (DPB), to bolster our marketingcapabilities in China’s growing health-care market.
In financing activities, ¥6,574 mil-lion was raised through the exercise ofwarrants on Swiss franc denominateddetachable warrant bonds maturing onApril 27, 1997. The redemption of the¥15,242 million balance of bonds out-standing was paid from internal reserves.
Future Outlook and Strategies
he road ahead will not be easy for Daiichi. Declining birthrates in Japan and a growing
senior citizen population are the impetusfor further cost-containment measuresto be implemented around fiscal 2000.These reforms will have a profoundimpact on the pharmaceutical industry
and will lead to reductions in both drugprices and shipment volumes.
In overseas markets, industrializedcountries are also introducing measuresto reduce drug expenses. The harmoni-zation of drug approval procedures iseliminating national barriers in our industry, and thus growing numbers offoreign pharmaceutical companies areraising their profiles in Japan, the world’ssecond-largest market.
To remain successful within thisenvironment, we must build a corporatestructure that is truly world-class andglobally focused. In recognition of this, we have formulated our GLOBAL 10corporate vision. Over the next 10 years,Daiichi will become an innovation-driven global enterprise that continuallydevelops new drugs with global signifi-cance and that has independent salesnetworks in Japan, the United States,Europe, China, and Southeast Asia. To realize GLOBAL 10, we must align all corporate activities—including R&D,manufacturing, and sales and distri-bution—with global standards whilestrengthening our commitment to beinga responsible and caring corporate citizen.
Our vision for the next 10 years isclear. I ask for your support to make it a reality.
July 1998
Tadashi Suzuki President
TN
Brought to you by Global Reports

Daiichi’s Corporate Mission
To contribute to health and culture worldwide by developing innovative technologies
and delivering superior products
OUR MISSION �D
AIIC
HI P
HA
RM
AC
EU
TIC
AL
CO
., LT
D.
OU
R M
ISS
ION
4
To Become anInnovation-DrivenGlobal Enterprise
Borderless economies, global operations, hypercompetitive
markets—pick any catchphrase to describe the future; the
implications are the same: innovate, change, and grow or
else be left behind.
Daiichi knows that companies with a long-term vision—
and the tenacity to realize it—will benefit from emerging
opportunities in the 21st century. With this in mind, we have
formulated our corporate vision for the next 10 years,
GLOBAL 10, beginning in fiscal 1997. The Company aims to
comply with global standards and leverage its core capabili-
ties to become even more competitive. Ultimately, Daiichi’s
goal is to become an innovation-driven global enterprise.
We will focus on R&D and profitability to create value
for both the healthcare market and our shareholders. Our
financial targets for fiscal 2006 are consolidated net sales
of ¥500 billion, consolidated net income of ¥55 billion, and
consolidated return on equity of 12%. Furthermore, as a
research-oriented global pharmaceutical company, Daiichi
aims to launch at least one flagship pharmaceutical prod-
uct in its four major markets every three years and derive
more than 30% of consolidated net sales from overseas
sales in the next decade.
Return onShareholders’ Equity
7.3%
8.0%
12.0%
FY2001(projected)
FY1997
FY2006(projected)
FY2006(projected)
Net Sales
¥500 billion
FY2001(projected)
¥350 billion
FY1997 ¥281 billion
Brought to you by Global Reports
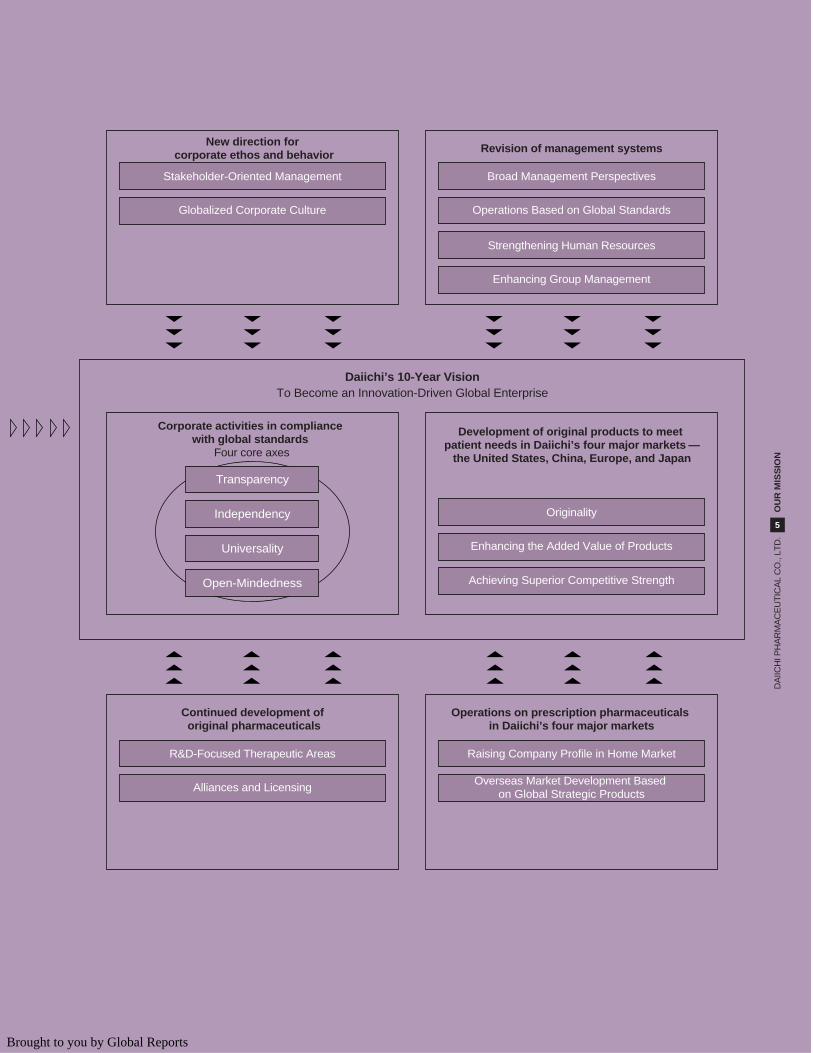
Broad Management Perspectives
Operations Based on Global Standards
Strengthening Human Resources
Enhancing Group Management
Revision of management systems
Stakeholder-Oriented Management
Globalized Corporate Culture
New direction for corporate ethos and behavior
Raising Company Profile in Home Market
Overseas Market Development Based on Global Strategic Products
R&D-Focused Therapeutic Areas
Alliances and Licensing
Continued development of original pharmaceuticals
Operations on prescription pharmaceuticals in Daiichi’s four major markets
Corporate activities in compliance with global standards
Four core axes
Development of original products to meet patient needs in Daiichi’s four major markets —
the United States, China, Europe, and Japan
Daiichi’s 10-Year VisionTo Become an Innovation-Driven Global Enterprise
Originality
Enhancing the Added Value of Products
Achieving Superior Competitive Strength
Transparency
Independency
Universality
Open-Mindedness
DA
IICH
I PH
AR
MA
CE
UT
ICA
L C
O.,
LTD
.O
UR
MIS
SIO
N
5
Brought to you by Global Reports

Developing FlagshipProducts for
Continued Growth
DA
IICH
I PH
AR
MA
CE
UT
ICA
L C
O.,
LTD
.O
UR
MIS
SIO
N
6
To bolster its competitiveness, Daiichi is striving to expand its core research capabili-ties and develop innovative new drugs with global marketing potential. To enhancethe efficiency of our development efforts, we are building a global R&D network andentering a wide range of alliances and collaborative arrangements with leadinghealthcare organizations.
R&D Expenses(Million ¥) (%)
0
10,000
20,000
30,000
40,000
0
10
20
R&D expenses (left scale)
R&D expenses as a percentage of net sales (right scale)
’94 ’95 ’96 ’97 ’98
START
GOAL
Brought to you by Global Reports

Keeping the R&D Pipeline Flowing with Original Products
o continue its growth in the coming 10 years,Daiichi plans to launch at least one flagship prod-uct in the world’s four major markets, the United
States, China, Europe, and Japan every three years. TheCompany will continue to invest aggressively in R&D toachieve this goal. By launching these products in Japan andoverseas, we will increase the proportion of the in-house-developed drugs that contribute to our revenue stream and,in turn, our profit margins. This will create a virtuous cyclethat solidifies Daiichi’s position as a research-oriented globalpharmaceutical company.
Creating Balanced Growth in Core Domains
n its GLOBAL 10 corporate vision, Daiichi has settledon four pipeline products, DU-6859a, DX-8951f,DX-9065a, and DM-9384, as Daiichi’s products of
global strategy, shown in the following four core domains.
Anti-infectiveThe launch of the new quinolone agents Tarivid (ofloxacin)and Cravit (levofloxacin) established Daiichi’s position in theanti-infective agent market domestically as well as interna-tionally. The Company currently is developing DU-6859a(sitafloxacin) as Daiichi’s third new quinolone agent.DU-6859a (sitafloxacin): A new quinolone with broad-spectrum, potent antibacterial activity shows strong efficacyagainst severe and refractory infectious diseases as well as awide range of general infections.Development state: Phase III in Japan and Phase II in Europe.Expected year of launch: FY2002 (Japan) and FY2003 (theU.S. and Europe)
AnticancerA synthetic camptothecin derivative, DX-8951f will joinirinotecan, codeveloped with Yakult Honsha Co., Ltd., inDaiichi’s portfolio of anticancer agents.
DX-8951f: A synthetic camptothecin derivative/cancer thera-peutic agent showing potent antitumor activity with reducedgastrointestinal toxicity. Expected to be useful in treatingtumors to which irinotecan is not indicated.Development state: Phase I in the United States, Europe, andJapanExpected year of launch: FY2003 (the United States andEurope) and FY2007 ( Japan)
Antithrombotic/vascular diseaseAn anticoagulant/specific factor Xa inhibitor, DX-9065a willcontribute to Daiichi’s third domain of antithrombotic/vas-cular disease. DX-9065a: The first synthetic specific factor Xa inhibitor/anticoagulant agent in the world. Effective for either parenteralor oral administration. Groundbreaking in that the drug canexert a potent antithrombotic effect with minimal bleedingpropensity.Development state: Phase I in Europe and JapanExpected year of launch: FY2004 (the United States andEurope) and FY2005 (Japan)
Cerebral diseaseAn agent for treating sequelae of cerebrovascular disordersand dementia of Alzheimer’s type, DM-9384 (nefiracetam) alsohas strong global potential and is one of the four flagshipdrugs in Daiichi’s global sales strategy for the coming 10 years. DM-9384 (nefiracetam): DM-9384 enhances voltage-dependent N-type Ca channel current and shows efficacy fortreating sequelae of cerebrovascular disorders and dementiaof Alzheimer’s type.Development state: Application in Japan and Phase II in China.Expected year of launch:FY1998 at the earliest (Japan), FY2001(China), and FY2004 (the United States and Europe)
I
T
DA
IICH
I PH
AR
MA
CE
UT
ICA
L C
O.,
LTD
.O
UR
MIS
SIO
N
7
Daiichi Original Products as a Per-
centage of Net SalesFY2006 (projected)
FY1996
60.0%
46.0%
(consolidated)
Brought to you by Global Reports
Leading the Worldin Synthetic
Antibacterials
DA
IICH
I PH
AR
MA
CE
UT
ICA
L C
O.,
LTD
.O
UR
MIS
SIO
N
8
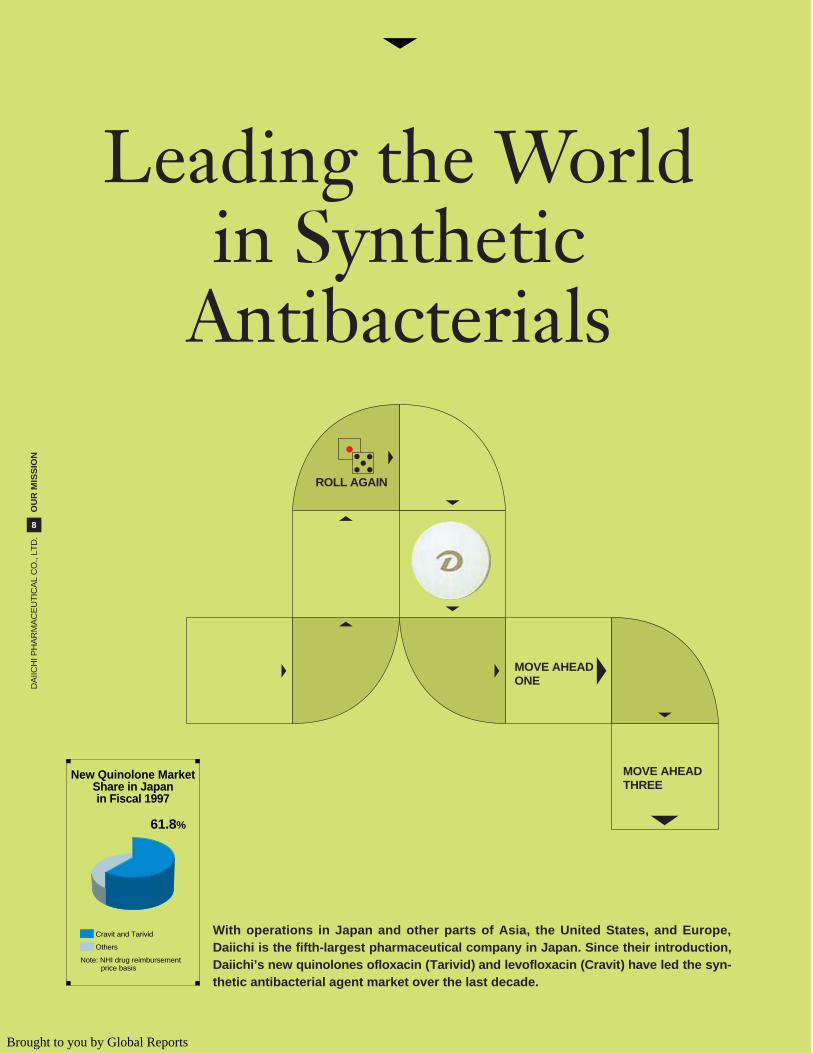
With operations in Japan and other parts of Asia, the United States, and Europe,Daiichi is the fifth-largest pharmaceutical company in Japan. Since their introduction,Daiichi’s new quinolones ofloxacin (Tarivid) and levofloxacin (Cravit) have led the syn-thetic antibacterial agent market over the last decade.
New Quinolone MarketShare in Japanin Fiscal 1997
Cravit and Tarivid
Others
Note: NHI drug reimbursement price basis
61.8%
MOVE AHEAD THREE
ROLL AGAIN
MOVE AHEAD ONE
Brought to you by Global Reports

Steady Growth on the Strength of Global Leadership
nother Daiichi new quinolone being introducedafter levofloxacin, DU-6859a (sitafloxacin) is cur-rently undergoing Phase III trials in Japan.
DU-6859a displays strong clinical efficacy against severe andrefractory infectious diseases as well as a wide range of generalinfections. Daiichi currently commands a greater than 60%share of the new quinolone antibacterial agent market inJapan, and such products represent more than 20% of totalCompany sales. Synthetic antibacterial agents thus join cardio-vascular system agents and contrast media as a core productsegment for Daiichi.
In addition, the clinical value of Daiichi’s new quinolonesynthetic antibacterial agents is also recognized in overseasmarkets, and these products have led the Company’s global-ization. Ofloxacin, for example, is now sold in approximately140 countries around the world.
Otic Preparation of Ofloxacin Launched in the United States
n December 1997, DPC received marketing ap-proval of ofloxacin otic solution (U.S. trade name:Floxin Otic) from the U.S. Food & Drug Admin-
istration and started the sales of that drug in the UnitedStates in February 1998. Floxin Otic is the first drug that theDaiichi Group has developed and directly marketed in theUnited States. The marketing approval was obtained onlythree and a half years after DPC started the development ofthis otic preparation in 1994.
Floxin Otic is the first new otic preparation launched in theUnited States in 20 years and is welcomed by patients suffering
from otitis externa and otitis media. DPC is leading thedetailing activities for Floxin Otic, which is being copromotedwith the Johnson & Johnson group.
Accelerating Worldwide Registration
of Daiichi’s New Quinolone Agents
aiichi is moving aggressively to further expand themarkets for its new quinolone agents by seekingregistration around the world. During the year under
review, the Company launched ofloxacin in tablet form inAustralia, while an intravenous formulation of ofloxacin hasbeen introduced in Malaysia and registered in Taiwan.
In addition, Daiichi submitted applications for the approvalof ofloxacin otic solution in Indonesia, Taiwan, Singapore, andMalaysia. After approval, three preparations of ofloxacin willbe sold in all major Southeast Asian markets as early as fiscal1998. Meanwhile, levofloxacin in tablet form had beenlaunched in Thailand, the Philippines, and Indonesia by May 1998 in addition to China, Hong Kong, and South Koreaand is awaiting regulatory approval in Taiwan, Malaysia,Singapore, and Pakistan.
In Europe, levofloxacin preparations were approved in theUnited Kingdom in June 1997 and, by March 1998, had beenregistered or launched by Hoechst Marion Roussel in a num-ber of European countries, including Germany, Switzerland,Finland, the Netherlands, and Ireland.
D
I
A
DA
IICH
I PH
AR
MA
CE
UT
ICA
L C
O.,
LTD
.O
UR
MIS
SIO
N
9
Sales Contributionof Cravit and Tarivid
in Fiscal 1997(%)
Cravit and Tarivid
Other products
22.9%
’94 ’95 ’96 ’97 ’98
Net Sales ofCravit and Tarivid
(Million ¥)
Cravit
Tarivid
0
25,000
50,000
75,000
Brought to you by Global Reports

Overseas Developmentas the Key to Winning
in Global Markets
DA
IICH
I PH
AR
MA
CE
UT
ICA
L C
O.,
LTD
.O
UR
MIS
SIO
N
10
Given impending revisions to the NHI system and other government-implemented cost-containment initiatives, the Japanese pharmaceutical market is expected to post onlymodest expansion in the immediate future. Expanding our business outside Japan isthus essential to success in an increasingly competitive environment. During the yearunder review, our efforts to further localize operations and maximize the markets forour new quinolone antibacterials were rewarded with a 33.8% increase in consoli-dated overseas net sales, to ¥39.5 billion.
Overseas Net Salesas a Percentage of
Net SalesFY2006 (projected)
FY1997
30.0%
14.1%
(consolidated)
Brought to you by Global Reports

DA
IICH
I PH
AR
MA
CE
UT
ICA
L C
O.,
LTD
.O
UR
MIS
SIO
N
11
The United States Asia Europe
MarketingClinical DevelopmentBasic Research
The Daiichi Group’s Global Network, Including Cooperating Companies
NORTH AMERICA
Activities in Fiscal 1997
n January 1997, levofloxacin preparations (U.S.trade name: Levaquin) were launched in theUnited States by Ortho-McNeil Pharmaceutical of
the Johnson & Johnson group. Levaquin has enjoyed anexceptionally strong reception, while ofloxacin prepara-tions (U.S. trade name: Floxin) have maintained their marketstrength, owing to the segmentation of the target indicationfor the two products, thus contributing to the sales of Daiichi’snew quinolone bulk as well as licensing income.
As noted previously, DPC, a Daiichi U.S. subsidiary, hasreceived marketing approval for ofloxacin otic solution (U.S.trade name: Floxin Otic) from the U.S. FDA and starteddirect marketing of the product in February 1998 through itsown U.S. sales force of 46 medical representatives (MRs),copromoted with the Johnson & Johnson group.
Strategy
PC is increasing its sales force in anticipation ofgrowing sales in North America. The first groupof new MRs was hired in fiscal 1996, in time for
the copromotion of irinotecan (US trade name: Camptosar, acamptothecin derivative), a cancer therapeutic agent mar-keted by Pharmacia & Upjohn. DPC’s own sales force will bebolstered with additional MRs hired in advance of theexpected U.S. launches of the previously mentioned fourflagship drugs, DU-6859a and DX-8951f in fiscal 2003 andDX-9065a and DM-9384 in fiscal 2004. Daiichi’s goal is toattain consolidated net sales in the United States of ¥54 billionby fiscal 2006 and to firmly establish its presence there as aresearch-oriented global pharmaceutical company.
CHINA AND OTHER PARTS OF ASIA
Activities in Fiscal 1997
s mentioned before, in the term under reviewDaiichi further expanded the markets in Asia for itsnew quinolone agents ofloxacin and levofloxacin,
seeking marketing registration and continuing to conductclinical studies.
In China, Daiichi began clinical trials on DM-9384(nefiracetam), an agent for the treatment of sequelae of cerebrovascular disorders and dementia of Alzheimer’s type.DM-9384 is expected to be launched in China in fiscal 2001.
Strategy
o capitalize on emerging opportunities in China, inMay 1998, Daiichi established DPP, a joint venturewith Beijing General Pharmaceutical. DPP will
bring a new factory on stream in fiscal 2000 and work incooperation with Beijing-based DPB to strengthen theCompany’s marketing capabilities in China. Furthermore,clinical development is progressing smoothly for obtainingthe new drug approvals of levofloxacin preparations as well asDM-9384. Daiichi’s goal is to attain consolidated net sales inChina and other Asian countries besides Japan of ¥26 billionby fiscal 2006.
EUROPE
Activities in Fiscal 1997
he sales of ofloxacin by licensees were on a steadyupward trend in Europe. Levofloxacin preparationswere approved in the United Kingdom in June 1997
and soon after received marketing approvals in other Europ-ean countries, owing to the harmonization of the approvalprocess there. By March 1998, levofloxacin had been regis-tered or launched in Germany, Switzerland, Finland, Ireland,and other European countries by Hoechst Marion Roussel.
Strategy
s in the United States, Daiichi aims to introducefour flagship drugs in Europe in fiscal 2003 and2004, while developing sales capabilities. Daiichi’s
goal is to attain consolidated net sales in Europe of ¥46 billionby fiscal 2006 as well as recognition there as a research-oriented global pharmaceutical company.
A
T
T
A
D
I
Brought to you by Global Reports

Development domain Development state Development code number
In line with its global strategies, Daiichi is building a solid R&D infrastructure to foster the creation of innovative new
drugs by simultaneously bolstering the R&D systems in its four major markets—the United States, China, Europe, and
Japan—creating innovative research themes and taking steps to accelerate the R&D process. We are committed to
making the most efficient use of R&D resources by focusing on strategic R&D themes and wisely investing our valuable
management resources.
RESEARCH AND DEVELOPMENT �D
AIIC
HI P
HA
RM
AC
EU
TIC
AL
CO
., LT
D.
RE
SE
AR
CH
AN
D D
EV
EL
OP
ME
NT
12
Anti-Infective P-III DU-6859a
Cardiovascular Launched (98.4) DW-7950
P-III*
Application (97.11) DR-3305
P-III DV-7314
P-II DS-4824
P-III* DE-3872
P-II* DQ-2466
P-II DA-727
P-I DX-9065a
Diagnostics/ Application (96.3) DU-6807Contrast Media P-II DW-8015
P-II* DP-2155
P-I DZ-2600
Gastrointestinal Application* (91.3) DV-1006
Application (96.3) DQ-2511
P-II DZ-2352a
P-II* DL-8234
Central Nervous System Application (94.7) DM-9384
Cancer Application (90.1) DP-2202
P-I DX-8951f
Others Application(by UCB Japan)
Application (90.7) DT-5062
P-I TRK820/TRK870
*Additional indication
ince fiscal 1996, Daiichi’s over-all management strategy hasrevolved around the WINGS
21 program, designed to strengthen theCompany’s R&D systems and infrastruc-ture and ensure the optimal use of R&Dresources. During the term under review,the Company devoted its attention toshortening the R&D development periodand introduced a “Project Manager System” and a “Clinical PharmacologyGroup” to further strengthen the man-agement system for creating innovative new drugs. Under the Project Manager System, Daiichi has started appointing project leaders responsible for preclinicalresearch as well as domestic and overseasclinical development. These leaderswork in close contact with members ofeach division throughout the entireglobal development process, beginningwith the preclinical trial stages. To date,two new strategic drug candidates ofsignificant global importance, DX-9065aand DX-8951f, have been introducedunder this system. The Clinical Pharma-cology Group was established to helpdetermine drug candidates’ potential atearly clinical development stages (Phase Iand Phase II).
During the year under review, in JapanDaiichi launched a new package formu-lation for Omnipaque nonionic contrastmedium in plastic bottles in August 1997,received approval for an additional indi-cation in the area of chronic hepatitis Cfor FERON, an interferon-� prepara-tion, in October 1997, and submitted anapplication for the marketing approvalof the oral anti-oxidant Harmokisane(DR-3305, ebselen) in November 1997.
SMoreover, in January 1998 Daiichireceived manufacturing approval for the long-acting ACE inhibitor Coversyl(perindopril erbumine), which it launchedin April, and in February 1998 com-menced sales in the United States ofFloxin Otic, ofloxacin otic solution fortreating ear infections. Daiichi has alsobegun developing new vaccines withPasteur Mérieux Connaught (Rhône-Poulenc Group) through the joint venturecompany PM-D VAC Co., Ltd.
aiichi continues to expand itsglobal research network tofurther strengthen its drug
discovery capabilities. In basic research,the Company is promoting variousjoint venture projects with major phar-maceutical manufacturers and formingstrategic alliances with prominent uni-versities. For example, Daiichi is work-ing to better understand the fundamentalaspects of arteriosclerosis throughresearch at the Daiichi Research Center,
D
Domestic R&D Pipeline
Brought to you by Global Reports

Generic name Brand name Drug type or therapeutic category Product origin
sitafloxacin — New quinolone DAIICHI
perindopril erbumine Coversyl Long-acting ACE inhibitor/hypertension SERVIER
Chronic heart disease
ebselen Harmokisane Oral anti-oxidant RHÔNE-POULENC RORER
clopidogrel sulfate — Antiplatelet agent SANOFI
— — Antiarrhythmic agent SANTEN
probucol Sinlestal Prevention of stenosis of coronary arteries HOECHST MARION ROUSSEL
carvedilol Artist Chronic heart failure BOEHRINGER MANNHEIM
— — Angiotensin II antagonist KOTOBUKI
— — Specific factor Xa inhibitor/anticoagulant DAIICHI
iodixanol Visipaque Nonionic X-ray contrast media NYCOMED
ferristene — MRI oral negative contrast media NYCOMED
iohexol Omnipaque Intra-arterial digital subtraction angiography NYCOMED
perflenapent — Ultrasound contrast media SONUS
cetraxate hydrochloride NeuerS, NeuerCap Twice-daily dosage DAIICHI
ecabapide Muralis Chronic gastritis DAIICHI
pantoprazole — Proton pump inhibitor BYK GULDEN
interferon-ß FERON Senal disciform macular degeneration TORAY
nefiracetam TRANSLON Cerebrovascular disorders DAIICHI
— Lemonal Inj. Lactobacillary antitumor agent YAKULT
— — Cancer chemotherapeutic DAIICHI
cetirizine hydrochloride Zyrtec Long-acting, selective H1 receptor UCB Japanantagonist/antiallergic agent
norethisterone/ethinylestradiol Norinyl T28 Low-dose oral contraceptive MONSANTO JAPAN
— — Non-narcotic analgesic/antipruritic agent TORAY
DA
IICH
I PH
AR
MA
CE
UT
ICA
L C
O.,
LTD
.R
ES
EA
RC
H A
ND
DE
VE
LO
PM
EN
T
13
which operates in cooperation with theUniversity of California, San Francisco,and is undertaking cooperative researchwith other academic institutes under theconcept of “Daiichi Academy Partner-ship.” Moreover, Daiichi is collaborat-ing with a number of other R&D-drivenenterprises to develop important newdrugs, including imaging contrast mediawith Nycomed Inc., a new antiplateletaggregation agent with Sanofi Inc., new vaccines with Pasteur MérieuxConnaught, and cancer-related drugswith Toray Industries, Inc.
Development code Drug type or number (Generic name) therapeutic category Development state
DL-8280 New quinolone Launched (United States) (98.2)(ofloxacin otic solution)
DR-3355 New quinolone Launched by HMR (Europe) (98.3) (levofloxacin) Launched by J&J
(United States) (97.1)Application (China)
DU-6859a* New quinolone Phase II (Europe)(sitafloxacin)
DX-9065a* Specific factor Phase I (Europe)Xa inhibitor/anticoagulant
DS-4823 Long-acting Phase II (Europe)(semotiadil) Ca channel blocker
DM-9384* Cerebrovascular Phase II (China)(nefiracetam) disorders/dementia
of Alzheimer’s type
DX-8951f* Cancer Phase I (United States and Europe)chemotherapeutic
DT-5621 Skin ulcers Phase III (United States)(bucladesine ointment)
*Daiichi’s pipeline products of global strategy (also refer to page 7)
Overseas R&D Pipeline
Brought to you by Global Reports

n October 1997, the new facil-ity for solid dosage forms atthe Osaka factory began full-
scale operations and commenced the pro-duction of Cravit (levofloxacin) tablets.This new facility employs the latest auto-mation technologies aimed at the efficientmanufacture of the Company’s mainpharmaceutical products. In July 1997,the plant commenced production ofOmnipaque (iohexol) in plastic bottles.Daiichi introduced the newest blow-fill-seal equipment for this project, anda robotic system is also utilized for thepackaging process. In addition, duringthis term the production of bulk Neuer(cetraxate hydrochloride) was transferredto Fuji Chemical Industries, Ltd.
At the Shizuoka factory, the initialproduction of Coversyl (perindoprilerbumine) tablets started, with approvalhaving been obtained in January 1998.In addition, the first half of the term
saw the completion of a new productionline for Omnipaque syringes. This newline will also facilitate the manufactureof additional products and smaller-sizedpackages as well as provide extra capacityto increase stockpiles and ensure stablesupplies.
At the Akita factory, although thedomestic production of levofloxacin has leveled off, Daiichi has substantiallyincreased its budget for products manu-factured for the licensees in Europe andthe United States. Preparations have alsobegun for ISO 14001 certification, theinternational standard for environmen-tal systems.
A great amount of effort has been madeby the Production Division to reducecosts and develop the most efficient use ofvaluable resources. Measures have beeninitiated to guarantee cost reductions inoperations as well as energy savings.
I
MANUFACTURING �
Daiichi’s manufacturing system is geared toward assuring the high-quality standards that are crucial to the production
of pharmaceutical products, maintaining a stable supply of products, and pursuing optimal efficiency. The Company
operates three domestic factories—Osaka (parenterals and solid dosage forms), Shizuoka (solid dosage forms), and
Akita (drug substances) as well as chemical and pharmaceutical technology research laboratories.
DA
IICH
I PH
AR
MA
CE
UT
ICA
L C
O.,
LTD
.M
AN
UF
AC
TU
RIN
G
14
’94 ’95 ’96 ’97 ’98
Net Property, Plantand Equipment
(Million ¥)
0
20,000
40,000
60,000
80,000
100,000
120,000
Brought to you by Global Reports

n April 1997, revisions toNHI drug reimbursementprices for the second consec-
utive year resulted in an approximate4.4% reduction in these prices. InSeptember 1997, the Japanese govern-ment introduced revisions to NHI reg-ulations that included an increase inout-of-pocket expenses for patients. Inresponse, Daiichi has stepped up itsmarketing activities, which are carriedout through a nationwide network com-prising more than 1,000 MRs at 11 salesbranches located throughout Japan. Toensure that all Daiichi MRs possess thehigh level of specialized expertise neces-sary to market pharmaceutical products,the Company has reinforced its businessand technical education and formalizedits sophisticated training system. InDecember 1997, Japan held its first MR qualification examination, and the
Company used this as an opportunity tostrengthen every area of MR trainingwith the goal of further expanding theunique expertise of its MRs. During theterm, Daiichi initiated activities to pro-vide its MRs with detailed drug informa-tion through the SMART 21 intranet.
Daiichi is expanding its distributionfacilities to improve the efficiency of itsnew distribution system. The new OsakaDistribution Center was completed inDecember 1995, and the new TokyoDistribution Center, now under con-struction, is slated for completion inJanuary 2000. Moreover, with the aimof improving delivery services to cus-tomers, the Company has expanded itsnext-day delivery service. In fiscal 1997,next-day deliveries totaled 66% of alldeliveries, an 8% increase from the previous term.
I
MARKETING AND DISTRIBUTION �
DA
IICH
I PH
AR
MA
CE
UT
ICA
L C
O.,
LTD
.M
AR
KE
TIN
G A
ND
DIS
TR
IBU
TIO
N
15
To ensure Daiichi’s continued growth as it enters the 21st century, the Marketing Department is forging plans to boost
the Company’s marketing strength, aiming to place Daiichi in a higher position in the industry, and has taken such cru-
cial steps as increasing the number of MRs by 50 to realize this goal.
Sales Contributionsof Mainstay Products
in FY1997
FERON (4.2%)Others (45.7%)
Omnipaque (12.8%)Panaldine (14.4%)
Cravit (17.6%)Tarivid (5.3%)
Brought to you by Global Reports

overnmental measures to curtail medical expenditures,a decline in patient and pre-
scription volumes, and an influx of com-petitive new products resulted in salesof the new quinolone antibacterialagents Cravit (levofloxacin) and Tarivid(ofloxacin) falling short of target levels.However, the market shares of theseproducts have increased by our expand-ing the number of hospitals and clinicsin which they are provided throughpromotions during the term.
In the field of cardiovascular dis-orders, the Company continued to pro-vide doctors with useful information toensure the appropriate use of Panaldine(ticlopidine hydrochloride). As a result,sales of Panaldine recorded steadygrowth, despite a decline of the market.The markets for Sunrhythm (pilsicainide
hydrochloride), an antiarrhythmic agent,and Artist (carvedilol) continued toexpand through the provision of medicaland scientific information during theterm. Coversyl (perindopril erbumine),a long-acting ACE inhibitor, gainedmarketing approval in January 1998and was launched in April 1998.
In the field of contrast media, Daiichilaunched a plastic bottle package forOmnipaque in August 1997.
In October 1997, FERON, an inter-feron-� preparation, won approval foran additional indication in the area ofchronic hepatitis C, thus expanding itsuses.
G
REVIEW OF OPERATIONS �D
AIIC
HI P
HA
RM
AC
EU
TIC
AL
CO
., LT
D.
RE
VIE
W O
F O
PE
RA
TIO
NS
16
Sales of Panaldine, an antiplatelet aggregation agent; Omniscan, an MRI contrast
medium; and Artist, an agent to control hypertension and angina pectoris,
grew in fiscal 1997 while those of Cravit, a new quinolone antibacterial agent,
and Omnipaque, a nonionic contrast medium, fell due to a decline of the total
market as well as new competitive products in the market. As a result, sales
of prescription drugs fell 2.3%, to ¥210.6 billion.
Prescription Drugs
Coversyl(perindopril erbumine)
Pantosin (pantethine) Transamin(tranexamic acid)
Miltax(ketoprofen transdermal)
Omnipaque (iohexol)
Panaldine(ticlopidine hydrochloride)
Cravit (levofloxacin) Tarivid (ofloxacin)
FERON (interferon-�)
Neuer(cetraxate hydrochloride)
Brought to you by Global Reports
DA
IICH
I PH
AR
MA
CE
UT
ICA
L C
O.,
LTD
.R
EV
IEW
OF
OP
ER
AT
ION
S
17
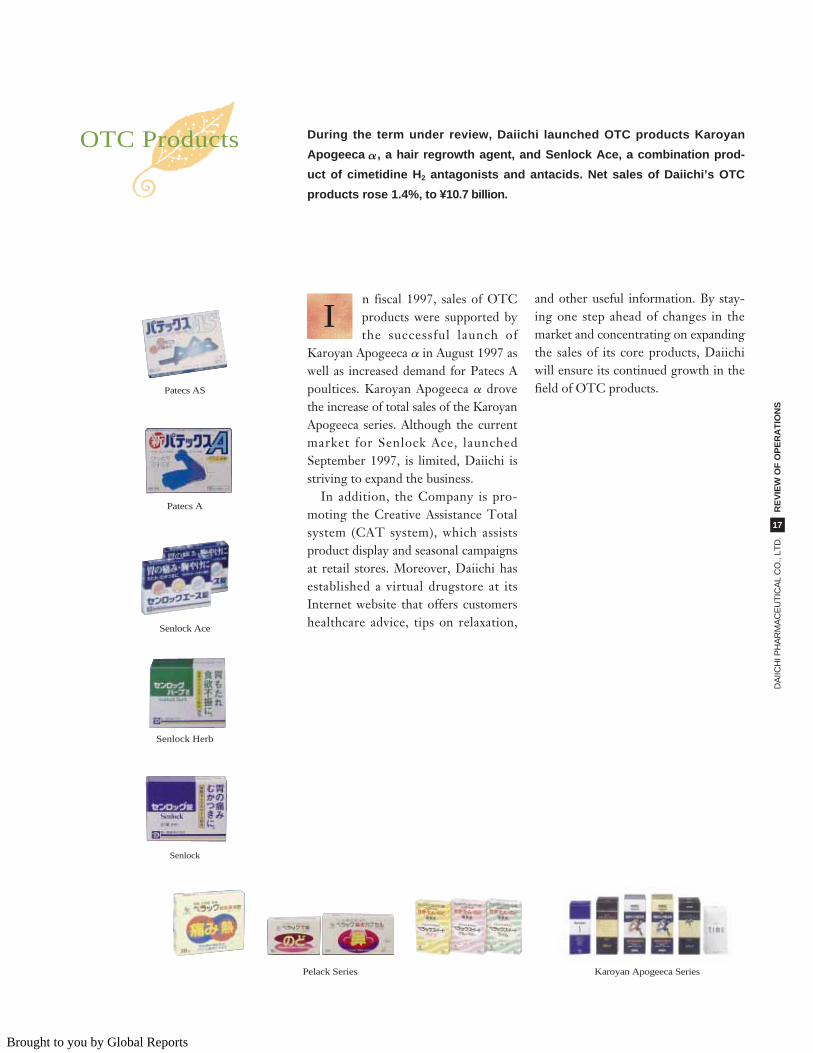
During the term under review, Daiichi launched OTC products Karoyan
Apogeeca , a hair regrowth agent, and Senlock Ace, a combination prod-
uct of cimetidine H2 antagonists and antacids. Net sales of Daiichi’s OTC
products rose 1.4%, to ¥10.7 billion.
n fiscal 1997, sales of OTCproducts were supported bythe successful launch of
Karoyan Apogeeca � in August 1997 aswell as increased demand for Patecs Apoultices. Karoyan Apogeeca � drovethe increase of total sales of the KaroyanApogeeca series. Although the currentmarket for Senlock Ace, launchedSeptember 1997, is limited, Daiichi isstriving to expand the business.
In addition, the Company is pro-moting the Creative Assistance Totalsystem (CAT system), which assistsproduct display and seasonal campaignsat retail stores. Moreover, Daiichi hasestablished a virtual drugstore at itsInternet website that offers customershealthcare advice, tips on relaxation,
and other useful information. By stay-ing one step ahead of changes in themarket and concentrating on expandingthe sales of its core products, Daiichiwill ensure its continued growth in thefield of OTC products.
I
OTC Products
Patecs AS
Senlock
Senlock Ace
Patecs A
Senlock Herb
Karoyan Apogeeca SeriesPelack Series
Brought to you by Global Reports

Animal Health Products
nimal health product salescontracted 7.3% during theterm under review, to ¥4.2
billion. Daiichi worked to increase theprofitability of its domestic animalhealth product business by focusing onsales of high-margin products, loweringcosts across the board, and launchinginnovative products into the market-place. Sales failed to meet the Com-pany’s target level owing to poor salesperformances of the Company’s existingproduct lineup, although the introduc-tions of such new products as anti-bacterial agents Novit and Antivit and ahormonal remedy Boncirc started con-tributing to the sales.
During the term, Daiichi entered themarket for pet animal health and isscheduled to begin full-scale operationsfrom fiscal 1998.
Overseas, the adverse effects of cur-rency crises in Southeast Asia causedexport sales of such products as the antibacterial agent Ektecin and theantiprotozoal agent Daimeton to drop.
Fine Chemicals & Others
espite a drop in sales of bulkvitamins in the domestic mar-ket due to harsh price compe-
tition, a substantial increase in demandfor bulk new quinolone antibacterialagents overseas and a rise in licensingincome helped sales to expand 21.2%,to ¥55.3 billion.
Fiscal 1997 was a difficult year for finechemicals in Japan. Key factors stiflingdemand included lackluster consumerspending, governmental measures aimedat curtailing the cost of medical care,and a fall in vitamin C prices.
On the other hand, overseas sales con-tributed greatly to overall income mainlyon the back of strong sales of levoflox-acin bulk to licensees, since its prepara-tions continued to record brisk sales inthe United States and were launched in European markets during the termunder review. Overseas sales of othermain bulk products, including ofloxacinand d-calcium pantothenate, increasedor remained strong.
DA
DA
IICH
I PH
AR
MA
CE
UT
ICA
L C
O.,
LTD
.R
EV
IEW
OF
OP
ER
AT
ION
S
18
Animal HealthProducts and FineChemicals & Others
Vasolarmin Injection(tranexamic acid)
AR-C Vaccine“Kitasato”
Hpn Vaccine“Kitasato”
Erythromycin Powder 10%“DAIICHI” for fish
Oxaldin Liquid(ofloxacin)
Panacelan-Hi(dinoprost)
Daimeton(sulfamono-methoxine)
Ektecin(sulfamonomethoxine
and ormetoprim)
Brought to you by Global Reports

n line with its corporate slo-gan, “Enriching the Qualityof Life,” Daiichi is engaged
in community activities that focus onthree principal areas: corporate commu-nications, social contributions, and cul-tural and sporting activities. One waythe Company contributes to the welfareof society is through its support ofregional sumo tours. Daiichi is now aspecial corporate sponsor of regionaltours held by the Japan Sumo Associa-tion and provides tickets and employeeassistance to enable senior citizens toenjoy the action.
Daiichi has started to provide the pub-lic lecture series “Enriching the Qualityof Life—Health Forum” and continuedto support the famed Shiki TheatricalCompany and the Mito Chamber Orches-tra as well as other mécénat activities of a wide array. This is the fourth yearsince the 80th anniversary of its found-ing that the Company has supportedthe Mito Chamber Orchestra, which is
composed of some of the world’s great-est musicians led by renowned maestroSeiji Ozawa. Daiichi also supported theorchestra during its June 1998 perfor-mance in Europe.
In other activities, Daiichi holds sci-ence education classes at its factories forlocal children with the goal of motivatingyoung people to take a deeper interestin technical studies.
I
COMMUNITY ACTIVITIES �
DA
IICH
I PH
AR
MA
CE
UT
ICA
L C
O.,
LTD
.C
OM
MU
NIT
Y A
CT
IVIT
IES
19
A match during a national tour of top-ranking sumo wrestlers
A performance of Phantom of the Operaby the Shiki Theatrical Company
Photo courtesy of Shiki Theatrical Company
A performance in Vienna by the Mito Chamber Orchestra
Photo courtesy of Michiharu Okubo
Brought to you by Global Reports
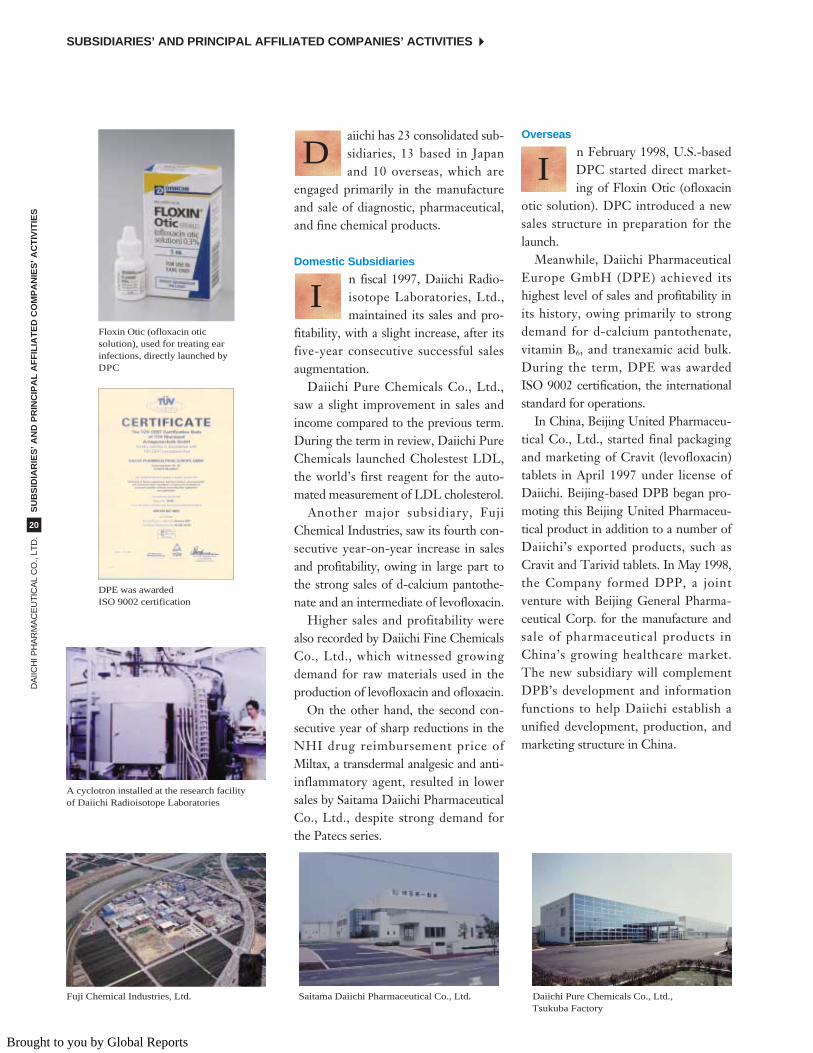
aiichi has 23 consolidated sub-sidiaries, 13 based in Japanand 10 overseas, which are
engaged primarily in the manufactureand sale of diagnostic, pharmaceutical,and fine chemical products.
Domestic Subsidiaries
n fiscal 1997, Daiichi Radio-isotope Laboratories, Ltd.,maintained its sales and pro-
fitability, with a slight increase, after itsfive-year consecutive successful salesaugmentation.
Daiichi Pure Chemicals Co., Ltd.,saw a slight improvement in sales andincome compared to the previous term.During the term in review, Daiichi PureChemicals launched Cholestest LDL,the world’s first reagent for the auto-mated measurement of LDL cholesterol.
Another major subsidiary, FujiChemical Industries, saw its fourth con-secutive year-on-year increase in salesand profitability, owing in large part tothe strong sales of d-calcium pantothe-nate and an intermediate of levofloxacin.
Higher sales and profitability werealso recorded by Daiichi Fine ChemicalsCo., Ltd., which witnessed growingdemand for raw materials used in theproduction of levofloxacin and ofloxacin.
On the other hand, the second con-secutive year of sharp reductions in theNHI drug reimbursement price ofMiltax, a transdermal analgesic and anti-inflammatory agent, resulted in lowersales by Saitama Daiichi PharmaceuticalCo., Ltd., despite strong demand forthe Patecs series.
Overseas
n February 1998, U.S.-basedDPC started direct market-ing of Floxin Otic (ofloxacin
otic solution). DPC introduced a newsales structure in preparation for thelaunch.
Meanwhile, Daiichi PharmaceuticalEurope GmbH (DPE) achieved itshighest level of sales and profitability inits history, owing primarily to strongdemand for d-calcium pantothenate, vitamin B6, and tranexamic acid bulk.During the term, DPE was awardedISO 9002 certification, the internationalstandard for operations.
In China, Beijing United Pharmaceu-tical Co., Ltd., started final packagingand marketing of Cravit (levofloxacin)tablets in April 1997 under license ofDaiichi. Beijing-based DPB began pro-moting this Beijing United Pharmaceu-tical product in addition to a number ofDaiichi’s exported products, such asCravit and Tarivid tablets. In May 1998,the Company formed DPP, a joint venture with Beijing General Pharma-ceutical Corp. for the manufacture andsale of pharmaceutical products inChina’s growing healthcare market.The new subsidiary will complementDPB’s development and informationfunctions to help Daiichi establish aunified development, production, andmarketing structure in China.
I
I
D
SUBSIDIARIES’ AND PRINCIPAL AFFILIATED COMPANIES’ ACTIVITIES �D
AIIC
HI P
HA
RM
AC
EU
TIC
AL
CO
., LT
D.
SU
BS
IDIA
RIE
S’ A
ND
PR
INC
IPA
L A
FF
ILIA
TE
D C
OM
PA
NIE
S’ A
CT
IVIT
IES
20
Floxin Otic (ofloxacin otic solution), used for treating ear infections, directly launched by DPC
DPE was awarded ISO 9002 certification
Fuji Chemical Industries, Ltd. Saitama Daiichi Pharmaceutical Co., Ltd. Daiichi Pure Chemicals Co., Ltd., Tsukuba Factory
A cyclotron installed at the research facility of Daiichi Radioisotope Laboratories
Brought to you by Global Reports

Equity owned by Paid-in capital parent company
Name Established (thousands) (%) Principal activities
Consolidated Subsidiaries
Daiichi Radioisotope Laboratories, Ltd. 1968 ¥1,400,000 83 Manufacture and sale of radiopharmaceuticals and radioisotope products
Daiichi Pure Chemicals Co., Ltd. 1947 ¥1,275,250 96 Manufacture and sale of pharmaceuticals and diagnostic reagents
Fuji Chemical Industries, Ltd. 1951 ¥900,000 59 Manufacture and sale of pharmaceuticals and chemicals
Saitama Daiichi Pharmaceutical Co., Ltd. 1963 ¥1,005,500 79 Manufacture and sale of pharmaceuticals
Daiichi Fine Chemicals Co., Ltd. 1978 ¥60,000 100 Sale of chemicals
Tokyo Iyaku Shiki Co., Ltd. 1943 ¥163,500 65 Manufacture of packaging materials for pharmaceuticals
Nishimura Shiki Co., Ltd. 1952 ¥30,000 61 Manufacture of packaging materials for pharmaceuticals
D.P.C. Medical Co., Ltd. 1995 ¥50,000 100 Production and planning of promotional sales materials
Daiichi Jisho Co., Ltd. 1956 ¥50,000 100 Real estate and travel agency services
Daiichi Butsuryu Co., Ltd. 1965 ¥50,000 100 Transport and warehousing of the Company’s products
Daiichi Technos Co., Ltd. 1992 ¥10,000 100 Technical services
Kanto Daiichi Service Co., Ltd. 1979 ¥10,000 100 Security and janitorial services for the Company
Kansai Daiichi Service Co., Ltd. 1978 ¥10,000 100 Security and janitorial services for the Company
Korea Daiichi Pharmaceutical Co., Ltd. (Korea) 1990 W3,000,000 70 Manufacture and sale of pharmaceuticals
Daiichi Pharmaceutical Taiwan Ltd. (Taiwan) 1963 NT$60,000 75 Manufacture of pharmaceuticals
Ichiyaku Enterprise Co., Ltd. (Taiwan) 1985 NT$40,000 100 Sale of pharmaceuticals
Daiichi Pharmaceutical Corporation (U.S.A.) 1982 US$14,100** 100 Clinical development and sale of pharmaceuticals
Daiichi Fine Chemicals, Inc.* (U.S.A.) 1995 US$1,000** 100 Export, import, sale, and intermediary services for fine chemicals and related products
Daiichi Pharmaceutical (China) Co., Ltd. (China) 1995 US$5,000 100 Clinical development of pharmaceuticals
Daiichi Pharmaceutical Europe GmbH (Germany) 1989 DM1,000 100 Sale of pharmaceuticals and chemicals
Daiichi Pharmaceuticals UK Ltd. (U.K.) 1993 £400 100 Clinical development of pharmaceuticals
Daiichi Pharmaceutical Asia Ltd. (Hong Kong) 1988 HK$3,000 100 Sale of pharmaceuticals and chemicals
Laboratoires Daiichi Sanofi (France) 1989 FFr1,000 51 Clinical development of antiplatelet-aggregation agents
Affiliated Companies
Sanofi Daiichi Co., Ltd. 1989 ¥100,000 49 Clinical development of antiplatelet-aggregation agents
Daiichi Pharmaceutical (Thailand) Ltd. (Thailand) 1994 B8,000 33 Sale of pharmaceuticals and chemicals
** Daiichi Fine Chemicals, Inc., is a wholly owned subsidiary of Daiichi Pharmaceutical Corporation.** Additional paid-in capital is included in the paid-in capital of Daiichi Pharmaceutical Corporation and Daiichi Fine Chemicals, Inc.
SUBSIDIARIES AND PRINCIPAL AFFILIATED COMPANIES
DA
IICH
I PH
AR
MA
CE
UT
ICA
L C
O.,
LTD
.S
UB
SID
IAR
IES
’ AN
D P
RIN
CIP
AL
AF
FIL
IAT
ED
CO
MP
AN
IES
’ AC
TIV
ITIE
S
21
Brought to you by Global Reports

BOARD OF DIRECTORS �D
AIIC
HI P
HA
RM
AC
EU
TIC
AL
CO
., LT
D.
BO
AR
D O
F D
IRE
CT
OR
S
22
Tadashi SuzukiPresident and Chief Executive Officer
Kaname Suwa, Ph.D.
Senior Managing Director
Masayuki Kuroda
Managing Director
Kiyoshi Morita
Senior Managing Director
Hiroyuki Nagasako
Managing DirectorTakeyoshi Ubukata
Managing DirectorMitsuhiko Sentoku
Managing DirectorYuzo Yamada
Managing Director
Tadashi SuzukiPresident and Chief Executive Officer
Kaname Suwa, Ph.D.Senior Managing Director
Kiyoshi MoritaSenior Managing Director
Yuzo YamadaManaging Director
Masayuki KurodaManaging Director
Hiroyuki NagasakoManaging Director
Takeyoshi UbukataManaging Director
Mitsuhiko SentokuManaging Director
Hiroshi YamamotoBoard Director
Tadao Suzuki, Ph.D.Board Director
Yasumasa ArakiBoard Director
Kenichi MizutaniBoard Director
Hiroki Kuroda, Ph.D.Board Director
Haruo Tachizawa, Ph.D.Board Director
Atsuo Inoue, Ph.D.Board Director
Yutaka HirataBoard Director
Yasuhisa IwasakiBoard Director
Hidetoshi ImaizumiBoard Director
Shin-Ichiro Ashida, Ph.D.Board Director
Tadayuki OtsukaSenior Corporate Auditor
Atsuhiro IsetaniCorporate Auditor
Kimiaki OhtaCorporate Auditor
Kazusuke NakagawaCorporate Auditor
Tadashi TakaujiCorporate Auditor
Brought to you by Global Reports

DA
IICH
I PH
AR
MA
CE
UT
ICA
L C
O.,
LTD
.F
INA
NC
IAL
SE
CT
ION
23
Financial Section
CONTENTS �
SIX-YEAR SUMMARY ............................................................................... 24FINANCIAL REVIEW.................................................................................. 25CONSOLIDATED BALANCE SHEETS....................................................... 28CONSOLIDATED STATEMENTS OF INCOME.......................................... 30
CONSOLIDATED STATEMENTS OF SHAREHOLDERS’ EQUITY ............ 31CONSOLIDATED STATEMENTS OF CASH FLOWS................................. 32NOTES TO CONSOLIDATED FINANCIAL STATEMENTS......................... 33REPORT OF INDEPENDENT PUBLIC ACCOUNTANTS ........................... 40
Brought to you by Global Reports

Millions of yen
1998 1997 1996 1995 1994 1993
Operating Results:
Net sales........................................................................... ¥280,806 ¥276,251 ¥261,682 ¥254,690 ¥245,686 ¥239,733
Cost of sales..................................................................... 98,738 96,179 91,694 92,389 93,218 92,740
Selling, general and administrative expenses .................. 91,782 86,662 83,230 80,561 76,585 73,036
Research and development expenses............................. 36,043 34,578 34,347 31,847 31,008 29,356
Interest expense............................................................... 1,476 1,938 2,150 2,454 2,477 2,250
Income before income taxes............................................ 51,653 57,848 52,613 51,686 47,547 48,122
Net income ....................................................................... 21,905 25,173 21,452 20,119 18,632 17,599
Net income per share of common stock (yen) ................. 78.15 92.49 78.88 73.99 68.52 64.72
Cash dividends paid......................................................... 4,738 4,215 4,215 3,807 3,535 3,264
Financial Position:
Total current assets.......................................................... 358,318 350,184 342,717 337,796 313,202 257,718
Net property, plant and equipment .................................. 102,821 108,227 98,638 93,998 90,363 88,135
Total assets ...................................................................... 489,516 488,628 470,945 461,156 430,858 370,154
Total current liabilities ...................................................... 113,925 105,961 88,167 93,120 83,499 83,541
Total long-term liabilities .................................................. 58,140 89,091 118,852 121,449 120,586 75,266
Total shareholders’ equity ................................................ 312,640 289,079 259,877 242,726 223,878 208,921
Financial Ratios (%):
Pre-tax profit margin(Income before income taxes to net sales) .................... 18.4 20.9 20.1 20.3 19.4 20.1
Net profit margin (Net income to net sales)...................... 7.8 9.1 8.2 7.9 7.6 7.3
Return on shareholders’ equity(Net income to average shareholders’ equity)................ 7.3 9.2 8.5 8.6 8.6 8.7
Shareholders’ equity to total assets................................. 63.9 59.2 55.2 52.6 52.0 56.4
Research and development expensesas a percentage of net sales .......................................... 12.8 12.5 13.1 12.5 12.6 12.2
Number of Employees........................................................ 6,794 6,650 6,557 6,434* 5,720 5,614
* Due to the consolidation of 15 subsidiaries, the number of employees increased 673.
SIX-YEAR SUMMARY �Daiichi Pharmaceutical Co., Ltd. and SubsidiariesYears ended March 31
DA
IICH
I PH
AR
MA
CE
UT
ICA
L C
O.,
LTD
.S
IX-Y
EA
R S
UM
MA
RY
24
Brought to you by Global Reports

Overview
Fiscal 1997, ended March 31, 1998,began with revisions to NHI drug reimbursement prices for the secondconsecutive year, which have resulted in an approximate 4.4% reduction inthese prices industrywide. In September1997, the Japanese government intro-duced revisions to NHI regulations that increased out-of-pocket expensesfor patients and in April 1998 reducedNHI prices for the third consecutive year,this time averaging 9.7%. Such cost-containment policies hurt the Japanesepharmaceutical industry in terms ofboth prices and shipment volumes andled to negative growth for the industryas a whole.
Amid these circumstances, Daiichienergetically worked to carry out medicaland scientific information disseminationprograms and strengthen marketing bothin Japan and overseas. As a result, theCompany was able to increase its con-solidated net sales 1.6%, or ¥4.6 billion,
to ¥280.8 billion (US$2,127.3 million).The Company has thus succeeded in augmenting its net sales for 15 consecu-tive fiscal years.
Net income fell 13.0%, or ¥3.3 billion,to ¥21.9 billion (US$165.9 million),reflecting the adverse effect on earningsof the reductions in NHI drug reim-bursement prices, an increase in R&Dexpenses, and aggressive investment ininformation technology infrastructureas well as the recognition of a ¥2.6 billionextraordinary gain on the sale of land inthe previous fiscal year. In the interestof ensuring a stable return to its share-holders, the Company has decided toincrease its ordinary cash dividendsapplicable to fiscal 1997 by ¥2.00, to¥18.00 (US$0.14) per share.
Net Sales
During the year under review, strongsales gains by Panaldine, an antiplateletaggregation agent, and Omniscan, anMRI contrast medium, as well as a rise
in sales of bulk antibacterial agents andhigher royalty income from overseasmarkets helped boost Daiichi’s pharma-ceutical business sales, which account for 95% of its total net sales. Sales inthe pharmaceutical business increased1.2%, or ¥3.2 billion, to ¥266.3 billion(US$2,017.5 million). Sales in otherbusiness areas grew 9.9%, or ¥1.3 billion,to ¥14.5 billion (US$109.9 million),reflecting a rise in sales of chemicalproducts.
Costs and Expenses
Cost of sales increased 2.7%, or ¥2.6 bil-lion, from the previous term, to ¥98.7 bil-lion (US$748.0 million). While Daiichistrove to reduce manufacturing costs, areduction in NHI drug reimbursementprices led to a fall in sales prices, and, as a result, the cost of sales ratio rose a slight 0.4 percentage point, from34.8% to 35.2%.
Selling, general and administra-tive (SG&A) expenses grew 5.9%, or
FINANCIAL REVIEW �
DA
IICH
I PH
AR
MA
CE
UT
ICA
L C
O.,
LTD
.F
INA
NC
IAL
RE
VIE
W
25
’94 ’95 ’96 ’97 ’98
Net Income
Operating Income
Central Nervous System Agents 1.4%
Cardiovascular andRespiratory Agents 21.0%
Gastrointestinal Agents 2.7%
Dermatologicals 6.0%
Vitamin Preparations 5.0%
Radiological Agents 6.3%
Chemotherapeutics, Antibiotics, and Biological Preparations 29.5%
Diagnostic Agents 16.9%
Veterinary Products 1.5%
Others 9.7%
’94 ’95 ’96 ’97 ’98
Prescription Drugs
OTC Drugs
Animal Health Products
Fine Chemicals and Other Products
Operating Incomeand Net Income
(Million ¥)
0
10,000
20,000
30,000
40,000
50,000
60,000
Sales Composition byProduct Category
(%)
Net Sales(Million ¥)
0
50,000
100,000
150,000
200,000
250,000
300,000
Brought to you by Global Reports

¥5.1 billion, to ¥91.8 billion (US$695.3million). As a percentage of net sales,SG&A expenses increased 1.3 percentagepoints, from 31.4% to 32.7%, due toincreased personnel expenses and greaterexpenditure in sales promotions.
R&D expenses rose 4.2%, or ¥1.5 bil-lion, to ¥36.0 billion (US$273.1 million),and R&D expenses as a share of net salesclimbed 0.3 percentage point, to 12.8%.
Net Income
As a result of the aforementioned factors,operating income fell 7.8%, or ¥4.6 bil-lion, to ¥54.2 billion (US$410.9 million).The ratio of operating income to netsales declined 2.0 percentage points,from 21.3% to 19.3%.
In the previous term, the Companyearned ¥2.6 billion on the sale of land.During fiscal 1997, however, a reductionin the average balances of funds undermanagement due to the redemption ofconvertible bonds had a negative impact
on interest and dividend income, and a loss on revaluation of securities wasrecorded due to a drop in stock prices.As a result, net other income (expense)increased ¥1.6 billion, to an expense of¥2.6 billion (US$19.6 million).
Accordingly, income before incometaxes contracted 10.7%, or ¥6.2 billion,to ¥51.7 billion (US$391.3 million), andnet income decreased 13.0%, or ¥3.3 bil-lion, to ¥21.9 billion (US$165.9 million).Net income per share decreased ¥14.34,to ¥78.15 (US$0.59).
Financial Position
At March 31, 1998, total assets amountedto ¥489.5 billion (US$3,708.5 million)and were materially unchanged from the previous fiscal year-end. Total cur-rent assets grew ¥8.1 billion, to ¥358.3billion (US$2,714.5 million), partly dueto an increase in inventories associatedwith the refurbishment of manufactur-ing lines.
During fiscal 1997, Daiichi invested¥14.4 billion (US$108.7 million) in fixed assets, but net property, plant and equipment fell ¥5.4 billion, to¥102.8 billion (US$778.9 million), dueto the advance in accumulated deprecia-tion. New investment was centered onthe construction of manufacturing linesfor Omnipaque and equipment for usein R&D activities.
Total liabilities at March 31, 1998,amounted to ¥176.9 billion (US$1,340.0million), down 11.4%, or ¥22.7 billion,from the previous fiscal year-end. Short-and long-term interest-bearing debtcontracted ¥15.2 billion, to ¥76.8 billion(US$582.2 million), as a result of factorsincluding the redemption of bonds withdetachable warrants. Other liabilitiesdecreased ¥7.5 billion and includednotes and accounts payable, incometaxes payable, accrued expenses, andother operating liabilities.
DA
IICH
I PH
AR
MA
CE
UT
ICA
L C
O.,
LTD
.F
INA
NC
IAL
RE
VIE
W
26
’94 ’95 ’96 ’97 ’98 ’94 ’95 ’96 ’97 ’98
Total Assets
Total Shareholders’ Equity
Interest-Bearing Debt
Other Liabilities
Equity Ratio (right scale)
’94 ’95 ’96 ’97 ’98
Overseas Net Sales
Overseas Net Sales as a Percentage of Net Sales (right scale)
0
5,000
10,000
15,000
20,000
25,000
Composition ofTotal Capital Employed
(Million ¥) (%)
Capital Expenditures(Million ¥)
Overseas Net Sales(Million ¥) (%)
0
10,000
20,000
30,000
40,000
0
100,000
200,000
300,000
400,000
500,000
0
5
10
15
20
0
20
40
60
80
100
Brought to you by Global Reports

Primarily as a result of growth inretained earnings and a ¥6.6 billionincrease due to the exercise of warrants,total shareholders’ equity rose ¥23.6 bil-lion, to ¥312.6 billion (US$2,368.5 mil-lion), at fiscal year-end.
Cash Flows
Net cash provided by operating activitiestotaled ¥32.1 billion (US$243.0 million),¥12.6 billion less than in fiscal 1996.This reflects net income of ¥21.9 billion(US$165.9 million) as well as ¥15.3 bil-lion (US$116.1 million) in depreciationand loss on revaluation of securities andother noncash adjustments to net incomeamounting to ¥41.5 billion. Changes inoperating assets and liabilities and otheritems accounted for ¥9.4 billion of netcash outflow.
Net cash used in investing activitiesamounted to ¥1.4 billion (US$10.3 mil-lion), due in large part to the Company’sundertaking of considerably less capital
expenditures than in the previous fiscalyear and divestment of ¥20.7 billion inmarketable securities.
Net cash used in financing activitiestotaled ¥13.4 billion (US$101.2 million)for the period, up ¥1.9 billion from theprevious fiscal year. The Company carriedout no major fund-raising activities duringthe period, and internal reserves wereused to redeem bonds of ¥15.2 billion(US$115.5 million) and pay ¥4.7 billion(US$35.9 million) in cash dividends.
As a result, cash and cash equivalentsat March 31, 1998, totaled ¥94.8 bil-lion (US$718.1 million), a ¥17.3 billionincrease from the previous fiscal year-end. As the balance of cash and cashequivalents at the end of the year wasequivalent to 4.1 times the level of average monthly sales, the Company is confident that it has maintained a sufficiently high level of liquidity.
Key Financial Indicators
Reflecting the business activities described previously, the Company has maintained an exceptionally strongfinancial position. Working capital, at ¥244.4 billion (US$1,851.5 million),was level with the previous term, andthe current ratio was sustained at 3.15, a high level compared with other com-panies in the pharmaceutical industry.
As a result of the slight increase inboth sales and total assets, asset turn-over, at 0.57, was relatively unchangedfrom the previous fiscal year, and thereturn on assets ratio was 4.5%, down0.7 percentage point from fiscal 1996.The return on average equity ratio fellfrom 9.2% to 7.3%.
The shareholders’ equity ratioincreased 4.7 percentage points, from59.2% to 63.9%, primarily reflecting a decline in liabilities and a rise inretained earnings.
DA
IICH
I PH
AR
MA
CE
UT
ICA
L C
O.,
LTD
.F
INA
NC
IAL
RE
VIE
W
27
’94 ’95 ’96 ’97 ’98 ’94 ’95 ’96 ’97 ’98
Return on Equity
Return on Assets
Net Cash Provided by (Used In) Investing Activities
Net Cash Provided by (Used In) Financing Activities
Net Cash Provided by Operating Activities
Net Change in Cash and Cash Equivalents
Effect of Increase in Consolidated Subsidiaries
’94 ’95 ’96 ’97 ’98
Cash Flows(Million ¥)
Return on Assets and Return on Equity
(%)
Interest Coverage(Times)
0
2
4
6
8
10
0
20,000
40,000
60,000
80,000
100,000
0
10
20
30
40
50
Brought to you by Global Reports

DA
IICH
I PH
AR
MA
CE
UT
ICA
L C
O.,
LTD
.C
ON
SO
LID
AT
ED
BA
LA
NC
E S
HE
ET
S
Thousands ofMillions of yen U.S. dollars (Note 1)
ASSETS 1998 1997 1998
Current Assets:
Cash and time deposits (Note 3)........................................................................................ ¥102,598 ¥ 75,574 $0,777,258
Marketable securities (Note 4)............................................................................................ 91,303 116,387 691,689
Notes and accounts receivable,
net of allowance of ¥955 ($7,235) in 1998 and ¥999 in 1997 ........................................ 87,753 89,589 664,795
Inventories (Note 6) ............................................................................................................ 43,405 35,748 328,826
Other current assets........................................................................................................... 33,259 32,886 251,963
Total current assets.................................................................................................... 358,318 350,184 2,714,531
Investments and Long-Term Loans Receivable:
Investment securities (Note 4)............................................................................................ 15,403 16,682 116,689
Long-term loans receivable................................................................................................ 5,744 5,970 43,515
............................................................................................................................................... 21,147 22,652 160,204
Property, Plant and Equipment (Note 8):
Land ................................................................................................................................... 13,040 13,057 98,788
Buildings............................................................................................................................. 115,036 112,182 871,485
Machinery and equipment.................................................................................................. 116,994 111,761 886,318
Construction in progress.................................................................................................... 2,046 3,779 15,500
............................................................................................................................................... 247,116 240,779 1,872,091
Accumulated depreciation ................................................................................................. (144,295) (132,552) (1,093,144)
Net property, plant and equipment ............................................................................ 102,821 108,227 778,947
Other Assets ......................................................................................................................... 7,217 7,558 54,675
Foreign Currency Translation Adjustment......................................................................... 13 7 98
............................................................................................................................................... ¥489,516 ¥488,628 $3,708,455
See accompanying notes.
CONSOLIDATED BALANCE SHEETS �Daiichi Pharmaceutical Co., Ltd. and SubsidiariesMarch 31, 1998 and 1997
28
Brought to you by Global Reports

Thousands ofMillions of yen U.S. dollars (Note 1)
LIABILITIES AND SHAREHOLDERS’ EQUITY 1998 1997 1998
Current Liabilities:
Bank loans.......................................................................................................................... ¥ 12,475 ¥ 10,924 $0,094,508
Long-term debt due within one year (Note 8) .................................................................... 30,627 17,104 232,023
Notes and accounts payable ............................................................................................. 31,559 35,987 239,083
Income taxes payable (Note 9)........................................................................................... 13,272 16,561 100,545
Consumption tax payable .................................................................................................. 2,708 1,143 20,515
Accrued expenses.............................................................................................................. 19,874 19,198 150,561
Other current liabilities ....................................................................................................... 3,410 5,044 25,834
Total current liabilities ................................................................................................ 113,925 105,961 863,069
Long-Term Debt (Note 8)...................................................................................................... 33,745 64,016 255,644
Retirement Benefits (Note 10).............................................................................................. 23,508 24,135 178,091
Other Long-Term Liabilities ................................................................................................ 887 940 6,720
Minority Interests ................................................................................................................. 4,811 4,497 36,447
Contingent Liabilities (Note 12)
Shareholders’ Equity (Note 11):
Common stock, par value ¥50 per share;
Authorized—800,000,000 shares
Issued—280,452,154 shares in 1998 and
276,722,501 shares in 1997............................................................................. 30,252 26,962 229,182
Additional paid-in capital ................................................................................................... 33,983 30,698 257,446
Legal reserve...................................................................................................................... 5,561 5,068 42,129
Retained earnings .............................................................................................................. 242,847 226,357 1,839,750
............................................................................................................................................... 312,643 289,085 2,368,507
Treasury stock, at cost....................................................................................................... (3) (6) (23)
Total shareholders’ equity.......................................................................................... 312,640 289,079 2,368,484
............................................................................................................................................... ¥489,516 ¥488,628 $3,708,455
DA
IICH
I PH
AR
MA
CE
UT
ICA
L C
O.,
LTD
.C
ON
SO
LID
AT
ED
BA
LA
NC
E S
HE
ET
S
29
Brought to you by Global Reports

DA
IICH
I PH
AR
MA
CE
UT
ICA
L C
O.,
LTD
.C
ON
SO
LID
AT
ED
ST
AT
EM
EN
TS
OF
INC
OM
E
30
Thousands ofMillions of yen U.S. dollars (Note 1)
1998 1997 1996 1998
Net Sales (Note 13).......................................................................................... ¥280,806 ¥276,251 ¥261,682 $2,127,318
Costs and Expenses (Note 13):
Cost of sales................................................................................................. 98,738 96,179 91,694 748,015
Selling, general and administrative............................................................... 91,782 86,662 83,230 695,318
Research and development.......................................................................... 36,043 34,578 34,347 273,053
.......................................................................................................................... 226,563 217,419 209,271 1,716,386
Operating Income (Note 13) ........................................................................... 54,243 58,832 52,411 410,932
Other Income (Expense):
Interest and dividend income ....................................................................... 2,736 2,918 3,781 20,727
Interest expense ........................................................................................... (1,476) (1,938) (2,150) (11,181)
Gain on sale of land...................................................................................... 7 2,576 — 53
Loss on revaluation of securities .................................................................. (3,369) (3,238) (52) (25,523)
Other, net...................................................................................................... (488) (1,302) (1,377) (3,696)
.......................................................................................................................... (2,590) (984) 202 (19,620)
Income before Income Taxes ........................................................................ 51,653 57,848 52,613 391,312
Income Taxes (Note 9) .................................................................................... 29,364 32,184 30,914 222,455
.......................................................................................................................... 22,289 25,664 21,699 168,857
Minority Interests in Net Income of Consolidated Subsidiaries................. (416) (491) (247) (3,152)
Amortization of Consolidation Difference .................................................... 32 — — 242
Net Income ...................................................................................................... ¥ 21,905 ¥ 25,173 ¥ 21,452 $0,165,947
Yen U.S. dollars (Note 1)
Amounts per Share of Common Stock:Net income ................................................................................................... ¥78.15 ¥92.49 ¥78.88 $0.59Diluted net income........................................................................................ 72.63 84.28 72.41 0.55Cash dividends applicable to the year ......................................................... 18.00 16.00 16.00 0.14
See accompanying notes.
CONSOLIDATED STATEMENTS OF INCOME �Daiichi Pharmaceutical Co., Ltd. and SubsidiariesYears ended March 31, 1998, 1997 and 1996
Brought to you by Global Reports
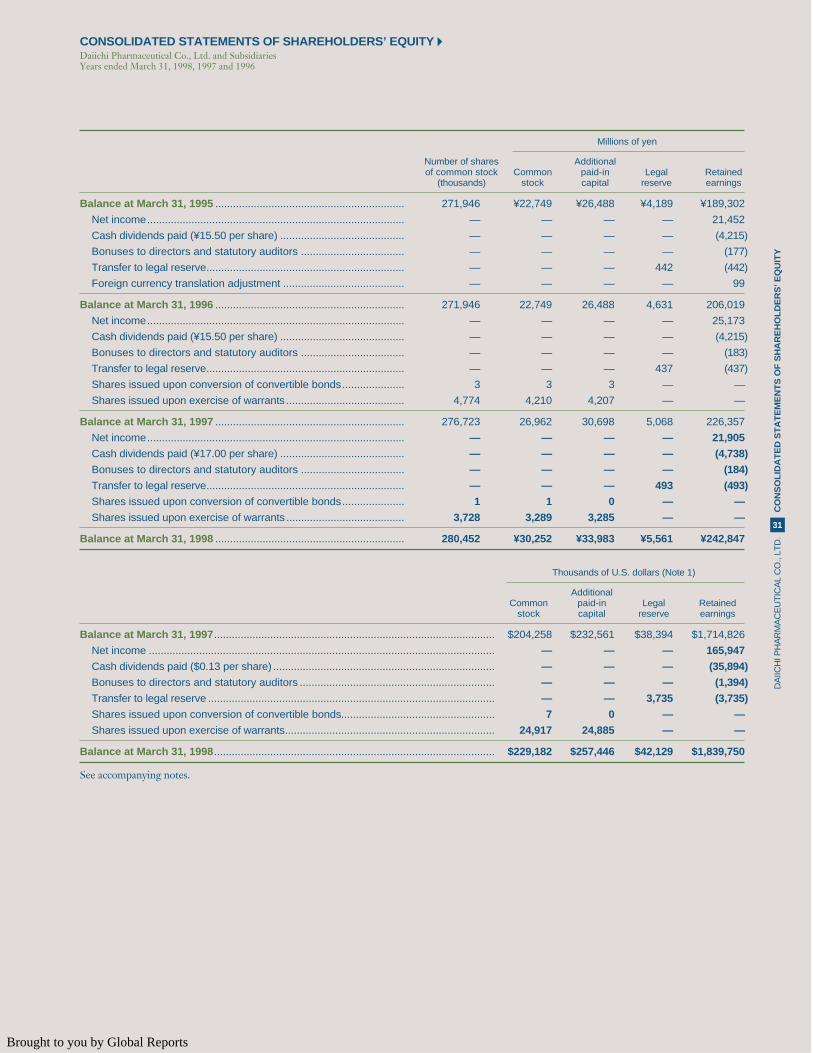
DA
IICH
I PH
AR
MA
CE
UT
ICA
L C
O.,
LTD
.C
ON
SO
LID
AT
ED
ST
AT
EM
EN
TS
OF
SH
AR
EH
OL
DE
RS
’ EQ
UIT
Y
31
Millions of yen
Number of shares Additionalof common stock Common paid-in Legal Retained
(thousands) stock capital reserve earnings
Balance at March 31, 1995 ................................................................ 271,946 ¥22,749 ¥26,488 ¥4,189 ¥189,302
Net income....................................................................................... — — — — 21,452
Cash dividends paid (¥15.50 per share) .......................................... — — — — (4,215)
Bonuses to directors and statutory auditors ................................... — — — — (177)
Transfer to legal reserve................................................................... — — — 442 (442)
Foreign currency translation adjustment ......................................... — — — — 99
Balance at March 31, 1996 ................................................................ 271,946 22,749 26,488 4,631 206,019
Net income....................................................................................... — — — — 25,173
Cash dividends paid (¥15.50 per share) .......................................... — — — — (4,215)
Bonuses to directors and statutory auditors ................................... — — — — (183)
Transfer to legal reserve................................................................... — — — 437 (437)
Shares issued upon conversion of convertible bonds..................... 3 3 3 — —
Shares issued upon exercise of warrants ........................................ 4,774 4,210 4,207 — —
Balance at March 31, 1997 ................................................................ 276,723 26,962 30,698 5,068 226,357
Net income....................................................................................... — — — — 21,905
Cash dividends paid (¥17.00 per share) .......................................... — — — — (4,738)
Bonuses to directors and statutory auditors ................................... — — — — (184)
Transfer to legal reserve................................................................... — — — 493 (493)
Shares issued upon conversion of convertible bonds..................... 1 1 0 — —
Shares issued upon exercise of warrants ........................................ 3,728 3,289 3,285 — —
Balance at March 31, 1998 ................................................................ 280,452 ¥30,252 ¥33,983 ¥5,561 ¥242,847
Thousands of U.S. dollars (Note 1)
AdditionalCommon paid-in Legal Retained
stock capital reserve earnings
Balance at March 31, 1997............................................................................................... $204,258 $232,561 $38,394 $1,714,826
Net income ..................................................................................................................... — — — 165,947
Cash dividends paid ($0.13 per share) ........................................................................... — — — (35,894)
Bonuses to directors and statutory auditors .................................................................. — — — (1,394)
Transfer to legal reserve ................................................................................................. — — 3,735 (3,735)
Shares issued upon conversion of convertible bonds.................................................... 7 0 — —
Shares issued upon exercise of warrants....................................................................... 24,917 24,885 — —
Balance at March 31, 1998............................................................................................... $229,182 $257,446 $42,129 $1,839,750
See accompanying notes.
CONSOLIDATED STATEMENTS OF SHAREHOLDERS’ EQUITY �Daiichi Pharmaceutical Co., Ltd. and SubsidiariesYears ended March 31, 1998, 1997 and 1996
Brought to you by Global Reports

DA
IICH
I PH
AR
MA
CE
UT
ICA
L C
O.,
LTD
.C
ON
SO
LID
AT
ED
ST
AT
EM
EN
TS
OF
CA
SH
FL
OW
S
32
Thousands ofMillions of yen U.S. dollars (Note 1)
1998 1997 1996 1998
Cash Flows from Operating Activities:
Net income....................................................................................................... ¥21,905 ¥25,173 ¥ 21,452 $165,947
Adjustments to reconcile net income to net cash providedby operating activities:
Depreciation................................................................................................. 15,327 13,725 12,761 116,113
Amortization of prepaid expenses ............................................................... 904 1,092 744 6,849
Loss on disposal of property, plant and equipment .................................... 645 684 1,026 4,887
Gain on sale of land ..................................................................................... (7) (2,576) — (53)
Loss on revaluation of securities ................................................................. 3,369 3,238 52 25,523
Provision for (reversal of ) retirement benefits, net ...................................... (620) 32 (221) (4,697)
Change in notes and accounts receivable................................................... 1,880 718 4,953 14,242
Change in notes and accounts payable ...................................................... (2,337) 2,496 (3,518) (17,705)
Change in inventories .................................................................................. (7,657) (2,044) 1,274 (58,008)
Change in income taxes payable................................................................. (3,289) (220) 122 (24,917)
Change in consumption tax payable ........................................................... 1,565 351 (164) 11,856
Other, net ..................................................................................................... 389 2,026 136 2,948
............................................................................................................................. 10,169 19,522 17,165 77,038
Net cash provided by operating activities ............................................... 32,074 44,695 38,617 242,985
Cash Flows from Investing Activities:
Capital expenditures........................................................................................ (14,350) (24,069) (18,119) (108,711)
Proceeds from sales of land ............................................................................ 28 2,716 — 212
Change in time deposits .................................................................................. (5,427) 9,158 (4,651) (41,114)
Change in marketable securities ..................................................................... 20,748 (1,760) (64,700) 157,182
Payments for purchases of mortgage-backed securities................................ — (17,000) — —
Payments for purchases of investment securities........................................... (1,936) (4,258) (978) (14,667)
Payments for long-term loans receivable ........................................................ (571) (578) (996) (4,326)
Other, net ......................................................................................................... 147 (124) 189 1,113
Net cash used in investing activities........................................................ (1,361) (35,915) (89,255) (10,311)
Cash Flows from Financing Activities:
Increase in long-term debt............................................................................... 384 251 1,830 2,909
Repayments of long-term debt........................................................................ (1,889) (1,934) (5,054) (14,311)
Increase in bank loans ..................................................................................... 1,551 50 289 11,751
Redemption of bonds ...................................................................................... (15,242) (14,073) — (115,470)
Exercise of warrants ........................................................................................ 6,574 8,417 — 49,802
Cash dividends paid ........................................................................................ (4,738) (4,215) (4,215) (35,894)
Net cash used in financing activities ....................................................... (13,360) (11,504) (7,150) (101,213)
Effect of Exchange Rate Changes on Cash and Cash Equivalents .............. (64) (103) (207) (484)
Net Change in Cash and Cash Equivalents..................................................... 17,289 (2,827) (57,995) 130,977
Cash and Cash Equivalents at Beginning of Year ......................................... 77,502 80,329 138,324 587,137
Cash and Cash Equivalents at End of Year (Note 3) ...................................... ¥94,791 ¥77,502 ¥ 80,329 $718,114
See accompanying notes.
CONSOLIDATED STATEMENTS OF CASH FLOWS �Daiichi Pharmaceutical Co., Ltd. and SubsidiariesYears ended March 31, 1998, 1997 and 1996
Brought to you by Global Reports
DA
IICH
I PH
AR
MA
CE
UT
ICA
L C
O.,
LTD
.N
OT
ES
TO
CO
NS
OL
IDA
TE
D F
INA
NC
IAL
ST
AT
EM
EN
TS
33
NOTES TO CONSOLIDATED FINANCIAL STATEMENTS �
1 BASIS OF CONSOLIDATED FINANCIAL STATEMENTS
The Company, a Japanese corporation, maintains its records and prepares its consolidated finan-cial statements in Japanese yen in conformity with accounting principles generally accepted inJapan. The accompanying consolidated financial statements have been translated from the con-solidated financial statements that are prepared for Japanese domestic purposes, in accordancewith the provisions of the Securities and Exchange Law of Japan, and filed with the Minister of Finance of Japan.
Certain modifications, including presentation of the consolidated statements of shareholders’equity and cash flows, have been made in the accompanying financial statements to facilitateunderstanding by readers outside Japan.
The financial statements are stated in Japanese yen. The translations of the Japanese yenamount into U.S. dollars are included solely for the convenience of the reader, using the pre-vailing exchange rate at March 31, 1998, which was ¥132 to US$1. Such translations shouldnot be construed as representations that the Japanese yen amounts have been, could have been,or could in the future be converted into U.S. dollars at this or any other rate of exchange.
Certain reclassifications have been made in the 1996 and 1997 financial statements to conformto the presentation for 1998.
2 SUMMARY OF SIGNIFICANT ACCOUNTING POLICIES
Consolidation The consolidated financial statements include the accounts of the Company and all subsidiaries(the “Companies”). All significant intercompany balances and transactions have been eliminated.
Equity MethodInvestments in affiliated companies (20%~50% owned) are not accounted for by the equitymethod, but are stated at cost, since their equity in earnings in the aggregate is not material in relation to the consolidated net income and retained earnings.
The consolidation difference between cost of an investment and equity in its net assets at the date of acquisition is mainly amortized over five years.
Cash EquivalentsThe Company considers all highly liquid investments with a maturity of three months or less when purchased to be cash equivalents.
Marketable Securities and Investment SecuritiesListed securities are accounted for at the lower of cost or market. Other securities are stated atcost or less, reflecting a write-down to an estimated realizable value if they have been permanentlyimpaired. The cost of securities is determined by the moving average method.
InventoriesInventories are accounted for at the lower of cost or market, cost being determined principally by the weighted average method.
Property, Plant and EquipmentProperty, plant and equipment are stated at cost. Depreciation is computed using the decliningbalance method at rates based on the estimated useful lives of respective assets, except that thestraight-line method is applied for certain overseas consolidated subsidiaries.
Retirement Benefits and Pension PlanRetirement benefits covering all employees are provided through the following two arrangements:an unfunded lump-sum benefit plan and a non-contributory funded pension plan. Upon retire-ment or termination of employment, employees are generally entitled to lump-sum or annuitypayments based on their current rate of pay, length of service and cause of termination. Theliability for retirement benefits is stated at the amount which would be required to be paid (less the amount of pension plan assets) if all eligible employees mandatorily terminated theiremployment as of the balance sheet date.
Annual contributions for the funded pension plan, which consist of normal cost and amor-tization of prior service cost approximately over five years, are charged to income when paid.
Brought to you by Global Reports

DA
IICH
I PH
AR
MA
CE
UT
ICA
L C
O.,
LTD
.N
OT
ES
TO
CO
NS
OL
IDA
TE
D F
INA
NC
IAL
ST
AT
EM
EN
TS
34
Retirement benefits to directors and statutory auditors of the Company are also included inretirement benefits based on the established guidelines. These payments are made after approvalat the shareholders’ meeting.
Bonuses to Directors and Statutory AuditorsBonuses to directors and statutory auditors, which are subject to shareholders’ approval at theannual shareholders’ meeting under the Commercial Code of Japan (the “Code”), are accountedfor as an appropriation of retained earnings.
Research and DevelopmentResearch and development expenses are charged to income when incurred.
Income TaxesIncome taxes are provided for amounts currently payable for each period based on taxable income.
Deferred income taxes pertaining to temporary differences between financial and tax reportingpurposes are not recognized, except that certain overseas consolidated subsidiaries recognizethem in accordance with accounting practices prevailing in their respective countries of domicile.
Foreign Currency TranslationShort-term receivables and payables denominated in foreign currencies are translated intoJapanese yen at the exchange rates at the balance sheet date.
Long-term receivables and payables denominated in foreign currencies are translated at historical exchange rates.
Foreign currency financial statements of overseas subsidiaries are translated into Japaneseyen at the exchange rate at the balance sheet date.
Accounting for Certain Lease TransactionsFinance leases which do not transfer titles to lessees are accounted for in the same manner as operating leases under accounting principles generally accepted in Japan.
Amounts per ShareIn computing net income per share of common stock, the average number of shares issued during each fiscal year has been used. For diluted net income per share, both net income andshares outstanding were adjusted to assume the conversion of the convertible bonds and theexercise of warrants.
Cash dividends per share represent actual amounts applicable to the respective years.
3 CASH AND CASH EQUIVALENTS
Cash and cash equivalents at March 31, 1998, 1997 and 1996 for the consolidated statements ofcash flows consisted of the following:
Thousands ofMillions of yen U.S. dollars
1998 1997 1996 1998
Cash and time deposits ............................................. ¥102,598 ¥75,574 ¥95,078 $777,258Time deposits with maturities over three months...... (11,497) (5,862) (15,149) (87,099)Commercial paper purchase(included in marketable securities)........................... 3,690 7,790 400 27,955
................................................................................... ¥ 94,791 ¥77,502 ¥80,329 $718,114
4 MARKET VALUE INFORMATION FOR SECURITIES OF THE COMPANY
At March 31, 1998 and 1997, book value, market value and net unrealized gains of quotedsecurities were as follows:
Thousands ofMillions of yen U.S. dollars
1998 1997 1998
Current:Book value .................................................................................. ¥11,991 ¥13,452 $ 90,841Market value................................................................................ 25,267 25,645 191,417
........................................................................................................ 13,276 12,193 100,576Non-Current:
Book value .................................................................................. 13,086 14,631 99,136Market value................................................................................ 24,621 32,460 186,522
........................................................................................................ 11,535 17,829 87,386
Net unrealized gains........................................................................ ¥24,811 ¥30,022 $187,962
Brought to you by Global Reports

DA
IICH
I PH
AR
MA
CE
UT
ICA
L C
O.,
LTD
.N
OT
ES
TO
CO
NS
OL
IDA
TE
D F
INA
NC
IAL
ST
AT
EM
EN
TS
35
5 DERIVATIVE TRANSACTIONS OF THE COMPANY
Status of Derivative TransactionsThe Company utilizes, at present, only forward foreign exchange contracts as derivative trans-actions, in order to hedge foreign currency risks arising from normal business transactions. Atthe end of the year, the Company had forward foreign exchange contracts to sell U.S. dollarswithin the limit of export sales denominated in U.S. dollars and to sell U.S. dollars for hedgingforeign currency denominated time deposits and their interests. The derivative transactions aresolely made with highly rated financial institutions. For the forward foreign exchange contractsrelating to export transactions, those are subject to approval of the General Manager of theFinance and Accounting Department after consulting with the related departments and con-tracted by the Finance and Accounting Department and then the results are reported to theBoard of Directors. For the contracts relating to foreign currency denominated time deposits,etc., those are, depending on the materiality, subject to resolution of the Board of Directors orapproval by the General Manager of the Finance and Accounting Department and contractedby the Finance and Accounting Department and then the results are reported to the Board of Directors.
Market Value of Derivative TransactionsThe aggregate amounts contracted to be paid or received and the fair value of derivative trans-actions in Japanese yen of the Company at March 31, 1998 and 1997 were as follows:
Currency related derivatives:
Millions of yen
1998 1997
Contract amount Contract amount
Due after Market Unrealized Due after Market UnrealizedTotal one year value gain (loss) Total one year value gain (loss)
Forward contracts:To sell:
U.S. dollars ................ ¥242 ¥ — ¥245 ¥(3) ¥336 ¥— ¥317 ¥19
To buy:Swiss francs............... — — — — 134 — 152 18
Total ................... ¥ — ¥ — ¥ — ¥(3) ¥— ¥0— ¥37
Thousands of U.S. dollars
1998
Contract amount
Due after Market UnrealizedTotal one year value gain (loss)
Forward contracts:To sell:
U.S. dollars ................ $1,833 $ — $1,856 $(23)
To buy:Swiss francs............... — — — —
Total ................... $ — $ — $ — $(23)
6 INVENTORIES
Inventories at March 31, 1998 and 1997 consisted of the following:
Thousands ofMillions of yen U.S. dollars
1998 1997 1998
Finished goods................................................................................ ¥24,884 ¥18,113 $188,515Work in process and semi-finished products ................................. 12,210 11,684 92,500Raw materials and supplies ............................................................ 6,311 5,951 47,811
........................................................................................................ ¥43,405 ¥35,748 $328,826
Brought to you by Global Reports

DA
IICH
I PH
AR
MA
CE
UT
ICA
L C
O.,
LTD
.N
OT
ES
TO
CO
NS
OL
IDA
TE
D F
INA
NC
IAL
ST
AT
EM
EN
TS
36
8 LONG-TERM DEBT
Long-term debt at March 31, 1998 and 1997 consisted of the following:
Thousands ofMillions of yen U.S. dollars
1998 1997 1998
Secured loans principally from banks and insurancecompanies, with interest rates ranging from 0.5% to 6.6%.......... ¥ 2,749 ¥ 4,254 $ 20,826
1.4% domestic unsecured convertible bonds due in 1999............. 29,624 29,624 224,4241.8% domestic unsecured convertible bonds due in 2000............. 29,999 30,000 227,2650.75% Swiss franc notes with warrants due in 1997 ...................... — 15,242 —Domestic mortgage bonds issued by consolidated subsidiaries:
4.6% due in 2001 ........................................................................ 2,000 2,000 15,152
......................................................................................................... 64,372 81,120 487,667Less amount due within one year.................................................... (30,627) (17,104) (232,023)
......................................................................................................... ¥33,745 ¥64,016 $255,644
The indentures covering the 1.4% and 1.8% domestic unsecured convertible bonds provide,among other conditions, for (1) conversion into shares of common stock at the conversion pricesper share of ¥2,950.00 ($22.35) and ¥1,763.00 ($13.36), respectively, subject to adjustments undercertain circumstances, and (2) redemption at the option of the Company, commencing on April 1,1994 and October 1, 1997, respectively, at prices ranging from 104% to 100% of the principalamount.
At the current conversion prices, 27,058 thousand shares of common stock were issuable atMarch 31, 1998 upon full conversion of the outstanding convertible bonds.
At March 31, 1998, property, plant and equipment amounting to ¥16,528 million ($125,212thousand) were pledged as collateral for bank loans, long-term secured loans and 4.6% domesticmortgage bonds in the amount of ¥4,532 million ($34,333 thousand).
The annual maturities of long-term debt at March 31, 1998 were as follows:
Thousands ofYear ending March 31, Millions of yen U.S. dollars
1999 ............................................................................................................ ¥30,627 $232,0232000 ............................................................................................................ 966 7,3182001 ............................................................................................................ 30,632 232,0612002 ............................................................................................................ 2,106 15,9542003 ............................................................................................................ 19 144Thereafter .................................................................................................... 22 167
.................................................................................................................... ¥64,372 $487,667
7 LEASE INFORMATION
Total expenses for finance leases which do not transfer ownership to lessees amounted to¥2,054 million ($15,561 thousand) and ¥1,565 million for the years ended March 31, 1998 and 1997, respectively.
Future lease payments as of March 31, 1998, inclusive of interest under such leases, were as follows:
Thousands ofMillions of yen U.S. dollars
Due within one year..................................................................................... ¥2,013 $15,250Due after one year....................................................................................... 3,176 24,061
.................................................................................................................... ¥5,189 $39,311
Brought to you by Global Reports

DA
IICH
I PH
AR
MA
CE
UT
ICA
L C
O.,
LTD
.N
OT
ES
TO
CO
NS
OL
IDA
TE
D F
INA
NC
IAL
ST
AT
EM
EN
TS
37
11 SHAREHOLDERS’ EQUITY
In accordance with the Code, certain issuances of common stock, including conversions of convertible bonds and exercise of warrants, are required to be credited to the common stockaccount to the extent of the greater of par value or 50% of the proceeds and the remainingamount to the additional paid-in capital account as determined by the Board of Directors.
The Code requires an appropriation to the legal reserve of at least 10% of cash dividends andbonuses to directors and statutory auditors until the reserve equals 25% of common stock. Thisreserve is not available for dividends but may be used to reduce a deficit by resolution of theshareholders or may be capitalized by resolution of the Board of Directors.
12 CONTINGENT LIABILITIES
At March 31, 1998, the Companies were contingently liable as guarantor for loans of employ-ees in the amount of ¥747 million ($5,659 thousand). At the same date, the Companies werecontingently liable for trade notes receivable discounted with banks in the amount of ¥194 mil-lion ($1,470 thousand).
13 SEGMENT INFORMATION
The Companies’ primary business activities consist mainly of pharmaceutical business. Otherincludes various remaining businesses. A summary of net sales, costs and expenses and operatingincome by segment of business activities for the years ended March 31, 1998, 1997 and 1996 isas follows:
Millions of yen
1998
Pharmaceutical Elimination and/business Other or corporate Consolidated
I. Sales and operating incomeNet sales:
Outside customers................................ ¥266,305 ¥14,501 ¥00,00— ¥280,806Intersegment ......................................... 1,112 10,034 (11,146) —
Total sales......................................... 267,417 24,535 (11,146) 280,806
Operating expenses.................................. 208,316 23,324 (5,077) 226,563
Operating income ................................. ¥ 59,101 ¥ 1,211 ¥ (6,069) ¥ 54,243
II. Identifiable assets ..................................... ¥259,249 ¥21,331 ¥208,936 ¥489,516Depreciation expense ............................... 14,072 1,110 145 15,327Capital expenditures ................................. 10,108 794 25 10,927
9 INCOME TAXES
Taxes on income consist of corporation tax, inhabitants taxes and enterprise tax. The aggregatenormal effective tax rate on income before income taxes was approximately 51% for 1998, 1997 and 1996. The actual effective tax rate in the consolidated statements of income differs fromthe normal effective tax rate principally because of the effect of expenses not deductible for taxpurposes and temporary differences in recognizing revenues and expenses for financial state-ments and tax returns.
10 RETIREMENT BENEFITS AND PENSION COSTS
Total assets held by the pension plan of the Company and domestic consolidated subsidiariesamounted to ¥23,461 million ($177,735 thousand) at March 31, 1998. The charges to incomewith respect to retirement benefits and pension costs amounted to ¥5,529 million ($41,886thousand), ¥4,809 million and ¥4,411 million for the years ended March 31, 1998, 1997 and1996, respectively.
Brought to you by Global Reports

DA
IICH
I PH
AR
MA
CE
UT
ICA
L C
O.,
LTD
.N
OT
ES
TO
CO
NS
OL
IDA
TE
D F
INA
NC
IAL
ST
AT
EM
EN
TS
38
Millions of yen
1997
Pharmaceutical Elimination and/business Other or corporate Consolidated
I. Sales and operating incomeNet sales:
Outside customers................................ ¥263,060 ¥13,191 ¥00,00— ¥276,251Intersegment ......................................... 980 8,541 (9,521) —
Total sales......................................... 264,040 21,732 (9,521) 276,251
Operating expenses.................................. 200,492 21,083 (4,156) 217,419
Operating income ................................. ¥ 63,548 ¥00,649 ¥ (5,365) ¥ 58,832
II. Identifiable assets ..................................... ¥255,763 ¥20,419 ¥212,446 ¥488,628Depreciation expense ............................... 12,369 1,185 171 13,725Capital expenditures ................................. 26,825 1,644 46 28,515
Millions of yen
1996
Pharmaceutical Elimination and/business Other or corporate Consolidated
I. Sales and operating incomeNet sales:
Outside customers................................ ¥248,585 ¥13,097 ¥000,0— ¥261,682Intersegment ......................................... 1,032 7,063 (8,095) —
Total sales......................................... 249,617 20,160 (8,095) 261,682
Operating expenses.................................. 192,608 19,425 (2,762) 209,271
Operating income ................................. ¥ 57,009 ¥00,735 ¥,0(5,333) ¥ 52,411
II. Identifiable assets ..................................... ¥248,749 ¥30,066 ¥192,130 ¥470,945Depreciation expense ............................... 11,641 935 185 12,761Capital expenditures ................................. 15,847 1,178 681 17,706
Thousands of U.S. dollars
1998
Pharmaceutical Elimination and/business Other or corporate Consolidated
I. Sales and operating incomeNet sales:
Outside customers................................ $2,017,462 $109,856 $000000— $2,127,318Intersegment ......................................... 8,424 76,015 (84,439) —
Total sales......................................... 2,025,886 185,871 (84,439) 2,127,318
Operating expenses.................................. 1,578,151 176,697 (38,462) 1,716,386
Operating income ................................. $0,447,735 $ 9,174 $0,,(45,977) $0,410,932
II. Identifiable assets ..................................... $1,964,008 $161,598 $1,582,848 $3,708,455Depreciation expense ............................... 106,606 8,409 1,098 116,113Capital expenditures ................................. 76,576 6,015 189 82,780
Unallocable operating expenses, consisting primarily of the Companies’ expenses relating to general affairs, accounting and other departments were ¥6,031 million ($45,689 thousand),¥5,409 million and ¥5,274 million for the years ended March 31, 1998, 1997 and 1996, respec-tively, and were included in elimination and/or corporate. Corporate assets, consisting primarilyof the Companies’ cash and marketable securities, investment securities and assets relating tothe Administration Department, were ¥212,263 million ($1,608,053 thousand) and ¥215,308million and ¥194,192 million for the years ended March 31, 1998, 1997 and 1996, respectively,and were included in elimination and/or corporate.
Geographic segment information is not shown, due to the total sales and the identifiableassets in Japan being more than 90% of consolidated amounts.
Brought to you by Global Reports

DA
IICH
I PH
AR
MA
CE
UT
ICA
L C
O.,
LTD
.N
OT
ES
TO
CO
NS
OL
IDA
TE
D F
INA
NC
IAL
ST
AT
EM
EN
TS
39
14 SUBSEQUENT EVENTS
I. At the annual general meeting of shareholders held on June 26, 1998, the Company set anew provision in its articles of incorporation that the Company may acquire its own shares,upon resolution of the Board of Directors, within the maximum limit of 28 million shares toretire such shares and to offset related purchase costs against retained earnings.
II. The following appropriations of retained earnings at March 31, 1998 were approved at thesame meeting mentioned above.
Thousands ofMillions of yen U.S. dollars
Year-end cash dividends (¥9.00 per share) ................................................ ¥2,524 $19,122Bonuses to directors and statutory auditors............................................... 120 909Transfer to legal reserve.............................................................................. 270 2,045
The Companies’ business activities overseas consist mainly of those in America and in Europe.Other includes mainly Asia. A summary of overseas net sales by the Companies is as follows:
Millions of yen
1998
America Europe Other Total
I. Overseas net sales.................................................... ¥18,539 ¥11,300 ¥9,658 ¥ 39,497II. Consolidated net sales.............................................. 280,806III. Ratio of overseas net sales
on a consolidated basis ......................................... 6.6% 4.0% 3.5% 14.1%
Thousands of U.S. dollars
1998
America Europe Other Total
I. Overseas net sales.................................................... $140,447 $85,606 $73,167 $0,299,220II. Consolidated net sales.............................................. 2,127,318III. Ratio of overseas net sales
on a consolidated basis ......................................... 6.6% 4.0% 3.5% 14.1%
Overseas net sales by the Companies totaled ¥29,514 million, and accounted for 10.7% ofconsolidated net sales for the year ended March 31, 1997. Information about overseas net salesfor the year ended March 31, 1996 is not stated, due to overseas net sales being less than 10%of consolidated net sales.
Brought to you by Global Reports

REPORT OF INDEPENDENT PUBLIC ACCOUNTANTS �D
AIIC
HI P
HA
RM
AC
EU
TIC
AL
CO
., LT
D.
RE
PO
RT
OF
IND
EP
EN
DE
NT
PU
BL
IC A
CC
OU
NT
AN
TS
40
To the Shareholders and the Board of Directors
of DAIICHI PHARMACEUTICAL CO., LTD.
We have audited the accompanying consolidated balance sheets of DAIICHI PHARMACEUTICALCO., LTD. (a Japanese corporation) and subsidiaries as of March 31, 1998 and 1997, and the relatedconsolidated statements of income, shareholders’ equity and cash flows for each of the three years in theperiod ended March 31, 1998, expressed in Japanese yen. Our audits were made in accordance with gen-erally accepted auditing standards and, accordingly, included such tests of the accounting records andsuch other auditing procedures as we considered necessary in the circumstances.
In our opinion, the consolidated financial statements referred to above present fairly the consolidatedfinancial position of DAIICHI PHARMACEUTICAL CO., LTD. and subsidiaries as of March 31, 1998and 1997, and the consolidated results of their operations and their cash flows for each of the three yearsin the period ended March 31, 1998 in conformity with accounting principles generally accepted inJapan applied on a consistent basis.
Also, in our opinion, the U.S. dollar amounts in the accompanying consolidated financial statementshave been translated from Japanese yen on the basis set forth in Note 1.
June 26, 1998
Brought to you by Global Reports

Executive Office14-10, Nihonbashi 3-chome,Chuo-ku, Tokyo 103-8234Tel: (03) 3272-0611Cable: “ARSEMIN”Telex: J22729 ARSEMINFax: (03) 3272-7348
Regional Sales OfficesTokyo (metropolitan area), Tokyo (northern Kanto and outlying areas), Osaka, Fukuoka, Sapporo, Nagoya, Sendai, Hiroshima, Takamatsu, Yokohama, Kyoto
FactoriesOsaka, Shizuoka, Akita
Research & DevelopmentCenterTokyo
Overseas Offices
U.S. OFFICE400 Kelby Street, Fort Lee, NJ 07024, U.S.A.Tel: 1-201-944-4333Fax: 1-201-944-4364
DÜSSELDORF OFFICEImmermannstr. 50/52, 40210 Düsseldorf, GermanyTel: 49-211-172-520Fax: 49-211-172-5299
LONDON OFFICE13th Floor, InternationalPress Centre, 76 Shoe Lane, London EC4A 3JB, U.K.Tel: 44-171-936-2850Fax: 44-171-583-6035
BEIJING OFFICERoom 101, 1/F,Beijing Int’l Club Office Tower, 21, Jian Guo Men Wai Street,Beijing 100020, ChinaTel: 8610-6532-1931Fax: 8610-6532-1950
HONG KONG OFFICERoom 1906-7, Level 19, Two Pacific Place, 88 Queensway, Hong Kong, ChinaTel: 852-2868-9072Fax: 852-2801-4341
BANGKOK OFFICE5th Floor, Boonmitr Building, 138 Silom Road, Bangkok 10500, ThailandTel: 66-2-236-7485Fax: 66-2-236-2656
JAKARTA OFFICE15th Floor, Kyoei PrinceBuilding, Suite 1507, Jl. Jend. SudirmanKav. 3, Jakarta 10220, IndonesiaTel: 62-21-572-4131Fax: 62-21-572-4132
Paid-in Capital¥30,252 million
Common StockAuthorized: 800,000,000 sharesIssued: 280,452,154 sharesNumber of Shareholders: 21,255Transfer Agent:
The Yasuda Trust and BankingCompany, Limited
2-1, Yaesu 1-chome, Chuo-ku, Tokyo 103-8670
Stock ListingsTokyo Stock ExchangeOsaka Securities Exchange
Principal ShareholdersNippon Life Insurance Company ........................................ 6.61%
The Sumitomo Bank, Limited ............................................. 4.83%
The Fuji Bank, Limited ........................................................ 4.82%
The Bank of Tokyo-Mitsubishi, Ltd. .................................. 3.64%
The Yasuda Trust and Banking Company, Limited .......... 3.44%
The Sumitomo Trust and Banking Company, Limited ..... 3.37%
State Street Bank and Trust Company ................................ 3.12%
The Mitsubishi Trust and Banking Corporation .................. 2.54%
Chase Manhattan Corp. ....................................................... 2.45%
The Tokio Marine & Fire Insurance Company, Ltd. ........ 2.42%
Independent AuditorAsahi & Co.Asahi Center Building, 1-2, Tsukudo-cho, Shinjuku-ku, Tokyo 162-8551
Number of Employees (Non-Consolidated)(Based on the Annual Securities Report)Administration ........................................................................... 349Marketing & Detailing ........................................................... 2,036Production & Technology ........................................................ 763Research & Development ......................................................... 776Total ........................................................................................ 3,924
GENERAL INFORMATION �(As of March 31, 1998)
DA
IICH
I PH
AR
MA
CE
UT
ICA
L C
O.,
LTD
.G
EN
ER
AL
INF
OR
MA
TIO
N
41
Brought to you by Global Reports

PRINTED IN JAPAN
Brought to you by Global Reports