daftar pustaka - diponegoro university | institutional...
TRANSCRIPT
DAFTAR PUSTAKA
1. Powell KE, Paluch AE, Blair SN. Physical activity for health: What kind?
How much? How intense? On top of what? Public Health. 2011;32(1):349.
2. WHO, Physical Activity [Cited 2015].
3. Parfitt G, Hughes S. The Exercise Intensity-Affect Relationship: Evidence
and Implications for Exercise Behavior. Journal of Exercise Science &
Fitness. 2009;7(2):S34-S41.
4. Depkes L. Laporan Riskesdas 2013 [Cited 2015].
5. Sukmaningtyas H, Pudjonarko D. Pengaruh Latihan Aerobik dan Anaerobik
terhadap Sistem Kardiovaskuler dan Kecepatan Reaksi. 2002.
6. Suharjana. Kebiasaan Berperilaku Hidup Sehat dan Nilai-nilai Pendidikan
Karakter. Jurnal Pendidikan Karakter. 2012.
7. Santoso TB, Rohmah N. Gangguan gerak dan fungsi kognitif pada wanita
lanjut usia. 2011.
8. Heimann M, Tjus T, Strid K. Attention in cognition and early learning.
2010.
9. Curet MJ. The impact of video games on training surgeons in the 21st
century—Invited critique. Archives of Surgery. 2007;142(2):186-.
10. Levy F, Hobbes G. The influences of social class and sex on sustained
attention (vigilance) and motor inhibition in children. The Australian and
New Zealand journal of psychiatry. 1979 Sep;13(3):231-4.
11. Arifin AM, Adyaksa G, Laksono B. Pengaruh Bermain Video Game Tipe
First Person Shooter terhadap Atensi yang Diukur dengan Attention
Network Test: Faculty of Medicine Diponegoro University; 2014.
12. Valentine ER, Sweet PL. Meditation and attention: A comparison of the
effects of concentrative and mindfulness meditation on sustained attention.
Mental Health, Religion & Culture. 1999:2(1):59-70.

13. Laporte RE, Montoye HJ, Caspersen CJ. Assesment of physical activity in
epidimiologic research: problems and prospects. Public health reports.
1985;100(2):131.
14. Baddeley A. Working memory, thought, and action: Oxford University
Press; 2007.
15. Jackson AS, Blair SN, Mahar MT, Wier LT, Ross RM, Stuteville JE.
Prediction of functional aerobic capacity without exercise testing. Medicine
and Science in Sports and exercise. 1990;22(6):863-70.
16. Cooper KH. The aerobics way: Bantam Books; 1982.
17. Haskell WL, Lee I-M, Pate RR, Powell KE, Blair SN, Franklin BA, et al.
Physical activity and public health: updated recommendation for adults
from the American College of Sports Medicine and the American Heart
Association. Circulation. 2007;116(9):1081.
18. Lockett DMC, Campbell J. The effects of aerobic exercise on migraine.
Headache; The Journal of Head and Face Pain. 1992;32(1):50-4.
19. MedBio. Work and Energy in Muscles 2007 [Cited 2015].
20. Kraemer WJ, Fleck SJ, Deschenes MR. Exercise physiology: integrating
theory and application: Lippincott Williams & Wilkins; 2011.
21. Thomas AG, Dennis A, Bandettini PA, Johansen-Berg H. The effects of
aerobic activity on brain structure. Frontiers in psychology. 2012;3.
22. Courchesne E, Townsend J, Akshoomoff NA, Saitoh O, Yeung-Courchesne
R, Lincoln AJ, et al. Impairment in shifting attention in autistic and
cerebellar patients. Behavioral neuroscience. 1994;108(5):848.
23. Planinsec J. Relations between the motor and cognitive dimensions of
preschool girls and boys. Perceptual and motor skills. 2002;94(2):415-23
24. Seifert T, Secher NH. Sympathetic influence on cerebral blood flow and
metabolism during exercise in humans. Progress in neurobiology.
2011;95(3):406-26.
25. Stroth S, Hille K, Spitzer M, Reinhardt R. Aerobic endurance exercise
benefits memory and affect in young adults. Neuropsychological
Rehabilitation. 2009;19(2):223-43.
26. Meeusen R. Exercise and the brain: insight in new theurapeutic modalities.
Annals of Transplantation. 2005;10(4):49-51.
27. Eggermont L, Swaab D, Luiten P, Scherder E. Exercise, cognition and
Alzheimer’s disease: more is not necessarily better. Neuroscience &
Biobehavioral Reviews. 2006;30(4):562-75.
28. Control CfD, Prevention. The association between school based physical
activity, including physical education, and academic performance. Atlanta,
GA: US Department of Health and Human Services. 2010.
29. Halperin JM, Healey DM. The influences of enviromental enrichment,
cognitive enhancement, and physical exercise on brain development: can
we alter the developmental trajectory of ADHD? Neuroscience &
Biobehavioral Reviews. 2011;35(3):621-34.
30. Hillman CH, Erickson KI, Kramer AF. Be smart, exercise your heart:
exercise effects on brain and cognition. Nature reviews neuroscience.
2008;9(1):58-65.
31. Ploughman M. Exercise is brain food: the effects of physical activity on
cognitive function. Developmental Neurorehabilitation. 2008;11(3)236-40.
32. Foster PP, Rosenblatt KP, Kuljis RO. Exercise-induced cognitive plasticity,
implications for mild cognitive impairment and Alzheimer’s disease.
Frontiers in neurology. 2011;2.
33. Chaddock L, Erickson KI, Prakash RS, VanPatter M, Voss MW, Pontifex
MB, et al. Basal ganglia volume is associated with aerobic fitness in
preadolescent children. Developmental neuroscience. 2010;32(3):249.
34. Chaddock L, Erickson KI, Prakash RS, Kim JS, Voss MW, VanPatter M, et
al. A neuroimaging investigation of the association between aerobic et al. A
neuroimaging investigation of the association between aerobic fitness,
hippocampal volume, and memory performance in preadolescent children.
Brain research. 2010;1358:172-83.
35. Chaddock L, Erickson KI, Prakash RS, Voss MW, VanPatter M, Pontifex
MB, et al. A functional MRI investigation of the association

betweenchildhood aerobic fitness and neurocognitive control. Biological
psychology. 2012;89(1):260-8.
36. Smith PJ, Blumenthal JA, Hoffman BM, Cooper H, Strauman TA, Welsh-
Bohmer K, et al. Aerobic exercise and neurocognitive performance: a meta-
analytic review of randomized controlled trials. Psychosomatic medicine.
2010;72(3):239.
37. Sehat MI. Kebugaran, Bagaimana Mencapainya? 2003 [Cited 2015).
38. Weuve J, Kang J, Manson J, Breteler M, Ware J, Grodstein F. Physical
Activity, Including Walking, and Cognitive Function in Older Women.
Journal of Cardiopulmonary Rehabilitation and Prevention. 2005;25(1):56.
39. Burzynska AZ, Chaddock-Heyman L, Voss MW, Won CN, Gothe NP,
Olson EA, et al. Physical activity and cardiorespiratory fitness are benefical
for white matter in low-fit older adults. PloS one. 2014;9(9):e107413.
40. Wikipedia. Brain neuroplasticity after practice. [Cited 2015]
41. Tsai C-L, Wang C-H, Tseng Y-T. Effects of exercise intervention on event-
related potential and task performance indices of attention networks in
children with developmental coordination disorder. Human movement
science. 2008;27(4):649-64.
42. Tsai C-L, Wilson PH, Wu SK. Role of visual-perceptual skills (non-motor)
in children with developmental coordination disorder. Human movement
science. 2008;27(4):649-64.
43. Bull R, Scerif G. Executive functioning as a predictor of children’s
mathematics ability: Inhibition, switching, and working memory.
Developmental neuropsychology. 2001;19(3):273-93.
44. Pediatrics Aao. Subcommittee on Attention-Deficit/Hyperactivity Disoredr,
Steering Committee on Quality Improvement and Management.(2011).
ADHD: Clinical practice guideline for the diagnosis, evaluation, and
treatment of attentiondeficit/hyperactivity disorder in children and
adolescents. Pediatrics. 128(5):1007-22.
45. St Clair-Thompson HL, Gathercole SE. Executive functions and
achievements in school: Shifting, updating, inhibition, and working
memory. The quarterly journal of experimental psychology.
2006:59(4):745-59.
46. Black JE, Isaacs KR, Anderson BJ, Alcantara AA, Greenough WT..
Learning causes synaptogenesis, whereas motor activity causes
angiogenesis, in cerebellar cortex of adults rats. Proceedings of the National
Academy of Sciences. 1990;87(14):5568-72.
47. Green CS, Bavelier D. Action video game modifies visual selective
attention. Nature. 2003;423(6939):53407.
48. Neurologi PPDS. Modul Neurobehavior: Kolegium Neurologi Indonesia;
2008.
49. Butler BC, Lawrence M, Eskes GA, Klein R. Visual search patterns in
neglect: Comparison of peripersonal and extrapersonal space.
Neuropsychologia. 2009;47(3):869-78.
50. Corbetta M, Schulman GL. Control of goal-directed and stimulus-driven
attention in the brain. Nature reviews neuroscience. 2002;3(3):201-15.
51. Chambers CD, Mattingley JB. Neurodisruption of selective attention:
insights and implications. Trends in cognitive sciences. 2005;9(11):542-50.
52. Posner MI, Walker JA, Friedrich FJ, Rafal RD. Effects of parietal injury on
covert orienting of attention. The journal of Neuroscience. 1984;4(7):1863-
74.
53. Snyder JJ, Chatterjee A. The frontal cortex and exogenous attentional
orienting. Journal of Cognitive Neuroscience. 2006;18(11):1913-23.
54. Fan J, McCandliss BD, Sommer T, Raz A, Posner MI. Testing the efiiciency
and independence of attentional networks. Journal of cognitive
neuroscience. 2002;14(3):340-7.
55. Petersen SE, Posner MI. The attention system of the human brain: 20 years
after. Annual review of neuroscience. 2012;35:73.
56. Posner MI, Rothbart MK. Research on attention networks as a model for the
integration of psychological science. Annu Rev Psychol. 2007;58:1-23.
57. Coull JT. Modulation of Attention by Noradrenergic a 2-Agents Varies
According to Arousal Level. Drug News Perspect. 2001;14(1):5.
58. Corbetta M, Schulman GL. Human cortical mechanisms of visual attention
during orienting and search. Philosophical Transactions of the Royal
Society B:Biological Sciences. 1998;353(1373):1353-62.
59. Wilson KD, Woldorff MG, Mangun GR. Control networks and hemispheric
asymmetries in parietal cortex during attentional orienting in different
spatial reference frames. Neuroimage. 2005;25(3)668-83.
60. Posner MI, Sheese BE, Odludas Y, Tang Y. Analyzing and shaping human
attentional networks. Neural Networks. 2006;19(9):1422-9.
61. Posner MI, Rothbart MK, Sheese BE. Attention genes. Developmental
science. 2007;10(1):24-9.
62. Tsai C-L. The effectiveness of exercise intervention on inhibitory control in
children with developmental coordination disorder: Using a visuospatial
attention paradigm as a model. Research in developmental disabilities.
2009;30(6):1268-80.
63. Tsai C-L, Pan C-Y, Chang Y-K, Wang C-H, Tseng K-D. Deficits of
visuospatial attention with reflexive orienting induced by eye-gazed cues in
children with developmental coordination disorder in the lower extremities:
An event-related potential study. Research in developmental disabilities.
2010;31(3):642-55.
64. Webster K. The Prefrontal Cortex: Anatomy, Physiology and
Neuropsychology of the Frontal Lobe. Journal of anatomy. 1982’134(Pt
3):592.
65. Bush G, Luu P, Posner MI. Cognitive and emotional influences in anterior
cingulate cortex. Trends in cognitive sciences. 2000;4(6):215-22.
66. University of Washington. Stroop Effect. [Cited 2015].
67. Cognitive Atlas. Eriksen flanker task. [Cited 2015].
68. Coxon JP, Stinear CM, Byblow WD. Selective inhibition of movement.
Journal of Neurophysiology. 2007;97(3):2480-9.
69. Huttermann S, Bock O, Memmert D. The breadth of attention in old age.
Ageing Research. 2012;3(1):e10.

70. Carayannis G. Memory Cognitive Function Loss: ReGenesis medical
centre. 2001.
71. Teleb AA, Al Awamleh AA. Gender Differences in Cognitive Abilities.
Current Research in Psychology. 2012;3(1):33-9.
72. Vasconcellos A, Tabajara A, Ferrari C, Rocha E, Dalmaz C. Effect of
chronic stress on spatial memory in rats is attenuated by lithium treatment.
Physiology & behavior. 2003;79(2):143-9.
73. Pontifex MB, Saliba BJ, Raine LB, Picchietti DL, Hillman CH. Exercise
improves behavioral, neurocognitive, and scholastic performance in
children with attention-deficit/hyperactivity disoredr. The Journal of
pediatrics. 2013;162(3):543-51.
74. Parkin AJ. Memory: A guide for professionals: John Wiley & Sons
Incorporated; 1999.
75. Li C-Y, Sung F-C, Wu SC. Risk of cognitive impairment in relation to
elevated exposure to electromagnetic fields. Journal of occupational and
enviromental medicine. 2002;44(1):66-72.
76. Desai AK, Grossberg GT. Diagnosis and treatment of Alzheimer’s disease.
Neurology. 2005;64(12 suppl 3):S34-S9.
77. Wood ER, Duchenko PA, Robitsek RJ, Eichenbaum H. Hippocampal
neurons encode information about different types of memory episodes
occuring in the same location. Neuron. 2000;27(3):623-33.
78. Stringa E, Knauper V, Murphy G, Gavrilovic J. Collagen degradation and
platelet-derived growth factor stimulate the migration of vascular smooth
muscle cells. Journal of cell science. 2000;113(11):2055-64.
79. Konsep HB. Pendekatan masalah kognitif pada usia lanjut: Terfokus pada
deteksi dini. Dalam: Cognitive problem in elderly Temu Regional
Neurologi Jateng-DIY. 2002;19:15-6.
80. Mahar M, Sidharta P. Neurologi Klinis Dasar. Jakarta: Dian Rakyat.
2008:320.
81. Plassman BL, Williams JW, Burke JR, Holsinger T, Benjamin S. Systematic
review: factors associated with risk for and possible prevention of cognitive
decline in later life. Annals of Internal Medicine. 2010;153(3):182-93.
82. Freidl W, Schmidt R, Stronegger W, Irmler A, Reinhart B, Koch M. Mini
Mental State Examination: influence of sociodemographic, enviromental
and behavioral factors, and vascular risk factors. Journal of clinical
epidemiology. 1996;49(1)73-8.
83. Association AP. Diagnostic and statistical manual of mental disorders,
(DSM-5®): American Psychiatric Pub; 2013.
84. Niogi S, Mukherjee P, Ghajar J, McCandliss BD. Individual differences in
distinct components of attention are linked to anatomical variations in
distinct white matter tracts. Frontiers in Neuroanatomy. 2010;4.
85. Hakim, T. Mengatasi Gangguan Konsentrasi. Jakarta. Puspa Swara. 2003
86. Jannah, M. Pelatihan Meditasi Otogenik untuk Meningkatkan Konsentrasi
Pada Atlet Lari Jarak Pendek. Yogyakarta. Fakultas Psikologi Universitas
Gadjah Mada. 2004.

LAMPIRAN
Lampiran 1. Ethical clearance
Lampiran 2. Informed Consent
JUDUL PENELITIAN : PENGARUH OLAHRAGA AEROB RUTIN
TERHADAP ATENSI MAHASISWA FK
UNDIP YANG DIUKUR DENGAN
ATTENTION NETWORK TEST
INSTANSI PELAKSANA : Fakultas Kedokteran Universitas Diponegoro
PENELITI : Ismi Mulyanti Putri
Persetujuan Setelah Penjelasan
(INFORMED CONSENT)
Yang terhormat Saudara :
Peneliti tersebut di atas adalah Mahasiswa Fakultas Kedokteran Universitas
Diponegoro yang bermaksud ingin melibatkan Saudara untuk menjadi responden
dalam penelitian ini dengan tujuan mengetahui atensi pada kelompok yang
melakukan olahraga aerob rutin menggunakan perangkat lunak yang bernama
Attention Network Test. Peneliti menjamin kerahasiaan identitas dan informasi
yang diberikan. Informasi tersebut hanya digunakan untuk kepentingan
penelitian. Saudara berhak menolak dan keluar dari penelitian sesuai dengan
keinginan. Terimakasih atas kerjasama Saudara.
Setelah mendengar dan memahami penjelasan penelitian, dengan ini saya
menyatakan
SETUJU / TIDAK SETUJU
*coret yang tidak perlu
Untuk ikut sebagai responden / subjek penelitian.
Semarang,…………..2015
(…………….……………)
Saksi :
Alamat :
Lampiran 3.
No. Kuesioner :
Nama Responden :
Tanggal Wawancara :
A. IDENTITAS RESPONDEN
1. Nama :
2. T.T.L :
3. Jenis Kelamin :
4. Alamat :
5. Angkatan :
6. Nomor Telepon :
B. ANAMNESIS
1. Apakah anda memiliki kelainan refraksi mata?
a. Ya
b. Tidak
2. (Jika jawaban dari pertanyaan di atas adalah Ya)
Berapa kelainan refraksi mata yang anda alami?
Sebutkan…………………………………………………………………
3. Apakah kelainan refraksi anda dikoreksi dengan kaca mata atau lensa
kontak?
a. Ya
b. Tidak
4. Apakah saat ini anda tergolong rutin berolahraga?
a. Ya
b. Tidak
5. (Jika jawaban dari pertanyaan di atas adalah Ya)
Sejak kapan anda rutin berolahraga?
KUESIONER PENELITIAN
PENGARUH OLAHRAGA AEROB RUTIN
TERHADAP ATENSI MAHASISWA FK UNDIP YANG
DIUKUR DENGAN ATTENTION NETWORK TEST
a. 3 bulan terakhir atau lebih
b. 2 bulan terakhir
c. Baru saja mulai rutin berolahraga
6. Berapa kali anda melakukan olahraga dalam seminggu?
a. 3 kali atau lebih
b. 1-2 kali
c. Tidak selalu setiap minggu (olahraga 1-2 kali dalam sebulan)
d. Tidak sama sekali
7. Dalam sekali melakukan olahraga, berapa lama waktu yang anda
habiskan?
a. ≥60 menit
b. ≥30 menit sampai dengan <60 menit
c. 10 menit sampai dengan <30 menit
8. Olahraga apa yang anda lakukan?
(Boleh lebih dari 1, urutkan dari yang paling sering dilakukan)
Sebutkan………………………………………………………………....
9. Apakah saat ini anda sedang dalam kondisi stress / depresi / cemas?
a. Ya
b. Tidak
10. Apakah saat ini anda mengidap penyakit infeksi dan/atau penyakit
sistemik?
a. Ya
b. Tidak
11. (Jika jawaban dari pertanyaan di atas adalah Ya)
Apa penyakit infeksi dan/atau penyakit sistemik yang anda alami?
Sebutkan…………………………………………………………………
12. Apakah anda mengkonsumsi alkohol dan/atau obat sedatif?
a. Ya
b. Tidak
13. Apakah anda menderita gangguan psikiatri?
a. Ya
b. Tidak
14. Apakah anda memiliki riwayat tumor otak / trauma kepala / epilepsi /
Parkinson / kejang?
a. Ya
b. Tidak
15. Apakah anda dapat mengoperasikan komputer?
a. Ya
b. Tidak
16. Tangan manakah yang anda gunakan dominan sehari-hari?
(Untuk menulis, mengetik, dll.)
a. Kanan
b. Kiri
17. Apakah anda memiliki kelainan muskuloskeletal pada tangan?
a. Ya,
b. Tidak
18. (Jika jawaban dari pertanyaan di atas adalah Ya)
Apa kelainan muskuloskeletal yang anda alami?
Sebutkan…………………………………………….…...………………
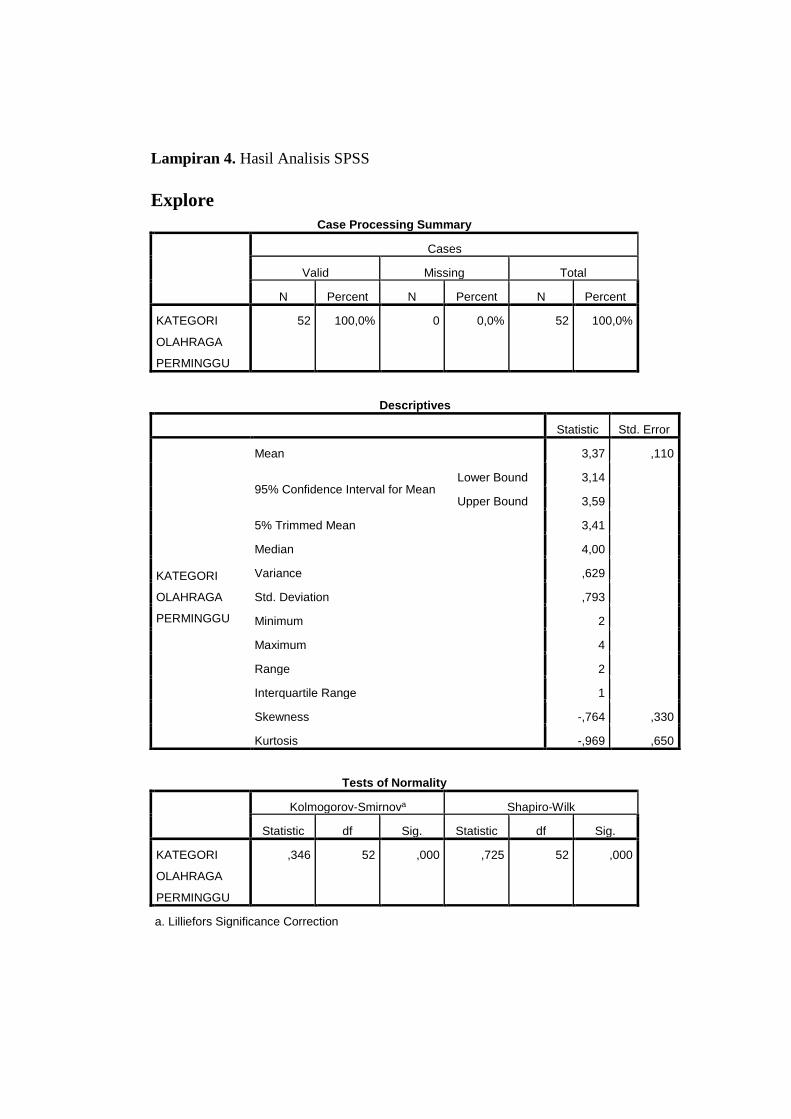
Lampiran 4. Hasil Analisis SPSS
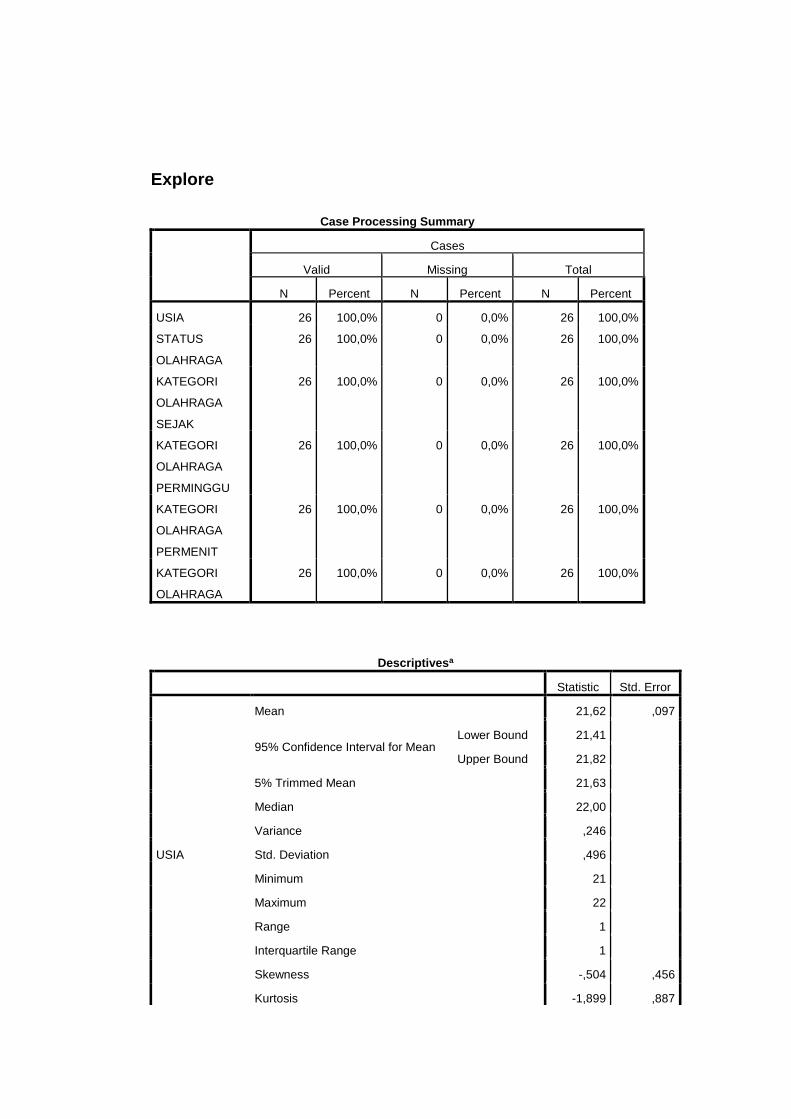
Explore
Case Processing Summary
Cases
Valid Missing Total
N Percent N Percent N Percent
KATEGORI
OLAHRAGA
PERMINGGU
52 100,0% 0 0,0% 52 100,0%
Descriptives
Statistic Std. Error
KATEGORI
OLAHRAGA
PERMINGGU
Mean 3,37 ,110
95% Confidence Interval for Mean Lower Bound 3,14
Upper Bound 3,59
5% Trimmed Mean 3,41
Median 4,00
Variance ,629
Std. Deviation ,793
Minimum 2
Maximum 4
Range 2
Interquartile Range 1
Skewness -,764 ,330
Kurtosis -,969 ,650
Tests of Normality
Kolmogorov-Smirnova Shapiro-Wilk
Statistic df Sig. Statistic df Sig.
KATEGORI
OLAHRAGA
PERMINGGU
,346 52 ,000 ,725 52 ,000
a. Lilliefors Significance Correction
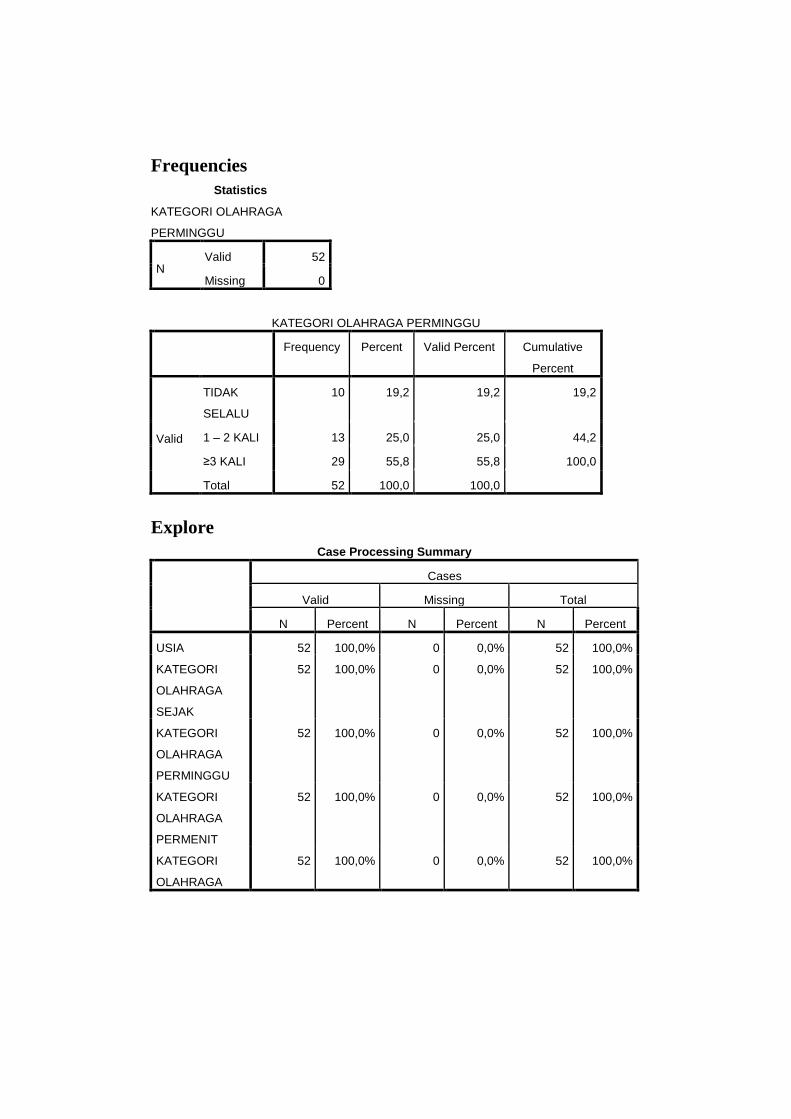
Frequencies
Statistics
KATEGORI OLAHRAGA
PERMINGGU
N Valid 52
Missing 0
KATEGORI OLAHRAGA PERMINGGU
Frequency Percent Valid Percent Cumulative
Percent
Valid
TIDAK
SELALU
10 19,2 19,2 19,2
1 – 2 KALI 13 25,0 25,0 44,2
≥3 KALI 29 55,8 55,8 100,0
Total 52 100,0 100,0
Explore
Case Processing Summary
Cases
Valid Missing Total
N Percent N Percent N Percent
USIA 52 100,0% 0 0,0% 52 100,0%
KATEGORI
OLAHRAGA
SEJAK
52 100,0% 0 0,0% 52 100,0%
KATEGORI
OLAHRAGA
PERMINGGU
52 100,0% 0 0,0% 52 100,0%
KATEGORI
OLAHRAGA
PERMENIT
52 100,0% 0 0,0% 52 100,0%
KATEGORI
OLAHRAGA
52 100,0% 0 0,0% 52 100,0%

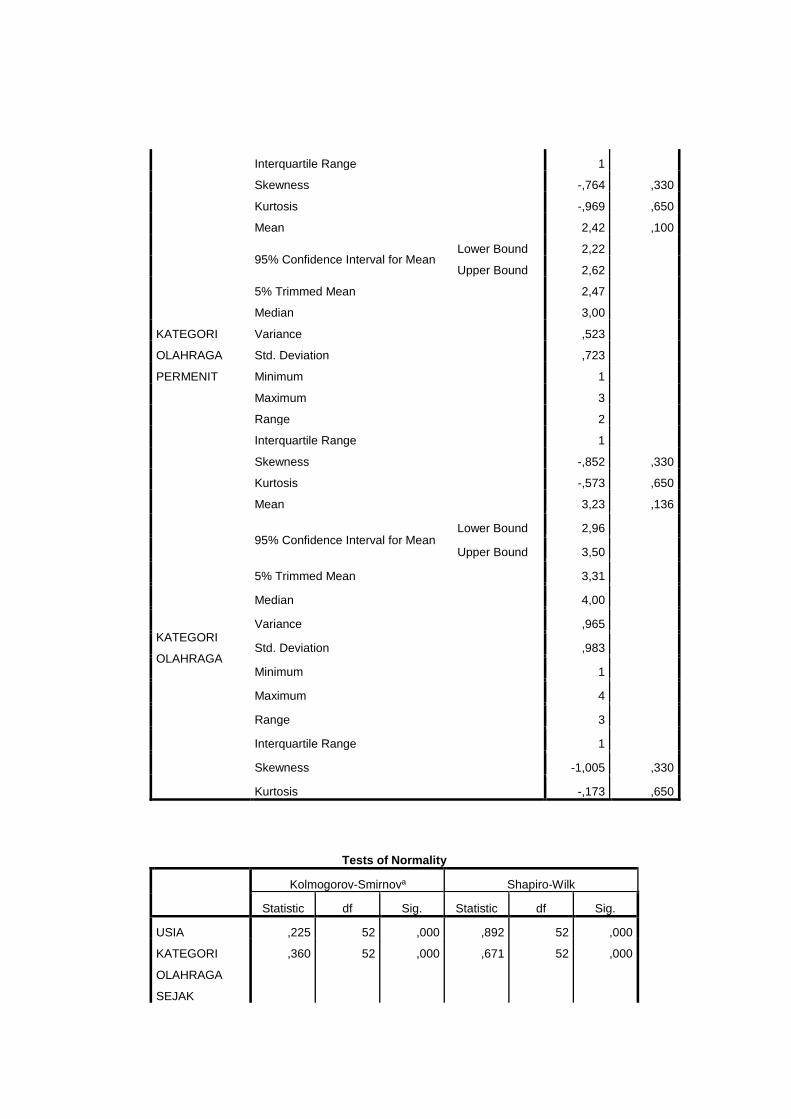
Descriptives
Statistic Std. Error
USIA
Mean 21,48 ,133
95% Confidence Interval for Mean Lower Bound 21,21
Upper Bound 21,75
5% Trimmed Mean 21,46
Median 22,00
Variance ,921
Std. Deviation ,960
Minimum 20
Maximum 24
Range 4
Interquartile Range 1
Skewness ,126 ,330
Kurtosis -,259 ,650
KATEGORI
OLAHRAGA
SEJAK
Mean 2,19 ,132
95% Confidence Interval for Mean Lower Bound 1,93
Upper Bound 2,46
5% Trimmed Mean 2,21
Median 3,00
Variance ,903
Std. Deviation ,951
Minimum 1
Maximum 3
Range 2
Interquartile Range 2
Skewness -,403 ,330
Kurtosis -1,814 ,650
KATEGORI
OLAHRAGA
PERMINGGU
Mean 3,37 ,110
95% Confidence Interval for Mean Lower Bound 3,14
Upper Bound 3,59
5% Trimmed Mean 3,41
Median 4,00
Variance ,629
Std. Deviation ,793
Minimum 2
Maximum 4
Range 2
Interquartile Range 1
Skewness -,764 ,330
Kurtosis -,969 ,650
KATEGORI
OLAHRAGA
PERMENIT
Mean 2,42 ,100
95% Confidence Interval for Mean Lower Bound 2,22
Upper Bound 2,62
5% Trimmed Mean 2,47
Median 3,00
Variance ,523
Std. Deviation ,723
Minimum 1
Maximum 3
Range 2
Interquartile Range 1
Skewness -,852 ,330
Kurtosis -,573 ,650
KATEGORI
OLAHRAGA
Mean 3,23 ,136
95% Confidence Interval for Mean Lower Bound 2,96
Upper Bound 3,50
5% Trimmed Mean 3,31
Median 4,00
Variance ,965
Std. Deviation ,983
Minimum 1
Maximum 4
Range 3
Interquartile Range 1
Skewness -1,005 ,330
Kurtosis -,173 ,650
Tests of Normality
Kolmogorov-Smirnova Shapiro-Wilk
Statistic df Sig. Statistic df Sig.
USIA ,225 52 ,000 ,892 52 ,000
KATEGORI
OLAHRAGA
SEJAK
,360 52 ,000 ,671 52 ,000
KATEGORI
OLAHRAGA
PERMINGGU
,346 52 ,000 ,725 52 ,000
KATEGORI
OLAHRAGA
PERMENIT
,345 52 ,000 ,729 52 ,000
KATEGORI
OLAHRAGA
,322 52 ,000 ,756 52 ,000
a. Lilliefors Significance Correction
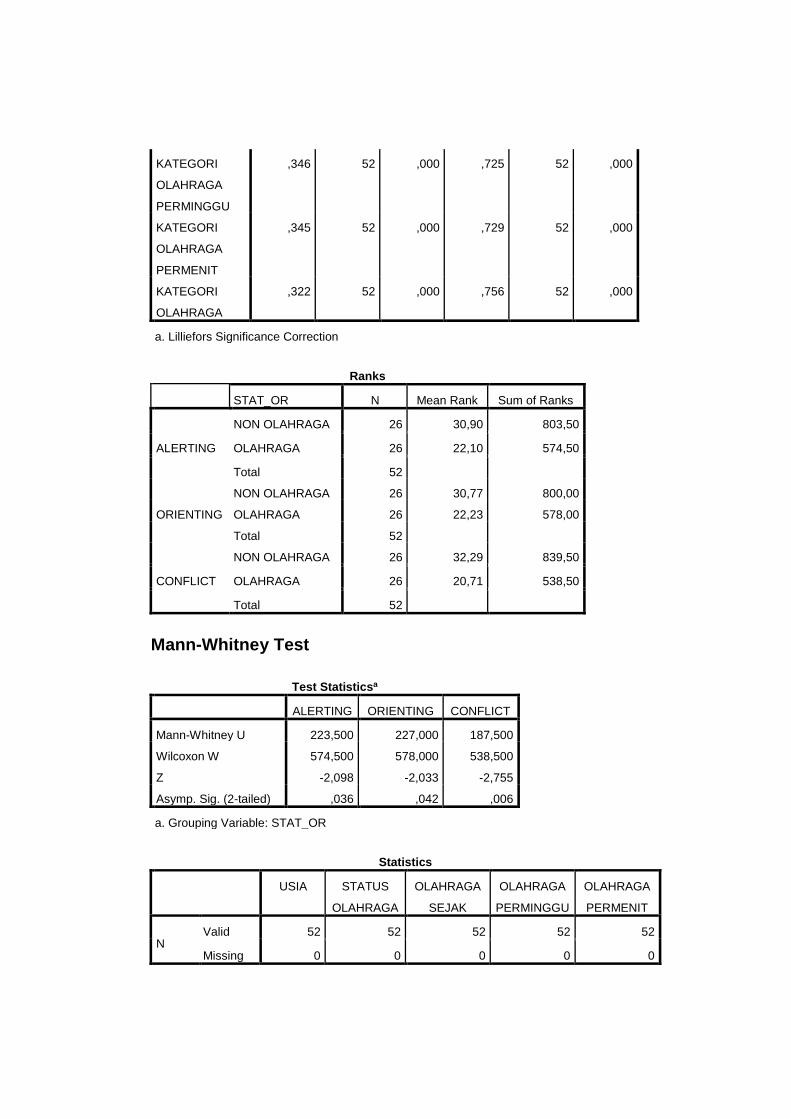
Ranks
STAT_OR N Mean Rank Sum of Ranks
ALERTING
NON OLAHRAGA 26 30,90 803,50
OLAHRAGA 26 22,10 574,50
Total 52
ORIENTING
NON OLAHRAGA 26 30,77 800,00
OLAHRAGA 26 22,23 578,00
Total 52
CONFLICT
NON OLAHRAGA 26 32,29 839,50
OLAHRAGA 26 20,71 538,50
Total 52
Mann-Whitney Test
Test Statisticsa
ALERTING ORIENTING CONFLICT
Mann-Whitney U 223,500 227,000 187,500
Wilcoxon W 574,500 578,000 538,500
Z -2,098 -2,033 -2,755
Asymp. Sig. (2-tailed) ,036 ,042 ,006
a. Grouping Variable: STAT_OR
Statistics
USIA STATUS
OLAHRAGA
OLAHRAGA
SEJAK
OLAHRAGA
PERMINGGU
OLAHRAGA
PERMENIT
N Valid 52 52 52 52 52
Missing 0 0 0 0 0

Frequency Table
USIA
Frequency Percent Valid Percent Cumulative
Percent
Valid
20 9 17,3 17,3 17,3
21 16 30,8 30,8 48,1
22 21 40,4 40,4 88,5
23 5 9,6 9,6 98,1
24 1 1,9 1,9 100,0
Total 52 100,0 100,0
STATUS OLAHRAGA
Frequency Percent Valid Percent Cumulative
Percent
Valid
NON OLAHRAGA 26 50,0 50,0 50,0
OLAHRAGA 26 50,0 50,0 100,0
Total 52 100,0 100,0
OLAHRAGA PERMENIT
Frequency Percent Valid Percent Cumulative
Percent
Valid
≥30 - ≤6 16 30,8 30,8 30,8
≥60 29 55,8 55,8 86,5
10 s.d. <30 7 13,5 13,5 100,0
Total 52 100,0 100,0
Explore
Case Processing Summary
Cases
Valid Missing Total
N Percent N Percent N Percent
ALERTING 52 100,0% 0 0,0% 52 100,0%
ORIENTING 52 100,0% 0 0,0% 52 100,0%
CONFLICT 52 100,0% 0 0,0% 52 100,0%

Descriptives
Statistic Std. Error
ALERTING
Mean 39,31 3,046
95% Confidence Interval for Mean Lower Bound 33,19
Upper Bound 45,42
5% Trimmed Mean 37,91
Median 36,00
Variance 482,374
Std. Deviation 21,963
Minimum 8
Maximum 111
Range 103
Interquartile Range 34
Skewness ,943 ,330
Kurtosis 1,090 ,650
ORIENTING
Mean 35,35 1,857
95% Confidence Interval for Mean Lower Bound 31,62
Upper Bound 39,07
5% Trimmed Mean 34,91
Median 34,50
Variance 179,368
Std. Deviation 13,393
Minimum 11
Maximum 69
Range 58
Interquartile Range 18
Skewness ,411 ,330
Kurtosis ,016 ,650
CONFLICT
Mean 87,08 4,320
95% Confidence Interval for Mean Lower Bound 78,40
Upper Bound 95,75
5% Trimmed Mean 87,06
Median 88,50
Variance 970,465
Std. Deviation 31,152
Minimum 19
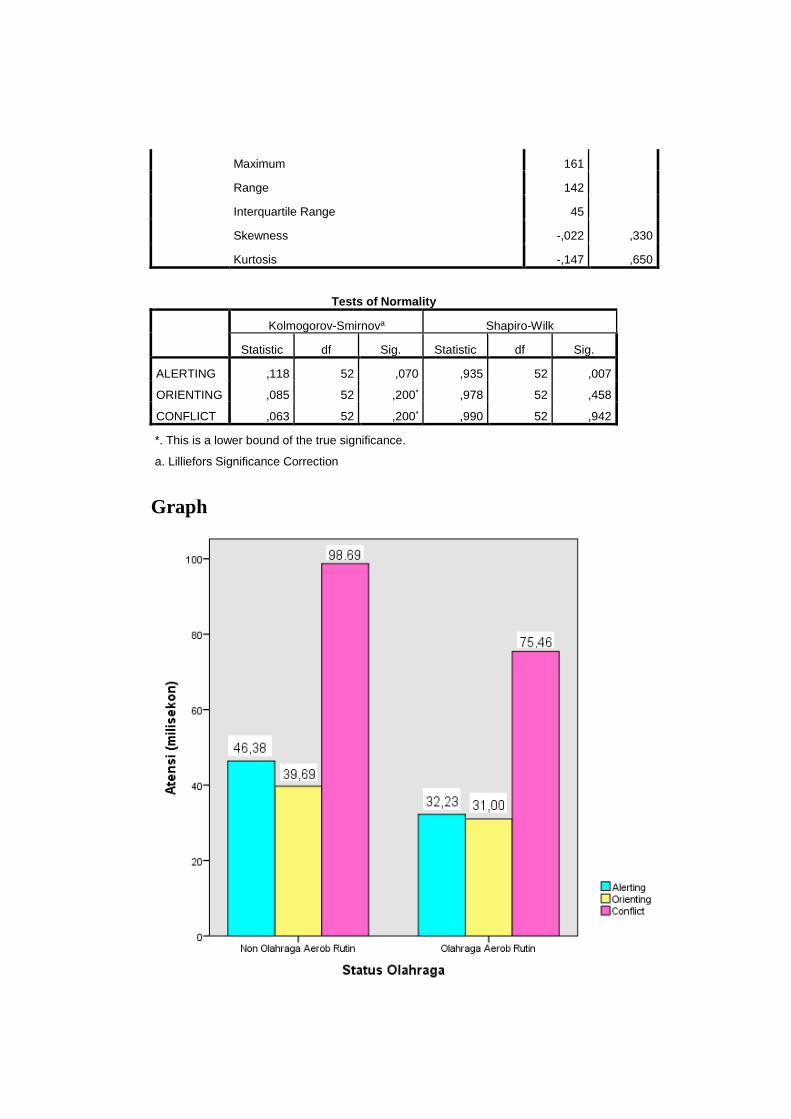
Maximum 161
Range 142
Interquartile Range 45
Skewness -,022 ,330
Kurtosis -,147 ,650
Tests of Normality
Kolmogorov-Smirnova Shapiro-Wilk
Statistic df Sig. Statistic df Sig.
ALERTING ,118 52 ,070 ,935 52 ,007
ORIENTING ,085 52 ,200* ,978 52 ,458
CONFLICT ,063 52 ,200* ,990 52 ,942
*. This is a lower bound of the true significance.
a. Lilliefors Significance Correction
Graph

Descriptives
Descriptive Statistics
N Minimum Maximum Mean Std. Deviation
ALERTING
OLAHRAGA
26 8,00 57,00 32,2308 16,31271
ALERTING NON
OLAHRAGA
26 16,00 111,00 46,3846 24,77430
ORIENTING
OLAHRAGA
26 11,00 49,00 31,0000 11,09955
ORIENTING NON
OLAHRAGA
26 18,00 69,00 39,6923 14,26259
CONFLICT
OLAHRAGA
26 25,00 131,00 75,4615 27,21063
CONFLICT NON
OLAHRAGA
26 19,00 161,00 98,6923 30,96291
Valid N (listwise) 0
Descriptives
Descriptive Statistics
N Minimum Maximum Mean Std. Deviation
USIA 26 21 22 21,62 ,496
STATUS
OLAHRAGA
26 1 1 1,00 ,000
KATEGORI
OLAHRAGA
SEJAK
26 1 3 1,38 ,697
KATEGORI
OLAHRAGA
PERMINGGU
26 2 4 2,81 ,749
KATEGORI
OLAHRAGA
PERMENIT
26 1 3 1,96 ,720
KATEGORI
OLAHRAGA
26 1 4 2,54 ,948
Valid N (listwise) 26
Explore
Case Processing Summary
Cases
Valid Missing Total
N Percent N Percent N Percent
USIA 26 100,0% 0 0,0% 26 100,0%
STATUS
OLAHRAGA
26 100,0% 0 0,0% 26 100,0%
KATEGORI
OLAHRAGA
SEJAK
26 100,0% 0 0,0% 26 100,0%
KATEGORI
OLAHRAGA
PERMINGGU
26 100,0% 0 0,0% 26 100,0%
KATEGORI
OLAHRAGA
PERMENIT
26 100,0% 0 0,0% 26 100,0%
KATEGORI
OLAHRAGA
26 100,0% 0 0,0% 26 100,0%
Descriptivesa
Statistic Std. Error
USIA
Mean 21,62 ,097
95% Confidence Interval for Mean Lower Bound 21,41
Upper Bound 21,82
5% Trimmed Mean 21,63
Median 22,00
Variance ,246
Std. Deviation ,496
Minimum 21
Maximum 22
Range 1
Interquartile Range 1
Skewness -,504 ,456
Kurtosis -1,899 ,887
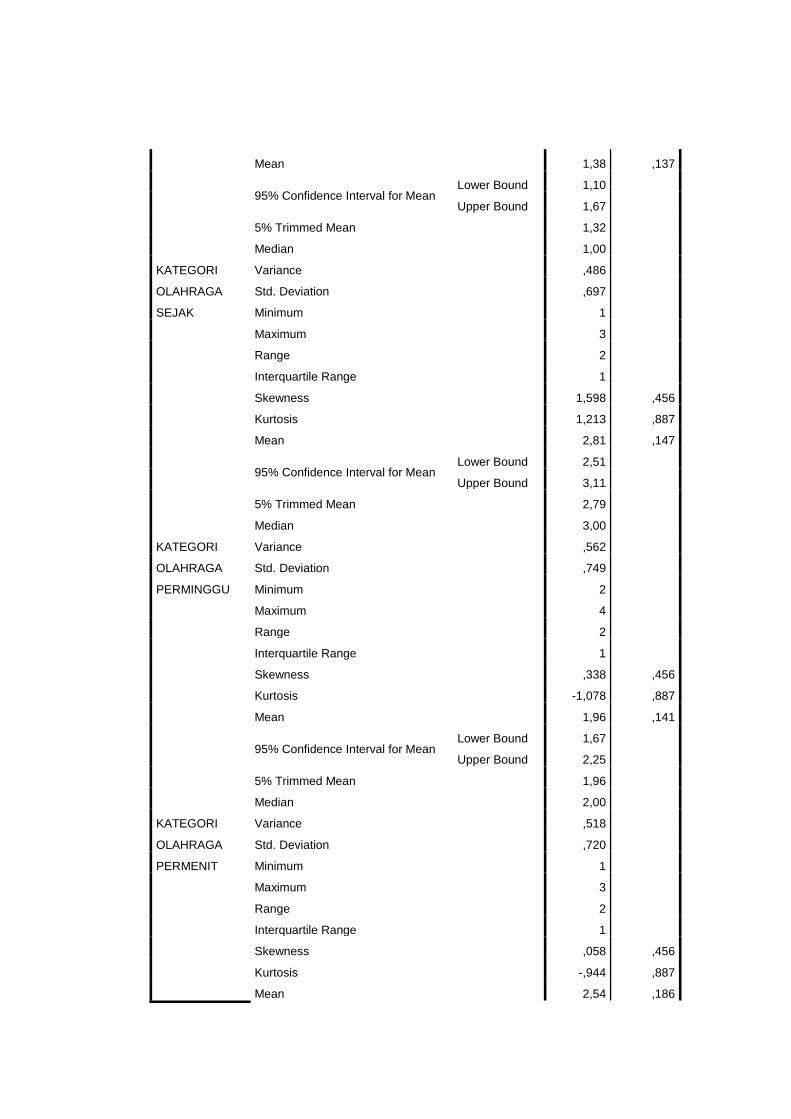
KATEGORI
OLAHRAGA
SEJAK
Mean 1,38 ,137
95% Confidence Interval for Mean Lower Bound 1,10
Upper Bound 1,67
5% Trimmed Mean 1,32
Median 1,00
Variance ,486
Std. Deviation ,697
Minimum 1
Maximum 3
Range 2
Interquartile Range 1
Skewness 1,598 ,456
Kurtosis 1,213 ,887
KATEGORI
OLAHRAGA
PERMINGGU
Mean 2,81 ,147
95% Confidence Interval for Mean Lower Bound 2,51
Upper Bound 3,11
5% Trimmed Mean 2,79
Median 3,00
Variance ,562
Std. Deviation ,749
Minimum 2
Maximum 4
Range 2
Interquartile Range 1
Skewness ,338 ,456
Kurtosis -1,078 ,887
KATEGORI
OLAHRAGA
PERMENIT
Mean 1,96 ,141
95% Confidence Interval for Mean Lower Bound 1,67
Upper Bound 2,25
5% Trimmed Mean 1,96
Median 2,00
Variance ,518
Std. Deviation ,720
Minimum 1
Maximum 3
Range 2
Interquartile Range 1
Skewness ,058 ,456
Kurtosis -,944 ,887
Mean 2,54 ,186
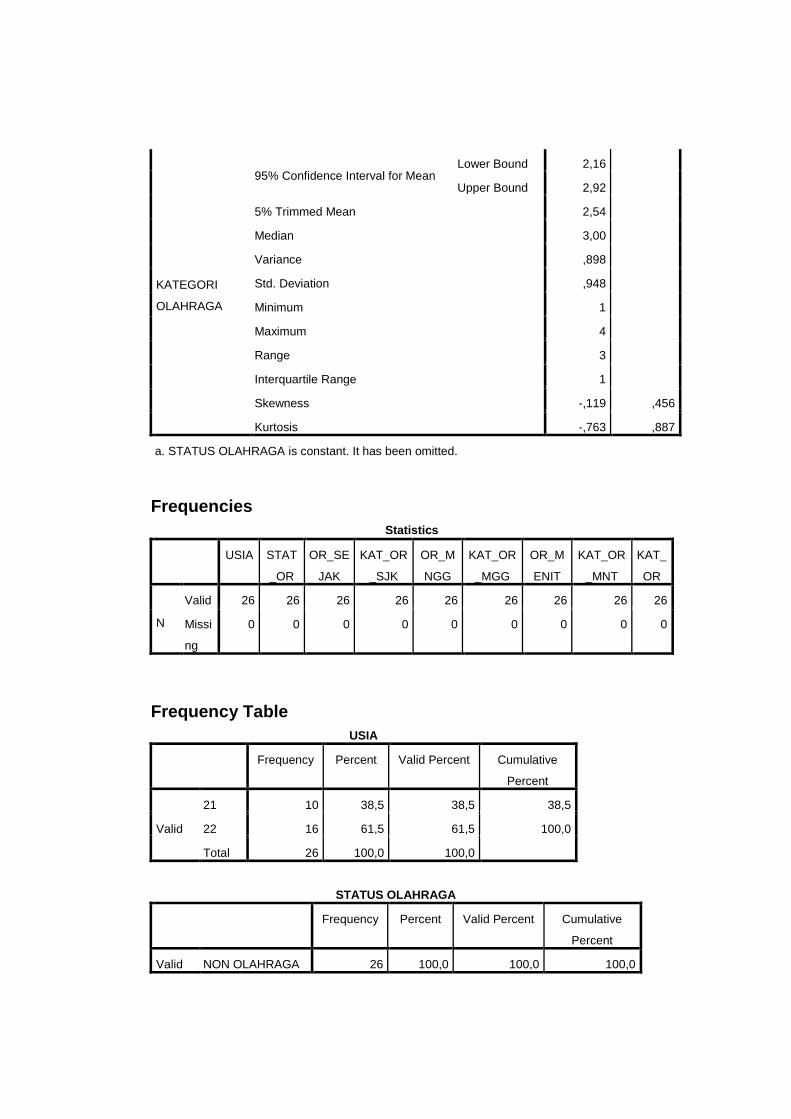
KATEGORI
OLAHRAGA
95% Confidence Interval for Mean Lower Bound 2,16
Upper Bound 2,92
5% Trimmed Mean 2,54
Median 3,00
Variance ,898
Std. Deviation ,948
Minimum 1
Maximum 4
Range 3
Interquartile Range 1
Skewness -,119 ,456
Kurtosis -,763 ,887
a. STATUS OLAHRAGA is constant. It has been omitted.
Frequencies
Statistics
USIA STAT
_OR
OR_SE
JAK
KAT_OR
_SJK
OR_M
NGG
KAT_OR
_MGG
OR_M
ENIT
KAT_OR
_MNT
KAT_
OR
N
Valid 26 26 26 26 26 26 26 26 26
Missi
ng
0 0 0 0 0 0 0 0 0
Frequency Table
USIA
Frequency Percent Valid Percent Cumulative
Percent
Valid
21 10 38,5 38,5 38,5
22 16 61,5 61,5 100,0
Total 26 100,0 100,0
STATUS OLAHRAGA
Frequency Percent Valid Percent Cumulative
Percent
Valid NON OLAHRAGA 26 100,0 100,0 100,0
OLAHRAGA SEJAK
Frequency Percent Valid Percent Cumulative
Percent
Valid
<2 BLN 19 73,1 73,1 73,1
2 BLN 4 15,4 15,4 88,5
3 BLN 3 11,5 11,5 100,0
Total 26 100,0 100,0
KATEGORI OLAHRAGA SEJAK
Frequency Percent Valid Percent Cumulative
Percent
Valid
<2BLN 19 73,1 73,1 73,1
2 BLN 4 15,4 15,4 88,5
3BLN 3 11,5 11,5 100,0
Total 26 100,0 100,0
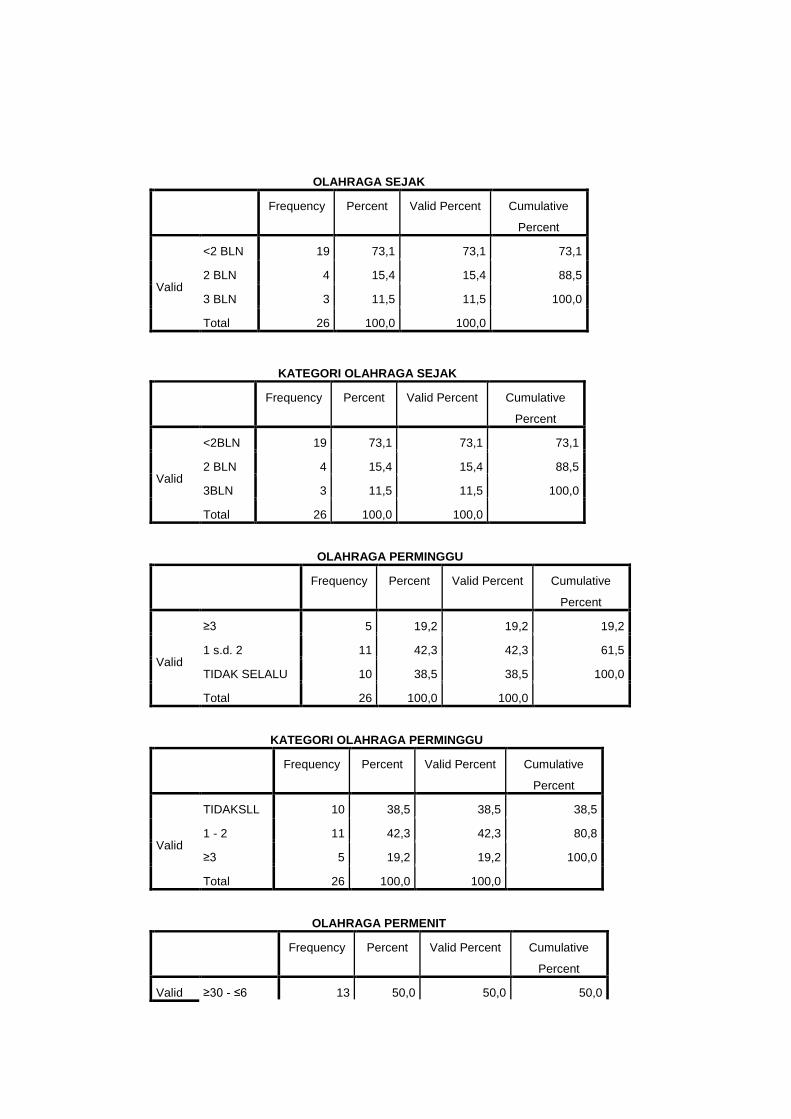
OLAHRAGA PERMINGGU
Frequency Percent Valid Percent Cumulative
Percent
Valid
≥3 5 19,2 19,2 19,2
1 s.d. 2 11 42,3 42,3 61,5
TIDAK SELALU 10 38,5 38,5 100,0
Total 26 100,0 100,0
KATEGORI OLAHRAGA PERMINGGU
Frequency Percent Valid Percent Cumulative
Percent
Valid
TIDAKSLL 10 38,5 38,5 38,5
1 - 2 11 42,3 42,3 80,8
≥3 5 19,2 19,2 100,0
Total 26 100,0 100,0
OLAHRAGA PERMENIT
Frequency Percent Valid Percent Cumulative
Percent
Valid ≥30 - ≤6 13 50,0 50,0 50,0

≥60 6 23,1 23,1 73,1
10 s.d. <30 7 26,9 26,9 100,0
Total 26 100,0 100,0
KATEGORI OLAHRAGA PERMENIT
Frequency Percent Valid Percent Cumulative
Percent
Valid
10 - <30 7 26,9 26,9 26,9
≥30 - <60 13 50,0 50,0 76,9
≥60 6 23,1 23,1 100,0
Total 26 100,0 100,0
KATEGORI OLAHRAGA
Frequency Percent Valid Percent Cumulative
Percent
Valid
OR <30 4 15,4 15,4 15,4
OR 30-74 8 30,8 30,8 46,2
OR 35-179 10 38,5 38,5 84,6
OR ≥180 4 15,4 15,4 100,0
Total 26 100,0 100,0
Descriptives
Descriptive Statistics
N Minimum Maximum Mean Std. Deviation
USIA 26 20 24 21,35 1,263
STATUS
OLAHRAGA
26 2 2 2,00 ,000
KATEGORI
OLAHRAGA
SEJAK
26 3 3 3,00 ,000
KATEGORI
OLAHRAGA
PERMINGGU
26 3 4 3,92 ,272
KATEGORI
OLAHRAGA
PERMENIT
26 2 3 2,88 ,326
KATEGORI
OLAHRAGA
26 3 4 3,92 ,272

Valid N (listwise) 26
Explore
Case Processing Summary
Cases
Valid Missing Total
N Percent N Percent N Percent
USIA 26 100,0% 0 0,0% 26 100,0%
STATUS
OLAHRAGA
26 100,0% 0 0,0% 26 100,0%
KATEGORI
OLAHRAGA
SEJAK
26 100,0% 0 0,0% 26 100,0%
KATEGORI
OLAHRAGA
PERMINGGU
26 100,0% 0 0,0% 26 100,0%
KATEGORI
PERMENIT
26 100,0% 0 0,0% 26 100,0%
KATEGORI
OLAHRAGA
26 100,0% 0 0,0% 26 100,0%
Descriptivesa,b
Statistic Std. Error
USIA
Mean 21,35 ,248
95% Confidence Interval for Mean Lower Bound 20,84
Upper Bound 21,86
5% Trimmed Mean 21,29
Median 21,00
Variance 1,595
Std. Deviation 1,263
Minimum 20
Maximum 24
Range 4
Interquartile Range 2
Skewness ,441 ,456
Kurtosis -1,047 ,887
Mean 3,92 ,053
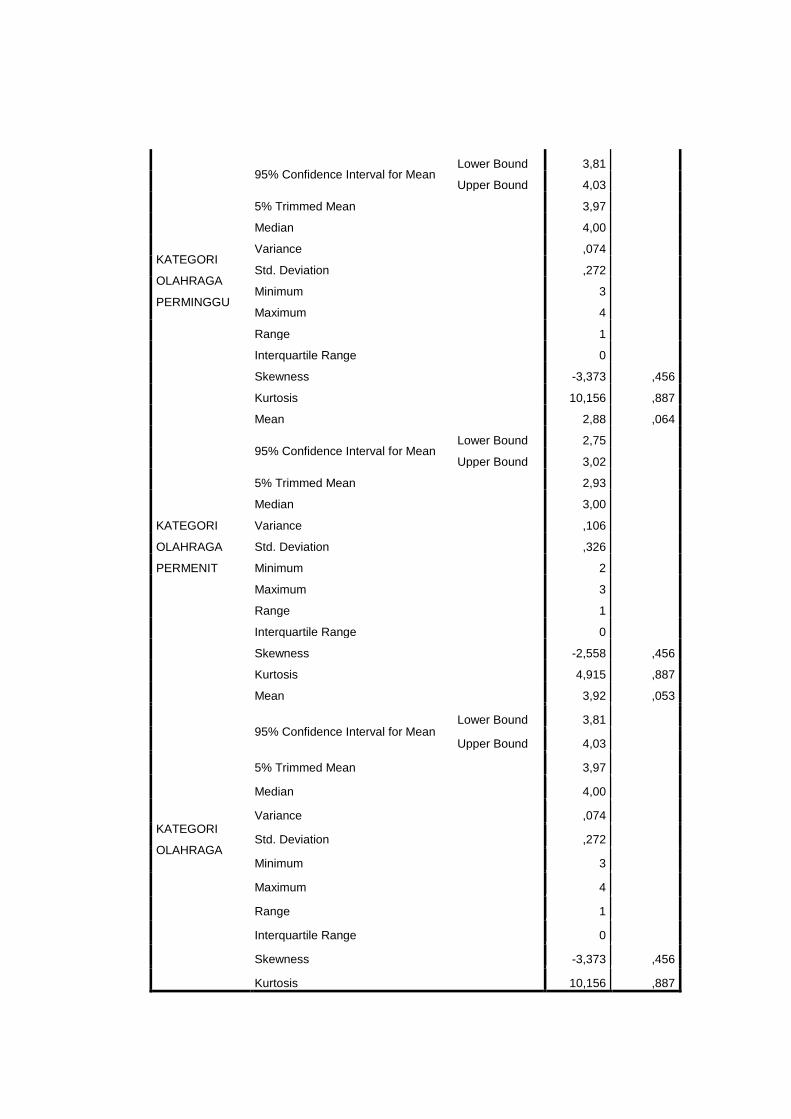
KATEGORI
OLAHRAGA
PERMINGGU
95% Confidence Interval for Mean Lower Bound 3,81
Upper Bound 4,03
5% Trimmed Mean 3,97
Median 4,00
Variance ,074
Std. Deviation ,272
Minimum 3
Maximum 4
Range 1
Interquartile Range 0
Skewness -3,373 ,456
Kurtosis 10,156 ,887
KATEGORI
OLAHRAGA
PERMENIT
Mean 2,88 ,064
95% Confidence Interval for Mean Lower Bound 2,75
Upper Bound 3,02
5% Trimmed Mean 2,93
Median 3,00
Variance ,106
Std. Deviation ,326
Minimum 2
Maximum 3
Range 1
Interquartile Range 0
Skewness -2,558 ,456
Kurtosis 4,915 ,887
KATEGORI
OLAHRAGA
Mean 3,92 ,053
95% Confidence Interval for Mean Lower Bound 3,81
Upper Bound 4,03
5% Trimmed Mean 3,97
Median 4,00
Variance ,074
Std. Deviation ,272
Minimum 3
Maximum 4
Range 1
Interquartile Range 0
Skewness -3,373 ,456
Kurtosis 10,156 ,887

a. STATUS OLAHRAGA is constant. It has been omitted.
b. KATEGORI OLAHRAGA SEJAK is constant. It has been omitted.
Frequencies
Statistics
USIA STAT
_OR
OR_SE
JAK
KAT_OR
_SJK
OR_M
NGG
KAT_OR
_MGG
OR_M
ENIT
KAT_OR
_MNT
KAT_
OR
N
Valid 26 26 26 26 26 26 26 26 26
Missi
ng
0 0 0 0 0 0 0 0 0
Frequency Table
USIA
Frequency Percent Valid Percent Cumulative
Percent
Valid
20 9 34,6 34,6 34,6
21 6 23,1 23,1 57,7
22 5 19,2 19,2 76,9
23 5 19,2 19,2 96,2
24 1 3,8 3,8 100,0
Total 26 100,0 100,0
STATUS OLAHRAGA
Frequency Percent Valid Percent Cumulative
Percent
Valid OLAHRAGA 26 100,0 100,0 100,0
OLAHRAGA SEJAK
Frequency Percent Valid Percent Cumulative
Percent
Valid 3 BLN 26 100,0 100,0 100,0
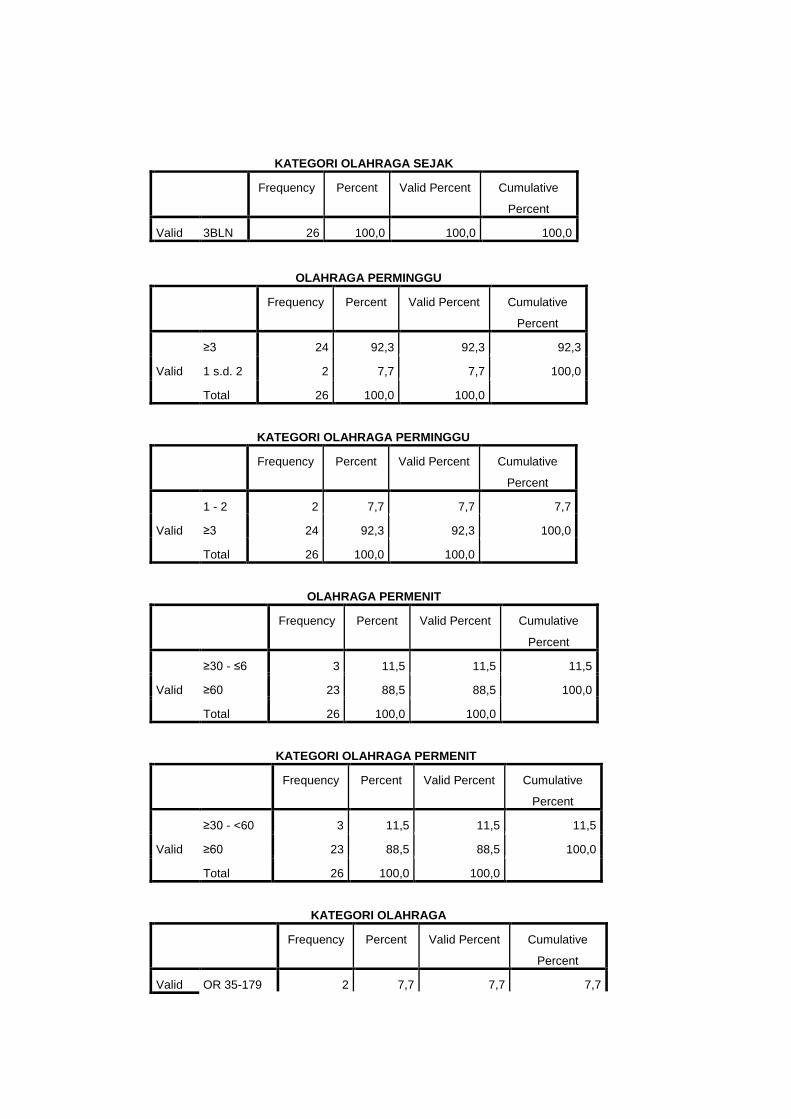
KATEGORI OLAHRAGA SEJAK
Frequency Percent Valid Percent Cumulative
Percent
Valid 3BLN 26 100,0 100,0 100,0
OLAHRAGA PERMINGGU
Frequency Percent Valid Percent Cumulative
Percent
Valid
≥3 24 92,3 92,3 92,3
1 s.d. 2 2 7,7 7,7 100,0
Total 26 100,0 100,0
KATEGORI OLAHRAGA PERMINGGU
Frequency Percent Valid Percent Cumulative
Percent
Valid
1 - 2 2 7,7 7,7 7,7
≥3 24 92,3 92,3 100,0
Total 26 100,0 100,0
OLAHRAGA PERMENIT
Frequency Percent Valid Percent Cumulative
Percent
Valid
≥30 - ≤6 3 11,5 11,5 11,5
≥60 23 88,5 88,5 100,0
Total 26 100,0 100,0
KATEGORI OLAHRAGA PERMENIT
Frequency Percent Valid Percent Cumulative
Percent
Valid
≥30 - <60 3 11,5 11,5 11,5
≥60 23 88,5 88,5 100,0
Total 26 100,0 100,0
KATEGORI OLAHRAGA
Frequency Percent Valid Percent Cumulative
Percent
Valid OR 35-179 2 7,7 7,7 7,7

OR ≥180 24 92,3 92,3 100,0
Total 26 100,0 100,0
Explore
Case Processing Summary
Cases
Valid Missing Total
N Percent N Percent N Percent
USIA 26 100,0% 0 0,0% 26 100,0%
Descriptives
Statistic Std. Error
USIA
Mean 21,62 ,097
95% Confidence Interval for
Mean
Lower Bound 21,41
Upper Bound 21,82
5% Trimmed Mean 21,63
Median 22,00
Variance ,246
Std. Deviation ,496
Minimum 21
Maximum 22
Range 1
Interquartile Range 1
Skewness -,504 ,456
Kurtosis -1,899 ,887
Tests of Normality
Kolmogorov-Smirnova Shapiro-Wilk
Statistic df Sig. Statistic df Sig.
USIA ,396 26 ,000 ,619 26 ,000
a. Lilliefors Significance Correction
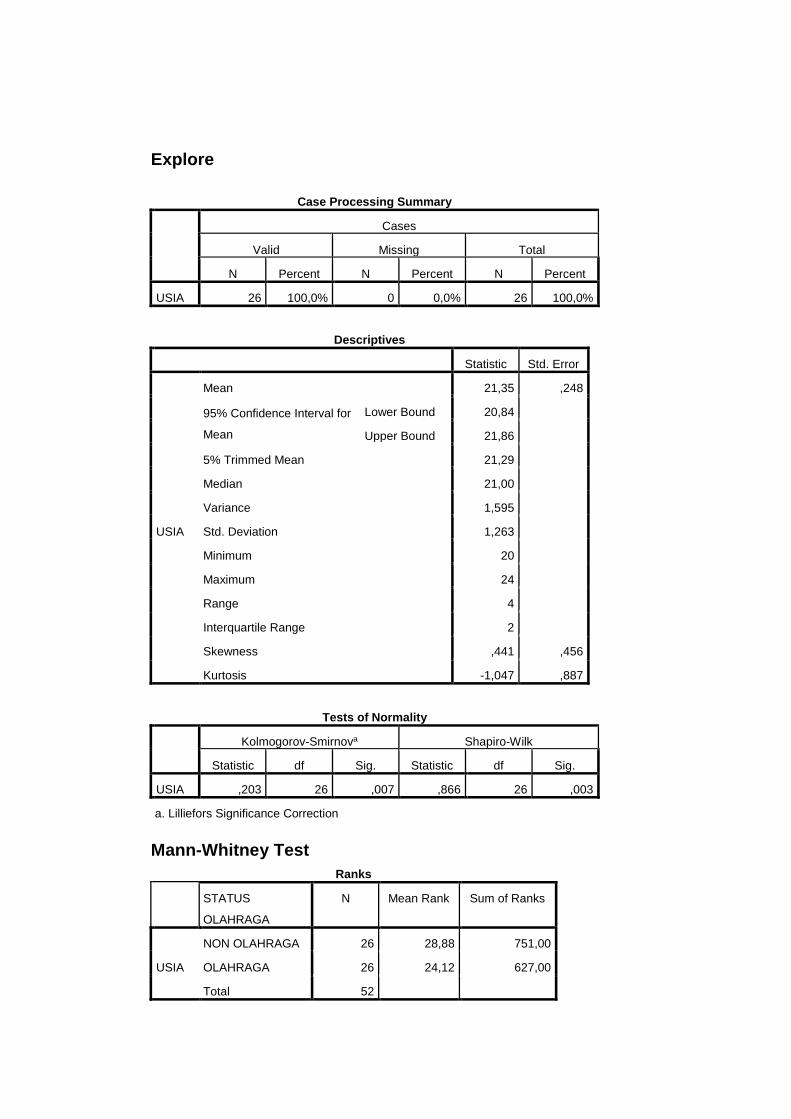
Explore
Case Processing Summary
Cases
Valid Missing Total
N Percent N Percent N Percent
USIA 26 100,0% 0 0,0% 26 100,0%
Descriptives
Statistic Std. Error
USIA
Mean 21,35 ,248
95% Confidence Interval for
Mean
Lower Bound 20,84
Upper Bound 21,86
5% Trimmed Mean 21,29
Median 21,00
Variance 1,595
Std. Deviation 1,263
Minimum 20
Maximum 24
Range 4
Interquartile Range 2
Skewness ,441 ,456
Kurtosis -1,047 ,887
Tests of Normality
Kolmogorov-Smirnova Shapiro-Wilk
Statistic df Sig. Statistic df Sig.
USIA ,203 26 ,007 ,866 26 ,003
a. Lilliefors Significance Correction
Mann-Whitney Test
Ranks
STATUS
OLAHRAGA
N Mean Rank Sum of Ranks
USIA
NON OLAHRAGA 26 28,88 751,00
OLAHRAGA 26 24,12 627,00
Total 52
Test Statisticsa
USIA
Mann-Whitney U 276,000
Wilcoxon W 627,000
Z -1,197
Asymp. Sig. (2-tailed) ,231
a. Grouping Variable: STAT_OR
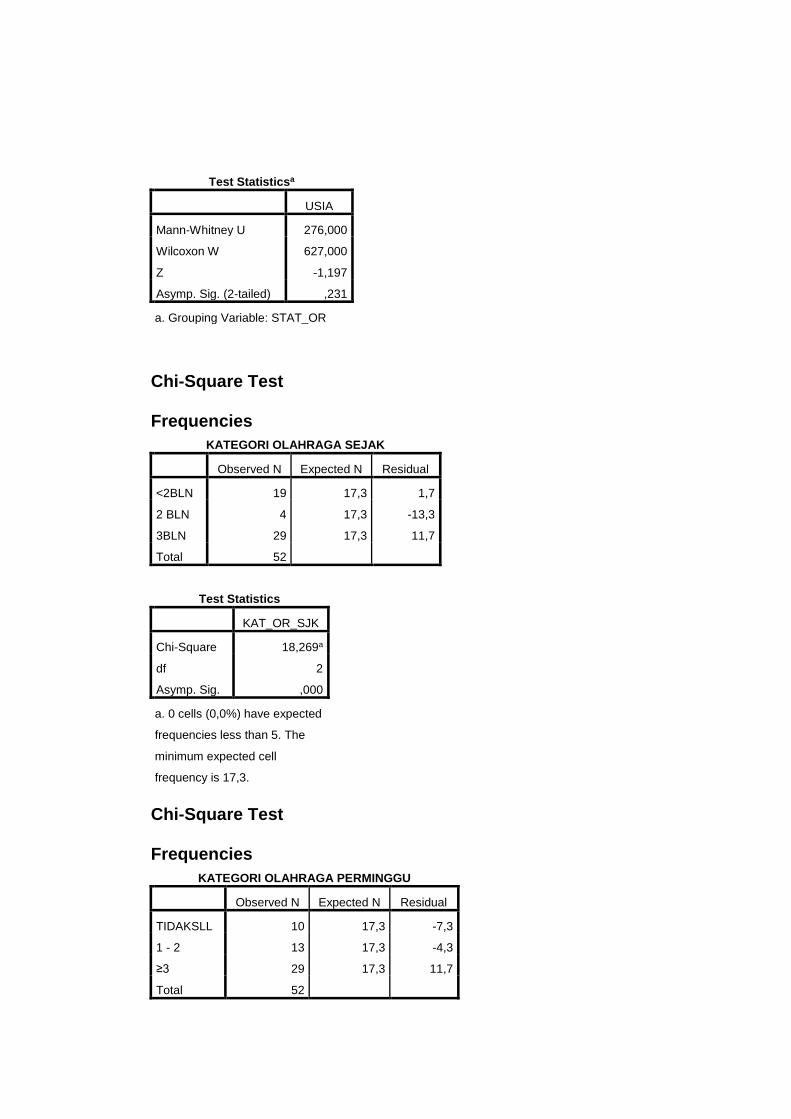
Chi-Square Test Frequencies
KATEGORI OLAHRAGA SEJAK
Observed N Expected N Residual
<2BLN 19 17,3 1,7
2 BLN 4 17,3 -13,3
3BLN 29 17,3 11,7
Total 52
Test Statistics
KAT_OR_SJK
Chi-Square 18,269a
df 2
Asymp. Sig. ,000
a. 0 cells (0,0%) have expected
frequencies less than 5. The
minimum expected cell
frequency is 17,3.
Chi-Square Test Frequencies
KATEGORI OLAHRAGA PERMINGGU
Observed N Expected N Residual
TIDAKSLL 10 17,3 -7,3
1 - 2 13 17,3 -4,3
≥3 29 17,3 11,7
Total 52
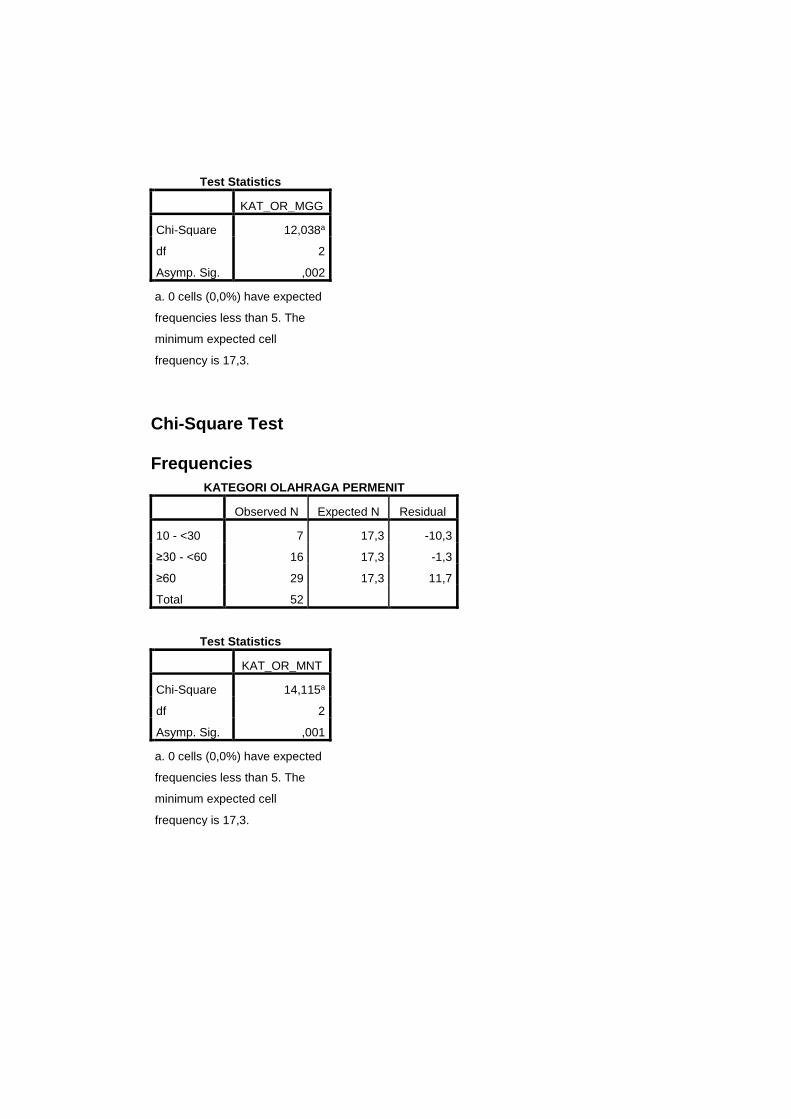
Test Statistics
KAT_OR_MGG
Chi-Square 12,038a
df 2
Asymp. Sig. ,002
a. 0 cells (0,0%) have expected
frequencies less than 5. The
minimum expected cell
frequency is 17,3.
Chi-Square Test Frequencies
KATEGORI OLAHRAGA PERMENIT
Observed N Expected N Residual
10 - <30 7 17,3 -10,3
≥30 - <60 16 17,3 -1,3
≥60 29 17,3 11,7
Total 52
Test Statistics
KAT_OR_MNT
Chi-Square 14,115a
df 2
Asymp. Sig. ,001
a. 0 cells (0,0%) have expected
frequencies less than 5. The
minimum expected cell
frequency is 17,3.
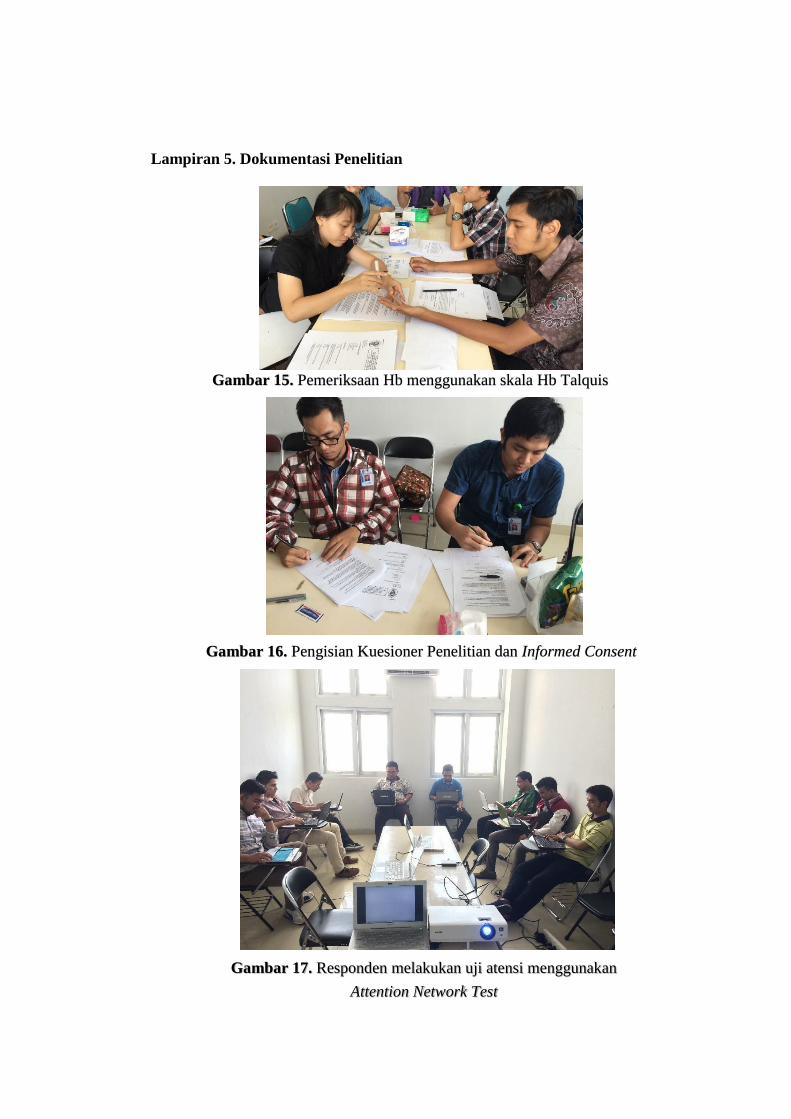
Lampiran 5. Dokumentasi Penelitian
Gambar 15. Pemeriksaan Hb menggunakan skala Hb Talquis
Gambar 16. Pengisian Kuesioner Penelitian dan Informed Consent
Gambar 17. Responden melakukan uji atensi menggunakan
Attention Network Test

Lampiran 6. Biodata Mahasiswa
Identitas
Nama : Ismi Mulyanti Putri
NIM : 22010111110153
Tempat lahir : Bandung
Tanggal lahir : 9 Januari 1994
Alamat : Letjend R. Soeprapto No. 21 Sidomulyo 20813
Stabat, Langkat, Sumatera Utara.
No. Hp : 08116021351
E-mail : [email protected]
Riwayat Pendidikan Formal
Keanggotaan Organisasi
1. Asian Medical Students Association (AMSA) Diponegoro University
tahun 2012 – 2013.
2. Badan Eksekutif Mahasiswa (BEM) Fakultas Kedokteran Universitas
Diponegoro tahun 2012 – 2014.
1. SD : SD Negeri 050661
Kuala Bingai
1. SMP : SMP Negeri 1
Stabat
2. SMA : SMA Negeri 1
Stabat
3. S1 : Pendidikan Dokter
Fakultas Kedokteran
Universitas Diponegoro
Lulus tahun : 2005
Lulus tahun : 2008
Lulus tahun : 2011
Masuk tahun : 2011