daewoo international corporation material... · - automotive components - electronic industry -...
TRANSCRIPT

March 2010
DaewooInternationalCorporation
DisclaimerAll information in this presentation regarding the company’s financial result has been
prepared on unconsolidated basis, in accordance with Korean GAAP.
This presentation may contain forward-looking statements. Statements that are not
historical facts, including statements about our belief and expectations, are forward-
looking statements. Actual results may differ materially from those expressed or
implied by these forward-looking statements

ContentsContents
COMPANY PROFILEI
KEY ISSUES
EARNINGS & FINANCIAL POSITION IN 2009II
III
MYANMAR OFFSHORE GAS FIELDSIV

Part I.Part I. COMPANY PROFILECOMPANY PROFILE
CHRONOLOGY
ORGANIZATION & PERSONNEL
SHAREHOLDING STRUCTURE
BUSINESS STRUCTURE
VISION & STRATEGY

5
Completed workout program (Dec.2003)
Spun off from Daewoo Corp. (Dec.2000)
2000 ~ 2003
Discovery of Mya gas field in block A-3 Myanmar (Jan.2006)
Discovery of Shwe Phyugas field in block A-1 Myanmar (Mar.2005)
Discovery of Shwe gas field in block A-1 Myanmar (Jan.2004)
Sales W5t in 2004
Credit Rating in 2004 BBB-(KIS)
2004 ~ 2006
GSPA of 3 Myanmar gas fields (Dec.2008)
Sales W11t in 2008(ranked 20th in sales vol. in KOSPI)
Gas reserves certification-GCA (Aug.2007)
Creit Rating in 2007A(Korea Rating, KIS)
2007 ~ 2008
Credit Rating in 2009A+(NICE)
Declaration ofCommerciality forMyanmar gas fields (Nov.2009)
2009
Chronology

6
Trading Overseas Branches
Overseas Subsidiaries DomesticManagement
5 Groups
16 Sales divisions
56 Sales teams
55 Branches & Agents
13 Trading firms
27 Subsidiaries
15 Resource projects
Busan factory
Daewoo dept. store3 Divisions
14 Teams
1 TFT
INTERNATIONALINTERNATIONAL DOMESTICDOMESTICHQ (Seoul)HQ (Seoul)
497 Koreans: 240 Factory: 595
Dept. store: 240186
Overseas Employees
(January 2010)
Employees Employees Employees
Overseas Network : 110
Total Employees : 16,138
Locals: 14,377
Organization & Personnel

7
(December 2009)
Foreign Investors7,015,980 (7.2%)
KAMCO34,757,710 (35.5%)
Individuals14,498,194
(14.8%)Domestic Institutions
8,905,570 (9.1%)
ESOP473,007 (0.5%)
Shareholding Structure
8 Korean Financial Institutions (Korea EXIM Bank, KDB Asst Mgt, Korea Finance Corp, Woori Bank, others) 32,187,978 (32.9%)
Joint Disposal AssociationSignatories : KAMCO and8 Financial InstitutionsRestriction on independent selling (Stock dividend shares are not restricted : 1,629,588 shares)Number of Shares held : 66,945,688 (68.4%)
Total Shares Outstanding : 97,838,439Total Shares Outstanding : 97,838,439

8
Business Group 1- Hot Rolled Steel- Cold Rolled Steel- Special Steel
Business Group 2- Machinary & Plant- Automotive Components- Electronic Industry- Textile
Business Group 3- Steel Raw Materials- Non-ferrous Metal- Metal
ResourceDevelopment Group- Commodity- Mineral Resource
Development- E&P Operation- Energy Development
Sales (Wb)
▶ Export 5,963.4▶ Trilateral 4,757.7▶ Domestic 426.9
2009 Annual Revenue 11,148b 2009 Operating Profit 171b
Business Structure
Business Group 4- Chemical

9
Monetization ofMyanmar gas
Building-upcore competencies
Foundation for growth
World-class company(2013 ~ 2015)
2nd Take-off(2007 ~ 2012)
Diversification of business portfolio(Spin-off ~ 2006)
* Global holding company * Achieve AAA Credit rating* Strengthening operation based
on IB / M&A* Raising revenue fromenergy & resource development
* Myanmar gas field development* Increasing Investment in
energy & resource development* Adding higher value to business
through diversification
* Trading performance advances * Enterprise operation integrated* Integrated risk management system built up
Vision & Strategy
“FORBES TOP 500”

Part II.Part II. EARNINGS & FINANCIAL EARNINGS & FINANCIAL POSITION IN 2009POSITION IN 2009
EARNINGS RESULT
SALES BREAKDOWN
NON-OPERATING ITEMS
FINANCIAL POSITION
INVESTMENTS
BORROWINGS
FINANCIAL RATIOS

11
OperatingProfit(%)
20062006
77.71.22%
Sales 6,383.6
Pretax Profit(%)
154.42.42%
Net Profit(%)
112.81.77%
20072007
91.91.18%
7,816.1
128.91.65%
102.01.30%
20082008
156.31.42%
11,045.8
105.00.95%
88.00.80%
20092009
171.31.54%
11,148.0
178.91.60%
124.61.12%
Growth(YoY)
Growth(YoY)
9.60%
0.93%
70.27%
41.60%
(Wb)
Earnings Result

12
20062006
6,384
(Wb)
20072007
7,816
20082008
11,046
20092009
11,148
3,85160.3%
2,27935.7%
2544.0%
4,21854.0%
3,28642.0%
3124.0%
6,14155.6%
4,62541.9%
2802.5%
5,96353.5%
4,75842.7%
4273.8%
1,73327.1%
1,52623.9%
1,09217.1%
77112.1%
1,26219.8%
2,12427.2%
2,10426.9%
1,23615.8%
1,07613.8%
1,27616.3%
3,90735.4%
2,85225.8%
1,61514.6%
1,35412.3%
1,31811.9%
3,92535.2%
2,69224.1%
1,68415.1%
1,26611.4%
1,58114.2%
Sale
s Ty
peSa
les
Type
Sale
s It
emSa
les
Item
Export Trilateral trade Domestic
Steel & Metal Steel raw materialNon-ferrous metal
Chemical Commodities Others
Sales Breakdown

13
107.389.0 88.1
98.0
-49.5 -48.9
-73.2 -92.918.9
-3.1
-66.2
2.4
76.7 37.0 -51.3
Kyobo 86.4 95.3 44.4 135.0
Korea LNG 12.9 11.2 25.6 15.4
Other Equity Method Investments 8.0 -17.5 18.1 -52.4
Net Interest -7.0 -6.8 -3.1 -27.8
Loss on Disposal ofAccounts Receivable
-42.5 -42.1 -70.1 -65.1
Gain/Loss of FX 9.2 -21.8 -83.8 9.5
Other Non-Operating Gain/Loss 9.7 18.7 17.6 -7.1
Fina
ncia
l Co
stO
ther
Equi
ty M
etho
d
2006
2006 2007 2008 2009
7.52007 2008 2009
(Wb)
Non-Operating Items

14
Financial PositionFinancial Position
Total Assets
Total Liabilities
Equities
Non-current Liab.LT Debts
Current LiabilitiesST Debts
Non-current AssetsInvestments
20072006
2,164.11,928.8
1,175.81,019.0
988.3909.8
445.5161.7
336.8205.7
730.3128.1
682.233.4
1,387.31,146.9
1,127.9900.3
2008
2,675.3
1,604.8
1,070.5
473.9157.4
1,130.9282.2
1,628.71,386.6
1,046.4298.3
776.8274.1
800.9202.0
Current AssetsCash & ST Instruments
2009
3,885.2
2,495.5
1,389.7
1,045.9656.7
1,449.6154.6
2,127.81,835.2
1,757.4937.0
(Wb)
Financial Position

15
36.1
177.6
415.2
63.4
249.1
567.0
271.4
267.4
2007
900.3 1,146.9 1,386.6
2008 2009
1,835.2
120.3
458.8
850.0
406.1
74.5
389.8
538.0
384.3
Other Investments
E&P Investments
Kyobo Life Insurance
Other Equity Method Investments
2006
(Wb)
Investments

16
9.3
205.7
60.5
161.7
67.624.1 228.5
157.4
53.7
2006 2007 2008
• Straight Bonds issued in Feb. 2009 : W149.5 billion of book value as of Dec.31
• Convertible Bonds issued in Jul. 2009 : W356.0 billion of book value as of Dec.31
239.1 289.8
439.6
139.3
151.2
15.3
2009
811.3
505.5
Short-term Borrowings
Trade Finance
Long-term Borrowings
Bonds
(Wb)
Borrowings

17
Sales & Operating ProfitSales & Operating Profit
12t
10t
8t
6t
220b
180b
140b
100b
Sales (LHS)(CAGR: 20% )
Operating Profit (RHS)(CAGR: 30% )
W 6.4t
W 7.8t
W 11.0t W 11.1t
W 78bW 92b
W 156bW 173b
4t 60b2007 2008 20092006
Financial LeverageFinancial Leverage
200
150
100
50
80
60
40
20
Liability-to-Equity (LHS)
Borrowing-to-Equity(RHS)
112 119
150
179
26 29
41
58
0 02007 2008 20092006
10.0
ROE & ROAROE & ROA
15.0
7.5
5.0
2.5
0.0
10.0
12.5
6.0
4.0
2.0
0.0
8.0
ROE% (LHS)
ROA% (RHS)
12.9
10.7
8.5
10.56.2
5.0
3.6 3.9
2007 2008 20092006
P/E & P/BP/E & P/B
40.0
30.0
20.0
10.0
0.0
8.0
6.0
4.0
2.0
0.0
P/E (LHS)
P/B (RHS)
32.936.9
24.5 25.14.1
3.8
2.0 2.3
2007 2008 20092006
Financial Ratios

Part III.Part III. KEY ISSUES KEY ISSUES
KYOBO LIFE INSURANCE SHARES
E&P PORTFOLIO – GEOGRAPHICAL SPREAD
E&P ACTIVITIES (OIL & GAS)
E&P ACTIVITIES (MINERAL RESOURCES)

19
Condensed Financial Information
Kyobo Life Insurance Overview
Founded in 1958 CEO : C. J. Shin since 2000 (33.6% stake)Credit Rating :
Daewoo’s shares : 4.92 million shares→ Book value : W 850b(BPS W 172,758)
as of Dec. 31, 2009
Kyobo Life Insurance Shares
InsuranceFinancial Strength Rating
A2 Moody’s
AAA NICE
Subordinated Bond Credit Rating
AA+KISKorea Ratings
Kyobo Life Insurance Holdings(December 2009)
Kyobo Life Insurance Holdings(December 2009)
Shin Family 40.27 %
Daewoo Int’l 24.00 %
KAMCO 9.93 %
Korea EXIM 5.85 %
Others 19.95 %
TOTAL 100.00 %
Mar.2007 Mar.2008 Mar.2009 Dec.2009
Assets W42.5t W46.2t W50.0t W53.2t
Equities W1.7t W2.4t W2.9t W3.5t
Sales W12.2t W12.3t W12.7t W9.3t
N.Profit W289.3b W433.5b W291.6b W383.5b
Note) Sales and net profit of Dec. 2009 are presented for9 months ended Dec. 31, 2009

20
9 Oil & Gas Projects 6 Mineral Resource Projects
RUSSIARUSSIAWest Kamchatka
CANADACANADAKiggavik (uranium)
PERUPERU8 (oil)
MYANMARMYANMARA-1 (gas)
(Operator)
VIETNAMVIETNAM11-2 (gas)
MYANMARMYANMARA-3 (gas)
(Operator)
MYANMARMYANMARAD-7
(Operator)
OMANOMANKOLNG
MADAGASCARMADAGASCARAmbatovy (nickel)
UZBEKISTANUZBEKISTAN35 (Operator)UZBEKISTANUZBEKISTAN
36 (Operator)
E&P Portfolio - Geographical Spread
AUSTRALIAAUSTRALIAWhite Cliff (nickel)
BOLIVIABOLIVIACorocoro (copper)
AUSTRALIAAUSTRALIAMarree (uranium)
AUSTRALIAAUSTRALIANarrabri (coal)

21
E&P Activities (Oil & Gas)ProjectProject EquityEquity ReserveReserve History & StatusHistory & Status RemarksRemarks
Peru block 8(oil field) 11.7% 40 MM bbl - 1996: Participation (operator : Pluspetrol)
- Production: 15,000 bbl/day (crude oil)
- Earnings: US$ 9.6mm in 2009US$ 15.5mm in 2008 US$ 10.0mm in 2007
Oman KOLNG
(LNG plant)
20%(1% of OLNG) 14 TCF
- 1997: Participation (operator : Shell)- 2000: Production (dividend since 2002)- Annual capacity : 6.6mmMT
- Earnings: US$ 12.0mm in 2009US$ 23.2mm in 2008US$ 12.0mm in 2007
Vietnam offshore block 11-2(gas field)
4.9%(6.5% of KC)
0.9 TCF23 MM bbl
- 1992: Participation (operator : KNOC)- Dec 2006: commercial gas production- Production : 140mmscf/day (Gas)
4,100 bbl/day (Condensate)
- Earnings: US$ 2.2mm in 2009US$ 5.1mm in 2008US$ 3.4mm in 2007
Myanmar offshore block A-1(gas field)
51% (*Operator)
3.3 ~ 5.6TCF
- Jan 2004: Discovery of Shwe gas field- Mar 2005: Discovery of Shwe Phyu gas field- Aug 2006: Certification of reserves in Shwe &
Shwe-Phyu gas fields (from GCA)- Dec 2008: GSPA (CNUOC)
- EPCIC Contractor Selection &Declaration of Commercialityin Nov. 2009
- Gas Sales in 2013
Myanmar offshore block A-3(gas field)
51% (*Operator)
1.3 ~ 2.2TCF
- Jan 2006: Discovery of Mya gas field- Aug 2007: Certification of reserves in Mya
gas field (from GCA)- Dec 2008: GSPA (CNUOC)
- EPCIC Contractor Selection &Declaration of Commercialityin Nov. 2009
- Gas Sales in 2013
Myanmar offshore block AD-7
100% (*Operator) n/a
- Feb 2007: Signed Production sharing contract- 2007: 2D seismic acquisition & interpretation- 2008: 3D seismic survey
Uzbekistanblock 35 & 36
100% (*Operator) n/a
- Feb 2008: Signed Exploration Agreement - Satellite Image Analysis, Gravity & Magnetic Survey in 2009
Russia West Kamchatka
offshore block
4%(10% of KC) n/a
- Dec 2005: Participation (operator: Gazprom)- 2005~2007: 2D & 3D seismic acquisition &
interpretation - Jul 2008 : Drilled explanatory well
- Jul 09, operator replacement(Rosneft → Gazprom)
Note) “KC” : Korean Consortium, “TCF” : Trillion Cubic Feet, “KNOC” : Korea National Oil Corporation, “GCA” : Gaffney, Cline & Associates
ENER
GY
RES
OU
RC
ES
PRO
DU
CTI
ON
DEV
ELO
PMEN
TEX
PLO
RA
TIO
N

22
ProjectProject EquityEquity ReserveReserve RemarksRemarks
MadagascarAmbatovy
(nickel)
2.75% (10% of KC) 125 MM tons
- 2006: Participation - Operator: Sherritt (Canadian)- Parties: Sherritt 40%, Sumitomo 27.5%,
KC 27.5% (KORES 21%) - Production in 2010 (Production period : 27 years)- Annual Capacity : Nickel 60,000 MT, Cobalt 5,600 MT
AustraliaNarrabri
(coal)5.0% 230 MM tons
- Aug 2009: Participation- Operator : Whitehaven (Australian)- Parties : Whitehaven 70%, KORES 2.5%- Annual Capacity : 6 mm MT ( Production in 2010)
Canada Kiggavik(uranium)
1.7% 104 MM lbs
- 1983: Participation - Parties: AREVA (Canada) 64.8%, JCU Canada 33.5%- 1997: Completion of pre-feasibility study- 2005: Reorganize project team- 2006~2007: Conduct viability study- 2008~2011 : Environmental assessment study, F/S
AustraliaWhite Cliff
(nickel)
25%(50% of KC) n/a
- 2008: Participation - Parties: White Cliff Nickel 50% (Australian)
KC 50% (KORES 25%, DWIC 25%)- Exploration in progress
AustraliaMarree
(uranium)
10%(20% of KC) n/a
- 2008: Participation - Parties: Scimitar 50% (Australian)
KC 50% (KORES 20%, DWIC 10% , others)- Exploration in progress
BoliviaCorocoro(copper)
5%(11% of KC) n/a
- 2008: Participation - Parties: COMIBOL 55% (Bolivian)
KC 45% (KORES 23%, LS-Nikko 7%, others)- Exploration in progress
Note) “KC” : Korean Consortium / “KORES” : Korea Resources Corporation
E&P Activities (Mineral Resources)M
INER
AL
RES
OU
RC
ES
DEV
ELO
PMEN
TEX
PLO
RA
TIO
N

Part IV.Part IV. MYANMAR GAS FIELDSMYANMAR GAS FIELDS
MYANMAR OFFSHORE BLOCKS
MYANMAR GAS FIELDS
MILESTONE PLANS
DEVELOPMENT CONCEPT – OVERVIEW
GAS SALES & PURCHASE AGREEMENT (GSPA)
FINANCING PLAN

24
1. Project : Myanmar block A-1 (since Aug 2000) Area: 2,119 km2
Contract Type: Production sharing Ownership: Daewoo International 51% (Operator)
ONGC Videsh 17%, MOGE 15%, KOGAS 8.5%, GAIL 8.5%
2. Project : Myanmar block A-3 (since Feb 2004)
Area: 3,441 km2
Contract Type: Production sharing Ownership: Daewoo International 51% (Operator)
ONGC Videsh 17%, MOGE 15%, KOGAS 8.5%, GAIL 8.5%
3. Project : Myanmar block AD-7 (Feb 2007)
Area: 1,684 km2
Contract Type: Production sharing
Ownership: Daewoo International 100% (Operator)
Myanmar Offshore Blocks
25
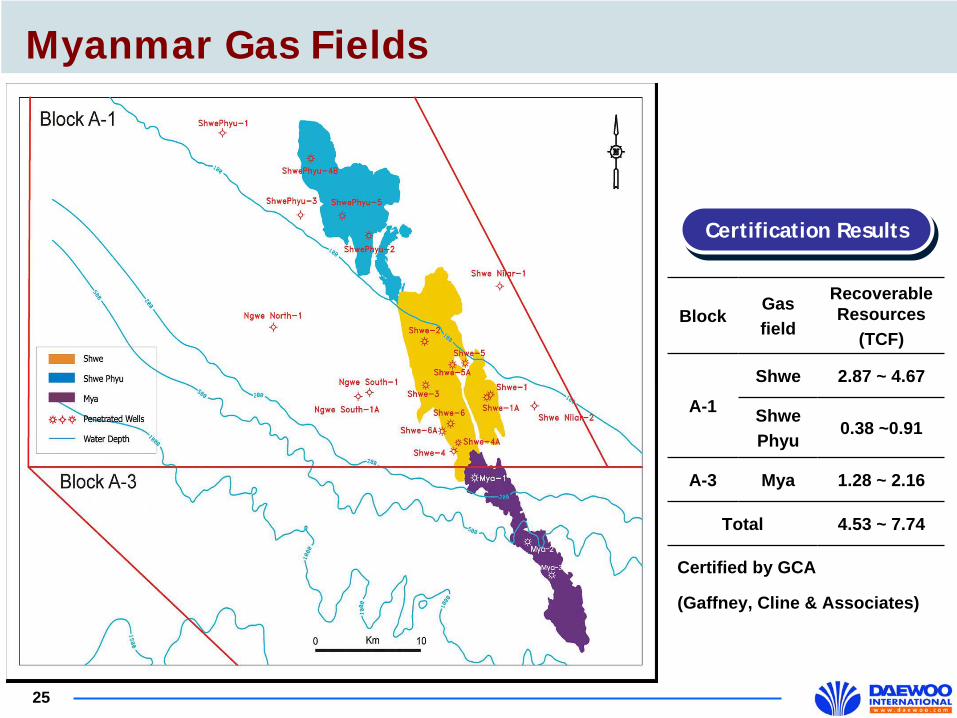
Myanmar Gas Fields
Certification ResultsCertification Results
BlockGasfield
Recoverable Resources
(TCF)
A-1
Shwe 2.87 ~ 4.67
ShwePhyu
0.38 ~0.91
A-3 Mya 1.28 ~ 2.16
Total 4.53 ~ 7.74
Certified by GCA
(Gaffney, Cline & Associates)

26
Gas Sales MOU
Jun.2008
GSPA
Dec.2008
Declaration of
Commerciality /
EPCIC contractor
Selection
Nov.2009
EPCIC Period
2009~2013
Initial Gas Supply
May 2013
Construction & Fabrication
Procurement
Detailed Engineering
Installation & Hook-up
Gas Supply
20092009 20102010 20112011 20122012 20132013
※ GSPA : Gas Sales & Purchase Agreement, EPCIC : Engineering, Procurement, Construction, Installation & CommissioningFDP : Field Development Plan
Milestone Plans
Gov.’t Approval
of FDP /
EPCIC Contract
Feb.2010

27
Development Concept - Overview
880k
m
Chinese Border
40”X
825
km

28
Signing DateSigning Date
• 24th December 2008
Contract PartiesContract Parties
• Seller : Daewoo International Corp./ONGC/MOGE/GAIL/KOGAS
• Buyer : China National United Oil Corporation
* Guaranteed by China National Petroleum Corporation
Main ContentsMain Contents
• The sales of natural gas produced in Blocks A-1/A-3 to CNUOCthrough pipeline for about 30 years
• Daily supply during the Plateau Period : 500 mmscf• Gas sales price : floating with oil price & price index
Gas Sales & Purchase Agreement (GSPA)

29
Financing Plan
Procuring corporate financing from foreign financial institutions
Credit risk will be covered by Overseas Investment Insurance
Upstream and Offshore MidstreamUpstream and Offshore Midstream
Daewoo’s CAPEX : US$ 1.7 b (including production platform, offshore pipeline and onshore pipeline)
Expected Pre-Production CAPEXExpected Pre-Production CAPEX
Financing Investment
Debt Service Gas Sales Revenue
Overseas InvestmentInsurance
DAEWOOINTERNATIONAL
Gas Fields
InsuranceCompany
Syndicated Loan
Lead Arranger(Security Package)

Thank you!