d4.2 - intra-system offloading innovative concepts and ... deliverable d4.2 - intra... · capacity...
TRANSCRIPT

Public page 1 of 94
SHARING
SELF-ORGANIZED HETEROGENEOUS ADVANCED RADIO NETWORKS
GENERATION
Deliverable D4.2
Intra-system offloading: innovative concepts and performance evaluation
Date of delivery 21/01/2015
Contractual date of delivery 31/12/2014
Project number C2012/1-8
Editor(s) Edgar Ramos (ERICSSON)
Author(s) Edgar Ramos (ERICSSON),
Gregory Gougeon, Julien Stephan, Mathieu Brau, Yoann Corre, Yves Lostanlen (SIR),
Ana Galindo-Serrano, Sofia Martínez López, Yasir Khan (FT), Javier Valiño (TTI), Mohamad Assaad (SUP)
Dissemination level PU
Workpackage 4
Version V1.0
Total number of pages 94
Abstract:
In order to address the rapidly increasing data traffic volumes, one efficient way to enhance the system performance is to densify the network, either by deploying new macro cells, or with the help of heterogeneous network deployments. However, together with the network densification, several new challenges appear, related to for example the inter-cell interference and the overall cost of deployment. This deliverable presents the SHARING innovations and concepts within the area of intra-system offloading. The presented innovations are related to SON-based load balancing and inter-cell interference management, load balancing with the help of large scale antenna systems or middleware deployment, mobility management between macro and low-power nodes, and backhaul offloading via proactive caching of data. As indicated by the results, the presented innovations are indeed able to enhance the system performance both in terms of coverage and capacity, which can be expected to contribute to lower CAPEX and OPEX for the operators.

Celtic-Plus SHARING Document D.4.2
Public page 2 of 94
Keywords:
Offloading, Balancing, Performance, Heterogeneous Networks, RRM, SON, WiFi, Backhaul, Energy-Efficiency, Spectrum, Management, Algorithm
Document Revision History
Version Date Author Summary of main changes
0.1 22/09/2014 Edgar Ramos Initial draft
0.2-0.12 Several authors Partner contributions
0.13 17/11/2014 Edgar Ramos First complete draft
0.14-0.15 Kimmo Hiltunen Review phase/Second stable draft
1.0 05/01/2015 Kimmo Hiltunen Final version

Celtic-Plus SHARING Document D.4.2
Public 3 (94)
TABLE OF CONTENTS
EXECUTIVE SUMMARY .............................................................................................................. 5
1 INTRODUCTION ................................................................................................................. 9
2 SON-BASED LOAD BALANCING AND INTERFERENCE MANAGEMENT ................................ 11
2.1 LOAD BALANCING BY DEPLOYING POWER OPTIMIZATION IN LTE MACROCELL NETWORKS ...............................11
2.1.1 Introduction ...........................................................................................................11
2.1.2 Solution description .................................................................................................11
2.1.3 Scenario ................................................................................................................12
2.1.4 Prediction Quality of the Kriging Model .......................................................................12
2.1.5 Results ..................................................................................................................13
2.1.6 Conclusions ............................................................................................................16
2.2 CAPACITY OPTIMIZATION THROUGH ACTIVE ANTENNA SYSTEMS IN LTE MACRO CELL NETWORKS .....................16
2.2.1 Introduction ...........................................................................................................16
2.2.2 Scenario and Results ...............................................................................................17
2.2.3 Conclusions ............................................................................................................20
2.3 ANTENNA TILT OPTIMIZATION FOR INTERFERENCE MANAGEMENT IN LTE-A HETEROGENEOUS NETWORK DEPLOYMENTS ...................................................................................................................................21
2.3.1 Introduction ...........................................................................................................21
2.3.2 Scenario ................................................................................................................21
2.3.3 Results ..................................................................................................................21
2.3.4 Conclusions ............................................................................................................22
2.4 ENHANCED INTER-CELL INTERFERENCE COORDINATION FOR INTERFERENCE MANAGEMENT IN LTE-A NETWORKS ..23
2.4.1 Introduction ...........................................................................................................23
2.4.2 Scenario ................................................................................................................23
2.4.3 Results ..................................................................................................................24
2.4.4 Conclusions ............................................................................................................26
2.5 MOBILITY LOAD BALANCING IN LTE MACROCELL NETWORKS ..............................................................26
2.5.1 Introduction ...........................................................................................................26
2.5.2 Scenario and results ................................................................................................27
2.5.3 Conclusions ............................................................................................................29
2.6 CELL VIRTUALIZATION BASED ON LARGE SCALE ANTENNA SYSTEM .......................................................29
2.6.1 Introduction ...........................................................................................................29
2.6.2 Simulation tools ......................................................................................................30
2.6.3 Results ..................................................................................................................31
2.6.4 Conclusions ............................................................................................................35
2.7 INTRA-LTE OFFLOADING BY MIDDLEWARE DEPLOYMENT ...................................................................35
2.7.1 Introduction ...........................................................................................................35
2.7.2 Common data model ...............................................................................................37
2.7.3 Simulator definition and requirements .......................................................................39
2.7.4 Assumptions and strategies ......................................................................................41
2.7.5 Results ..................................................................................................................44
2.8 DYNAMIC UPLINK-DOWNLINK OPTIMIZATION IN TDD-BASED SMALL CELL NETWORKS .................................47
3 MOBILITY MANAGEMENT ................................................................................................. 52
3.1 COMBINED CELL PERFORMANCE WITHIN HSPA HETEROGENEOUS NETWORK DEPLOYMENT ..............................52
3.1.1 Introduction ...........................................................................................................52
3.1.2 Impact of combined cell deployments on mobility ........................................................55
3.1.3 Initial performance results for SFN mode....................................................................55
3.1.4 Conclusions ............................................................................................................57
3.2 UPLINK/DOWNLINK SPLIT WITHIN A HETEROGENEOUS LTE NETWORK ...................................................57
3.2.1 Conclusions ............................................................................................................57
3.2.2 Uplink simulation results ..........................................................................................59
3.2.3 Downlink simulation results ......................................................................................62
3.2.4 Conclusions ............................................................................................................63
4 BACKHAUL MANAGEMENT ................................................................................................ 65
4.1 BACKHAUL OFFLOADING BY PROACTIVE CACHING ...........................................................................65
4.1.1 Introduction ...........................................................................................................65
4.1.2 Evaluation and results ..............................................................................................67
5 HETEROGENEOUS NETWORK DEPLOYMENTS – PERFORMANCE AND STRATEGIES ............ 70

Celtic-Plus SHARING Document D.4.2
Public page 4 of 94
5.1 FUNDAMENTAL PERFORMANCE LIMITS OF HETEROGENEOUS NETWORKS .................................................. 70
5.2 ASYMPTOTIC PERFORMANCE ANALYSIS AND DESIGN OF WIRELESS NETWORKS UNDER HEAVY TRAFFIC ............... 71
5.2.1 Interest of Heavy Traffic Modeling ............................................................................ 71
5.2.2 Brief description of the contribution .......................................................................... 71
5.2.3 System Model ........................................................................................................ 72
5.2.4 Numerical Results ................................................................................................... 74
5.2.5 Conclusion ............................................................................................................. 75
5.3 PERFORMANCE OF HETEROGENEOUS NETWORK DEPLOYMENTS IN A LARGE-SCALE REAL ENVIRONMENT ............... 76
5.3.1 Small cell densification design and performance evaluation under realistic traffic demand rise ............................................................................................................................ 76
5.3.2 Impact of wireless NLOS backhaul design on small cell deployments and end-user
experience ......................................................................................................................... 83
5.3.3 Conclusion ............................................................................................................. 86
6 CONCLUSIONS ................................................................................................................. 88
7 REFERENCES .................................................................................................................... 89
GLOSSARY .............................................................................................................................. 91

Celtic-Plus SHARING Document D.4.2
Public 5 (94)
EXECUTIVE SUMMARY
This deliverable provides the description and evaluation of innovation proposals and
challenges by the SHARING partners related to work package 4, task 4.1 (Intra-system
offloading) for SON and/or heterogeneous network deployments. In addition to the concept
descriptions, this deliverable presents some evaluation results, where available.
The concepts presented within the area of SON-based load balancing and interference
management are:
• Load balancing by deploying power optimization in LTE macrocell networks. A
novel centralized recursive self-optimization methodology for LTE load balancing based
on pilot power optimization is proposed. The concept uses a statistical surrogate model
for the parameter-KPI relations and a pattern search algorithm for high dimensional
optimization. The proposed approach is advantageous as the algorithm uses extremely
small number of noisy observations to build a high dimensional surrogate and
subsequently finds the optimum using few iterations, thus making the approach ideal
for operators to implement at the OMC level.
• Capacity optimization through active antenna systems in LTE macrocell
networks. A centralized self-optimization framework is proposed to be applied for
AAS-based constrained capacity optimization in LTE-A. Statistical learning is used to
model the RRM-KPI functional relationships and a pattern search algorithm is applied
in an iterative manner to optimize the network capacity using different capacity-based
objective functions. The optimization is shown to result in best-case network
improvements up to 90.43%. Furthermore, the technique is demonstrated to be robust
for complex, large parameter space network optimization problems, in terms of faster
convergence using very few initial NP-KPI data points.
• Antenna tilt optimization for interference management in LTE-A
heterogeneous network deployments. A surrogate-based self-optimization
framework for improving QoS in heterogeneous LTE-A networks is presented.
Optimization is carried out for two objective functions: cell-edge and cell-center
optimization. For both the objective functions, AAS-based optimization performs well
with possible performance gains results of up to 35% for cell-edge SINR and 45% for
cell-center SINR.
• Enhanced inter-cell interference coordination for interference management in
LTE-A networks. A centralized recursive self-optimization algorithm is presented for a
heterogeneous LTE-A network deployment with RE + TDM eICIC. The algorithm is
based on the use of a surrogate of the network model and a search and poll algorithm
for optimization. The proposed approach is advantageous as the algorithm approaches
to the global optimum in the first update thanks to the surrogate, and the network
continues to operate at this near optimal parametric setting as the algorithm locally
searches the global optimum. This makes the algorithm well suited for self-
optimization on an operational network.
• Mobility load balancing in LTE macrocell networks. Results on the self-
optimization of handover margin for mobility load balancing in LTE networks is
presented. The impact of changes to handover margin on base station mean load and
other QoS KPIs such as BCR and DCR is provided.
Celtic-Plus SHARING Document D.4.2
Public page 6 of 94
• Cell virtualization based on large scale antenna system. The concept of virtual
small cells is presented, where large antenna arrays at macrocells are used to focus
the energy towards a traffic hotspot. As with traditional heterogeneous networks, this
creates areas with enhanced SINR and increases the resource reuse of the system (cell
splitting gain). The results show that the introduction of virtual small cells can improve
the mobile network throughput when compared with a situation where only macrocells
are deployed. For a dense urban scenario with full buffer model, system-level
simulations show that the average user throughput is increased by 50%. In addition,
virtual small cells are shown to reduce the consumed power by 27% compared to the
only-macrocell case, while a deployment with traditional picocells leads to a 7% higher
power consumption compared to virtual small cells. However, the downside of virtual
small cells compared to picocells is that the system performance becomes worse due
to higher path losses between the virtual small cells and the users.
• Intra-LTE offloading by middleware deployment. Deploying the proposed IP-
based middleware in charge of interchanging information between users and the
network, makes it possible to trigger centralized decisions to allocate users in the best
base station and, thus, balance the traffic handled by small cells and macrocells. Given
the baseline considerations it is possible to assess high potential gains in terms of
overall QoS of the network, obtaining theoretical gains of up to 25% in terms of QoS
enhancement at user side. These results have been obtained through multiple
simulations modelling a system where a 24-hour load period is generated and tested
over all possible scenarios.
The concepts presented from the mobility management solutions are:
• Combined cell performance within HSPA heterogeneous network deployment.
The deployment of combined cells is expected to improve the spatial reuse of the
codes used for the transmissions. In order to do this, HSPA standardization changes
are required. Also the combined cell deployments are expected to improve the
receiving and transmitting diversity of the areas of coverage. This should be translated
in improvements in throughput, especially for uplink transmissions. In this work, this
claim is supported by the simulation results that also indicate an increase in the area
load capacity. Additionally to the diversity gain, the users benefit from a lower
probability of signalling failure due to handover procedures that otherwise would be
required if the same area whould be covered by a heterogenous network deployment.
• Uplink/Downlink split within a heterogeneous LTE network. The simulations
show, that using uplink/downlink separation results in gains in uplink transmissions.
The gains are measured from the mean FTP rates of the users in scenarios both with
and without uplink/downlink separation. The highest gains seem to result from a highly
loaded system and relatively high CURE such as 16 – 20 dB. With downlink traffic, the
simulations show that using uplink/downlink separation results in decreased
performance. This is explained by downlink transmissions not benefitting from the
increased capacity in uplink, since the uplink transmissions contain only small size TCP
acknowledgements. On the contrary, the increased round trip time caused by the
backhaul delay between the secondary and the master eNodeB negatively affects the
TCP slow start. This can be seen from the protocol simulation results where small file
sizes were used. The delay in the uplink signaling causes delay in the downlink
transmissions and therefore decreased performance.

Celtic-Plus SHARING Document D.4.2
Public 7 (94)
The concept presented within the area of backhaul management solutions is:
• Backhaul offloading by proactive caching. In this work a decentralized caching
solution to maximize the backhaul offloading in small cell networks is proposed. This is
done by exploiting the storage capabilities at the small cell base station in which
contents are precached at strategic times to satisfy users' QoS requirements. The
caching strategy is evaluated in a variety of scenarios as a function of storage
constraints, wireless backhaul links, and content popularity.
Finally, on the evaluation of performance and stragegies of heterogenous network
deployments, the following studies are presented:
• Fundamental performance limits of heterogeneous networks. The objective of
this study is to investigate and analyze the performance of heterogeneous cellular
networks as a means to quantify the improvement in terms of coverage and rate by
using such topologies. The final results of this study are not yet available in this
deliverable.
• Asymptotic performance analysis and design of wireless networks under
heavy traffic. The study focuses in beamforming and power allocation in a wireless
network under heavy traffic limit. The objective is to keep the queue outage probability
under a certain threshold while the channel evolves according to an ergodic Markov
chain. For that, the allocation is divided into two parts: i) equilibrium part allocated
depending on the channel statistics, and ii) drift part which is a function of the
backlogged queues of the users at each time. Under this model, it is shown that the
scaled queue can be modeled as a reflected diffusion process. This allows to derive a
closed form expression of the allocated power and beamforming and a closed form
expression of the outage probability.
• Performance of heterogeneous network deployments in a large-scale real
environment. The main objective of the study is to identify network deployment rules
that would allow achieving optimal performance from multiple key indicators taking
into account a realistic and well accepted forecast over a period of five years of
wireless data traffic demand growth. A first study under ideal backhaul assumption
evaluates three different small cell deployment topologies with different inter-site
distances. Results show that the highest tested offloading configuration (small cell
transmit power of 5 W and CRE of 12 dB) and largest tested ABS duty cycle (25%)
leads to the best user QoS. The highest tested small cell densification (ISD equal to 50
m) generally gives the best coverage and highest peak throughputs; and it is the only
one supporting the four-year traffic growth tested in the study. All these results tend
to demonstrate the interest of deploying small cells to jointly absorb expected traffic
increase and reduce downlink energy consumption. A second study focuses on the
wireless backhaul design to relay the user data between the small cell layer with ISD
equal to 200 m to the core network at Y5. A basic approach consisting of a manual
attachement of small cells to hubs and median antenna orientations shows very poor
performance, making the wireless backhaul introduce a bottleneck in the network. An
automated approach is proposed instead where the selection of the hub candidates,
the small cell attachments and the antenna orientations are all together optimized. It
results in a much better performing wireless backhaul where 74% of the small cells

Celtic-Plus SHARING Document D.4.2
Public page 8 of 94
can be served with the required downlink throughput, and hubs, which are co-located
with the macro eNodeBs, experience an average load of 45%.

Celtic-Plus SHARING Document D.4.2
Public 9 (94)
1 INTRODUCTION
Traffic in the mobile networks is expected to grow very rapidly in the coming years
[Cis14][Eri13]. This traffic growth will be caused both by the evolution of mobile terminals (an
increasing penetration of smartphones, tablets and mobile computers) and the increased use
of more traffic-heavy services, especially video. It is also expected that the wider introduction
of various cloud-based services and machine-to-machine communication will accelerate the
traffic growth even further.
In general, there are three possible ways to increase the capacity of a mobile network:
increased spectrum, improved spectral efficiency and network densification. From the
spectrum point of view, the capacity can be enhanced by deploying additional carriers, or by
increasing the carrier bandwidth. The spectral efficiency can be improved both by improving
the signal-to-interference-ratio for the link between the transmitter and the receiver and by
introducing new techniques to enhance the utilization of the high signal-to-interference ratio
conditions. These techniques include for example advanced multi-antenna techniques (for
example MIMO and beamforming), higher order modulations and advanced interference
management (for example interference cancellation, inter-cell interference coordination and
coordinated multipoint transmission and reception). However, although the achievable
capacity gains via additional spectrum, and improvements in spectral efficiency are
considerable, the substantial growth that is predicted for the mobile broadband revolution will
require also actions to densify the mobile networks, i.e., to increase the spatial reuse of the
radio resources.
The traditional way to densify mobile networks has been to deploy new macrocells, either by
adding new sectors to existing sites, or by deploying new macro sites. The benefit of a
densified macro deployment is that the network performance can be improved with a fairly
small amount of required new hardware, or new sites. However, as new macro sites are
becoming increasingly difficult and often expensive to deploy, at least within urban
environments, focus is put on the efforts to find more cost-efficient ways to densify the
current networks.
An alternative to deploying new macro sites is to deploy low-power sites within traffic
hotspots, i.e., the introduction of heterogeneous network deployments. In case of the
heterogeneous network deployment, macro cells will provide wide area coverage, while the
small low-power cells deployed within traffic hotspots will take care of the majority of the
traffic volume. The downside of heterogeneous network deployments compared to the
densified macro deployments is that a considerably larger number of new cells is required to
be able to offer the same system performance. Even though the cost of a low-power site is
usually lower than the cost of a macro site, the overall situation may turn out to be quite
challenging from the total network cost point of view.
The total cost of the network deployment consists of a large number of different components,
related to both the capital expenditure (CAPEX) and the operational expenditure (OPEX).
Examples of the CAPEX-related components include the base station equipment, site
equipment and network roll-out. The OPEX-related components include for example site
rental, energy, and operation and maintenance. The total cost of the network deployment can
be reduced for example by improving the cell capacity and coverage, by introducing various
types of SON functions, and by introducing different kinds of energy saving mechanisms.

Celtic-Plus SHARING Document D.4.2
Public page 10 of 94
SHARING Work Package 4 looks into many of the topics listed above. Task 4.1 investigates
ways to perform intra-RAT traffic offloading as efficiently as possible, including topics such as
load balancing and interference management, mobility management, and backhaul offloading
This deliverable presents an initial view on new opportunities, challenges and innovative
concept candidates for SON and heterogeneous network deployments. Chapters 2 to 4
present concepts from Task 4.1 of SHARING WP4. Furthermore, Chapter 5 discusses the
performance and deployment strategies of heterogeneous network deployments within
different scenarios.
There are several areas that can be targeted with the innovations related to traffic offloading.
The first group would belong to optimization of mobility management parameters in order to
adjust the cell sizes and the intended coverage areas. This is useful in particular for the
heterogeneous network deployments, where the cells might have overlapping coverage areas
aimed to provide enhanced coverage and capacity within specific areas. The network would
then decide how to move traffic between the overlapping cells in order to maximize
performance, capacity, resource utilization as well as energy efficiency, which are becoming
more important nowadays. These factors are applicable also for the introduction of new and
less traditional deployments and their interactions and coexistence with legacy systems,
where traditional mobility procedures, channel estimation and link adaptation might not be
applicable. The second group of innovations aims to handle the capacity and performance
requirements by managing the available spectrum in order to reduce the interference
between neighbouring transmission points and at the same time maximize the system
performance. Finally, the third group of innovations targets the optimization of the use of the
backhaul connection.
The heterogeneous nature of the deployments targeted by the innovations has inherent
challenges that have to be addressed. The first of those challenges is the power imbalance
between the overlapping cell layers. The difference in transmission power between the small
cells and the macrocells has an impact on the perceived interference between the cells that
affects the power control algorithms, the cell selection procedures and indirectly the control
channel quality and channel estimation. Additionally, some of the regularly used algorithms to
optimize the mobility parameters in macro environments are not possible to be scaled down
for small cell environments, such as calculation of the UE speed and estimation of the UE
location. Another challenge related to the power imbalance is the actual detection of the small
cells, especially when the cell layers are operating on different carrier frequencies.
Yet another aspect of the heterogeneous network deployments is their flexibility, meaning
that some deployments might be used “when required” to assist the network to provide the
desired capacity or performance. Due to this flexibility the environment and the performance
have to be monitored in different parts of the network in order to provide the decision bases
to network controllers to activate or deactivate features and deployment options. The
collection of the required KPIs, measurements and activity in the network is itself an
additional challenge together with the actual organization and processing of the data that in
many cases is distributed and might accumulate large volumes of information and the final
execution of the configuration decision, especially challenged in distributed environments. It is
important to keep in mind that the decisions to modify the network setup will have a direct
impact on the balance between network performance, capacity and energy consumption.

Celtic-Plus SHARING Document D.4.2
Public 11 (94)
2 SON-BASED LOAD BALANCING AND INTERFERENCE MANAGEMENT
The load balancing and interference management requires the interaction of several metrics
and system input in order to provide the necessary level of adjustment of power, antenna
orientations, carrier selection, intercell coordination, cell borders and cell coverage,
transmission patterns, etc. The complexity required to maintain the measurement systems
and the process of the correct response requires intelligent algorithms taking into account
variations of inputs and the subsequent output feedback in the system. These self-organized
systems can be both of distributed and centralized nature and they have an important impact
on the system performance. The following sections will focus on describing the SHARING
partners’ innovations in this area.
2.1 Load balancing by deploying power optimization in LTE macrocell networks
2.1.1 Introduction
Optimization of wireless networks is a challenge for operators. In this work we propose a
methodology for a self-optimizing Radio Access Network (RAN) which adapts the transmitted
pilot power according to the current load of the base stations to carry out load balancing. The
methodology uses a surrogate function to model the functional relationships between noisy
Key Performance Indicators (KPIs) and Radio Resource Management (RRM) parameters, and
subsequently performs optimization of the model using a pattern search algorithm in an
iterative manner. The methodology is applied to solve a high dimension self-optimization
problem for coverage based load balancing in an LTE-A network.
2.1.2 Solution description
The objective of this scenario is to carry out load balancing based on pilot power optimization.
The self-optimization algorithm balances/equalizes the loads of the congested cells and the
neighbouring cells thereby improving the Quality of Service (QoS) in the congested cell. The
solution follows an iterative self-optimization framework as detailed in Section 2.1.1.2 of
[D.4.1] consisting of:
• Model sub-block, which takes in the data point, appends it to the existing data set and
updates the Kriging model.
• Optimization sub-block, which uses the real relationships (surrogates) and uses a
sequential optimization technique called search and poll algorithm to obtain the
optimum pilot power settings
The optimum pilot power settings are then fed into the simulator block to obtain the next data
point in an iterative manner.
Optimization objective
Denoting the total transmit power of cell � as �� (dBm) and the vector of total transmit powers
by x = �PPP�…P ��, respectively, the objective function of load balancing can be written as:
Commentaire [KH1]: FT
Celtic-Plus SHARING Document D.4.2
Public page 12 of 94
�∗ = argmin� �����. �.��� ≤ �� ≤ ��"�∀� ∈ % ∪ % (1)
where f�x� = max�load�x�, … , load,�x�,… load �x��, load,�x� is the load of cell � ∀� ∈ % ∪ % and ��� , ��"� are the minimum and the maximum allowable total transmit power values to prevent
capacity and coverage issues such as coverage holes and pilot pollution.
2.1.3 Scenario
This performance evaluation is related to SHARING scenario 2.1.2 defined in Section 2.1.2 of
[D.2.2]. The self-optimization is carried out for the second busiest hour of the day, i.e.,
optimum total transmit power settings are found for the traffic values of the second busiest
hour as described in Section 2.1.1.3 of [D.4.1]. The optimized network settings are then
applied to all the hours of the day.
The scenario is further detailed in Section 2.1.1.3 of [D.4.1]. Simulation parameters are
provided as part of the description of scenario 2.1.2 [D.2.2].
2.1.4 Prediction Quality of the Kriging Model
First, the prediction quality of Kriging on the above described pilot power based Load
Balancing (LB) problem is evaluated. For this, classical prediction quality metrics, such as the
coefficient of determinationR = 1 − 0012300454, the mean squared error MSE = 9∑ ;<=>?@=ABC=DE F and
coefficient of variation CV = 0I<J × 100 has been used as performance indicators, where
SSMN, = ∑ ;yP −m<PAFPQ is the residual sum of squares, SSRSR = ∑ �yP − yT�FPQ is the total sum of
squares and yT = F∑ yPFPQ is the mean of the observations. R is an indicator of how well the
regression model fits a set of data and CV indicates the dispersion of noise around the model.
A quota of 400 out of the possible 7V design points (pilot power value combinations) were set
aside for model building and prediction. Out of these 400 points, 294 were used as a training
set of Latin Hyper-Cube sampled (LHS) design points to build the surrogate model (a
reference on LHS). The remaining 106 were used as a validation set to evaluate the prediction
quality of the built model.
Table 1 lists the quality indicators for different covariance kernelsϕ�x, xX� . The Gaussian
kernel has a superior performance having a very high value of Y and low CV as compared to
exponential and linear kernels. These measures indicate a higher confidence on the initial
model for carrying out subsequent iterative optimization.

Celtic-Plus SHARING Document D.4.2
Public 13 (94)
Table 1. Kriging prediction quality
Covariance kernelsϕ�x, xX� Y MSE CV Exponential 0.7763 0.1457 18.42
Gaussian 0.9235 0.0499 10.77
Linear 0.2070 0.5165 34.68
2.1.5 Results
An initial surrogate model is built using 294 LHS design points. It is assumed that the
eNodeBs (eNB) are operating at an unoptimized default total transmit power setting of x ≡ �43,43,43,43,43,43,43�. Optimization is first carried out for the 2nd busiest hour. A total of 61
function evaluations involving 4 successful ’SEARCHES’ and 16 successful ’POLLS’ were
needed to reach the optimum. The algorithm proposes an optimized total transmit power
value combination of x ≡ �42,42,42,43,43,40,40�. Figure 1 indicates the bar plots for base station loads. Figure 2 and Figure 3 indicate the bar
plots for File Transfer Time (FTT) and Block Call Rates (BCRs) for all eNBs using the optimized
and unoptimized solutions. It is clear that the optimization offloads traffic from eNBs in G (eNB5 and eNB6) to G (eNB1 to eNB4) as is indicated by the corresponding KPIs resulting in
load reduction by 24%, FTT reduction by 64% and BCR reduction by 98% in the most loaded
eNB (eNB5).
Figure 1. Base station load before and after hourly optimization for the 2nd busiest hour.

Celtic-Plus SHARING Document D.4.2
Public page 14 of 94
Figure 2. Base station file transfer time before and after hourly optimization for the 2nd busiest hour.
Figure 3. Base station block call rate before and after hourly optimization for the 2nd
busiest hour.
Optimized solution obtained from hourly optimization of the 2nd busiest hour was then applied
to the network optimization over the day to evaluate the performance impact of the SON
algorithm to traffic variations over the entire day. Figure 4 and Figure 5 show the base station
load and FTT for an eNB for each of the two zones. As can be seen, the proposed LB algorithm

Celtic-Plus SHARING Document D.4.2
Public 15 (94)
is able to balance the load over the entire duration of the day by offloading the traffic to base
stations with lower loads thereby significantly reducing the FTT.
Figure 4. Base station load for daily optimization based on optimized solution from 2nd busiest hour.
Figure 5. Base station file transfer time for daily optimization based on optimized solution from 2nd busiest hour.
Celtic-Plus SHARING Document D.4.2
Public page 16 of 94
2.1.6 Conclusions
In this work a novel centralized recursive self-optimization methodology for LTE load
balancing based on pilot power optimization was presented. The proposed methodology uses
a statistical surrogate model for the parameter-KPI relations and a pattern search algorithm
for high dimensional optimization. This proposed approach is advantageous as the algorithm
uses extremely small number of noisy observations to build a high dimensional surrogate and
subsequently finds the optimum using few iterations, thus making the approach ideal for
operators to implement at the Operations and Maintenance Center (OMC) level.
2.2 Capacity optimization through Active Antenna Systems in LTE macro cell networks
2.2.1 Introduction
Network QoS improvements in terms of capacity can be brought about by optimizing antenna
tilts. Active Antenna Systems (AAS) have been gaining wide interest recently for their agile
ability to electronically adjust the beam in the optimum direction based on operators’ QoS
interests. In this work we propose to use the surrogate management framework optimization
of antenna tilts in LTE-A network and compare optimization results of several capacity-based
objectives. Results using a flow level network simulator reveal the need to jointly optimize
multi-capacity-objectives in a centralized manner apart from demonstrating the superiority of
the iterative self-optimization methodology in terms of faster response, adaptivity and
flexiblity.
This performance evaluation and the results are based on the use of a similar iterative self-
optimization process as described in Section 2.1.1.1 of [D.4.1]. Here the process aims to
optimize the eNodeB antenna tilt settings.
Optimization objective
A typical AAS-based optimization scenario includes adjustments to each of the antenna tilts
inM. Here the self-optimization algorithm performs optimization by adjusting each of the
antenna tilts and proposes an optimum vector of antenna tilt combination.
Let us denote the antenna tilt of cell � as _� (°) and the vector of total transmit powers
byx = `θθθ�…θ|�|c�, ∀s ∈ T, |T| being the cardinality of T. The AAS-based self-optimization
objective function can be given by:
�∗ = argmin� �����. �.f��� ≤ gℎi ,_�� ≤ _� ≤ _�"� ∀� ∈ g (2)
where ���� and f��� are the objective function to be optimized and the constraint function,
respectively, which are both functions of one or more predetermined KPIs defined overT. c�x� = �BCR�x�, BCR�x�,… . BCR,�x��, ∀s ∈ T, whereBCR,�x� is the BCR of cells ∀s ∈ T. gℎi is the
constraint threshold on BCR. Finally, _�� and _�"� are the minimum and maximum allowable
antenna tilt values, respectively. The KPIs are as defined in Section 2.1.2.2 of [D.4.1].
Commentaire [KH2]: FT

Celtic-Plus SHARING Document D.4.2
Public 17 (94)
2.2.2 Scenario and Results
Simulations are carried out for the downlink and no mobility is assumed. The simulation
parameters are defined as part of scenario 2.1.3 [D.2.2] and the scenario with the associated
network layout is discussed in Section 2.1.3.3 of [D.4.1].
A surrogate model built using 205 random design points (antenna tilt value combinations) is
used for the proposed self-optimization method. For optimization it is assumed that the base
stations are operating at an unoptimized default antenna tilt combination
ofl6°, 6°, 6°, 6°, 6°, 6°, 6°o. The value of gℎi is fixed at 0.05. Figures below show the bar plots for
optimized (white) and unoptimized (black) cell KPIs for different objective function
optimizations. The change in aggregated KPIs is shown in Table 2, while the simulation cost
to reach the function optimum is shown in Table 3.
Table 2. Percentage change in KPIs for different optimization objectives.
p�q� Change in aggregated KPIs (%)
fr���x� fs%�x� fsu%�x� fr���x� -3.1445 7.6588 12.8548
fs%�x� 3.1120 67.5727 89.1027
fsu%�x� 4.3246 61.8520 90.4332
Table 3. Simulation cost to reach function optimum.
p�q� function evaluations
(network simulations)
fr���x� 39
fs%�x� 13
fsu%�x� 26
Figure 6 shows the cell KPIs for fsu%�x� objective (cell-center) optimization. An improvement
of 90.4% in fsu%�x� is seen as a result of this optimization (see the results in Table 2).
Furthermore, as listed in Table 3, 26 function evaluations were needed to confirm the
optimum.

Celtic-Plus SHARING Document D.4.2
Public page 18 of 94
Figure 6. Cell KPIs for fsu%�x� objective (cell-center) optimization.
Figure 7 shows the cell KPIs forfs%�x� objective (cell-edge) optimization. The gains in the fs%�x� value are the highest with an improvement of 67.5% after using 13 function
evaluations. The BCR in cell 1 is reduced to 5.4%, slightly higher than gℎi but which can be
considered tolerable.
1 2 3 5 6 9 130
5
10x 10
7
ρ50%
(Mb
ps)
4 7 8 10 11 12 14 15 16 17 18 190
1
2x 10
8
ρ50%
(M
bps)
Cell Index
1 2 3 5 6 9 130
0.05
0.1
BC
R
1 2 3 5 6 9 130
0.5
1
Loa
d
1 2 3 5 6 9 130
1
2
3
FTT
(s)
Cell Index
1 2 3 5 6 9 130
1
2
3x 10
7
ρ5% (
Mbp
s)

Celtic-Plus SHARING Document D.4.2
Public 19 (94)
Figure 7. Cell KPIs for fs%�x� objective (cell-edge) optimization.
Figure 8 shows the cell KPIs forfr���x� objective optimization. Optimization uses 39 network
evaluations and results in a 3.14% improvement in the fr���x� value while some
improvements are seen in the other KPIs as shown in Table 2. Observe that the optimization
reduces the BCR of cell 1 to a value less thangℎi. BCR of cells 6 and 9 have increased
marginally but are well within the tolerable threshold ofgℎi. In both fs%�x� and fsu%�x� optimization scenarios, slight performance degradations are seen in
the observation cells but they are marginal when compared to the improvements achieved in
the target cells as is evident from Figure 6 and Figure 7. It is important to note that for the
considered urban dense scenario with an inter-site distance of 500 m, optimization of cell-
edge or cell median throughput leads to improvements of the same order of magnitude in
both metrics as is clear from Table 2.
1 2 3 5 6 9 130
1
2
3x 10
7
ρ5% (M
bps
)
4 7 8 10 11 12 14 15 16 17 18 190
2
4
6x 10
7
ρ5% (M
bps
)
Cell Index
1 2 3 5 6 9 130
0.05
0.1
BC
R
1 2 3 5 6 9 130
0.5
1
Load
1 2 3 5 6 9 130
1
2
3
FTT
(s)
Cell Index
1 2 3 5 6 9 130
5
10x 10
7
ρ50%
(M
bps)

Celtic-Plus SHARING Document D.4.2
Public page 20 of 94
Figure 8. Cell KPIs for fr���x� objective optimization.
2.2.3 Conclusions
In this work, a centralized self-optimization framework was applied for AAS-based constrained
capacity optimization in LTE-A. Statistical learning is used to model the RRM-KPI functional
relationships and a pattern search algorithm was applied in an iterative manner to optimize
the network capacity using different capacity-based objective functions. The optimization is
shown to improve the network performance up to 90.43%. It is worth noting that a single
objective function optimization is not sufficient to achieve the best improvements for all the
other objective function values. Thus it is crucial for an operator to deploy an optimization
methodology to achieve a balance amongst the competing objectives. This can be well
achieved when the operator has a centralized perspective of the network. The results also
provide a proof-of-concept for the generic utilization of the novel technique for a wide range
of network objective optimizations. The technique demonstrates its robust performance for
complex, large parameter space network optimization problems, in terms of faster
convergence using very few initial Network Paraneter (NP)-KPI data points.
1 2 3 5 6 9 130
1
2
3
FT
T (s
)
4 7 8 10 11 12 14 15 16 17 18 190
0.5
1
FT
T (s
)
Cell Index
1 2 3 5 6 9 130
0.05
0.1
BC
R
1 2 3 5 6 9 130
0.5
1
Loa
d
1 2 3 5 6 9 130
1
2x 10
7
ρ5% (
Mbp
s)
Cell Index
1 2 3 5 6 9 130
2
4
6x 10
7
ρ50%
(M
bp
s)

Celtic-Plus SHARING Document D.4.2
Public 21 (94)
2.3 Antenna tilt optimization for interference management in LTE-A heterogeneous network deployments
2.3.1 Introduction
This performance evaluation and the obtained results are based on the use of a similar self-
optimization process as described in Section 2.1.1.1 of [D.4.1]. In this section, the process
aims to find the optimum antenna tilt settings.
Optimization objective
A typical AAS-based optimization scenario includes adjustments to each of the antenna tilts
inM. Here the self-optimization algorithm performs optimization by adjusting each of the
antenna tilts and proposes an optimum vector of antenna tilt combination.
Let us denote the antenna tilt of cell � as as _� (°) and the vector of total transmit powers
byx = `θθθ�…θ| |c�, ∀s ∈ M, |M| being the cardinality ofM. The AAS-based self-optimization
objective function can be given by:
�∗ = argmin� �����. �.f��� ≤ gℎi ,_�� ≤ _� ≤ _�"� ∀� ∈ v (3)
where ���� and f��� are the objective function to be optimized and the constraint function,
respectively, which are both functions of one or more predetermined KPIs defined overM. c�x� = �BCR�x�, BCR�x�, … . BCR,�x��, ∀s ∈ M, whereBCR,�x� is the BCR of cells ∀s ∈ M. gℎi is the
constraint threshold on BCR. Finally, _�� and _�"� are the minimum and maximum allowable
antenna tilt values.
2.3.2 Scenario
The parameters used in the system simulation are as listed as part of scenario 2.3.2 defined
in [D.2.2]. The KPIs are as defined in Section 2.1.3.3 of [D.4.1].
2.3.3 Results
Cell-edge optimization:
Optimization of fs%�x� results in performance gains as shown in Figure 9. Optimization
provides a clear improvement for all the cell-edge observational KPIs while degradation can
be observed for the cell-center KPIs. AAS optimization leads to larger cell-edge QoS
improvements for the overall network and also for the macrocells compared to the picocells.
Cell-center optimization:
Optimization of fs%�x� results in gains for all observational KPIs as shown in Figure 10. Again it
is worth to note that the cell-center improvements for the overall network and for the
macrocells are larger than the improvements for the picocells. Also, in contrast to cell-edge
optimization performance, the cell-center optimization does not result in any degradation for
the observational KPIs.
Commentaire [KH3]: FT

Celtic-Plus SHARING Document D.4.2
Public page 22 of 94
Figure 9. Cell-edge optimization performance.
Figure 10. Cell-center optimization performance.
No macrocell blocking is observed for either the cell-edge or the cell-center optimization.
2.3.4 Conclusions
A surrogate based self-optimization framework for improving QoS in LTE-A heterogeneous
networks was presented in this work and a capacity improving optimization scenario using
enhanced Inter-Cell Interference Coordination (eICIC) was tested using this framework.
Optimization was carried out for two objective functions: cell-edge and cell-center
-15
-10
-5
0
5
10
15
20
25
30
35
Observational KPIs
Opt
imiz
atio
n g
ain
[%]
ThP5
ThP50
ThM5
ThM50
SINR5
SINR50
-10
0
10
20
30
40
50
Observational KPIs
Opt
imiz
atio
n g
ain
[%]
ThP5 Th
P50Th
M5 ThM50 SINR
5SINR
50

Celtic-Plus SHARING Document D.4.2
Public 23 (94)
optimization. For both objective functions, the proposed AAS-based optimization performs
well with possible performance gains results of up to 35% for cell-edge Signal-to-
Interference-plus-Noise Ratio (SINR) and 45% for cell-center SINR.
2.4 Enhanced Inter-Cell Interference Coordination for interference management in LTE-A networks
2.4.1 Introduction
This performance evaluation and the obtained results are based on the use of an iterative
self-optimization process as described in Section 2.1.2. Here, the process is utilized to find
the optimum values for both the Cell Range Extension (CRE) (cell selection offset, Yw) and the
eICIC muting ratio (xY).
Optimization objective
The aim within the eICIC based self-optimization context is to find the optimum �mRRE�� value by optimizing a pre-determined objective function subject to certain constraints. For the
considered TDM eICIC + CRE problem, we define a Joint Performance Metric (JPM) as the
weighted sum of the 5%-ile and the 50%-ile of UE SINR:
y�v�xY, Yw� = �1 − z�{|}Ysu%�xY, Yw� + z{|}Ys%�xY, Yw� (4)
where z �0 ≤ z ≤ 1� is the fairness parameter. z = 0.5 can be assumed to have a compromise
between cell-center and cell-edge users. The constrained optimization problem is to maximize
the above JPM with an upper limit on network BCR. For this, we use the following
minimization formulation:
min��,�����xY, Yw�� (5)
where f�mR, RE� = �1 − JPMFSM?� + g�mR,RE�, JPMFSM? is the normalized JPM:
y�v ��� = y�v − min��,���y�v�max��,���y�v� − min��,���y�v� (6)
and g = g�mR, RE� = max�I,?��0, BCR − BCR�P?PR� is the constraint limit on network BCR which is
added as a penalty function (BCR�P?PR�.
2.4.2 Scenario
The network layout, simulator and scenario are discussed in Section 2.1.4.3 of [D.4.1] and
Section 2.3.1 of [D.2.2]. The applied simulation parameters are listed in scenario 2.3.1
[D.2.2].
Commentaire [KH4]: FT

Celtic-Plus SHARING Document D.4.2
Public page 24 of 94
2.4.3 Results
Figure 11 shows the surface plots of the 5%-ile UE SINR, network BCR and JPMFSM? generated
for all possible combinations of Yw and xY values on the mesh (the mesh size ∆ is fixed to xY � 0.05, Yw � 1 dB). The surface plot of the 50%-ile UE SINR is similar to that of the 5%-ile
UE SINR and is not shown here. The plot indicates that the cell-edge and mean user quality is
the highest when all sub-frames at macro layer are muted and pico layer is operating at
medium Yw values. However, muting all macro sub-frames raises the BCR of the network as
shown in Figure 11.
Figure 11. Surface plot of 5%-ile UE SINR and network block call rate.
Figure 12 shows the contour plot of the cost function (��1 / JPMFSM?� ~ g�mR, RE��) or f�mR, RE� using 10 initial sampling points defined by LHS and 5 function evaluations carried out by the
05
1015
20
0
0.5
1-15
-10
-5
0
5
10
Range Extension dBMuting Ratio
SIN
R [
dB]
-12
-10
-8
-6
-4
-2
0
2
4
6

Celtic-Plus SHARING Document D.4.2
Public 25 (94)
search and poll algorithm to reach the global optimum. The search and poll algorithm
performed 2 successful ‘SEARCH’ steps (with a function evaluation and a model update at
each) marked by white squares. The third ‘SEARCH’ was unsuccessful which triggered the
‘POLL’ step with �mR � 0.8, RE = 5� as the poll point. Polling was carried out around this poll
point and the solution converged to the global optimum �mR = 0.75, RE = 5� (which is also
marked by a white square) after 3 function evaluations at the immediate neighbours of the
poll point.
Figure 12. Surface plot normalized JPM and contour plot of cost function prediction with initial sampling plan and optimization update.
05
1015
20
0
0.5
10
0.2
0.4
0.6
0.8
1
Range Extension dBMuting Ratio 0
0.1
0.2
0.3
0.4
0.5
0.6
0.7
0.8
0.9
1
RE: 4mR: 0.8
Range Extension [RE] dB
RE: 5mR: 0.8
RE: 5mR: 0.75
Mut
ing
Rat
io [
mR
]
0 5 10 15 200
0.1
0.2
0.3
0.4
0.5
0.6
0.7
0.8
0.9
1
0.35
0.4
0.45
0.5
0.55
0.6
0.65
0.7
0.75
0.8
0.85
Celtic-Plus SHARING Document D.4.2
Public page 26 of 94
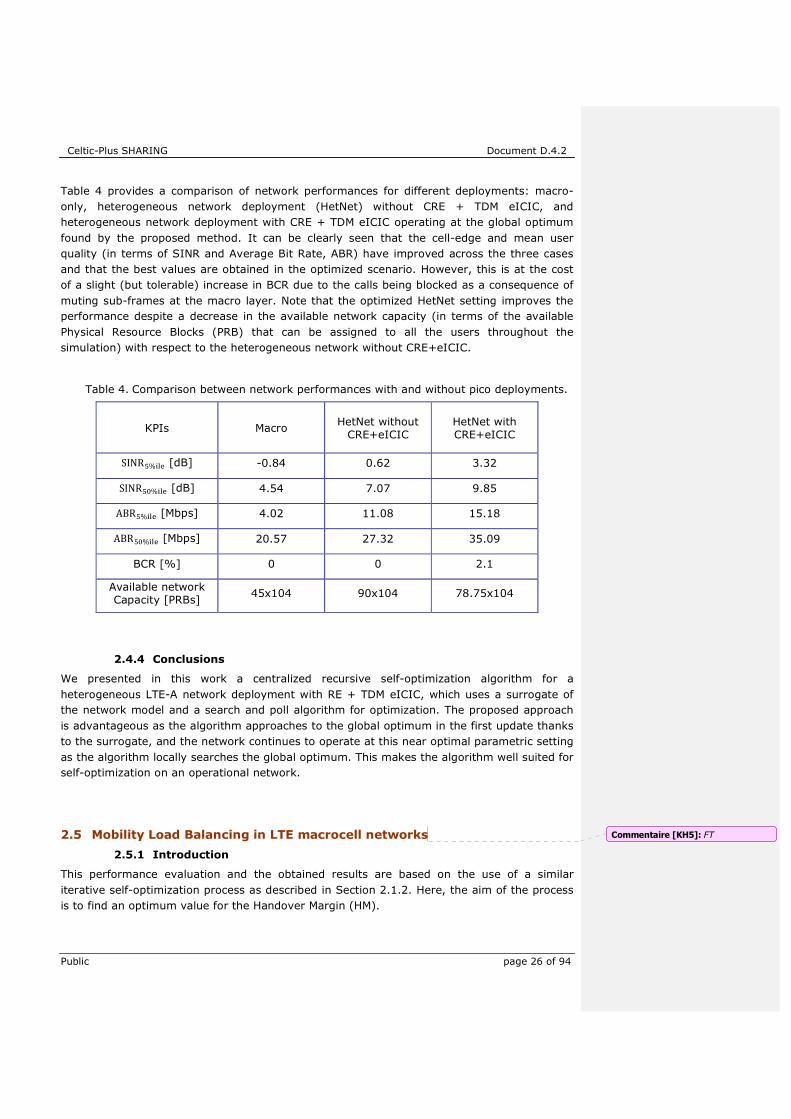
Table 4 provides a comparison of network performances for different deployments: macro-
only, heterogeneous network deployment (HetNet) without CRE + TDM eICIC, and
heterogeneous network deployment with CRE + TDM eICIC operating at the global optimum
found by the proposed method. It can be clearly seen that the cell-edge and mean user
quality (in terms of SINR and Average Bit Rate, ABR) have improved across the three cases
and that the best values are obtained in the optimized scenario. However, this is at the cost
of a slight (but tolerable) increase in BCR due to the calls being blocked as a consequence of
muting sub-frames at the macro layer. Note that the optimized HetNet setting improves the
performance despite a decrease in the available network capacity (in terms of the available
Physical Resource Blocks (PRB) that can be assigned to all the users throughout the
simulation) with respect to the heterogeneous network without CRE+eICIC.
Table 4. Comparison between network performances with and without pico deployments.
KPIs Macro HetNet without
CRE+eICIC HetNet with CRE+eICIC
SINRs%P�N [dB] -0.84 0.62 3.32
SINRsu%P�N [dB] 4.54 7.07 9.85
ABRs%P�N [Mbps] 4.02 11.08 15.18
ABRsu%P�N [Mbps] 20.57 27.32 35.09
BCR [%] 0 0 2.1
Available network Capacity [PRBs]
45x104 90x104 78.75x10⁴
2.4.4 Conclusions
We presented in this work a centralized recursive self-optimization algorithm for a
heterogeneous LTE-A network deployment with RE + TDM eICIC, which uses a surrogate of
the network model and a search and poll algorithm for optimization. The proposed approach
is advantageous as the algorithm approaches to the global optimum in the first update thanks
to the surrogate, and the network continues to operate at this near optimal parametric setting
as the algorithm locally searches the global optimum. This makes the algorithm well suited for
self-optimization on an operational network.
2.5 Mobility Load Balancing in LTE macrocell networks
2.5.1 Introduction
This performance evaluation and the obtained results are based on the use of a similar
iterative self-optimization process as described in Section 2.1.2. Here, the aim of the process
is to find an optimum value for the Handover Margin (HM).
Commentaire [KH5]: FT

Celtic-Plus SHARING Document D.4.2
Public 27 (94)
Optimization objective
For the scenario 2.1.1 considered in [D.2.2], let us assume a uniform setting of the HM
parameter, i.e., only one �v�,� value, ∀s ∈ G, t ∈ G ∩ ℵ, (shown by red arrows in the figure).
Let us denote this value of �v�,� by �. Then, the objective function of the Mobility Load
Balancing (MLB) can be written as:
�∗ = argmin� �����. �.��Y���� ≤ gℎ��� ,∀� ∈ % ∩ ℵ���Y���� ≤ gℎ��� ,∀� ∈ % ∩ ℵ� (7)
where f��� = ∑ �load,��� − loadR����∀,∈�E,R∈�B∩ℵ3 ,load,��� and loadR��� are the cell loads, BCRR��� and DCRR��� are the BCR and Drop Call Rate (DCR) of cell t respectively. gℎ��� and gℎ��� are the
upper limit thresholds on the BCR and DCR respectively ∀s ∈ G, t ∈ G ∩ ℵ,.
2.5.2 Scenario and results
The performance evaluation presented in this section is based on scenario 2.1.1 described in
[D.2.2]. The network layout and simulation parameters is as discussed in section 2.1.5.3 of
[D.4.1]. Most of the results have already been provided in Section 2.1.5 of [D.4.1] and some
supplementary results are provided in this section.
Figure 13. Data points for mean base station load as a function of the handover margin.
Figure 13 provides a variation of mean base station load as a function of the handover
margin. It can be seen that with the increase of the handover margin, the load of eNB1 is
increasing while the load of eNB11, eNB14, eNB15, eNB18, eNB2 and eNB3 is reducing due to
more UEs getting handed over to eNB1 and the postponing of the UE handover from eNB1
0 1 2 3 4 5 6 7 8 9 100.55
0.6
0.65
0.7
0.75
0.8
0.85
0.9
0.95
1
HM (dB)
Mea
n Lo
ad
eNB1
eNB11
eNB14
eNB15eNB18
eNB2
eNB3

Celtic-Plus SHARING Document D.4.2
Public page 28 of 94
towards the neighbouring cells. From the figure it is clear that the load balancing can be
achieved at�v�,� = 2��.
Figure 14 and Figure 15 provide a variation of other cell KPIs such as the BCR and DCR as a
function of the handover margin. It is clear that the QoS of eNB1 increases while the QoS of
all the others in the optimization zone degrades. However a balanced QoS between the base
stations is achieved at a value of�v�,� = 6��.
Figure 14. Data points for mean base station BCR as a function of handover margin.
Figure 15. Data points for mean base station DCR as a function of handover margin.
0 1 2 3 4 5 6 7 8 9 100
0.01
0.02
0.03
0.04
0.05
0.06
0.07
0.08
HM (dB)
Mea
n B
CR
eNB1
eNB11
eNB14
eNB15eNB18
eNB2
eNB3
0 1 2 3 4 5 6 7 8 9 100
0.005
0.01
0.015
0.02
0.025
0.03
0.035
0.04
HM (dBm)
Mea
n D
CR
eNB1eNB11
eNB14
eNB15
eNB18
eNB2eNB3

Celtic-Plus SHARING Document D.4.2
Public 29 (94)
Looking at these plots, it is clear that while a load balancing is achieved at�v�,� = 2��, a
better QoS is achieved at higher values of�v�,� thereby encouraging the use of constrained
self-optimization mechanism as already demonstrated in [D.4.1].
2.5.3 Conclusions
Results for the self-optimization of handover margin for mobility load balancing in LTE
networks was presented in this work in addition to the constrained self-optimization results
for load balancing already discussed in Section 2.1.5 of [D.4.1]. The impact of changes to
handover margin on base station mean load and other QoS KPIs such as BCR and DCR is
provided.
2.6 Cell virtualization based on Large Scale Antenna System
2.6.1 Introduction
Small cells can provide high Spectral Efficiency (SE) to handle high dense traffic areas and
cope with the explosively growing mobile traffic [GATI14]. Typically, the deployment of small
cells implies a non-negligible cost in terms of new equipment deployment, site acquisition or
leasing, maintenance and increment of the global network energy consumption [MAR10].
Nowadays, research within the field of active antennas is presenting important advances,
opening new Energy Efficient (EE) alternatives in the mid-term [HOY11]. One possible
scenario is to deploy Large Scale Antenna Systems (LSAS) at the macrocells. The use of this
new antenna system would allow creating highly directive beams which are considered as
Virtual Small Cells (VSCs). These VSCs can be used to replace the typical macro-picocell
deployment consequently reducing the OPEX and CAPEX expenses. Another important
characteristic of VSCs is that they could be reconfigurable during the time and thus adapt to
the changing traffic conditions. This flexibility is an important advantage compared to the
typical macro-picocell deployment.
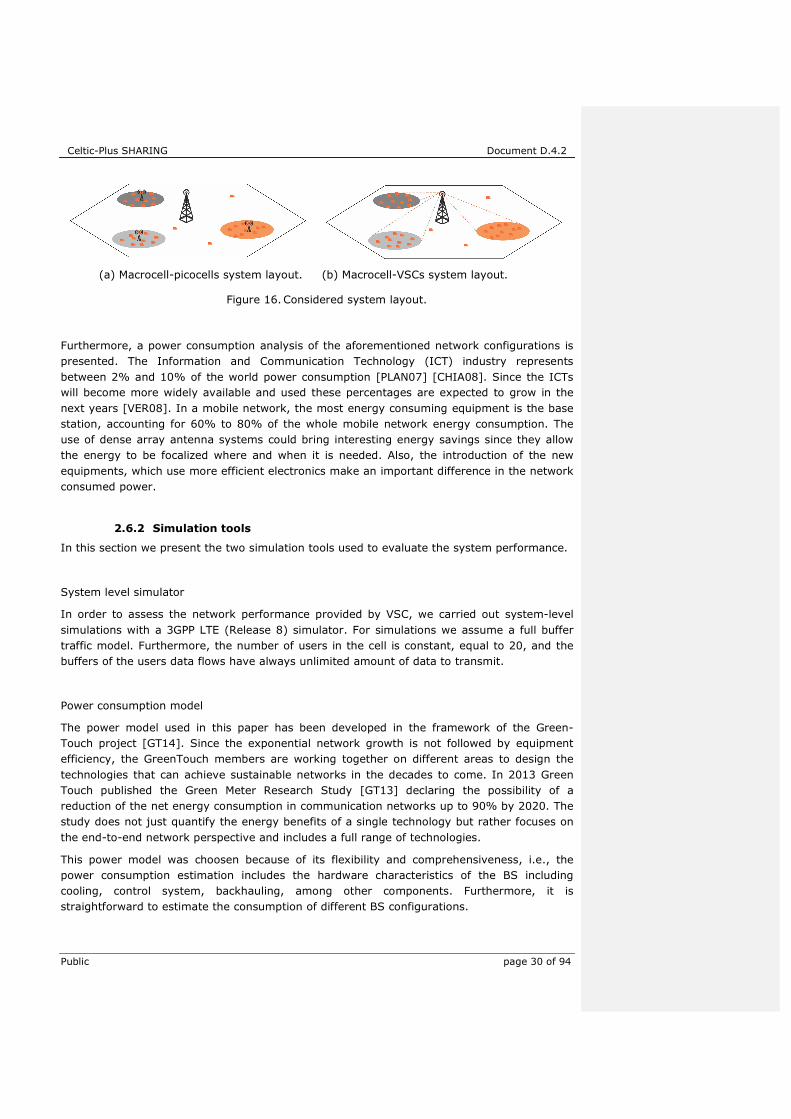
In Figure 16, we present the solution introduced in our work. Figure 16(a) shows a typical
heterogeneous network deployment where picocells cover the existing hotspots, represented
by the shaded areas. Figure 16 (b) presents the proposed solution where VSCs replace the
typical picocells to cover the existing hotspots. VSCs are therefore managed at the macrocell
level, giving place to a completely centralized system free of coordination and backhaul
latency constraints. VSCs can work using the same carrier than the macrocell (co-channel
operation) allowing an efficient reuse of spectrum, bringing a high SE and considerable
aggregated capacity gains.
The general methodology and the solution to shape the VSC beam, particularly the number of
antenna elements required, have already been presented in Section 2.2.1 of [D.4.1].
Based on simulations, the performance of three cellular system configurations for a dense
urban and a rural scenario are compared, 1) Only-macrocells, 2) macrocell with VSCs
covering dense areas and 3) heterogeneous network with picocells covering dense areas.
Commentaire [KH6]: FT
Celtic-Plus SHARING Document D.4.2
Public page 30 of 94
(a) Macrocell-picocells system layout. (b) Macrocell-VSCs system layout.
Figure 16. Considered system layout.
Furthermore, a power consumption analysis of the aforementioned network configurations is
presented. The Information and Communication Technology (ICT) industry represents
between 2% and 10% of the world power consumption [PLAN07] [CHIA08]. Since the ICTs
will become more widely available and used these percentages are expected to grow in the
next years [VER08]. In a mobile network, the most energy consuming equipment is the base
station, accounting for 60% to 80% of the whole mobile network energy consumption. The
use of dense array antenna systems could bring interesting energy savings since they allow
the energy to be focalized where and when it is needed. Also, the introduction of the new
equipments, which use more efficient electronics make an important difference in the network
consumed power.
2.6.2 Simulation tools
In this section we present the two simulation tools used to evaluate the system performance.
System level simulator
In order to assess the network performance provided by VSC, we carried out system-level
simulations with a 3GPP LTE (Release 8) simulator. For simulations we assume a full buffer
traffic model. Furthermore, the number of users in the cell is constant, equal to 20, and the
buffers of the users data flows have always unlimited amount of data to transmit.
Power consumption model
The power model used in this paper has been developed in the framework of the Green-
Touch project [GT14]. Since the exponential network growth is not followed by equipment
efficiency, the GreenTouch members are working together on different areas to design the
technologies that can achieve sustainable networks in the decades to come. In 2013 Green
Touch published the Green Meter Research Study [GT13] declaring the possibility of a
reduction of the net energy consumption in communication networks up to 90% by 2020. The
study does not just quantify the energy benefits of a single technology but rather focuses on
the end-to-end network perspective and includes a full range of technologies.
This power model was choosen because of its flexibility and comprehensiveness, i.e., the
power consumption estimation includes the hardware characteristics of the BS including
cooling, control system, backhauling, among other components. Furthermore, it is
straightforward to estimate the consumption of different BS configurations.

Celtic-Plus SHARING Document D.4.2
Public 31 (94)
2.6.3 Results
In our study we consider two typical scenarios: a dense urban and a rural one, with three
tiers. The carrier frequency is assumed to be on 2000 MHz and 800 MHz band for dense urban
and rural environments, respectively, and with 10 MHz bandwidth. In both scenarios, the
transmitted power is 46 dBm per macrocell sector. We deploy a VSC per macrocell and the
total transmitted power is equally splitted between the coverage beam (macrocell) and the
VSC beam (43 dBm each).
For each scenario, we compare the following four deployment options:
1. Only-macrocell: This is the baseline case, with no small cells. It is expected to be the
lower bound in terms of performance.
2. Macrocell-VSC ideal: VSC beams point to the center of the hotspots. In this scenario
there is no limit in the number of antenna elements that can be used to form the
beam.
3. Macrocell-VSC real: This scenario is similar to the ideal one but we introduce a realistic
constraint on the maximum number on antenna elements that can be used to form the
beam. The limit is set at }����= 10 in both planes. Compared to the ideal option, this
constraint may lead to wider beamwidth and reduced directivity of the VSC beam,
depending on the VSC location.
4. Macrocell-picocell: This corresponds to the typical deployment of heterogeneous
networks, where picocells are deployed at the center of the hotspot. Picocells are
configured with a transmission power of 30 dBm for the dense urban case and 37 dBm
for the rural one. This scenario is expected to be the upper bound in terms of capacity
due to the small distance between transmitters and receivers. However, it is also the
most costly deployment option in terms of CAPEX and OPEX, including energy
consumption.
2.6.3.1 Network performance results
In this section we present system level simulation results in terms of percentage of UE
attachment, SINR, throughput and power consumption.
1) UE attachment: Table 5 compares the percentages of UEs attached to each type of cell
for each network configuration in both dense urban and rural scenarios. For the macrocell-
VSC case, for both ideal and real cases in the dense urban and rural scenarios, the
percentage of UEs connected to the VSC is higher than ��� (2/3). This means that when the
transmitted power is proportionally splitted between the macrocell and VSC, the VSC covers
not only the UEs within the hotspots but also some that are not in this dense traffic area.
Transmit power split between coverage beam and VSC beam is a new degree of freedom to
optimize heterogeneous networks based on VSC. In other words, VSCs provide the possibility
of changing the power transmitted to cover a hotspot, to adapt the size of the VSC to the
traffic conditions. Finally, for the macrocell-picocell scenario, it can be noticed that the
percentage of UEs connected to the picocells is less than 2/3. This is because hotspots are
randomly located and therefore some of them are close to the macrocell, resulting in a
shrinked picocell coverage area.

Celtic-Plus SHARING Document D.4.2
Public page 32 of 94
Table 5. UE attachement percentage in dense urban and rural scenarios.
Scenarios Macrocell-VSC ideal Macrocell-VSC real Macrocell-picocell
Macrocell (%) VSC (%) Macrocell (%) VSC (%) Macrocell (%) Picocell (%)
Dense urban
Rural
22
12
78
88
20
17
80
83
46
53
54
47
2) SINR and user throughput: The average SINR of the macrocell-VSC ideal case is 0.9 dB
higher than the only-macrocell one but when the limitation in the maximum number of
antennas is introduced, i.e., macrocell-VSC real case, the average SINR decreases with 2.5
dB compared to the only-macrocell case. This detriment in the SINR is due to the interference
between the VSC and the macrocell.
Despite the SINR degradation for the macrocell-VSC real case, the average user throughput is
always enhanced when introducing VSCs compared to only-macrocell case, for both the ideal
and the real cases. This is due to the reuse of the resources at the macrocell and VSCs. The
gain over the only-macrocells case introduced by the ideal case is of 0.94 Mbps (+103%), for
the real case the gain regarding the only-macrocell case is of 0.5 Mbps (+55%). As expected,
the macrocell-picocell case outperforms the macrocell-VSC cases. The gain over the only-
macrocell case is of 1.4 Mbps (+153%). These results are summarized in Table 6.
Table 6. Average SINR and throughput for dense urban scenario.
Scenarios Only-macrocell Macrocell-VSC ideal Macrocell-VSC real Macrocell-picocell
Av. SINR (dB)
Av. Throughput (Mbps)
7.8
0.9
8.7
1.9
5.3
1.4
9.9
2.3
Figure 17 presents the Cumulative Distribution Function (CDF) of the SINR for the rural
scenario. If we consider SINR less than −6 dB as out of coverage, the only-macrocell case
yields 47% of UEs out of coverage. When introducing picocells, the percentage of out-of-
coverage UEs drops to 28%. When introducing VSC, the percentage of out-of-coverage UEs
drops to 11% and 35% for the ideal and real cases, respectively. Contrarily to the dense
urban scenario, which is interference-limited, the rural scenario is a noise-limited one.
Therefore, the introduction of VSCs does not imply an increase in the interference, except for
VSCs that are very close to the macrocell site. Augmenting the directivity of the VSC beams
can lead to larger coverage than the coverage of the conventional picocells. Therefore, with a
large number of antenna elements (e.g., macrocell-VSC ideal), the introduction of VSCs
outperforms the conventional small cell deployment in terms of coverage.
In conclusion, the introduction of VSC can be used as a throughput booster for the dense
urban scenario and as a coverage solution for rural scenarios. Conventional picocells
outperform VSC in terms of user throughput in dense urban scenarios if we consider limited
number of antennas (limited directivity for the VSC beam), but this comes at the price of
increased cost and reduced flexibility. Also note that these results do not take into account
the changes in the traffic location that occur along the day. Such simplification artificially

Celtic-Plus SHARING Document D.4.2
Public 33 (94)
benefits the performance results of traditional heterogeneous networks versus VSCs, which
can actually adapt their location to the moving traffic.
Figure 17. SINR CDF at rural scenario for the four studied network deployments.
2.6.3.2 Power consumption simulation results
The power model tool does not consider Frequency Division Duplex (FDD) when using LSAS,
since it has been developed following the MU-MIMO concept [MAR10]. Since our system does
not require Channel State Information (CSI) feedback for every antenna element, we do not
take into account the energy consumed by the training phase. Therefore, the given results are
an accurate approximation of the consumed power by the system.
Here, the results in terms of consumed power and EE are presented. EE is computed as the
ratio of the average cell throughput gℎ� in (Mbps) given by the system-level simulation tool
over the average consumed power per cell�� in (W) given by the power model simulator
[GDOC14].
� � ∑ gℎ�� ¡¢¢�Q∑ ��� ¡¢¢�Q�v£����¤� (8)
Particularly, for the macrocell-picocell scenario, we sum up the macrocell and picocell
throughput as well as their consumed power in order to estimate their efficiency. Figure 18
shows the average power consumption of a sector for the dense urban and rural scenarios.
Since we are considering Remote Radio Head (RRH) macrocells, i.e., the Radio Frequncy (RF)
unit is directly attached to the antenna, so there are no feeder losses (3 dBm), the power at
Power Amplifier (PA) could be halved with respect to a typical macrocell. The introduction of
the VSCs allow a saving of about 27% and 43% in the dense urban and in the rural scenarios
with respect to the only-macrocell and of 36% and 73% with respect to the macrocell-picocell
case.
Figure 19 represents the EE, computed as described in equation (8). The macrocell-picocell
scenario has a very high efficiency due to the high throughput that the system can provide.
VSC system value is 20% lower than macrocell-picocell but it doubles the only-macrocell case
-20 -10 0 10 20 30 400
0.1
0.2
0.3
0.4
0.5
0.6
0.7
0.8
0.9
1
SINR (dB)
CD
F
only-macrocellsmacrocell-VSC idealmacrocell-VSC realmacrocell-picocell

Celtic-Plus SHARING Document D.4.2
Public page 34 of 94
in dense urban environment. For the rural scenario, the efficiency of VSCs is 44% lower than
macrocell-picocell case but more than 2.5 times higher than the only-macrocell one.
Figure 18. Consumed power per sector for dense urban and rural scenarios.
Figure 19. System EE for dense urban and rural scenarios.
While the deployment with VSCs has the lowest power consumption, the macrocell-picocell
deployment seems to be the most efficient. This is because the presented results correspond
to the full buffer traffic model. Deploying physical small-cell close to the user, with this traffic
profile, boosts the average throughput of the system which will not be the case in real traffic
conditions. Furthermore, if we consider the embodied energy of a new site, maintenance, the
additional backhauling needed, it is clear that the total EE will drop drastically for the
heterogeneous network deployment.
As a final remark, it has to be taken into account that VSCs allow to reduce the total radiated
power per cell compared to traditional heterogeneous networks since for the VSC case it is
equal to 46 dBm meanwhile for the heterogeneous network the total radiated power per cell is
46 dBm for the macrocell plus 30 dBm for the picocell.
Urban Rural0
50
100
150
200
Scenarios
Pow
er c
onsu
mpt
ion
(W)
only-macrocellmacrocell-VSC realmacrocell-picocell
Urban Rural0
0.05
0.1
0.15
0.2
0.25
Scenarios
Effi
cien
cy
only-macrocellmacrocell-VSC realmacrocell-picocell

Celtic-Plus SHARING Document D.4.2
Public 35 (94)
2.6.4 Conclusions
This work presents the concept of VSCs, where large antenna arrays at macrocells are used to
focus the energy towards a hotspot. As with traditional heterogeneous networks, this creates
areas with enhanced SINR and increases the resource reuse of the system (cell splitting gain).
As presented in the system-level simulation results, the introduction of VSCs can improve the
mobile network throughput when compared with a situation where only macrocells are
deployed. For a dense urban scenario with full buffer traffic model, system-level simulations
show that the average user throughput is increased by 50%. In addition, using GreenTouch
power model for large scale antenna systems, VSCs save 27% of the consumed power
regarding the only-macrocell case whereas picocells introduce a 7% extra power consumption
compared to the macrocell-VSC deployment. When comparing VSCs with the heterogeneous
network deployment, we see that the system performance suffers some detriments due to the
higher path losses between the VSCs and the users. However, the fact of not having to deploy
new equipment, saving also in backhauling, leasing and maintenance can largely compensate
for the reduced gains in network performance compared to the heterogeneous network
deployment. It should also be noted that these results do not take into account the changes
in the traffic location that occur along the day. Such simplification artificially benefits the
performance results of traditional heterogeneous networks versus VSC. In reality, VSC give
more flexibility since their location and size can vary depending on the traffic dynamics.
2.7 Intra-LTE offloading by middleware deployment
2.7.1 Introduction
Moving users require satisfying and guaranteeing their needs in terms of coverage and QoS
even with the challenging conditions brought by the mobility aspects. Therefore, the network
must be able to manage the changes in the serving cells without any prejudice to the
customer. That means intelligently managing handover procedures so as to guarantee that
each user is served in the most appropriate cell given their characteristics and network
requirements. The envisioned solution consists of creating and deploying a middleware
capable of helping in these processes, which will perform handovers as high level operations,
forcing disconnections and reconnections but not going into the control plane details.
The proposed innovation corresponds to scenario 2.9.1 in [D.2.2]. The scenario being faced in
this case is therefore similar to the one shown in Figure 20, where an offloading process is
carried out between the LTE cells where the diverse users are moving from and to while
carrying out active sessions.
Thus, the proposed innovation implies the creation of the aforementioned middleware, which
will be deployed in the base stations and will work on an Internet Protocol (IP) level, capable
of managing the cell occupation, given the impossibility of obtaining valid direct information
from the users in certain levels.
Commentaire [KH7]: TTI

Celtic-Plus SHARING Document D.4.2
Public page 36 of 94
Figure 20. Intra-LTE offloading scenario.
The scenario presents an added difficulty, marked by the mobility of the users, which will
derive in the need of maintaining an exchange of information between the lower and upper
layers both at local and remote level (offering defined Service Access Points, SAP) and in a
global network scale as well. Figure 21 depicts roughly the interactions taking place between
the lower entities (for example the case represented by transceivers, base stations or users)
and the high level entities managed at core network level.
Figure 21. Basic block diagram of the envisaged middleware.
The envisioned middleware will be a functional entity that will receive and manage
information from different layers dispatching primitives to their final destination, trying to
avoid duplicity of paths. It will also support event-subscription functionalities for higher layers
and functional blocks at local and remote level.

Celtic-Plus SHARING Document D.4.2
Public 37 (94)
In addition, this middleware, which will receive the name of Conversion Block, will enable
technology-agnostic information management when necessary. The Conversion Block
presents capacity to analyse and adapt measurements and parameters depending on the
RATs below and capability to accommodate the received data to a given Common Data Model
(i.e., battery level alarms, overload levels in APs or BSs, SNR border values, etc.).
All in all, the Conversion Block will imply a novel and an efficient method to perform intra-LTE
duties, as required in the mobility conditions so typical nowadays. Its internal structure will be
similar to the one shown in Figure 22, distinguishing two main parts: the ACCESS section,
directly connected to the desired entity, and the CORE section, where a dedicated database is
deployed and the information processed and conveniently dispatched.
Figure 22. Internal structure of the middleware.
2.7.2 Common data model
The way the information is exchanged is defined via a common data model. Three main
primitives, as listed in Table 7 are considered to communicate local and remote entities.
Table 7. Middleware primitive’s types.
Primitive Type Description
Event Indicates dynamic changes (spectrum, link, quality).
Configuration/Command Physical configuration, resource allocation, mobility
Information Exchange Exchange and discover info about user details and information associated, QoS features in communications, etc.
Having the aforementioned types in mind, up to three types of communication modes are
considered, see Table 8.
INFO Processing
Message Dispatcher
Contactable
Entities DB
CORE
CORE
iface
Sender
Listener
En
tity
(R
AT
)
ACCESS
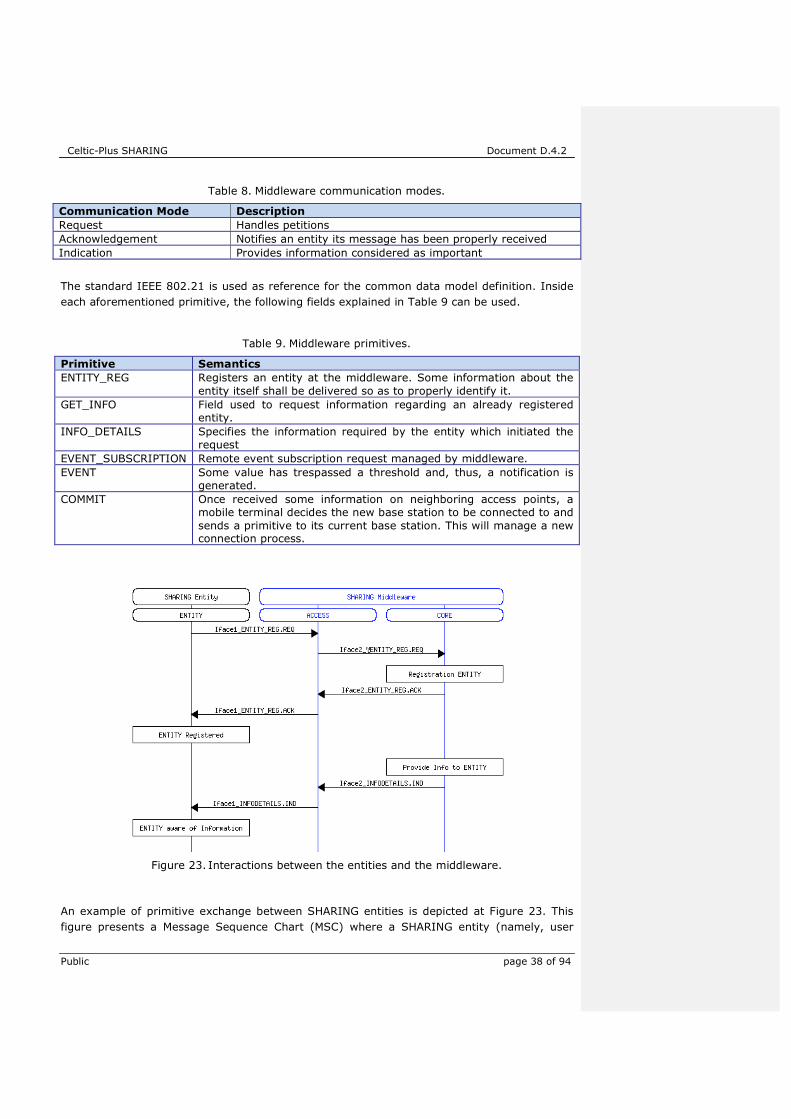
Celtic-Plus SHARING Document D.4.2
Public page 38 of 94
Table 8. Middleware communication modes.
Communication Mode Description
Request Handles petitions
Acknowledgement Notifies an entity its message has been properly received
Indication Provides information considered as important
The standard IEEE 802.21 is used as reference for the common data model definition. Inside
each aforementioned primitive, the following fields explained in Table 9 can be used.
Table 9. Middleware primitives.
Primitive Semantics
ENTITY_REG Registers an entity at the middleware. Some information about the entity itself shall be delivered so as to properly identify it.
GET_INFO Field used to request information regarding an already registered entity.
INFO_DETAILS Specifies the information required by the entity which initiated the request
EVENT_SUBSCRIPTION Remote event subscription request managed by middleware.
EVENT Some value has trespassed a threshold and, thus, a notification is generated.
COMMIT Once received some information on neighboring access points, a mobile terminal decides the new base station to be connected to and sends a primitive to its current base station. This will manage a new connection process.
Figure 23. Interactions between the entities and the middleware.
An example of primitive exchange between SHARING entities is depicted at Figure 23. This
figure presents a Message Sequence Chart (MSC) where a SHARING entity (namely, user

Celtic-Plus SHARING Document D.4.2
Public 39 (94)
equipment) registers in the middleware. Once the middleware returns the acknowledgement
message, it proceeds to incorporate the entity information into the database. From now on,
that entity is accessible and it is able to receive the requested or subscribed information.
2.7.3 Simulator definition and requirements
Section 2.7.2 defines the way the data flows inside the middleware, considering all potential
situations regarding the scenario considered. At this point, with the entire common data
model already defined, it is time to start developing and defining the simulator tool used to
assess the potential gains.
The simulator is built using a two-step simulator.
• In a first step, a simulator is built so as to characterize the cell coverage scenario. The
idea consists of being able to determine the power received for each base station
within the coverage area at each point. The simulating tool should allow the creation of
just LTE scenarios and combined LTE/WiFi layouts so as to consider both intra- and
inter-LTE offloading approaches. The output of this first simulation tool will be a
coverage matrix for the scenario, saved as a table inside the database.
• Using the coverage matrix previously obtained, a second simulation tool is developed
so as to test a daily load pattern and evaluate the potential gains in terms of QoS. This
simulation tool assumes that the network is aware of some extra user parameters with
respect to the data available in current LTE networks. This information will be
transferred using the middleware and primitives previously defined.
The two main entities envisaged to be used in the middleware are users and base stations. In
the first case, some extra information, as discussed before, is needed so as to apply the new
strategies. The data regarding users is introduced in Table 10, highlighting in red the
incremental information introduced. The base station parameters are also summarized in
Table 11, but they are similar to the ones used currently. This data from both users and base
station will be combined to produce the results.
Table 10. User information.
User Parameters
X_position X position in the grid (m)
Y_position Y position in the grid (m)
X_next Next X position expected from a random mobility model
Y_next Next Y position expected from a random mobility model
RSSI BS and power received at each instant
Interfaces True if it supports attachment to small cells and false otherwise
Battery Battery left on the mobile phone
SLA MBps required by the user
Session Minutes left of the user session
QoS QoS experienced at each moment
Selected_EB EB to which the user is attached in this moment
Priority Bearer class

Celtic-Plus SHARING Document D.4.2
Public page 40 of 94
Table 11. Base Station (BS) information.
Base Station Parameters
Name Unique Identifier of the BS into the layout
Max_Load Maximum Load in MBps allowed by the cell
CurrentUsers Current users supported by the BS
CurrentLoad Current load handled by the BS
CurrentLoadGBR Current load of just Guaranteed BitRate (GBR) users
X_position X position in the layout (m)
Y_position Y position in the layout (m)
Max_users Maximum number of users allowed
Power_cons Power output of the BS
Coverage_radius Coverage radius of the BS (m)
Type True if it is LTE or false if it is a small cell
In addition to these base station and user parameters, some considerations shall be also
introduced so as to assign user priorities and model the behaviour of the network. The system
will be designed so as to introduce situations on which the available resources are not enough
for all user requirements. This way, as in real networks, types of users must be defined,
depending on the throughput/application needs and the associated fee contracted.
So as to provide this hierarchy of users, LTE bearer classes are used, with minor adaptations
to fit into the simulator.The system distinguishes between Guaranteed BitRate (GBR) users
(whose bandwidth (BW) requirements cannot be neglected) and Non-Guaranteed BitRate
(Non-GBR) users (low priority, QoS can be diminished if needed).
In addition, each user can be using different profiles, depending on the type of data
demanded. The considered profiles for users (in descending order of throughput
requirements) are Gaming, Multimedia Streaming, Videocalls, Mail and Voice calls.
Mixing both user and profile information, a complete detail of bearer classes used by the
simulator can be shown at Table 12. The incremental information that has been adopted by
the simulator consists on the probability of occurrence of each user type and the resultant
priority.
Table 12. Bearer classes.
Service BW (Mbps) Class Priority Probability
Voice 0.1 GBR
(reserved
BW)
1 10%
Videocall 0.5 3 5%
Streaming 1.5 4 5%
Gaming 2 2 2%
Voice 0.1 Non-GBR 9 30%
Videocall 0.5 8 10%
Streaming 1.5 5 15%
Mail 0.5 6 20%
Gaming 2 7 3%

Celtic-Plus SHARING Document D.4.2
Public 41 (94)
Considering all available information depicted in this chapter, the middleware should be now
able to perform intelligent user allocations at each instant depending on the context
information sent by the users. On the following sections the strategies used to compare the
results and the results themselves are presented.
2.7.4 Assumptions and strategies
This section covers the intelligence programmed in the simulator so as to compare between
the baseline results (not applying the proposed enhancements) and the results obtained using
the new data available.
The base parameter to optimize will be the QoS experienced by users in the network.
Pursuing that goal, three strategies are proposed.
Table 13. Bearer classes.
Strategy Details
Simple Users are attached to the base station from where more power is received
Intermediate If the base station with more power is crowded, it looks for another one
with less users
Complex Uses bearer classes to allocate users • Users with GBR are always allocated in the best base station. If
they demand high bit rates, in the most powerful one. If they require voice/mail services, in the less crowded one.
• Users with non-GBR may be forced to handover if a GBR user comes
• All users look for the best choice of base station
The general layout for this simulation considers a grid of 5x5 macro base stations able to
handle 250 users and 120 Mbps each. The base station coverage radius is 50 meters and the
Inter-Site Distance (ISD) is √3·50 meters.
Depending on the coverage assumptions, two different approached have been followed,
resulting in two different scenario layouts:
• In a conservative first approach (Figure 24 and Figure 25), it is considered that the
base station radius is strict and further that distance the user cannot receive data from
the base station.
• In a more realistic approach (Figure 26 and Figure 27), this coverage radius is
extended in a 1.5 factor. The number of base stations reachable form the same point
is, thus, increased. The middleware is in this case more flexible as it has more options
to allocate users and better balance the load between cells. It is important to note that
this assumption does not collide with the LTE frequency reuse strategy. In addition,
the user battery shall be also considered, as the user may be forced to handover to
distant cells. Just users with more than 40% remaining battery are suitable to use
distant cells.
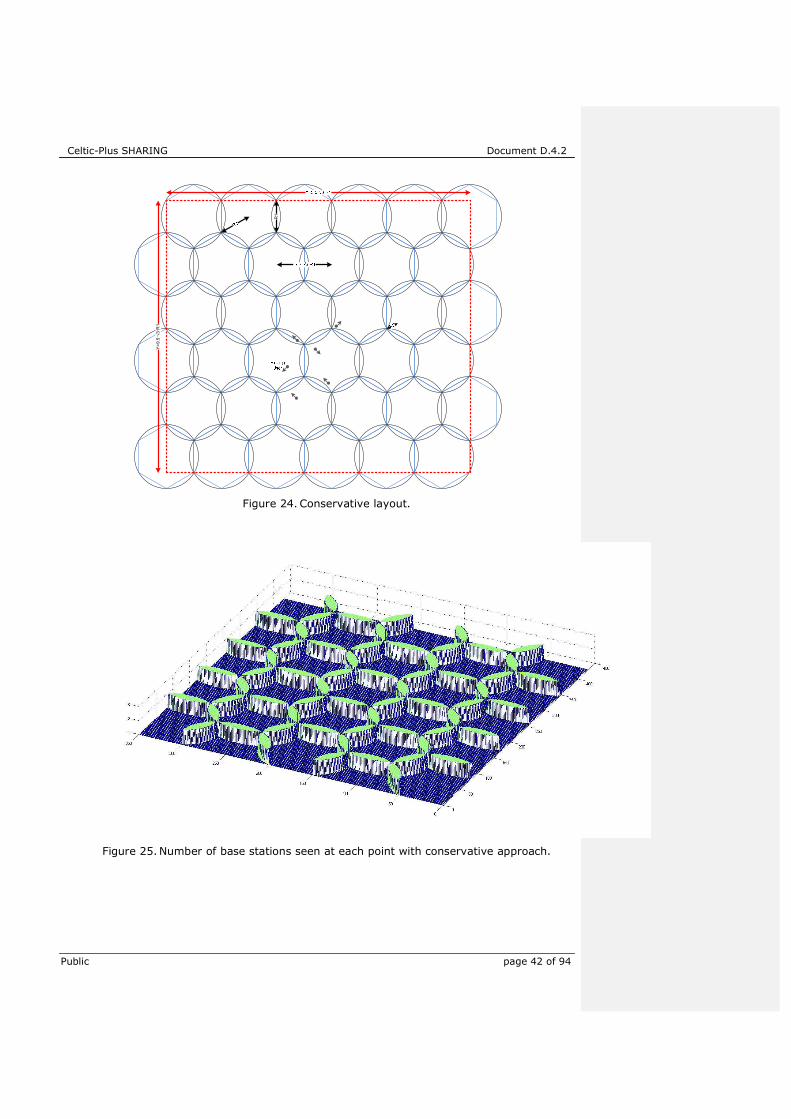
Celtic-Plus SHARING Document D.4.2
Public page 42 of 94
Figure 24. Conservative layout.
Figure 25. Number of base stations seen at each point with conservative approach.
R1
Y=9.5·√3·R1

Celtic-Plus SHARING Document D.4.2
Public 43 (94)
Figure 26. Realistic approach (1.5 coverage radius extended).
Figure 27. Number of base stations seen at each point with realistic approach.
One important assumption of the simulator is that it is designed to test the QoS of the overall
network. In order to be able to determine the potential enhancements, the system has been
dimensioned so as to be able to handle all potential users (0% probability of not covering a
new user) but with capacity resourced under the peak traffic expected, in an attempt to force

Celtic-Plus SHARING Document D.4.2
Public page 44 of 94
QoS below 100% at least on peak hours. Depending on the strategy selected, the downgrade
of QoS will be higher and more lasting as the balance between base stations can be enhanced
via the use of the proposed middleware.
Users are programmed to move randomly, but following a coherent path. This way, at each
moment, a user has equal probability to stay still, or move 1 step on any direction. Examples
of the user movement paths are shown in Figure 28. The maximum number of users is
determined by the use of the traffic patterns. In this case, FP7 EARTH project traffic models
for urban scenarios are considered as a basis for the simulation, adding extra noise to
simulate more realistic traffic situations.
User session lifetime is considered to be random between 1 and 25 minutes. Finally, 30% of
capacity resources at each base station is reserved for GBR users (taken into account when
using complex strategy). This consideration enables the assumption of not allowing decreases
of QoS for GBR users.
Figure 28. Examples of user movement paths.
2.7.5 Results
The simulator interfaces for both the network planning and the 24-hour period simulator can
be seen at Figure 29 and Figure 30.
The final objective of this middleware plus simulator tool definition is to enhance the overall
network QoS. This can be achieved due to the fact that the network will be aware of some
user related parameters not used currently, and interchanged thanks to the middleware.
Differentiating between layout and strategy used, the following results are presented:
• Any SHARING defined policies, intermediate or complex, obtain better QoS
performance with respect to the simple approach (not using the available new data).
This can be seen, for instance, comparing between Figure 31, where the simple policy
is applied, and Figure 32, in which the complex policy is used, and the resultant
number of users experiencing bad QoS (red curve) is decreased significantly. When
using the complex policy, 13% peak and 25% mean enhancements can be obtained in
terms of overall QoS with respect to simple policy.
• Using the conservative scenario, as it allows less flexibility in terms of cell load
balancing, produces always less QoS performance compared with the realistic scenario.
As depicted in Figure 32 and Figure 33, using the same policy (complex) but varying
the scenario from conservative (Figure 32) to realistic (Figure 33) impacts on the
amount of users with bad QoS, obtaining much better results in the latter case.
180 182 184 186 188 190 192 194265
266
267
268
269
270
271
272
273
249 250 251 252 253 254 255 256 257254
256
258
260
262
264
266
268

Celtic-Plus SHARING Document D.4.2
Public 45 (94)
Figure 29. Network planning tool.
Figure 30. 24-hour simulator interface.

Celtic-Plus SHARING Document D.4.2
Public page 46 of 94
Figure 31. QoS (red curve) of the network using simple policy in conservative scenario.
Figure 32. QoS (red curve) of the network using complex policy in conservative scenario.

Celtic-Plus SHARING Document D.4.2
Public 47 (94)
Figure 33. QoS (red curve) of the network using complex policy in realistic scenario.
The results provide consistent and very interesting enhancement results for QoS
considerations. Thus, it can be considered as theoretically proven the advantages of the
middleware deployment and the sharing of context user data.
2.8 Dynamic Uplink-Downlink optimization in TDD-based small cell networks
We consider a wireless communication system consisting of a set of small cell base stations
(SCBSs) ¥ � l1, … , �o. We assume that a User Equipment (UE) arrives at location � within the
considered geographical area according to a Poisson arrival process with rate z���. Each UE
requests either a downlink (DL) or uplink (UL) file whose size follows an exponential
distribution with mean 1 ¦���⁄ . A closed-access policy is assumed in this work, meaning that
each SCBS has its own subscribed UEs, and hence no handover is considered. We further
assume ¨© to be the coverage area of an SCBS £, where a UE at location � is served by an
SCBS £ if � ∈ ¨©. We assume that the system operates in Time Division Duplex (TDD) mode. A
time frame consists of a number of }ª subframes. A frame is divided into two portions, uplink
portion and downlink portion. Each portion consists of a group of subframes dedicated to
serving either uplink or downlink traffic. A switching point «© is defined as the point in which
SCBS £ switches from uplink mode to downlink mode. There is a number of }ª − 1 possible
switching points for a frame length of }ª, then «© ∈ ¬1,… ,¤ª, where ¤ª = }ª − 1. For any of
these possible switching points, there will be at least one subframe for uplink and for
downlink in each frame.
We define the vector « = �«, «, … , «�� as the vector of switching points for all SCBSs in the
system. Varying switching points asynchronously in different cells may cause opposite
transmission directions in different cells which leads to cross-link interference (i.e. uplink-to-
Commentaire [KH8]: UOULU

Celtic-Plus SHARING Document D.4.2
Public page 48 of 94
downlink interference and downlink-to-uplink interference). Consequently, SINR for uplink
and downlink, respectively, for a receiving node at location � ∈ ¨© is given by:
Γ©̄ °��� � �©̄ °ℎ©,©���± + ∑ �²̄ °ℎ²,©��� + ∑ �³�°ℎ³,©���³∈�´µ²∈�¶µ\l©o (9)
Γ©�°��� = �©�°ℎ©,©���± + ∑ �²̄ °ℎ²,©��� + ∑ �³�°ℎ³,©���³∈�´µ\l©o²∈�¶µ (10)
where �©̄ ° (�©�°) is the uplink (downlink) power from the serving node £, �²̄ ° (�²�°) is the uplink
(downlink) power from the interfering node ¸, ℎ�,©��� is the channel gain, including pathloss,
between the transmitting node in SCBS £ and the receiving node in location � ∈ ¨©, �¯° and ��° are the sets of cells operating in uplink and downlink, respectively, and ± is the noise
variance. Furthermore, the data rates of a UE at location � ∈ ¨© for uplink and downlink,
respectively, are given by:
f©̄ °��� = �© log;1 + Γ©̄ °���A (11)
f©�°��� = �© log;1 + Γ©�°���A (12)
where �© is the bandwidth allocated to that UE. The system-load density at location � is
defined as
¹©������ ≔ »������f©������ (13)
where ¼ ∈ l½¨, �¨o and »������ = z������ f©������¾ is the load density at location �. The cell load
density for cell £ is defined as the time delay needed to serve the uplink and downlink traffic
as follows:
¿©����«©� = 1À����«©�Á ¹©���������∈ℒà (14)
where ¼ ∈ l½¨, �¨o, À����«©� is the uplink or downlink duty cycle, which is the fraction of time
frames dedicated to either uplink or downlink service within a frame, and is expressed as
follows:
À����«©� =ÄÅÆÅÇ «©¤ª ¼ = ½¨¤ª −«©¤ª ¼ = �¨ (15)
Here, dividing each cell load by its respective uplink or downlink duration is done in order to
account for the uplink/downlink effective traffic. Therefore, lower duty cycles lead to higher
delays and vice versa. Our objective is to find the vector of switching points « that minimizes

Celtic-Plus SHARING Document D.4.2
Public 49 (94)
the overall average flow delay by minimizing ∑ ÈÃ>Èé over the entire time frame. Therefore, we
define a cost function that reflects the flow delay average over the whole subframes within a
timeframe, calculated as follows:
y�É� � ÊË 1«©Ê ¿©,²¯°�«©�1 − ¿©,²¯°�«©�ÌòQ + 1¤ª −«© Ê ¿©,²�°�«©�1 − ¿©,²�°�«©�
ÌͲQÌÃÎ
Ï�©Q (16)
Thus, we can define the following cost optimization problem:
minimizeÌ y�É� subjectto 0 < ¿©,²¯°�«©� < 1, ∀£ ∈ �0 < ¿©,²�°�«©� < 1, ∀£ ∈ �
(17)
To solve this problem, we develop a distributed algorithm that dynamically optimizes the
uplink/downlink configuration. The goal is to design a decentralized algorithm that selects a
vector of switching points « that minimizes the cost function. With the lack of global network
information, the algorithm must rely only on the local information available at each SCBS to
optimize an individual cost function rather than the global cost. However, the cost function for
each SCBS depends not only on its own traffic load but also on the interference experienced
from neighboring cells. Therefore, each SCBS £ should learn to estimate its cost function and
use this estimated cost function to update its strategy. Here, an SCBS’s strategy is essentially
the selection of a switching point. In view of the interference coupling between neighboring
cells, the performance of each SCBS depends not only on its choice of switching points, but
on other SCBSs’ choices as well. Therefore, we model this problem as a strategic
noncooperative game where the set of players are the SCBSs, in which each of them selects
its action Ö©� Ã� where }© is the number of possible actions, which corresponds to the number
of switching points ¤ª in our problem. For each base station £ ∈ �, the corresponding cost
function can be expressed as follows:
y© ×Ö©� Ã�, Ø>©Ù = 1«©Ê ¿©,²¯°1 − ¿©,²¯°ÌòQ + 1¤ª −«© Ê ¿©,²�°1 − ¿©,²�°
ÌͲQÌÃÎ
(18)
Each player £ chooses an action following a mixed strategy profile Ú©, which is a vector of
probability distributions over the set of possible actions Û©. Let the strategy of choosing an
action Ö©� Ã� by player £ at a time frame � be the probability that this action is selected Ú©,"Ã;ÜÃA��� = Pr ×Ö©��� = Ö©� Ã�Ù. Then, by randomizing the action selection following their mixed
strategies, players aim at minimizing their long-term (expected) cost functions given by:
y©̅�Þ©, Þ>©� = Êy© ×Ö©� Ã�, Ø>©ÙßÚ²,"à×ÜàÙ�²Q"∈á (19)
In this game, each SCBS will choose the action that can lead to minimizing its cost function y©, given other players’ actions. We propose an algorithm that captures this behaviour by

Celtic-Plus SHARING Document D.4.2
Public page 50 of 94
adopting the Gibbs Sampling-based probability distribution, in which the probability of playing
an action ֩� �:
Λ©,"Ã;ÜÃA�Ø>©� =exp ä−å©y© ×Ö©� Ã�, Ø>©Ùæ∑ exp ×−å©y©;Ö©���, Ø>©AÙ�Ã�Q (20)
where å© is a Boltzmann’s temperature coefficient. In what follows, we evaluate the
performance of the proposed dynamic TDD algorithm. To illustrate the gains of the proposed
scheme, we compare it against two baseline schemes: 1) fixed TDD frame, in which small
cells are assumed to have the same synchronous TDD frame, with equal uplink and downlink
duty cycle, and 2) random TDD frame, in which the switching point is varied randomly. We
consider an arbitrary number of SCBSs distributed randomly, and underlaying the macrocell
coverage area. In this work, we focus only on the SCBS-to-SCBS co-channel interference
scenario. The bandwidth is assumed to be shared between all SCBSs. The bandwidth is
assumed to be divided equally between all UEs transmitting or receiving in a given subframe.
Both SCBSs and UEs are assumed to transmit with their maximum power, and hence, no
power control is considered here. We use the average packet throughput as the performance
measure for different schemes, which is defined as the packet size divided by the delay
encountered to complete its transmission. The motivation behind this is that it captures both
packet rate and delay, which is the objective of the proposed scheme. To investigate the
asymmetric uplink/downlink traffic, we conduct simulations for different mean uplink-to-
downlink ratios. For example, uplink-to-downlink ratio of 0 dB means that the average rate
requirement z© ¦©⁄ is the same for uplink and downlink. Each SCBS uses a sequence of time
frames, no more than a maximum of 200 frames to learn its load and update its
uplink/downlink configuration accordingly. In general, the performed simulations are based on
scenario 2.2.1 defined in [D.2.2].
In Figure 34, we compare the packet throughput performance of our scheme against the two
baseline schemes for different uplink-to-downlink ratios. All SCBSs are assumed to have the
same average uplink-to-downlink ratios while the instantaneous traffic is different. Figure 34
shows that the proposed scheme achieves significant gains reaching up to 200% at −20 dB
compared to the random scheme in all traffic conditions. Moreover, the figure also shows that
our approach outperforms the fixed scheme in case of asymmetric traffic conditions. The gain
increases as the level of asymmetry increases, since the SCBSs are able to learn their uplink
and downlink loads and adapt their transmissions accordingly. Figure 34 also shows that the
proposed algorithm achieves up to 97% gain at −20 dB over the fixed assignments. However,
the gain becomes smaller in the symmetric traffic case in which the fixed scheme is shown to
achieve the same performance since it allocates equal resources to uplink and downlink and
hence it is suitable for symmetric traffic.
Figure 35 shows the average packet throughput for the case in which half of the cells have
opposite uplink-to-downlink ratios compared to the other half. For example, if the first half
has a ratio of 10 dB, the second half has a ratio of −10 dB. This scenario is challenging in the
sense that it is associated with high cross-link interference. In Figure 35, we can see that the
proposed scheme achieves considerable gains over both the random and fixed schemes.
Clearly, the proposed algorithm is able to find a balance between selecting the switching point
that matches the SCBS load and avoiding configurations that are associated with high cross-
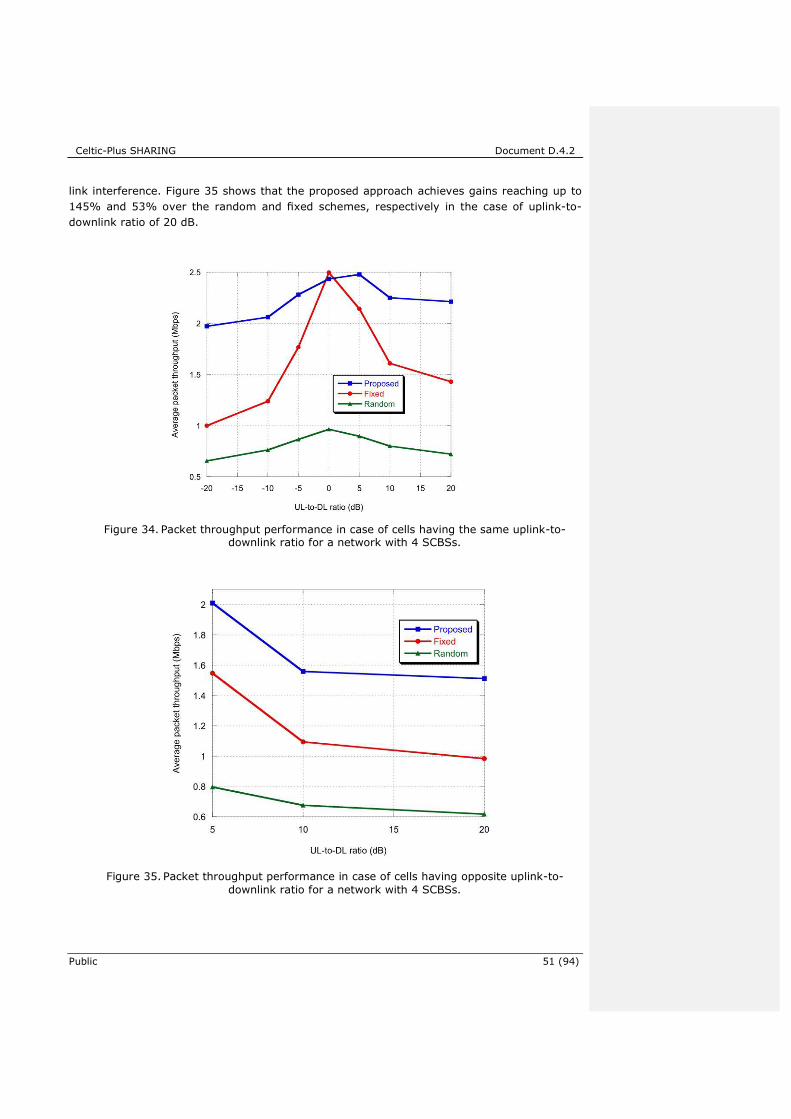
Celtic-Plus SHARING Document D.4.2
Public 51 (94)
link interference. Figure 35 shows that the proposed approach achieves gains reaching up to
145% and 53% over the random and fixed schemes, respectively in the case of uplink-to-
downlink ratio of 20 dB.
Figure 34. Packet throughput performance in case of cells having the same uplink-to-downlink ratio for a network with 4 SCBSs.
Figure 35. Packet throughput performance in case of cells having opposite uplink-to-downlink ratio for a network with 4 SCBSs.

Celtic-Plus SHARING Document D.4.2
Public page 52 of 94
3 MOBILITY MANAGEMENT
The introduction of heterogeneous network deployments and small cells makes some of the
problems related to mobility to become worse. These problems include for example: signaling
performance, data interruption during cell change, detection of small cells and coverage in
border areas, especially in the unbalance zone where the macrocells have worse uplink
coverage but better downlink coverage than the small cells. In order to handle this
challenges, several SHARING innovations are aiming to increase the robustness of the
handovers by reducing the number of handovers and by increasing the transmission and
reception diversity. The following section describes such SHARING innovations and their
performance evaluation.
3.1 Combined cell performance within HSPA heterogeneous network deployment
3.1.1 Introduction
The deployments of heterogeneous network with small cells in High-Speed Packet Access
(HSPA) allow increasing the overall network capacity, coverage and performance. In co-
channel deployment, the Low-Power Nodes (LPN) are deployed within the macrocell coverage
region, where the transmission/reception points created by the low-power nodes have
different cell IDs (different primary scrambling codes) as the macrocell. As shown in Figure
36, cells A, B and C have different primary scrambling codes, hence the same legacy
procedure of cell selection applies for each cell and is controlled by the Radio Network
Controller (RNC).
Figure 36. Low-power nodes have different cell IDs as that of the macro node in a co-channel deployment.
In a combined cell deployment, the low-power nodes are deployed within the macrocell
coverage area, where the transmission/reception points created by the low-power nodes have
the same cell IDs (same primary scrambling codes) as compared to the macrocell. This
P-CPICH
Cell A Cell B Cell C
Commentaire [KH9]: ERICSSON

Celtic-Plus SHARING Document D.4.2
Public 53 (94)
deployment is also referred to as soft or shared cell. As shown in Figure 37, each node
belongs to the same cell and these nodes assist the macro node.
Figure 37. A combined cell deployment, where the low-power nodes are part of the macrocell, i.e., macro and low-power nodes have the same cell ID.
The co-channel deployments of small cells introduce some additional challenges that the
network has to confront:
1. Frequent Handovers and Impact on End-User Performance: Since there are
more cells in a macro node coverage area with the introduction of low-power nodes,
the frequency of handovers is increased. This results in more frequent Radio Resource
Control (RRC) signalling which might impact the end-user performance negatively. For
example, more dropped calls due to RRC signalling delay or failure.
2. Neighbour Cell List Size: In a co-channel deployment, the neighbor cell list becomes
too large to cover all radio positions. The required cell planning and the system
capability to identify and keep the cell update subset is complex.
3. Intercell Interference and Pilot Pollution: With the introduction of low-power
nodes, the interference structure becomes more complex than in a homogenous
network. Since all the low-power nodes have to transmit the pilot signals continuously,
irrespective of data transmission, the pilot pollution is more severe.
4. Downlink/Uplink Imbalance: The well-known problem of downlink/uplink imbalance
where the UE is served by strong macro downlink and has a stronger uplink to the low-
power node. This might cause problems, both for uplink and downlink control
channels.
5. Energy Consumption: Since the pilots and certain control channels are always
transmitted in a co-channel deployment (even though no UE is served by these low-
power nodes), the energy associated with these channels is wasted.
The main principle of combined cell is that the UE can move seamlessly within the cell
coverage area without any RNC interaction. Hence in combined cell, it can avoid active set
update, serving cell change and cell selection/reselection procedures. Figure 38 shows the
system architecture for the combined cell deployment; where all the nodes within a combined
cell are tightly coupled by high speed data link to a central unit in the combined cell. For
example this central unit can be a macro scheduling unit similar to current main unit in
P-CPICH
Same cell
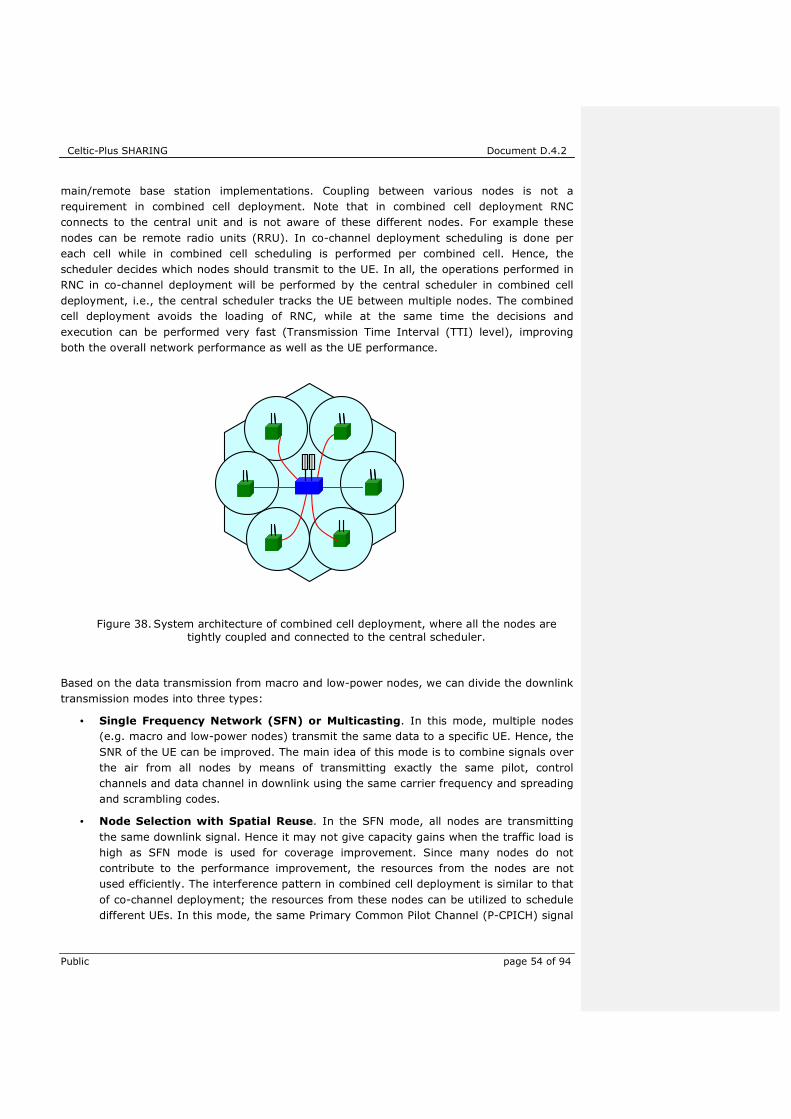
Celtic-Plus SHARING Document D.4.2
Public page 54 of 94
main/remote base station implementations. Coupling between various nodes is not a
requirement in combined cell deployment. Note that in combined cell deployment RNC
connects to the central unit and is not aware of these different nodes. For example these
nodes can be remote radio units (RRU). In co-channel deployment scheduling is done per
each cell while in combined cell scheduling is performed per combined cell. Hence, the
scheduler decides which nodes should transmit to the UE. In all, the operations performed in
RNC in co-channel deployment will be performed by the central scheduler in combined cell
deployment, i.e., the central scheduler tracks the UE between multiple nodes. The combined
cell deployment avoids the loading of RNC, while at the same time the decisions and
execution can be performed very fast (Transmission Time Interval (TTI) level), improving
both the overall network performance as well as the UE performance.
Figure 38. System architecture of combined cell deployment, where all the nodes are tightly coupled and connected to the central scheduler.
Based on the data transmission from macro and low-power nodes, we can divide the downlink
transmission modes into three types:
• Single Frequency Network (SFN) or Multicasting. In this mode, multiple nodes
(e.g. macro and low-power nodes) transmit the same data to a specific UE. Hence, the
SNR of the UE can be improved. The main idea of this mode is to combine signals over
the air from all nodes by means of transmitting exactly the same pilot, control
channels and data channel in downlink using the same carrier frequency and spreading
and scrambling codes.
• Node Selection with Spatial Reuse. In the SFN mode, all nodes are transmitting
the same downlink signal. Hence it may not give capacity gains when the traffic load is
high as SFN mode is used for coverage improvement. Since many nodes do not
contribute to the performance improvement, the resources from the nodes are not
used efficiently. The interference pattern in combined cell deployment is similar to that
of co-channel deployment; the resources from these nodes can be utilized to schedule
different UEs. In this mode, the same Primary Common Pilot Channel (P-CPICH) signal

Celtic-Plus SHARING Document D.4.2
Public 55 (94)
is transmitted from all the nodes. The downlink control channel and the data traffic are
scheduled to different UEs from different nodes, based in their position inside the
network and the available resources (HS codes and power). Since the scheduling is
done per combined cell, the central scheduler decides which nodes should transmit to
the various UEs.
• MIMO mode with spatially separated nodes. In this mode, some of the low-power
nodes act like distributed MIMO, i.e., MIMO transmission with spatially separated
antennas. In this mode, MIMO gains (both diversity and multiplexing gains) can be
achieved.
Since in combined cell, all the nodes are connected to the central scheduler, we envision a
significant gain in uplink performance. This is due to macro diversity combining. The downlink
performance might vary based on the transmission modes, but a positive impact of the
reduction on mobility procedures should also be observed in the final results in realistic
scenarios.
There is no impact in the legacy architecture with relation to signalling and standardized
procedures. The model builds on the close network relationship between the transmitters
within a cell that may be located in the same physical node or not. And for this work, the
assumption is that proprietary (not standardized) signalling is used in case of any
coordination between nodes is required.
3.1.2 Impact of combined cell deployments on mobility
The mobility performance of combined cell deployments has been proved to increase the
robustness of the handovers [MIN14]. This is achieved because the deployment enables a
reduction on the number of handovers triggered on a coverage area. Furthermore, the
handover signalling failure rate is reduced compared with deployments of separated small
cells, especially for challenging mobility scenarios. A challenging mobility scenario can be
defined as one with high system load, several spots with low geometry and user’s mobility
that can reach high-speed. Some example of this scenario could be a train station or train
tracks, a stadium hosting an event or a traffic light corner where low-power nodes have been
deployed.
A macro-only scenario compared with a low-power node scenario would produce similar
results in terms of number of handovers, but the deployment would suffer from their own
capacity and coverage limitations. This means, that a combined cell deployment is expected
to address also the capacity and end-user performance limitation in addition to the mobility.
3.1.3 Initial performance results for SFN mode
The SFN mode of combined cell is 100% legacy compatible and does not require any changes
in the standard.
Initial simulation results are available for the scenarios 2.8.1 (macro-only) and 2.8.2 (HetNet)
in [D.2.2] for FTP traffic (2 MB object) and 4 LPNs (distributed RRU’s/antennas connected to
macro in addition to the main antennas) per macro sector. For FTP upload, the results confirm
the initial assumption that even a SFN deployment is able to increase the uplink throughput
due to the macro-diversity gain of having distributed receiving antennas. As can be seen in
Figure 39, by increasing the load per square kilometre, the mean user throughput is impacted

Celtic-Plus SHARING Document D.4.2
Public page 56 of 94
in a macro-only deployment (labelled MACRO-500m-ISD). Meanwhile, the combined cell SFN
deployment shows a very low degradation (labelled CC-SFN-4LPN). Additionally, the 5%-ile
user’s throughput for combined cell remains virtually unchanged with the load.
Figure 39. Comparison of uplink performance of Macro-500 m ISD deployment versus a combined cell SFN deployment with 4 additional distributed RRUs.
Figure 40. System throughput efficency of the simulated combined cell SFN deployment versus the macro-only with 500 m ISD.
The results indicate that the combined cell increases the area capacity. This can be visualized
by looking at the system throughput efficiency, defined as the ratio between the offered load
and the system throughput. If the network starts to delay packets, the output rate is reduced

Celtic-Plus SHARING Document D.4.2
Public 57 (94)
with respect to the input rate meaning that the queues in the network increases and the
services start to suffer. According to the results in Figure 40, the throughput efficency of the
combined cell deployment for uplink is higher than the macro-only deployment for higher
loads in the same area. This is an indication that more users can be served by a combined cell
deployment as expected.
3.1.4 Conclusions
The deployment of combined cells is expected to improve the spatial reuse of the codes used
for the transmissions. In order to do this, HSPA standardization changes are required. Also
the combined cell deployments are expected to improve the receiving and transmitting
diversity of the areas of coverage. This should be translated in improvements in throughput,
especially for uplink transmissions. In this work, this claim is supported by the simulation
results that additionally indicate an increase in the area load capacity. In addition to the
diversity gain, the users benefit from a lower probability of signaling failure due to handover
procedures that otherwise would be required if the same area would be covered by a
heterogeneous network deployment. Additional future work will analyze the downlink impact
of the deployment.
3.2 Uplink/Downlink split within a heterogeneous LTE network
3.2.1 Conclusions
Due to the nature of heterogeneous networks there is a possibility that the best cell in
downlink is not the same cell as the best cell in uplink. In such situations the use of the
traditional cell selection method, where the serving cell is the one with the strongest downlink
signal strength may result in significantly sub-optimal performance, especially in uplink
transmissions. This specific issue emerging with heterogeneous cells is called uplink/downlink
imbalance. As the macro eNodeB and LPNs in heterogeneous networks have different
downlink output powers and the maximum uplink transmission power of UEs is the same
regardless of the serving cell, some UEs may find themselves in a uplink/downlink imbalance
situation. Due to the much higher transmission power of macro eNodeB compared to LPN, the
downlink cell border between macro eNodeB and LPN is pushed relatively close to the LPN,
where both cells are perceived equally strong. In uplink on the other hand the maximum UE
transmission power is constant regardless of serving cell, and therefore basically it makes no
matter whether the receiving cell type is macro eNodeB or LPN. Therefore if only uplink would
be considered, the cell border should be roughly in the middle of the two nodes where the
path loss is the same to both nodes. Thus, optimal handover borders are different for uplink
and downlink in heterogeneous networks.
The illustration of the uplink/downlink imbalance situation can be seen in Figure 41. In the
figure, the location of the macro eNodeB and the LPN is depicted on the x-axis. The upper
part of the figure shows the Reference Signal Received Power (RSRP) measurement (based on
downlink received signal power) result on the y-axis while the lower part of the figure shows
the path loss on the y-axis.
Commentaire [KH10]: ERICSSON

Celtic-Plus SHARING Document D.4.2
Public page 58 of 94
The RSRP measurement border can be regarded as the ideal downlink cell border since the
RSRP measurements are based on downlink measurements, while the ideal uplink cell border
would be the border where the path losses are equal since the UE can transmit with the same
power regardless of the serving cell. As can be seen from the figure, if the downlink
transmission powers of the LPN and macro node are not equal, these borders are not equal.
To improve the efficient usage of radio resources in such situations, one method is called
uplink/downlink split. In case of uplink/downlink split the UE would connect both links
separately to the best serving cells, in practice the downlink to the best macrocell and uplink
to the closest node, whether it is the same macro eNodeB or a LPN. This would improve
especially the uplink performance and the utilization of radio resources.
Figure 41. The Uplink/Downlink imbalance with heterogeneous networks.
As the transmission power of the UE is limited, it is beneficial to transmit to the eNodeB with
the least amount of path loss, whether it is a macro eNodeB or a LPN. Transmitting to the
eNodeB with least amount of path loss would increase the transmission capacity due to higher
SNR. It could also decrease the interference caused to other UEs, since the users in the cell
border areas would be the most probable users to activate the split mode. The power control
of those users in the cell border areas still connected to the macro eNodeB in uplink adjusts
the transmission power close to maximum due to the long distance and high path loss to the
macro eNodeB. In co-channel case this could of course cause interference to other users in
neighbouring cells. When such a user activates the uplink/downlink split and connects the
uplink to the LPN, which is much closer, it can adjust the transmission power much lower and
its transmissions are now scheduled together with those users it used to interfere, resulting in
much less interference.
Uplink/downlink split would also help in load balancing by offloading users located within the
Cell Uplink Range Expansion (CURE) area from the highly congested macrocell into the low-
power cell.

Celtic-Plus SHARING Document D.4.2
Public 59 (94)
The user plane split can be done on several protocol levels. In our study the uplink/downlink
split is based on dual-connectivity, currently being specified in 3GPP for LTE Release-12. The
separation is done at the Packet Data Convergence Protocol (PDCP) layer, as shown in Figure
42, so there would be separate Radio Link Control (RLC) and lower layers for both nodes,
when the split is activated. Control signalling over X2 is used to setup and release the
uplink/downlink split.
Figure 42. Realization of the uplink/downlink split.
The performance of the uplink/downlink split feature on protocol level will be evaluated by
means of system-level simulations. The simulation setup is based on the 3GPP Case 1
specified in [3GPP10a] and on Scenario 2.3.5 described in [D.2.2]. The network deployment
consists of 21 macrocells and 84 outdoor picocells co-located with traffic hotspots.
Furthermore, the users are generated according to Poisson process with several arrival
intensities, and the users are assumed to be moving with a speed of 3 km/h towards a
random direction. Finally, the data traffic is mainly uplink FTP traffic with fixed packet size,
but also downlink is studied. The aim of the simulations, results and the result analysis is to
provide understanding about the usefulness of the uplink/downlink split in real world systems
and whether or not the feature would actually provide gains especially in the uplink in
heterogeneous LTE networks. The usefulness is evaluated according to the achieved gains in,
for example, user throughput and delay compared to the case where no uplink/downlnk split
is used.
3.2.2 Uplink simulation results
In this section the results for the gains in uplink user throughput are presented. To start with,
Figure 43 presents the CDFs of user uplink throughputs in a low load case with FTP file size of
2 MB. As can be seen from the figure, the CDFs show that CURE cases get much better
performance than the normal case for low user throughputs. Interestingly, the performance of
especially high CURE cases seems to suffer for the users with average throughputs compared

Celtic-Plus SHARING Document D.4.2
Public page 60 of 94
with the normal case. With the highest throughputs, all of the CDFs seem to be quite close
together. This implies that in the low load case, uplink/downlink separation provides the best
gains in throughput especially for users with low throughputs. For users with average
throughputs, the gains are not as high, and some of those users seem to be even suffering
from the uplink/downlink separation especially with higher CUREs. This could be explained by
having users with decent uplink throughput to a macrocell being transferred to a picocell with
inferior uplink connection due to high CURE value resulting in performance degradation. With
large throughputs the users are close to their serving base stations and experience already a
very good connection and therefore the separation does not affect them much.
Figure 43. CDFs for user throughputs with low load, FTP file size 2 MB.
Figure 44 presents the gain in user rates on average as well as for the 5%-ile users. The 5%-
ile users mean the 5% of the users who get the worst rates. This measure is generally used
to indicate the users at cell-edges. As the figure clearly shows, the gains on average are quite
moderate, reaching the best average gain of 5.8% with CURE of 14 dB. The 5%-ile rate gains
are clearly better than the gains on average. The highest gain here is achieved with 18 dB
CURE, the gain being 63%. These results support the conclusion drawn from the CDFs, that
the highest gains are achieved by the users with the lowest throughputs, and users with
medium throughputs may even suffer from the uplink/downlink separation, balancing the
gains achieved by users with lower throughputs and resulting in quite low gains on average.

Celtic-Plus SHARING Document D.4.2
Public 61 (94)
Figure 44. User rate gains with low load, FTP file size 2 MB.
Figure 45. CDFs for user throughputs with high load, FTP file size 2 MB
In comparison, Figure 45 shows the CDFs of user uplink throughputs in a high load case with
FTP file size of 2 MB. As can be seen from the figure, there is a distinctive difference between
the CDF of the normal case and the CDF of already the lowest CURE case of 4 dB. This means
that there are already quite considerable gains in throughput even with low CUREs, when the
system is in high load. When comparing the position of the curves with the low load case, the
overall throughputs in the system are now clearly smaller. It was noted that in addition to

Celtic-Plus SHARING Document D.4.2
Public page 62 of 94
those users, who have a lower path loss to a pico eNB and are therefore better served by it,
there are highly overloaded macrocells, which benefit greatly, when traffic is offloaded from
them to picocells. As the CURE is increased up to 20 dB, the gains increase, though with
diminishing returns.
Finally, Figure 46 shows the user rate gains with the high load scenario, when the FTP file size
is 2 MB. When compared with the low load case, it can be seen that the gains have increased
and even more than tripled. Again the throughput for the 5%-ile users is higher than the
average of all users reaching the gain of 218% at CURE of 20 dB. The highest average gain is
achieved also at CURE 20 dB, at which the gain is 49%. These results imply that the more
heavily the system is loaded the more gain from uplink/downlink separation is achieved.
Figure 46. User rate gains with high load, FTP file size 2 MB
3.2.3 Downlink simulation results
Simulations were also performed with downlink traffic model. FTP traffic was used with FTP
file size of 2 MB and similar network scenario as with uplink simulations. Looking at the
downlink performance, Figure 47 shows the CDFs for user downlink throughputs with low
load. As can be seen from the figure, in case of uplink/downlink separation the user
throughputs seem to be lower than in the reference case. This was expected, since with
downlink traffic only the higher layer signaling back to the network, such as Transmission
Control Protocol (TCP) acknowledgements, goes through the picocell uplink. As the sizes of
these signaling packets are small, the backhaul delay from pico to macro seems to be
dominant and cause negative gains. Improvement of the bit rates in the uplink does not
considerably improve the uplink transmissions of such small files in practice. On the contrary,
activating uplink/downlink split will just increase the Round Trip Time (RTT) of these packets
and makes especially the slow start slower thus increasing the time until TCP reaches
congestion avoidance mode and is able to transmit with larger transmission window sizes. The

Celtic-Plus SHARING Document D.4.2
Public 63 (94)
results were similar also with larger file sizes and higher loads, although the gains were
generally not as bad when the file sizes and loads were increased, but still negative.
Figure 47. CDFs for user downlink throughputs with low load
3.2.4 Conclusions
The simulations show, that using uplink/downlink separation results in gains in uplink
transmissions. The gains are measured from the mean FTP rates of the users both with and
without uplink/downlink separation. The highest gains seem to result from a highly loaded
system and relatively high CURE such as 16 – 20 dB. The highest gain for the average user
FTP rate is achieved with the smaller of two file sizes, 2 MB, and the CURE value of 20 dB,
where the average gain is 49%. The results show that for the worst 5%-ile of the users, FTP
rate the gains are even higher than average, which suggests that users with the lowest rates
benefit the most from the uplink/downlink separation. Usually, the users with the lowest rates
are the users at the cell border, which makes sense in this case, since those users are now
transferred from the macrocell to the picocell with the uplink/downlink separation resulting in
better uplink connection. The gains seem to increase up to a certain point, when the CURE is
increased, and interestingly, the higher the system load is, the larger gains are. This suggests
that offloading users from highly congested macrocells to more vacant pico nodes is one of
the key factors in achieved gains along with the improved uplink connection of especially the
cell-edge users.
With downlink traffic, the simulations show that using UL/DL separation results in decreased
performance. This is explained by downlink transmissions not benefitting from the increased
capacity in uplink, since the uplink transmissions contain only small size TCP
acknowledgements. On the contrary, the increased round trip time caused by the backhaul
delay between the secondary eNodeB and the master eNodeB negatively affects the TCP slow
start. This can be seen from the protocol simulation results where small file sizes were used.

Celtic-Plus SHARING Document D.4.2
Public page 64 of 94
The delay in the uplink signaling causes delay in the downlink transmissions, and therefore,
decreased performance.
Celtic-Plus SHARING Document D.4.2
Public 65 (94)
4 BACKHAUL MANAGEMENT
Generally speaking, each base station within a cellular network has to be connected to the
core network. That connection, called e.g., a transmission or a backhaul, can be either wired
(copper or fiber) or wireless (microwave link or self-backhauling). In addition, the network
connection has to be able to support the required air-interface capacity and the delay
requirements introduced by the desired network functionalities, such as mobility management
and inter-node coordination.
Together with the network densification and the introduction of LTE-A, the topic about
backhaul cost becomes increasingly important. In order to reduce the total cost of network
deployment and operation, new and innovative ways to enhance the use of the backhaul
connection are desired. This chapter describes the SHARING innovations within the field of
backhaul management.
4.1 Backhaul offloading by proactive caching
4.1.1 Introduction
The rapid proliferation of smartphones has substantially enriched the mobile experience,
leading to new wireless services (e.g., multimedia streaming, web-browsing applications), and
content owners (Telco’s, users, and Over The Top (OTT)). Currently, mobile video streaming
accounts for 50% of mobile data traffic and is expected to skyrocket to a 500X increase over
the next ten years. These new paradigms urge mobile operators to redesign their networks
cost-effectively by deploying intelligence at the network edge. Despite these exponential
traffic growths, results have shown that multiple users actually request similar contents. At
the same time, dynamic content caching has recently attracted much attention and is
considered as one of the most disruptive technology directions for beyond 4G networks. By
harnessing recent advances in storage and computing, dynamic caching can help alleviate
backhaul congestion, reduce loads at peak times and minimize latency, by pre-caching
contents at strategic network edge locations. If smartly coupled with meta-data analytics,
network operators can further exploit the vast amount of users’ context information (location,
speed, etc.) for a better predictability of future demands, to proactively cache popular
contents before users actually request them.
A simplified overview of the assumed scenario is shown in Figure 48. We consider a scenario
formed by v Small Base Stations (SBS) and } UEs. Each SBS x is connected to a Central
Scheduler (CS) via a limited backhaul link with capacity f�, whereas user ç is connected to its
serving SBS via a wireless link with capacity f�; . Let us assume that user ç downloads
contents from a library of é files with probabilities � . The files in the library é have lengths of ¨ respectively, with bitrates �. Further, assume that there is Y number of file requests during g time-slots. A request ê is served immediately and is said to be satisfied, if the rate of
delivery is higher than the file bitrate, such that: �ë�ëì>�ë ≥ £�, where ¼� is the length of the
requested file, �����X� is the start (end) time of the delivery, respectively, and £� is the bitrate
of file ��. Therefore, the file satisfaction ratio can be defined as:
Commentaire [KH11]: UOULU

Celtic-Plus SHARING Document D.4.2
Public page 66 of 94
Figure 48. Illustration of backhaul offloading via caching.
î�Y� � 1YÊ1ï ¼���X − �� ≥ £�ð� (21)
The goal of the network operator is to keep this ratio above a target QoS, while reducing the
backhaul delivery cost. To achieve this, we propose a proactive caching procedure.
Let us now suppose that the total backhaul link capacity is less than the total wireless link
capacity between SBSs and UEs. This assumption stems from the fact that SBSs may have
limited backhaul connections. Since the bottleneck is the backhaul, a smart way of minimizing
the backhaul usage is to proactively cache contents at the SBSs, during low-peak demands.
In other words, if the SBSs pre-cache the contents before users’ actual requests arrive,
corresponding UEs can immediately be served from their SBSs. Suppose that the backhaul
rate during the content delivery for request ê at time � is z����. Then, the backhaul load can be
defined as:
¿�Y� = 1YÊ 1¼� Êz�����Q�ë� (22)
Further, assume that SBS x has a storage capacity of �� and the amount of storage usage at
time � is ��. Therefore, the backhaul minimization problem subject to backhaul, storage
and QoS constraints is written as:
min�ëì ,� ¿�Y� �. �. z���� ≤ f�ñ���� ≤ ��î�Y� ≥ î�� (23)
where � is the minimum target satisfaction ratio. Solving the above problem is
computationally intractable, and thus a heuristic solution is used by storing popular files in the
caches of SBSs. Here, each SBS x tracks, learns and builds its users’ demand profiles to infer
on their future requests. Let �� denote the discrete file probabilities of users serviced by SBS x, referred to as popularity matrix where rows represent users and columns represent file
popularities/ratings. A perfect knowledge of �� would allow SBSs to precache contents,
nevertheless, in practice, this matrix is not perfectly known, large and sparse. Using

Celtic-Plus SHARING Document D.4.2
Public 67 (94)
supervised machine learning tools, a distributed proactive caching procedure is proposed by
exploiting the correlations of the users’ files to infer on the probability that user ç requests file �. The proposed caching procedure is composed of a training and prediction step. In the training
step, each SBS x builds a model based on the available information of the popularity matrix ��. This is done by solving a least square minimization problem, in order to calculate the
estimated file popularity matrix �ò�, as follows:
min©Ü,©ÍÊ;ê ª − ê̂ ªA ,ª + zËÊ£ +Ê£ªª Ï (24)
where the sum is only over the �ç; �� user/file pairs in the training set where user ç actually
rated file � (i.e., ê ª), and the minimization is over all the } + é parameters, where } is the
number of users and é the number of files in the training set. In addition, êª = ê̅ + £ + £ª is the
baseline predictor where £ª models the quality of each file � relative to the average ê̅ and £ models the bias of each user ç relative to ê̅. Finally, the weight z is chosen to balance
between regularization and fitting training data.
4.1.2 Evaluation and results
We now turn to evaluate the performance of proactive caching and provide key insights under
two different scenarios. The parameters for the numerical setup are given in Table 14. For
simplification, the link and storage capacities are assumed to be equal. Three regimes of
interest are considered: (i) low load, (ii) medium load, and (iii) high load. Over a time
duration g, Y numbers of requests are generated. The arrival times of user requests are
drawn uniformly at random, and the requested files are sampled from the ZipF distribution. At � = 0, the popularity matrix is constructed perfectly. Out of 20% of the elements of this matrix
are removed uniformly at random and the remaining elements of the matrix are used for
training in Collaborative Filtering (CF). These removed entries are then predicted using the
regularized Singular Value Decomposition (SVD). After the popularity matrix estimation,
proactive caching is applied by storing the most popular files subject to the SBSs’ storage
constraints. Having these files locally in the cache of SBSs and starting from � = 0, the
delivery is carried out by each SBS until all requests are served. Random caching is used as a
baseline procedure, referred to as reactive.
Three parameters of interests are considered for the performance plots of both proactive and
reactive caching approaches: (i) number of requests Y, (ii) total cache size {, and (iii) ZipF
distribution parameter ô. To see the percentages of differences between the proactive and
reactive approaches, plots are normalized. The evolution of the satisfaction ratios and
backhaul loads are shown in Figure 49. Each subfigure represents the impact of one
parameter for a given regime while the other parameters are kept fixed.
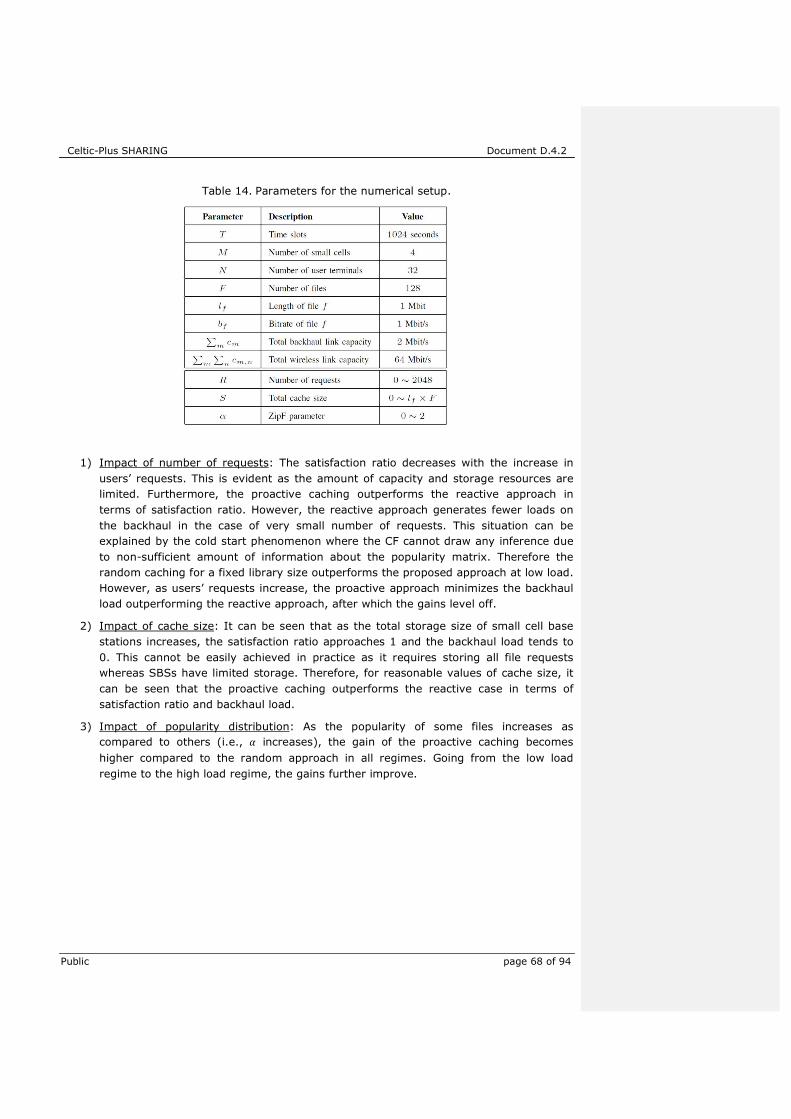
Celtic-Plus SHARING Document D.4.2
Public page 68 of 94
Table 14. Parameters for the numerical setup.
1) Impact of number of requests: The satisfaction ratio decreases with the increase in
users’ requests. This is evident as the amount of capacity and storage resources are
limited. Furthermore, the proactive caching outperforms the reactive approach in
terms of satisfaction ratio. However, the reactive approach generates fewer loads on
the backhaul in the case of very small number of requests. This situation can be
explained by the cold start phenomenon where the CF cannot draw any inference due
to non-sufficient amount of information about the popularity matrix. Therefore the
random caching for a fixed library size outperforms the proposed approach at low load.
However, as users’ requests increase, the proactive approach minimizes the backhaul
load outperforming the reactive approach, after which the gains level off.
2) Impact of cache size: It can be seen that as the total storage size of small cell base
stations increases, the satisfaction ratio approaches 1 and the backhaul load tends to
0. This cannot be easily achieved in practice as it requires storing all file requests
whereas SBSs have limited storage. Therefore, for reasonable values of cache size, it
can be seen that the proactive caching outperforms the reactive case in terms of
satisfaction ratio and backhaul load.
3) Impact of popularity distribution: As the popularity of some files increases as
compared to others (i.e., ô increases), the gain of the proactive caching becomes
higher compared to the random approach in all regimes. Going from the low load
regime to the high load regime, the gains further improve.

Celtic-Plus SHARING Document D.4.2
Public 69 (94)
Figure 49. Backhaul Offloading via Proactive Caching: Dynamics of the satisfied requests and backhaul load with respect tothe number of requests, total cache size and ZipF
parameter.
Celtic-Plus SHARING Document D.4.2
Public page 70 of 94
5 HETEROGENEOUS NETWORK DEPLOYMENTS – PERFORMANCE AND STRATEGIES
The creation of innovations and solutions that are aimed by the SHARING project, are often
based on investigations and research conducted by the partners in several areas that directly
are later impacted by the innovations proposed in order to solve the problems and challenges
that are observed. In this section, some of the SHARING partners describe their findings when
evaluating strategies or performance of several aspects of the heterogeneous networks.
5.1 Fundamental performance limits of heterogeneous networks
The objective of this task is to investigate and analyze the performance of heterogeneous
networks as a means to quantify the improvement in terms of coverage and rate by using
such topologies. This will provide concrete measures on how much (and using which
design/technologies) heterogeneous networks can give an answer to the data traffic
“tsunami”. The main challenges in performing this study are the following:
• The spatial modeling of the base station locations in a heterogeneous network remains
an open topic, since little real-world information is yet available about picocell or
femtocell deployments. It seems that the standard grid-based model that has been
used in the past is not scalable to an accurate model of a heterogeneous multitier
network. A first model, which is very tractable and allows us to derive closed-form
expressions for key performance metrics, is a statistical one in which the base stations
are located according to a Poisson point process in a two-dimensional plane. Such a
spatial distribution for base station locations corresponds to complete randomness,
and a large class of powerful results and analytical tools are available from the field of
stochastic geometry. The Poisson model will be the starting point, however our
performance analysis should consider other spatial models and random distributions
that introduce a certain level of correlation and dependence among the base station
placements.
• The issue of cell association should be taken into account and revisited as compared to
traditional cellular networks. Although in existing macrocell networks, the max-power
coverage regions for each base station are designed to have roughly the same amount
of traffic, i.e., more base stations are deployed in areas that generate more traffic; a
meaningful cell association policy should assign users to base stations that offer them
the best user-perceived rate. However, optimizing the rate for all users is very
complex as the rates of the users are coupled. Several relaxations and considerations
should be made to be able to analyze the performance of heterogeneous networks
with efficient cell association and realistic load balancing.
• A very important issue that is often neglected in the analyses is that of backhaul
connection. It is often assumed that the main design challenge is the base station-
mobile link and that the base station has a high-speed backhaul connection that easily
handles the data flowing to and from it. In this task, the effect of backhaul connectivity
and quality/robustness will be taken into account in the performance analysis of
heterogeneous networks. Issues related to mobility, type of connection (wired vs.
wireless) and propagation environments will play a critical role in the analysis.
Commentaire [KH12]: SUPELEC

Celtic-Plus SHARING Document D.4.2
Public 71 (94)
This task is related to scenario 2.9.6 in [D.2.2].
5.2 Asymptotic performance analysis and design of wireless networks under heavy traffic
In this work [DES14][DES12], our main objective is to provide an asymptotic performance
analysis of a wireless network composed of multiple transmitter-receiver pairs. Each
transmitter is equipped with multiple transmit antennas and a coordinated beamforming is
assumed to be used by the transmitters. We assume that the traffic arriving to the buffer of
the transmitters is i.i.d. in time (with known mean value) and independent of the wireless
channel. Furthermore, each user has an outage-based QoS metric to be achieved. In this
context, the queue length of one transmitter depends also on the beamforming allocations of
the other transmitters. The beamforming is performed such that the average total power is
minimized and the probability that the queue size at each transmitter exceeding a threshold is
bounded by a predefined threshold. We will consider the following probabilistic QoS metric for
the queue length at each transmitter õ �ê¬ö³��� > ö³��� � À³ (25)
which means setting a buffer outage probability in some values that can be tolerated by the
application. The aforementioned QoS metric can provide better delay constraints as compared
to other QoS metric based on the average queue length.
5.2.1 Interest of Heavy Traffic Modeling
Addressing the problem of coordinated beamforming under dynamic arrival traffic may not be
tractable using standard optimization tools. We therefore develop our solution using the
heavy traffic diffusion approximation since delay (and queue outage) is often easier to
understand and analyze in this regime. Heavy traffic modeling provides an asymptotic
analysis of the system where the traffic arrival is close to the boundary of the rate region. It
is worth noting that delay grows to infinity if the arrivals are pushed toward the boundary of
the rate region. The objective is then to design an algorithm that minimizes an asymptotic
growth coefficient. It has been shown (e.g., see [BUCHE02][BUCHE05][WU06]) that
developed control techniques using heavy traffic modeling performs quite well in the
light/moderate traffic regime.
5.2.2 Brief description of the contribution
We tackle the coordinated beamforming and performance analysis problem by a proposing a
strategy based on heavy traffic asymptotic modeling. The approach is then to divide the
allocation into two parts: equilibrium and reserve beamformers. The equilibrium problem
consists in allocating the beamformers according to the statistics of the channel states so that
on average the transmission rate is equal to the arrival rate. This equilibrium allocation can be
formulated as an optimization problem that turns out to contain some hidden convexity (one
can refer to [LAK10][LAK11][LAK13] and the references therein for more details). The
Commentaire [KH13]: SUPELEC

Celtic-Plus SHARING Document D.4.2
Public page 72 of 94
transmission rate constraint can be converted using Second Order Cone Program (SOCP) into
a convex problem. The main challenge lies then in the allocation of the reserve beamforming.
It should be noticed that allocating the reserve beamforming using optimal control theory and
Hamilton-Jacobi-Bellman (HJB) framework is very hard in this case. We therefore tackle the
above reserve allocation problem as follows. We first show that the queues of the users in the
heavy traffic regime can be modeled as a reflected multidimensional Stochastic Differential
Equation (SDE). Then, taking advantage of the specific structure of the reflection matrix (due
to the fact of having one receiver per transmitter), we propose a control policy that decouples
the multidimensional SDE into several parallel SDEs and ensures that an invariant measure
for each of these SDEs exists. Using results from probability theory, we can obtain a closed
form expression of the stationary distribution function of the dynamics of each SDE which
allows finding a relation between the reserve allocation and the overflow probability. We have
noticed that the value of the reserve power allocated by our algorithm compared to the
equilibrium power is very small, which implies that the sub optimality gap between our
reserve allocation approach and other optimal control approach (e.g., using HJB) is small in
many scenarios.
5.2.3 System Model
We consider a system of ø transmitters each with ¨ antennas serving one receiver and using
bandwidth ¤. For notational simplicity, we index the transmitters and receivers so that
transmitter õ serves user õ. Let ù�²��� denote the power gain of the channel between
transmitter ¸ and user ú at time �. Each of these channel gains is assumed to evolve
independently of the others as an ergodic finite state Markov chain. The matrix û��� � üý�²���þ of all channel gains at time � evolves then as an ergodic finite state Markov chain with, say, v� possible states and we index the states as {� � l1,… ,v�o. We shall denote the event that
the channel gains are in the x-th state as û��� = û�. The corresponding ergodic probability
distribution for each state will then be denoted as Ú�, and let E�lo denote the expectation
over this probability distribution.
At receiver õ, the interference from other transmitters is treated as Gaussian noise. When
transmitter õ uses beamformer �³, the rate ê³;����, … , �����,����A over the corresponding link
will be,
ê³��, … , �� , û� = ¤ log �1 + |�³����ý³³|± + ∑ �������ý�³���³ (26)
where ¤ is the bandwidth and ± is the noise variance. The power of transmitter õ is given by �³��� = �³�����³���. For each queue we suppose that the instantaneous arrivals Ö³��� at time � are i.i.d., with
mean z³ and (finite) variance ±",³ , and are independent of the arrivals at the other queues and
the channel process.
In order to derive the heavy traffic asymptotic model, we assume that at a time interval Δ� there will be ��çΔ�� arrivals and ��ç�Δ�� channel changes, for 0 < < 1. Therfore, ç can be
seen as the order of magnitude of the arrivals that grows highly in the heavy traffic situations

Celtic-Plus SHARING Document D.4.2
Public 73 (94)
so that the network is in full load. We denote by ö³��� the queue length of transmitter õ at
time �, and �³� ���� the scaled version as follows:
�³� ���� � 1ç�B ö³�ç��� (27)
The heavy traffic condition in terms of arrival and departure rates will be [WU06]:
lim →� ×z³� � − E� �ê³ ×�� ����Ù�Ù ç�B = _³ < 0,∀õ ∈ l1, … , øo (28)
Under the aforementioned assumption, we have shown in [DES14] that the scaled queue can
be modeled by a reflected diffusion process.
Theorem Consider ø interfering links with ¨ antennas at each transmitter. As ç → ∞ the
vector-valued process of the scaled queue lengths is given as,
q��� = q�0� − Á p;����A�� + ����� + �����u (29)
In the above, ���� is a vector of ø independent standard Wiener processes, p is the vector of
the functions
�³;����A = Ê Ú�ÊÖ³,²�û���²���°�²Q
��
�Q (30)
where Ö�,²�û�� = ���;�T��û��A��à . The matrix � = `±�²c satisfies
�� = �"�" + �!�! (31)
with �" = �úÖù;±",³A while the elements of the covariance matrix �!�! = `��²c are given as
��² = 2E "Á ê̂��0�ê̂²�����Î�u # (32)
where ê̂³��� = ×ê³ ×�T;û���AÙ − z³Ù. Finally, the elements of ���� are given as
$³��� = %−min�&� '�³�0� − Á �³;����A�� +ʱ³²«²����²Q
�u ()
Î (33)
Proof. Please refer to [DES14] for the proof.

Celtic-Plus SHARING Document D.4.2
Public page 74 of 94
As mentioned above, we then consider a simple/specific control policy that allows decoupling
the multidimensional SDE into several parallel SDEs and ensuring that an invariant measure
for each of these SDEs exists. The probabilistic QoS metric is then met by a specific choice
the control vector. This is summarized in the following two results.
Lemma Consider a reserve control policy that does not depend on the channel states. Then
the asymptotic model reduces to
�q��� � *�;q���A�� ~ ������ ~ ����� (34)
Lemma The overflow requirements for the asymptotic system can be satisfied by the
following policy:
�;q���A � *>+q��� (35)
with + � �úÖù�/|f³|� and |f³| � ,-�,.�./0ë �ê�f>�À³�1. In the above, �³��� is the corresponding
threshold in the asymptotic regime.
Further discussions about the decentralized implementation of the aforementioned policy,
with imperfect channel knowledge and delayed information exchange between the
transmitters, can be found in [DES14].
5.2.4 Numerical Results
Finally, we provide some numerical results in a simple setting in order to show that our
approach can yield desirable results in practical systems. We consider a simple scenario with
3 interfering transmitter - receiver pairs, using the same bandwidth of 5 MHz. We assume
that each channel gain has only two possible values. Also, the arrivals at each transmitter are
set as Poisson processes with mean rates equal to 1, 1.5 and 2 Mbps. The overflow thresholds
are set to 500, 750, 1000 bits at each transmitter respectively and the overflow probability to
0.01 for all transmitters. The coherence time of the channels is set to 20 ms, modeling then
slow fading channels in indoor or low mobility environments. In Figure 50, we can observe
that the queue length under the proposed power control method behaves in a much more
controlled manner and is below its respective threshold for most of the time. This means that
our solution can be suitable for services with stringent delay constraint. In Figure 51, we can
observe that the allocated reserve power is very small as compared to the equilibrium power.

Celtic-Plus SHARING Document D.4.2
Public 75 (94)
Figure 50. Evolution of the queue length
Figure 51. Evolution of the allocated power
5.2.5 Conclusion
In this section, we have studied the problem of beamforming and power allocation in a
wireless network under heavy traffic limit. The objective is to keep the queue outage
probability under a certain threshold while the channel evolves according to an ergodic
Markov chain. For that we divide the allocation into two parts: i) equilibrium part allocated
depending on the channel statistics, and ii) drift part which is function of the backlogged
queues of the users at each time. Under this model, it was shown in this work that the scaled
queue can be modeled as a reflected diffusion process. This allowed us to derive a closed

Celtic-Plus SHARING Document D.4.2
Public page 76 of 94
form expression of the allocated power and beamforming and a closed form expression of the
outage probability. We have provided numerical results that corroborate our claim of
improving the system performance.
5.3 Performance of heterogeneous network deployments in a large-scale real environment
In front of the huge data traffic growth [Cis14], one of the most promising answers is to
densify existing macro network with small (low-power)cells [Hu11]. The reduction of
interference, which is the major issue to be solved in such two-tier network, has been
anticipated with the introduction of specific eICIC techniques in 3GPP LTE Release-10. Those
techniques should be completed with automated network management algorithms to allow for
plug-and-play installation and live optimization. Another key issue that may limit the small
cell layer capacity is the backhaul network that relays the user data between the core network
and the small cells. The deployment of a wired backhaul is an option, but its feasibility
depends on the existing optical fiber network and on leasing costs. In many cases actually,
the small cells will be deployed along with a wireless (or mixed) backhaul [SCF13]. The
location of the small cells, in-street and below surrounding buildings, makes them hard to
reach with traditional Line-Of-Sight (LoS) wireless backhaul which is typically used for
macrocells. The selected backhaul technology must thus show strong performance even in
Non-LoS (NLoS) conditions [Let14]. The links towards aggregation points, also known as
hubs, which are connected to the core network, brings new challenges in the network design.
In particular, the reliability of the link is of the highest importance to ensure a constant QoS
to the end-user.
Densification of wireless networks with small cells usually starts with the will to enhance user
QoS, and is driven by the spatial user traffic distribution, i.e., the small cell antennas are
installed to increase local network capacity in relation with a local high throughput demand.
But best small cell locations regarding the user QoS might not meet backhaul constraints and
this could create a bottleneck in the network. The following study is thus divided in two main
parts. The heterogeneous network performance under ideal backhaul assumption is first
evaluated considering different small cell layer designs. Then we introduce the backhaul
network on top of one of these deployments, considering different approaches, from manual
to automated designs. Finally, the heterogeneous network performance is combined with
backhaul capacity to characterize the impact of wireless backhaul.
5.3.1 Small cell densification design and performance evaluation under
realistic traffic demand rise
The study reported in this section aims at the identification of small cell network topologies
and configurations that improve QoS while minimizing energy consumption, which is a major
part of the operational costs for an operator. The user QoS is characterized by the
downlink/uplink service coverage outage and the user peak throughput statistics. The energy
efficiency is assessed by considering the average downlink power consumed by eNodeB’s
transmission with respect to their traffic load according to the model published in [Kle11],
which distinguishes the power consumption between macro and micro base stations (the
micro model is assigned to the small cell).
Commentaire [KH14]: SIRADEL

Celtic-Plus SHARING Document D.4.2
Public 77 (94)
The analysis of the uplink/downlink LTE-A network performance relies on an extended version
of the 3D coverage simulation tool presented in [Bra12]. The user traffic is spatially
distributed in 3D to take into account indoor users at different floors. Thus path loss
predictions are computed at different heights based on a real 3D environment representation
and the Volcano technology (site-specific ray-based propagation models [Cor09]). The
framework integrates ICIC/eICIC techniques to mitigate interferences. In downlink, a static
ICIC Fractional Frequency Reuse (FFR) scheme is considered for Macro eNodeB (MeNB). It is
complemented with a Time-Domain eICIC to enhance the cell-edge experience of small cell
users [Ped13]. Two main parameters can be tuned to modify the eICIC configuration: CRE
and the ABS duty cycle, the first one being typically used to favour the attachment of users to
a small cell instead of a macro eNodeB, while the second one is applied to reduce the
interference of small cell edge users. In uplink, the power control relies on the conventional
Open-Loop Power Control (OLPC) technique, which is driven by two cell-specific parameters: a
path loss compensation factor to adjust the link quality and transmit power as a function of
the path loss; and the uplink SINR target. Uplink ICIC is also enabled in case of high
interference levels [Cas08].
The scenario relies on a typical macro network layout in the dense urban environment of Paris
VII district, which is densified with co-channel small cells. Macro eNodeBs are deployed over a
larger area, on two rings around a central three-sector site in order to take into account
realistic interference patterns. Small cells are introduced into the network infrastructure to
enhance the coverage and boost the capacity. They are uniformly deployed on urban furniture
along the streets (at a moderate height of 6 m), leading to a quasi-constant ISD. Three
different small cell deployment topologies are evaluated in the present study, respectively
with ISD of 200 m, 100 m (shown in Figure 52) and 50 m. Small cells have omni-directional
antennas and their maximum transmit power can take values from 100 mW to 5 W. Other
main simulation parameters are summarized in Table 15
Figure 52. Simulation setup (small-cell ISD 100m).

Celtic-Plus SHARING Document D.4.2
Public page 78 of 94
Table 15. Simulation parameters.
System
LTE FDD 2x10 MHz.
Central frequency: 2.6 GHz.
Uplink/Downlink MIMO configuration: 2 x 2.
Uplink path loss compensation factor: 1.
Uplink SINR Target: 20.8 dB (when uplink ICIC is disabled).
Macrocell
layout
Hexagonal site deployment: two rings around the central site,
i.e., 19 sites corresponding to 57 cells (see Figure 52).
Inter-site distance (ISD): 450 m.
ICIC FFR scheme: 5% of total radio resources being allocated
to each sub-band, re-use factor of 3.
Average antenna height: 32 m above ground.
Maximum total transmit power: 40 W.
Antenna: directional, 14 dBi, 6° electric down-tilt, 32 m above
ground.
Uplink noise figure: 2.5 dB.
Small cell
layout
Spectrum usage: co-channel.
Small cell deployment: uniform with ISD from 50 m to 200 m.
Maximum total transmit power: from 100 mW to 5 W.
Antenna: omnidirectional, 5 dBi, 6 m above ground.
Uplink noise figure: 2.5 dB.
User
equipment
Uplink total transmit power: from -40 dBm to +23 dBm.
Antenna: omni-directional, 0 dBi, 1.5 m above ground.
Downlink noise figure: 9 dB.
In the 0.98 square km study area, active users are spread with following rules:
• 1000 active users per square km; one third is served by the considered operator.
• 20% outdoor users, uniformly distributed over the area.
• 80% indoor users, uniformly distributed in the building floors (meaning that the
number of users in a building is proportional to its height).
The same throughput demand is assumed for all users. The study starts with mean
throughputs of 90 kbps in downlink and 30 kbps in uplink. The downlink mean throughput has
been chosen such that the interference level in the initial macro network leads to 10% of user
service outage (i.e., percentage of users that cannot be served with the required throughput).
Then in order to subject the network to a realistic traffic increase, we consider an annual
mobile traffic growth of 47% [Cis14] during the five years following 2015. We make the
assumption that the number and the distribution of active users are kept constant over the
years but that their uplink/downlink throughput demands increase. The obtained evolution
thus goes from 90 kbps at Y0 to 610 kbps at Y0 + 5 years (Y5) in downlink and from 30 kbps
at Y0 to 205 kbps at Y5 in uplink, as illustrated in Figure 53. Note that these throughput
values represent the mean user throughputs during active communications.
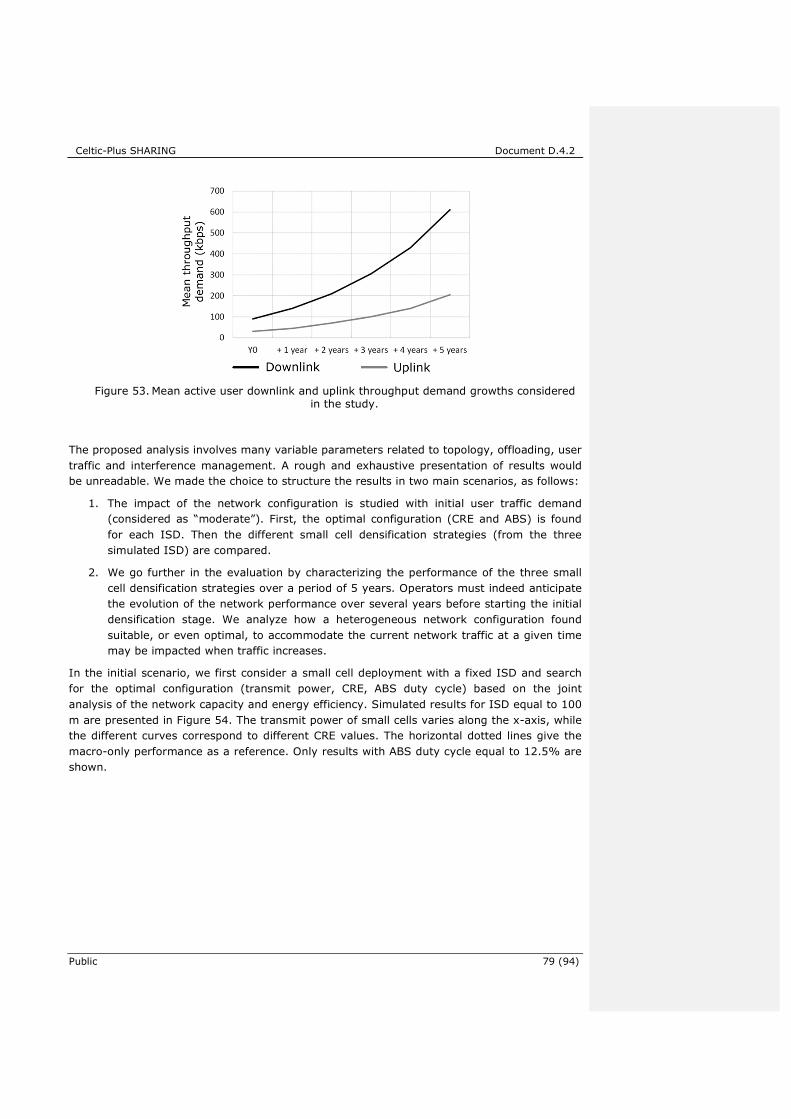
Celtic-Plus SHARING Document D.4.2
Public 79 (94)
Figure 53. Mean active user downlink and uplink throughput demand growths considered in the study.
The proposed analysis involves many variable parameters related to topology, offloading, user
traffic and interference management. A rough and exhaustive presentation of results would
be unreadable. We made the choice to structure the results in two main scenarios, as follows:
1. The impact of the network configuration is studied with initial user traffic demand
(considered as “moderate”). First, the optimal configuration (CRE and ABS) is found
for each ISD. Then the different small cell densification strategies (from the three
simulated ISD) are compared.
2. We go further in the evaluation by characterizing the performance of the three small
cell densification strategies over a period of 5 years. Operators must indeed anticipate
the evolution of the network performance over several years before starting the initial
densification stage. We analyze how a heterogeneous network configuration found
suitable, or even optimal, to accommodate the current network traffic at a given time
may be impacted when traffic increases.
In the initial scenario, we first consider a small cell deployment with a fixed ISD and search
for the optimal configuration (transmit power, CRE, ABS duty cycle) based on the joint
analysis of the network capacity and energy efficiency. Simulated results for ISD equal to 100
m are presented in Figure 54. The transmit power of small cells varies along the x-axis, while
the different curves correspond to different CRE values. The horizontal dotted lines give the
macro-only performance as a reference. Only results with ABS duty cycle equal to 12.5% are
shown.

Celtic-Plus SHARING Document D.4.2
Public page 80 of 94
Mean DL peak
throughput (Mbps)
Mean traffic load
(%)
Power consumption
(kW)
Mean UL peak
throughput (Mbps)
SC cover ratio
(%)
Figure 54. Network performance KPIs for various small cell (SC) transmit powers and CRE.
It is observed that all tested small cell configurations allow for full service coverage, on the
contrary to the macro-only network. The small cell cover ratio shows increasing macro
eNodeB offloading to the small cells when increasing small cell transmit power and CRE value.
The performance is particulary increased with at least double downlink peak throughput. The
uplink peak throughput is also significantly increased for a small cell transmit power higher
than 1 W, making more users send data to closer eNodeBs with less path loss. Further
increasing the small cell transmit power jointly enhances the QoS and reduces eNodeB
downlink power consumption. These results stress the great benefits of small cell deployment.
Same tendency is observed for small cell deployments with ISD equal to 200 m and 50 m,
i.e., the optimal configuration is obtained when small cell transmit power and CRE are
maximal.
We then compare small cell densification topologies (respectively with ISD equal to 50 m, 100
m and 200 m) based on these optimal configurations. Figure 55 shows the user downlink and
uplink peak throughput obtained with these different topologies compared to the macro-only
scenario. It is observed that the denser the small cell layer is, the higher is the user peak
throughput. In particular, the cell-edge users seem to benefit from the network densification:
the 5%-ile downlink peak throughput for ISD equal to 50 m is 43 times higher than the one of
the macro-only network. Besides, the total power consumption decreases while the number of
small cells increases thanks to the large decrease of the macro eNodeB traffic loads as shown
in Table 16. In heterogeneous topologies, the percentage of macro eNodeB consumption
decreases with ISD, while the small cell consumption strongly increases. A minimum is
reached with ISD equal to 100 m. ISD equal to 200 m indeed allows for only limited macro

Celtic-Plus SHARING Document D.4.2
Public 81 (94)
offloading; and ISD equal to 50 m leads to a high proportion of energy consumed by the small
cell layer.
Figure 55. User peak throughput (Mbps) versus ISD.
Table 16. Network power consumption versus ISD.
ISD Reference –
Macro only 200 m 100 m 50 m
Total consumption (kW) 18.40 17.02 11.74 15.08
% from macro eNodeB 100.0 92.8 75.0 53.0
In the second scenario, we focus on the performance of the three different small cell
deployment strategies against the network traffic growth over a period of five years. Figure
56 shows the downlink/uplink service outage as a function of the time. With the macro-only
network, it exceeds 10% as soon as Y1 in downlink, and Y3 in uplink. The availability of radio
resources is commonly the main limiting factor in downlink (overloading) whereas the service
coverage is the main limiting factor in uplink (low SINR).The lowest densification (ISD equal
to 200 m) is not sufficient to decrease the downlink outage under the 10% threshold,
demonstrating that it is not appropriate either as a mid-term solution. On the contrary, the
intermediate densification (ISD equal to 100 m) fullfils this requirement until Y3 and the
highest one (ISD equal to 50 m) until Y4.
Finally, none of the tested small cell densifications allows for satisfactory user coverage in Y5.
The first limiting factor for low to medium small cell densifications is the downlink network
capacity. On the contrary, the highest densification undergoes first a significant loss of
coverage in the uplink, due to strong interference levels. This observation highlights the
importance of considering both downlink and uplink coverage-limited criteria when designing
dense heterogeneous network deployments.
The analysis of user peak throughputs and energy efficiency is only relevant when the
network outage remains acceptable. That is why in the following, we only compare those

Celtic-Plus SHARING Document D.4.2
Public page 82 of 94
metrics for scenarios having a network service outage lower than 10%. Main results are
reported in Figure 57.
Downlink
Uplink
Figure 56. Service outage (%) evolution over time.
Mean DL peak
throughput (Mbps)
Mean UL peak
throughput (Mbps)
Power consumption
(kW)
Figure 57. Network KPIs evolution over time.
The increase of user data traffic leads to significantly degraded mean downlink and uplink
peak throughputs over time. For instance, they are respectively reduced by 30% and 64% at
Y5 with ISD equal to 50 m. Nevertheless the densification with ISD equal to 50 m clearly
remains the best option for almost all KPIs. The best energy efficiency (ratio between the
downlink power consumption and downlink user traffic) is provided by ISD equal to 100 m up
to Y1 and by ISD equal to 50 m in following years. As soon as the traffic load grows up in the
macro layer, the total downlink power consumption significantly increases, thus the small cell
deployment with maximum offloading becomes the most efficient. This demonstrates that the
best strategy at Y0 (based on current traffic conditions) does not necessarily remain the best
strategy in the long-term.

Celtic-Plus SHARING Document D.4.2
Public 83 (94)
The current study provides input for evaluating the impact of small cell densification on
network performance and base station downlink power consumption in different traffic
conditions. Such analysis can help in the definition of a densification strategy over the years.
Of course, when dealing with network optimization strategies, we must further consider costs
(CAPEX/OPEX) as well as installation and backhauling constraints. The next section thus
resumes these studies by characterizing the impact of a non-ideal backhaul design on small
cell deployments and end-user experience.
5.3.2 Impact of wireless NLOS backhaul design on small cell deployments
and end-user experience
As shown in the design methodology in Figure 58, the deployment of small cells is driven by
the traffic distribution [Col12] so as to capture realistic user demand and optimize operational
costs. Then the backhaul (wired + wireless) must be designed to feed the small cells with the
requested user throughput. Both the small cell and backhaul deployments rely on radio
planning techniques to select the antenna locations and other system parameters. Radio
planning simulations can be done in two separate stages (without considering the backhaul
constraints in the small cell design), but we illustrate in this section the interest of predicting
the performance of the whole backhaul + small cell infrastructure.
Figure 58. Small cell and backhaul joint design methodology.
One of the optimal heterogeneous network configurations obtained in the previous section is
used as a reference. It is composed of a macro LTE layer which is densified with uniformly
distributed small cells (average separation of 200 m) to globally increase the network capacity
on the user plane. The performance reported in previous section relies on an ideal backhaul
assumption. In the following, we explore different options for the backhaul deployment design
in order to characterize its impact on the real network downlink capacity and make
propositions on the design methodology.
The locations of the wireless backhaul hub candidates are pre-defined. Actually the hubs are
assumed to be co-located with already existing macrocells. Detailed system parameters are
given in Table 17.

Celtic-Plus SHARING Document D.4.2
Public page 84 of 94
Table 17. Backhaul system parameters.
System
LTE FDD 2x10 MHz.
Central frequency: 2.6 GHz.
MIMO configuration: 2 x 2.
Hubs
Hexagonal site deployment co-located with macro eNodeB
(see Figure 52).
Maximum total transmit power: 30 dBm per antenna.
Antenna: directional (60° horizontal aperture), 12 dBi, 1 m
below macro eNodeB antenna.
Small cell
remotes
Small cell deployment: uniform with ISD from 200 m.
Antenna: directional (60° horizontal aperture), 8 dBi, 6 m
above ground.
Downlink noise figure: 6 dB.
Figure 59. Basic backhaul design.
In a first study, the backhaul design is realized manually by following a basic rule: a hub is
connected to a cluster of maximum three small cells located in the same area; and its
directive antenna is oriented towards a median direction. The remote antennas of the small
cells are oriented towards the hub they are attached to. Figure 59 shows this basic design
where the 23 small cells are attached to 9 hubs (three of them being co-located at the central
site).
The path loss is estimated with the same ray-based propagation model used for small cell-to-
end-user predictions in the previous section. Under the assumption of an average co-channel
interference of -80 dBm, all small cells show high quality links with the hubs they are
attached to, and are thus served with sufficient performance to fullfil the user downlink
aggregated throughput being 4.5 Mbps per small cell in average at Y5. But when predicting

Celtic-Plus SHARING Document D.4.2
Public 85 (94)
the deterministic interference from all hubs with a 50% load assumption, the same backhaul
design shows poor performance and introduces a bottleneck in the network. Actually, 6 hubs
have very weak connections with one or more small cells and are unable to feed them with
the expected throughput. These weak connections induce an overload of these hubs, which
are thus unable to serve even the small cells with high SINR because of the lack of radio
resources. Finally, only 7 small cells are served with the expected throughtput. In this
configuration, the end-user would finally experience slower data rates than expected by the
initial small cell design because of the backhaul limitation. These results show how a well
deployed small cell layer can be inefficient without taking into account the backhaul constraint
or without efficient backhaul design.
A second backhaul design is proposed where the selection of the hub candidates, the small
cell attachments and the antenna orientations are all together optimized in an automated
process to feed the small cells with requested downlink throughput at Y5. Deterministic co-
channel interference is predicted and taken into account in the optimization process. Figure
60 shows three small cells that have been attached to one hub during the automated process.
The impact of ray-tracing is highlighted by remote antennas being oriented towards strong
indirect paths.
Figure 60. Attachement of three small cells to one hub.
Figure 61 shows the optimized backhaul design obtained with the automated process. With
this configuration, only one hub suffers from a very weak connection and is overloaded.
Actually, this small cell is interfered by a hub located on the third ring, which is not set as a
candidate for attachement because the third ring is introduced only for realistic interference
at the edge of the study zone. We observe that the small cell named ‘SC_17’ is able to attach
to the distant hub named ‘Hub_17’, because this connection is actually found to operate in
LoS thanks to the 3D capabilities of the simulator. Finally, 17 small cells are served with the
required throughput and the average traffic load of the hubs is 45% when excluding the
overloaded one. Large margin and low loads permit to support peak traffic and anticipate
future traffic growth. These results show how an optimized process is able to provide a better
wireless backhaul design in much less time.

Celtic-Plus SHARING Document D.4.2
Public page 86 of 94
Nevertheless, it may happen that a small cell cannot be attached to any hub because it is too
obstructed or too interfered. Manual operations are then necessary, that can be for instance:
• Moving an existing hub to provide better received signal to the attached small cell.
• Adding another hub to offload the initial ones.
• Moving a small cell to try to isolate it and reduce interference from other hubs.
This latter proposition highlights the necessity for a small cell and backhaul joint design as
shown in Figure 58.
Figure 61. Optimized backhaul design from the automated process.
5.3.3 Conclusion
This section analyzes the performance of heterogeneous network deployments in a large-scale
real environment, in terms of usual QoS and energy efficiency. The main objective is to
identify network deployment rules that would allow achieving optimal performance from
multiple key indicators taking into account a realistic and well-accepted forecast over a period
of five years of wireless data traffic demand growth.
A first study under ideal backhaul assumption evaluates three different small cell deployment
topologies with respectively ISD of 200 m, 100 m and 50m. For each topology, the optimal
network configuration is first derived from a moderate user traffic (i.e., the one considered at
Y0 by the tuning of small cell maximum transmit power, CRE and ABS duty cycle). This study
relies on simulation results obtained with an innovative network coverage and analysis tool
taking into account both uplink and downlink. Results show that the highest tested offloading
configuration (small cell transmit power of 5 W and CRE of 12 dB) and largest tested ABS
duty cycle (25%) leads to the best user QoS. The highest tested small cell densification (ISD
equal to 50 m) generally gives the best coverage and highest peak throughputs; and it is the
only one supporting the four-year traffic growth tested in the study (initial traffic demand x

Celtic-Plus SHARING Document D.4.2
Public 87 (94)
4). All these results tend to demonstrate the interest of deploying small cell to jointly absorb
expected traffic increase and reduce downlink energy consumption.
A second study focuses on the wireless backhaul design to relay the user data between the
small cell layer with ISD equal to 200 m to the core network at Y5. A first basic approach that
consists in a manual attachement of small cells to hubs and median antenna orientations
shows very poor performance, making the wireless backhaul introduce a bottleneck in the
network. A second automated approach is proposed where the selection of the hub
candidates, the small cell attachments and the antenna orientations are all together
optimized. It results in a much better performing wireless backhaul where 74% of the small
cells can be served with the required downlink throughput, and hubs, which are co-located
with macro eNodeBs, experience an average load of 45%. A perspective to this work is to
illustrate the impact of the backhaul limitations on the end-user throughput statistics. The
backhaul uplink performance will also be evaluated and included in the optimization process.

Celtic-Plus SHARING Document D.4.2
Public page 88 of 94
6 CONCLUSIONS
This deliverable has provided an initial view from SHARING Work Package 4, Task 4.1, on
innovative concepts and performance evaluation related to intra-system offloading. Thus, the
goal of the presented innovations is to improve the network performance, cost- or energy-
efficiency by steering traffic between cells belonging to the same RAT, e.g., LTE or HSPA.
New concepts are presented within the areas of: SON-based load balancing and interference
management, load balancing with the help of large scale antenna systems or middleware
deployment, mobility management between macro and low-power nodes and backhaul
offloading via proactive caching of data. In addition to presenting new concepts, this
deliverable discusses also the performance and deployment strategies of heterogeneous
network deployments within various realistic scenarios.
Based on the obtained evaluation results the proposed concepts are indeed able to improve
both the user performance and the overall system capacity. Furthermore, the proposed
concepts are shown to reduce the overall network energy consumption. In general, the
observed performance enhancements are expected to contribute to lower CAPEX and OPEX
for the operators. However, more work is still needed to investigate the real potential of the
proposed concepts.

Celtic-Plus SHARING Document D.4.2
Public 89 (94)
7 REFERENCES
[3GPP10a] 3GPP TR 36.814, v9.0.0 “Evolved Universal Terrestrial Radio Access (E-UTRA); Further advancements for E-UTRA physical layer aspects”, March 2010.
[Bra12] M. Brau, Y. Corre and Y. Lostanlen, “Assessment of 3D network coverage performance from dense small-cell LTE”, IEEE International Conference on Communications (ICC) 2012, Ottawa, June 2012.
[BUCHE02] R. Buche and H. J. Kushner, “Control of mobile communications with time-varying channels in heavy traffic,” IEEE Transactions on Automatic Control, vol. 47, no. 6, pp. 992 –1003, Jun, 2002.
[BUCHE05] R. T. Buche and C. Lin, “Heavy traffic control policies for wireless systems with time-varying channels,” in Proceedings of the 2005 American Control Conference, Jun. 2005, pp. 3972 – 3974 vol. 6.
[Cas08] C. U. Castellanos, F. D. Calabrese, K. I. Pedersen and C. Rosa, “Uplink interference control in UTRAN LTE based on the overload indicator”, IEEE 68th Vehicular Technology Conference, May 2008.
[CHIA08] L. Chiaraviglio, D. Ciullo, M. Meo, and M. A. Marsan, “Energy-aware UMTS access networks,” in The 11th International Symposium on Wireless Personal Multimedia Communications (WPMC’08), 2008.
[Cis14] Cisco, “Cisco Visual Networking Index: Global Mobile Data Traffic Forecast Update 2013-2018”, February 2014.
[Col12] Coletti, C.; Hu, L.; Huan, N.; Kovács, I. Z.; Vejlgaard, B.; Irmer, R. & Scully, N. “Heterogeneous deployment to meet traffic demand in a realistic LTE urban scenario” Vehicular Technology Conference (VTC Fall), 2012 IEEE, 2012, 1-5.
[Cor09] Y. Corre and Y. Lostanlen, “Three-dimensional urban EM wave propagation model for radio network planning and optimization over large areas”, IEEE Transactions on Vehicular Technology, Vol. 58, No. 7, pp. 3112-3123, Sept. 2009.
[D.2.2] Celtic-Plus SHARING, Deliverable D2.2, “Scenarios, KPIs and Evaluation Methodology for Advanced Cellular Systems”, 2014.
[D.4.1] Celtic-Plus SHARING, Deliverable D4.1,” New opportunities, challenges and innovative concept candidates for SON/Heterogeneous Networks”, 2014.
[DES12] A. Destounis, M. Assaad, M. Debbah, B. Sayadi and A. Feki, “Heavy Traffic Approach for Queue-Aware Power Control in Interfering Wireless Links”, IEEE SPAWC 2012, June 2012.
[DES14] A. Destounis, M. Assaad, M. Debbah, B. Sayadi and A. Feki, “On Queue-Aware Power Control in Interfering Wireless Links: Heavy Traffic Asymptotic Modelling and Application in QoS Provisioning “, IEEE Transactions on Mobile Computing, Vol 13 No. 10, pp. 2345-2356, 2014.
[Eri13] Ericsson, “Ericsson Mobility Report – On the Pulse of the Networked Society”, November 2013.
[GATI14] A. Gati, S. Martinez Lopez, and T. En-Najjary, “Impact of traffic growth on energy consumption of LTE networks between 2010 and 2020,” in Self-Organizing Networks (SONETs) Workshop in conjuction with IEEE Wireless Communications and Networking Conference (WCNC 2014), 2014.
[GDOC14] “Greentouch mobile working group architecture doc2,” Internal document of GreenTouchMobile WorkingGroup, March 2013.
[GT13] GreenTouch, “Green meter research study: Reducing the net energy consumption in communications networks by up to 90% by 2020,”White paper, June 2013, available online (25 pages). [Online]. Available: http://www.greentouch.org/uploads/documents/GreenTouch Green Meter Research Study 26 June 2013.pdf
[GT14] “Green touch,” http://www.greentouch.org/.
[HOY11] J. Hoydis, S. ten Brink, and M. Debbah, “Massive MIMO: How many antennas do we need?” CoRR, Sept. 2011.

Celtic-Plus SHARING Document D.4.2
Public page 90 of 94
[Hu11] R. Q. Hu, Y. Qian, S. Kota, and G. Giambene, “Hetnets-a new paradigm for increasing cellular capacity and coverage [guest editorial],” Wireless Communications, IEEE, vol. 18, no. 3, pp. 8-9, 2011.
[Kle11] H. Klessig, A. J. Fehske and G. P. Fettweis, “Energy efficiency gains in interference-limited heterogeneous cellular mobile radio networks with random micro site deployment”, in Proc. 34th IEEE Sarnoff Symposium, Princeton, New Jersey, USA, 2011.
[LAK10] S. Lakshminarayana, J. Hoydis, M. Deabbah and M. Assaad, “Asymptotic Analysis of Distributed Multi-cell Beamforming”, in proc. of IEEE PIMRC 2010, Istanbul, Turkey, Sep. 2010..
[LAK11] Subhash Lakshminarayana, M. Debbah and M. Assaad, “Asymptotic Analysis of Downlink Multi-cell Systems with Partial CSIT,” IEEE International Symposium on Information Theory (ISIT 2011), July 31 – August 5, 2011, Saint Petersburg, Russia.
[LAK13] Subhash Lakshminarayana, Mohamad Assaad, Merouane Debbah, “H-Infinity Control Based Scheduler for the Deployment of Small Cell Networks”, Performance Evaluation Journal, 70(7-8), pp. 513-527, 2013.
[Let14] F. Letourneux, S. Guivarch and Y. Lostanlen, “3D Propagation and Environment Modeling for NLOS Wireless Small-cell Backhaul”, in Proc EuCAP’14, The Hague, April 2014.
[MAR10] T. L. Marzetta, “Noncooperative cellular wireless with unlimited numbers of base station antennas,” Trans. Wireless. Comm., vol. 9, no. 11, pp. 3590–3600, Nov. 2010. [Online]. Available: http://dx.doi.org/10.1109/TWC.2010.092810.091092
[MIN14] W. Min, E. Ramos, Y.P. Wang, N. Lidian, S. Nammi, M. Curran, Evaluation of Mobility Performance and Deployment Scenarios in UMTS Heterogeneous Networks. IEEE VTC 2014 Spring; February 18, 2014
[Ped13] K.I. Pedersen, Y. Wang, S.Strzyz and F. Frederiksen, “Enhanced inter-cell interference coordination in co-channel multi-layer LTE-advanced networks”, Wireless Communications, IEEE, 20.3: 120-127, June 2013.
[PLAN07] G. A. Plan, “An inefficient truth,” http://globalactionplanorguk.site.securepod.com/upload/resource/-Exec-Summary.pdf, Dec. 2007.
[SCF13] Small-cell forum, Backhaul Technologies for Small-cells, February 2013.
[VER08] W. Vereecken, L. Deboosere, D. Colle, B. Vermeulen, M. Pickavet, B. Dhoedt, and P. Demeester, “Energy efficiency in telecommunication networks,” in NOC2008, 2008.
[WU06] W. Wu, A. Arapostathis, and S. Shakkottai, “Optimal power allocation for a time-varying wireless channel under heavy traffic approximation,” IEEE Transactions on Automatic Control, vol. 51, no. 4, pp. 580 – 594, April 2006.

Celtic-Plus SHARING Document D.4.2
Public 91 (94)
GLOSSARY
ACRONYM DEFINITION
3D Three-Dimensional
3GPP Third Generation Partnership Project
4G Fourth Generation cellular system
AAS Active Antenna Systems
ABR Average Bit Rate
ABS Almost Blank Subframes
ACK Acknowledgement
AP Access Point
BCR Block Call Rate
BS Base Station
BW Bandwidth
CAPEX Capital Expenditure
CDF Cumulative Distribution Function
CF Collaborative Filtering
CRE Cell Range Extension
CS Central Scheduler
CSI Channel State Information
CURE Cell Uplink Range Expansion
DCR Drop Call rate
DL Downlink
EARTH Energy Aware Radio and Network
Technologies
EE Energy Efficient
eICIC Enhanced Inter-Cell Interference
Coordination
eNB Evolved NodeB
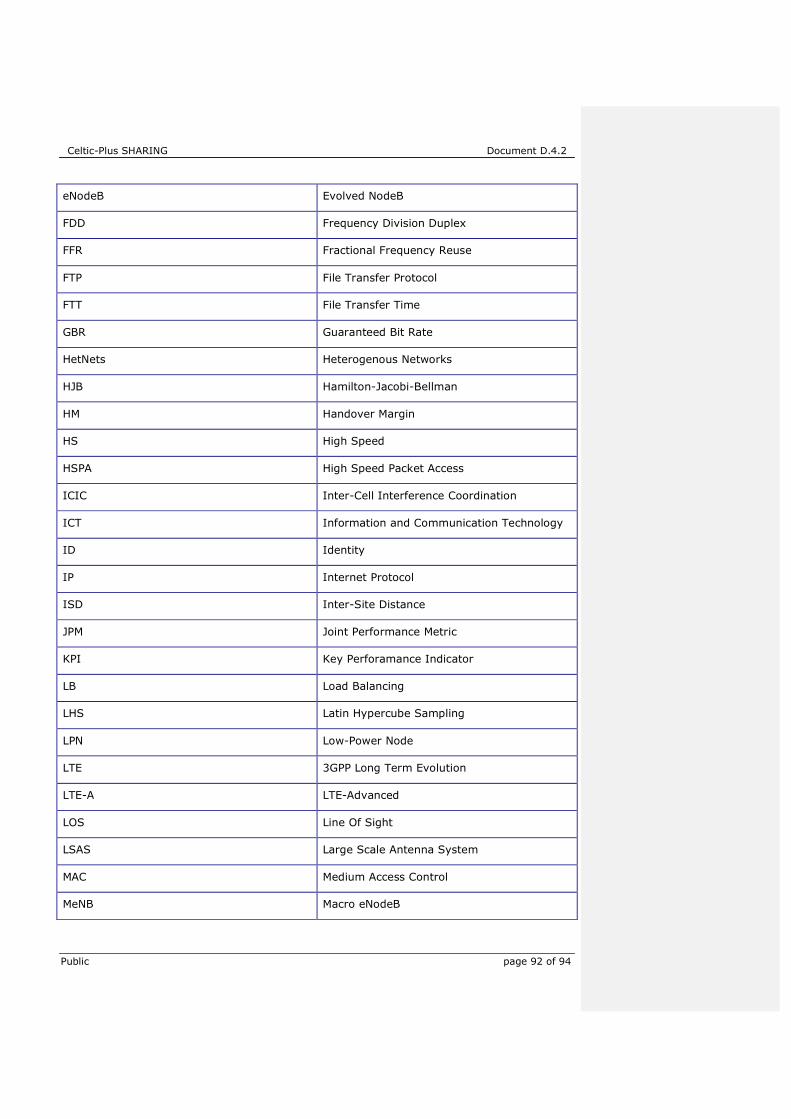
Celtic-Plus SHARING Document D.4.2
Public page 92 of 94
eNodeB Evolved NodeB
FDD Frequency Division Duplex
FFR Fractional Frequency Reuse
FTP File Transfer Protocol
FTT File Transfer Time
GBR Guaranteed Bit Rate
HetNets Heterogenous Networks
HJB Hamilton-Jacobi-Bellman
HM Handover Margin
HS High Speed
HSPA High Speed Packet Access
ICIC Inter-Cell Interference Coordination
ICT Information and Communication Technology
ID Identity
IP Internet Protocol
ISD Inter-Site Distance
JPM Joint Performance Metric
KPI Key Perforamance Indicator
LB Load Balancing
LHS Latin Hypercube Sampling
LPN Low-Power Node
LTE 3GPP Long Term Evolution
LTE-A LTE-Advanced
LOS Line Of Sight
LSAS Large Scale Antenna System
MAC Medium Access Control
MeNB Macro eNodeB

Celtic-Plus SHARING Document D.4.2
Public 93 (94)
MIMO Multiple-Input Multiple-Output
MLB Mobility Load Balancing
MSC Message Sequence Chart
MU-MIMO Multi-User MIMO
NLOS Non-Line Of Sight
NP Network Parameter
OLPC Outer Loop Power Control
OMC Operations and Maintenance Center
OPEX Operational Expenditure
OTT Over The Top
PA Power Amplifier
P-CPICH Primary Common Pilot Channel
PDCP Packet Data Convergence Protocol
PRB Physical Resource Block
PU Public
QoS Quality of Service
RAN Radio Access Network
RAT Radio Access Technology
RE Range Extension
RF Radio Frequency
RLC Radio Link Control
RNC Radio Network Controller
RRC Radio Resource Control
RRH Remote Radio Head
RRM Radio Resource Management
RRU Remote Radio Unit
RSRP Reference Signal Received Power
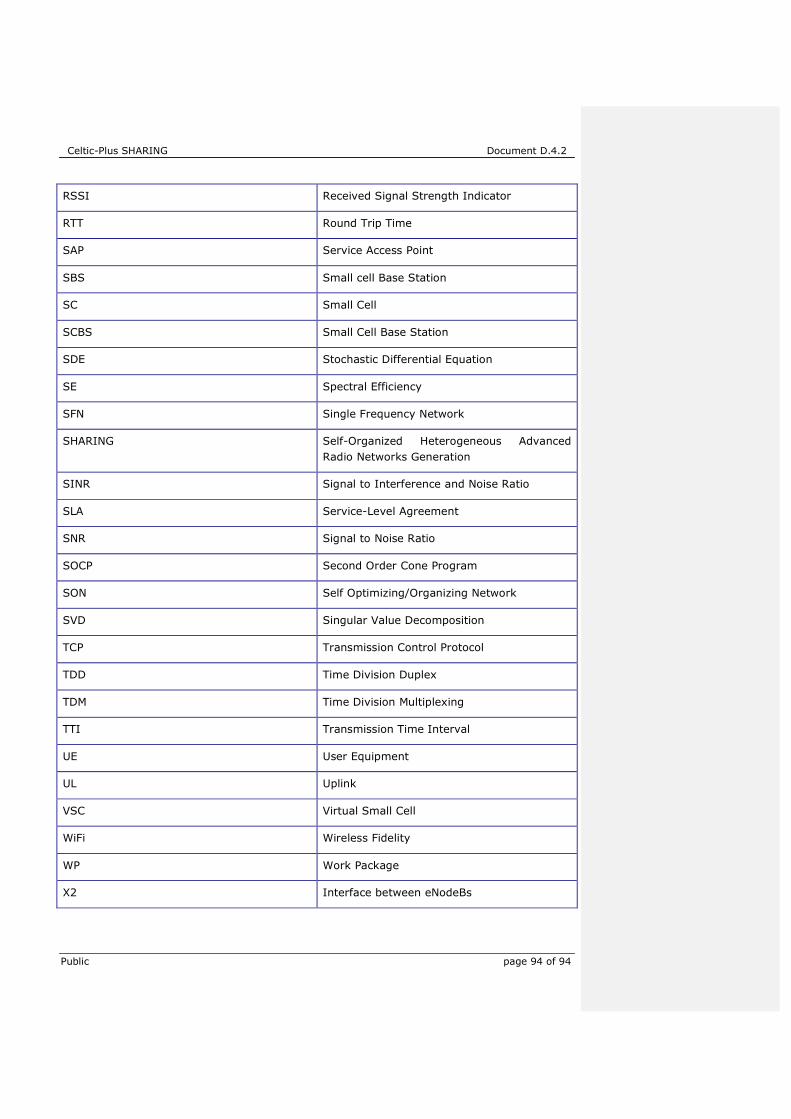
Celtic-Plus SHARING Document D.4.2
Public page 94 of 94
RSSI Received Signal Strength Indicator
RTT Round Trip Time
SAP Service Access Point
SBS Small cell Base Station
SC Small Cell
SCBS Small Cell Base Station
SDE Stochastic Differential Equation
SE Spectral Efficiency
SFN Single Frequency Network
SHARING Self-Organized Heterogeneous Advanced
Radio Networks Generation
SINR Signal to Interference and Noise Ratio
SLA Service-Level Agreement
SNR Signal to Noise Ratio
SOCP Second Order Cone Program
SON Self Optimizing/Organizing Network
SVD Singular Value Decomposition
TCP Transmission Control Protocol
TDD Time Division Duplex
TDM Time Division Multiplexing
TTI Transmission Time Interval
UE User Equipment
UL Uplink
VSC Virtual Small Cell
WiFi Wireless Fidelity
WP Work Package
X2 Interface between eNodeBs