d06: evidence base - cridfcridf.net/wp-content/uploads/2018/01/evidence_base_crdp.pdf · laszlo...
TRANSCRIPT
SP15-002 D06 I Page 1 of 12
D06: Evidence Base
Name of Project: Climate Resilient Development Pathways
SP15-002
Version: Final
07 March 2017

Page 2 of 12 SP15-002 D06 I
Quality Assurance Checklist
In preparing this document CRIDF can confirm that it has followed CRIDF’s internal general procedures, including
appropriate CRIDF generic scope of work and that it has undergone appropriate quality assurance (QA) and
quality control (QC) procedures as detailed in CRIDF’s QA manual. Furthermore, CRIDF can confirm the
applicable specific internal process and procedures have been followed including:
CRIDF’s Cost Benefit Assessments (CBAs) guideline have been applied as appropriate;
CRIDF’s Gender Equality and Social Inclusion (GESI) guidelines have been applied as appropriate;
CRIDF’s Climate vulnerability mapping methodology has been applied as appropriate;
CRIDF’s Climate Change Risk Assessment (CCRA) protocol have been applied as appropriate;
CRIDF’s Procurement guidelines have been followed as appropriate;
CRIDF’s Screens as appropriate.
Lead
Author(s)
Signature:
Laszlo Pinter
CRIDF
QA’d:
Previlage Chidzewere
CRIDF
QC’d:
Jeremy
Richardson
CRIDF
Approved:
Charles Reeve
Date: 06/03/2017 Date: 07/03/2017 Date: 07/03/2017 Date: 10/03/2017
Disclaimer
The British Government’s Department for International Development (DFID)
financed this work as part of the United Kingdom’s aid programme. However, the
views and recommendations contained in this report are those of the consultant,
and DFID is not responsible for, or bound by the recommendations made.


List of acronyms
Acronym Long-Form
CIVAT Climate Impact and Vulnerability Assessment Tool
CRDP Climate Resilient Development Pathways
CRIDF Climate Resilient Infrastructure Development Facility
DFID Department for International Development
GTAP Global Trade Analysis Project
ITCZ Inter-tropical Convergence Zone
MSIOA Multi Sector Investment Opportunity Analysis
RCP Representative Concentration Pathway
SOMs Self-organizing maps
Climate Resilience Integrated Development Pathways and their Application to the Okavango Transboundary River Basin – Methodological Note on Evidence Base.
The purpose of this document is to provide guidance for the development and combined use of the evidence base
produced through different lines of inquiry related to the vulnerability assessment of selected water infrastructure
development scenarios under the Multi-Sector Investment Options Analysis (MSIOA) program for the Okavango
Basin. The guidance directly builds on details in CRIDF’s Foundations and Approach report on Climate Resilient
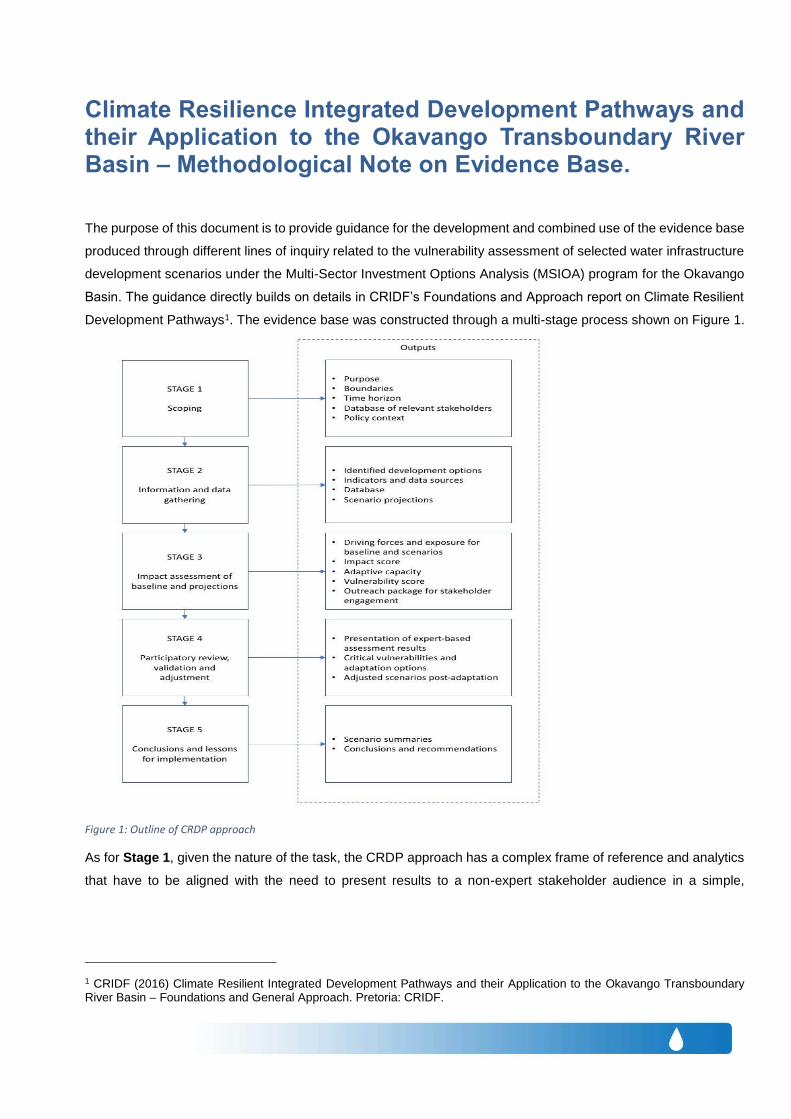
Development Pathways1. The evidence base was constructed through a multi-stage process shown on Figure 1.
Figure 1: Outline of CRDP approach
As for Stage 1, given the nature of the task, the CRDP approach has a complex frame of reference and analytics
that have to be aligned with the need to present results to a non-expert stakeholder audience in a simple,
1 CRIDF (2016) Climate Resilient Integrated Development Pathways and their Application to the Okavango Transboundary River Basin – Foundations and General Approach. Pretoria: CRIDF.

understandable form, suitable for participatory work and informed decision-making. Key elements of the frame of
reference are shown in Table 1.
Table 1
Geographic area2 Wet ITCZ region of Okavango basin (Climate Zone 1)
Semiarid/arid region of Okavango basin (Climate Zone 3)
Political context Angola, Botswana, Namibia
Time scale 2016-2035, 2046-2065, 2081-2100 (equivalent to IPCC time scales)
Development scenarios Selected from MSIOA set (2-3)
Climate scenarios Three climate variants: RCPs 2.6, 4.5, 6.0, 8.5 scenarios rolled up into low
and high probability climate outcomes and compared with present day
climate as a third variant; qualitative comments on the implications of
higher-end climate scenarios will be added as relevant in the workshop
Hydrological projections Pitman model outputs around four MSIOA development options LS3, 6, 9
and LS1 as baseline) and 12 hydrological indicators
For the purposes of this work we adopt a terminology where we refer to MSIOA development scenarios, climate
projections and the different combination of the two as scenario assemblies. Social, environmental and
economic impacts are referred to as themes. A set of model predictions/projections, all for the same future period,
produced either by variations of a single model, or by a group of different models, or by a combination of both
methods is referred to as an ensemble.
Stage 2 involves the development of the scenario architecture and the generation of model-based quantitative
projections. Considering the focus of the project, the MSIOA development scenarios serve as the primary
organizing level for the evidence base and impact assessment. Combined with the three climate variants, the
MSIOA scenarios produced the scenario assemblies shown in Table 2.
2 Longitude and latitude of the project area:
Geographic unit North West East South
Entire basin 12.25 16.25 24.0 20.5
Northern part 12.25 16.25 20.0 18.0
Southern part 18.0 18.25 24.0 20.5

Table 2: Overview of 12 scenario assemblies resulting from three climate projections (columns) and four MSIOA scenarios (rows).
Present day (PD) climate Higher probability (HP) CC Lower probability (LP) CC
LS1 LS1/PD LS1/HP LS1/LP
LS3 LS3/PD LS3/HP LS3/LP
LS6 LS6/PD LS6/HP LS6/LP
LS9 LS9/PD LS9/HP LS9/LP
Generating the evidence base for the Okavango CRDP assessment in Stage 3 involved a combination of model
and indicator based quantitative methods and quantitative information-based expert judgment. The information
was complement by qualitative information provided by stakeholders in a workshop.
As for climate change, projections for the Cubango/Okavango basin were calculated based on atmosphere/ocean
models used in the IPCC’s 5th Assessment Report. The results were compiled as ensembles means diagrams
and ensemble standard deviations diagrams. The projections were analyzed using self-organizing maps (SOMs),
based on rainfall and temperature projections and rainfall less evaporation and temperature projections. Individual
projections are created for each time slot and climate representative concentration pathway (RCP) and based on
individual SOMs, with indications of likelihood occurring for each, summarized as a more likely and less likely
climate future. Technical details of the methodology and detailed results are available in a separate report3.
Based on the results of climate models hydrological impact projections were calculated using the Pitman model.
Hydrological information is available separately for the upper and lower parts of the Okavango basin for the
baseline and selected future time scales but rolled up into a basin-wide single projection to limit the complexity of
scenario assemblies. Hydrological model runs produced results for mean monthly flows and deviations of mean
flows from the base case at a number of monitoring sites in the basin. Based on these results impacts on a series
of hydrological indicators shown in Table 3 and related ecological integrity dimensions were assessed.
Table 3: Hydrological indicators assessed based on Pitman model runs.
Mean annual runoff
Dry Min 5d Q
Dry duration
Dry ave daily vol
DryOnset (HydroWeeks)
Wet Max 5d Q
Wet duration
Wet ave daily vol
WetOnset (HydroWeeks)
Flood volume
FloodType
3 Climate change scenarios for the Cubango/Okavango Basin – Detailed Text. Prepared by CCRM.

Sediment supply
Projections of baseline and climate scenario adjusted flows from the Pitman model served as a quantitative basis
for impact assessments under social, ecological and economic themes. Due to the lack of an integrated impact
assessment model calibrated to the Okavango Basin and due to different conceptual and data challenges, impact
assessment under the three themes followed different methods. Economic impact assessment was based on the
Global Trade Analysis Project (GTAP) model to generate country-scale projections of economy-wide effects as a
results of adjusted trade flows and other economy-wide connections influenced by climatic and water availability
parameters derived from the climate and hydrological models. Given the relative scarcity of social data, social
impacts were derived from an understanding of impacts of similar projects globally and tailored as much possible
to the local circumstances. Environmental impacts for selected water and biodiversity-related indicators were
estimated on a relative scale in response to hydrological impact projections using present conditions as a baseline.
As general guidance, indicator selection can follow selection criteria such as those proposed by UNDG4.
In order to express indicator values in terms of desirability / undesirability and to bring them to a common scale,
each indicator was turned into a 5-level performance score ranging from -2 to +2 and color coding using a red-
green-yellow traffic light system (Table 4). The color coding proposed is in sync with the scheme used by the
climate index developed for the Okavango by Knight (2016)5. While the establishment of scores under the three
themes followed the approaches as described above, a more elaborate approach could be based on the following
considerations: (1) difference between projected value and baseline; (2) direction and slope of trend; (3) distance
to target or critical threshold where known; (4) reversibility / irreversibility; (5) critical interlinkages with other
indicators; and (6) scale of impact. In the case of qualitative indicators or when no numerical projection is possible
due e.g., to data limitations, the rationale for color coding would need detailed explanation in the text.
Table 4: Color coding of indicator scores
Score Impact Color scheme
2 positive
1 weak positive
0 neutral
-1 weak negative
-2 negative
In order to record indicator scores and to roll up results at different levels of aggregation, an Excel-based Climate Impact and Vulnerability Assessment Tool (CIVAT) was created. CIVAT is composed of a series of five interlinked modules as follows. Modules 1-3 are designed to capture individual indicators and indicator scores under social, economic and
environmental themes for all scenario assemblies, a baseline value and two future time periods (Table 5). In the
4 https://undg.org/wp-content/uploads/2015/02/Selecting-indicators-criteria-UNICEF.doc 5 Knight, J. (2016) Climate index: Update and discussion. Presented at the 33rd OBC meeting of OKACOM, November 28 – December 2, 2016, Gaborone, Botswana.

default version five indicators are assumed. Indicator scores are entered both numerically and with the matching
traffic light color. The tool calculates average scores for each theme, time period and scenario assembly. Unless
credible information is available regarding differential weights, the indicator scores are weighted equally and the
resulting thematic impact average applies the same color coding system as the individual indicators.
Table 5: Illustration of the thematic indicator scoring modules 1-3 in CIVAT.
Module 4 is designed to roll up aggregate impact scores by theme separately for each development scenario and
climate projection assembly and then calculate an equally weighted higher-level aggregate where the three
thematic impact scores are also rolled up into a single impact score by each scenario assembly, as shown by
Table 6. Aggregated impact scores are color-coded according to the same traffic light scoring system.

Table 6: Structure of the thematic indicator scoring module 4 in CIVAT.
As one of its elements, in Module 5 CIVAT carries forward the overall impact score for each scenario assembly
for each scenario assembly and each time period (Table 7). As another element, it captures the adequacy /
inadequacy of adaptive capacity for each impact projection and scenario assembly using the same 5-level scoring
system. Adaptive capacity elements adopted from the IPCC and include economic resources, technology,
information and skills, infrastructure, institutions and equity. In the absence of quantitative data, scores for
adaptive capacity are established through participatory methods by building on stakeholders’ understanding of
the scenario assemblies built up through a workshop process and their familiarity with baseline capacity available.
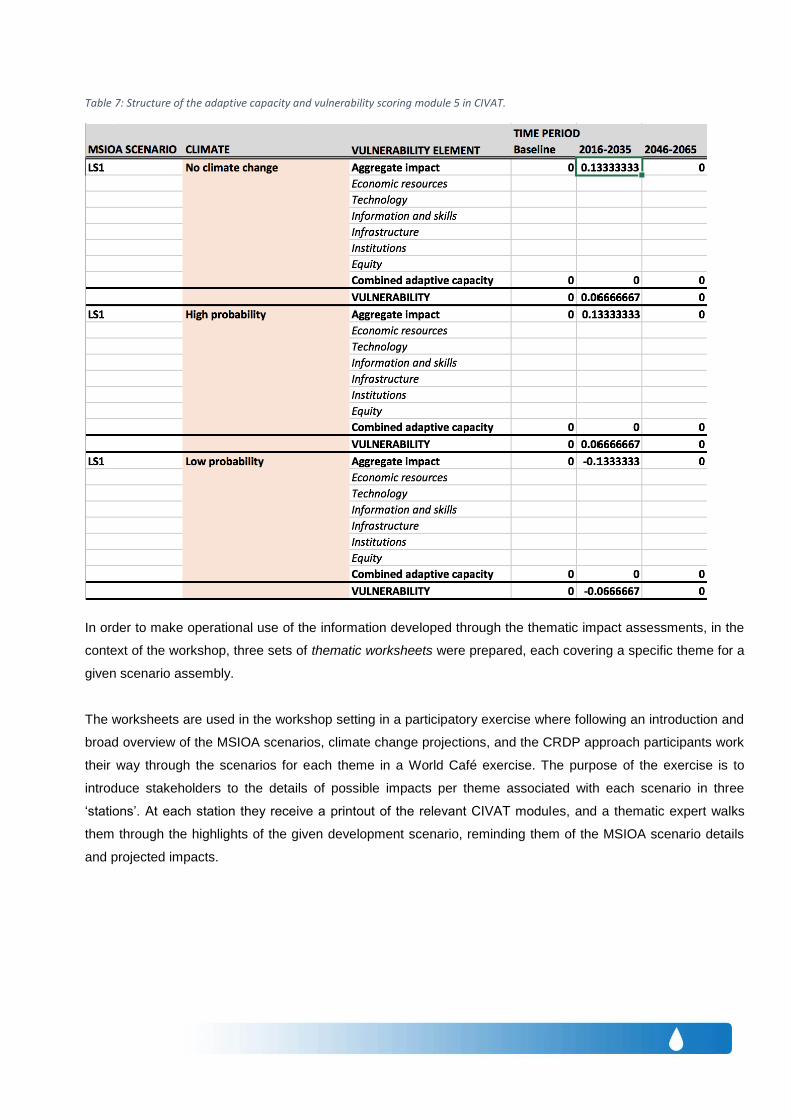
Table 7: Structure of the adaptive capacity and vulnerability scoring module 5 in CIVAT.
In order to make operational use of the information developed through the thematic impact assessments, in the
context of the workshop, three sets of thematic worksheets were prepared, each covering a specific theme for a
given scenario assembly.
The worksheets are used in the workshop setting in a participatory exercise where following an introduction and
broad overview of the MSIOA scenarios, climate change projections, and the CRDP approach participants work
their way through the scenarios for each theme in a World Café exercise. The purpose of the exercise is to
introduce stakeholders to the details of possible impacts per theme associated with each scenario in three
‘stations’. At each station they receive a printout of the relevant CIVAT modules, and a thematic expert walks
them through the highlights of the given development scenario, reminding them of the MSIOA scenario details
and projected impacts.
