d. insect resistance management - united states ... plant-incorporated protectants october 15, 2001...
TRANSCRIPT
Bt Plant-Incorporated Protectants October 15, 2001 Biopesticides Registration Action Document
D. Insect Resistance Management
1. Introduction
Insect resistance management (IRM) is the term used to describe practices aimed at reducing the potential for insect pests to become resistant to a pesticide. Bt IRM is of great importance because of the threat insect resistance poses to the future use of Bt plant-incorporated protectants and Bt technology as a whole. Specific IRM strategies, such as the high dose/structured refuge strategy, will mitigate insect resistance to specific Bt proteins produced in corn, cotton, and potatoes. Academic scientists, public interest groups, organic and other farmers have expressed concern that the widespread planting of these genetically transformed plants will hasten the development of resistance to pesticidal Bt endotoxins. Effective insect resistance management can reduce the risk of resistance development. This section provides EPA's scientific assessment of various Bt plant-incorporated protectant IRM strategies by reviewing the data and information available to the Agency. The Agency will use this assessment, the report of the FIFRA SAP meeting on October 18, 2000, and all public comments in its development of its risk management decisions for Bt plant-incorporated protectants.
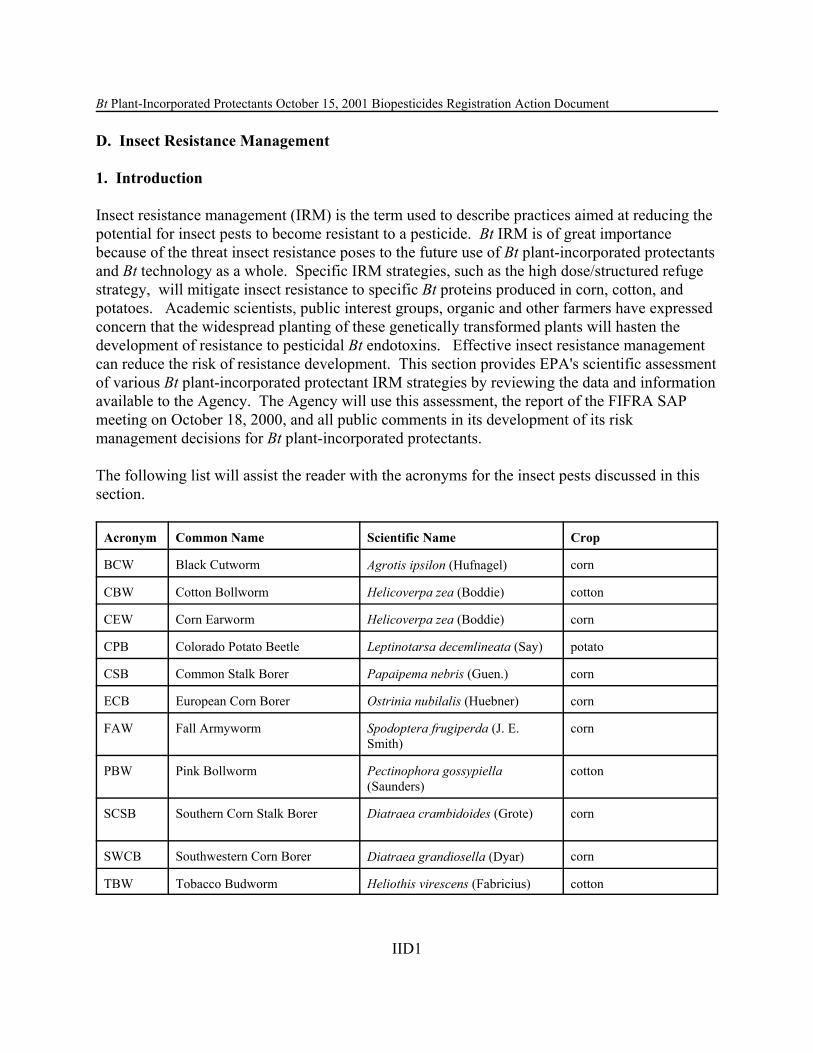
The following list will assist the reader with the acronyms for the insect pests discussed in this section.
Acronym Common Name Scientific Name Crop
BCW Black Cutworm Agrotis ipsilon (Hufnagel) corn
CBW Cotton Bollworm Helicoverpa zea (Boddie) cotton
CEW Corn Earworm Helicoverpa zea (Boddie) corn
CPB Colorado Potato Beetle Leptinotarsa decemlineata (Say) potato
CSB Common Stalk Borer Papaipema nebris (Guen.) corn
ECB European Corn Borer Ostrinia nubilalis (Huebner) corn
FAW Fall Armyworm Spodoptera frugiperda (J. E. Smith)
corn
PBW Pink Bollworm Pectinophora gossypiella (Saunders)
cotton
SCSB Southern Corn Stalk Borer Diatraea crambidoides (Grote) corn
SWCB Southwestern Corn Borer Diatraea grandiosella (Dyar) corn
TBW Tobacco Budworm Heliothis virescens (Fabricius) cotton
IID1

Bt Plant-Incorporated Protectants October 15, 2001 Biopesticides Registration Action Document
a. Elements of IRM Plans
To address the very real concern of insect resistance to Bt proteins, EPA has imposed IRM requirements on registered Bt plant-pesticides. Sound IRM will prolong the life of Bt pesticides and adherence to the plans is to the advantage of growers, producers, researchers, and the American public. EPA considers the development of Bt-resistant insects to constitute an adverse environmental effect. EPA's strategy to address insect resistance to Bt is two-fold: 1) mitigate any significant potential for pest resistance development in the field by instituting IRM plans, and 2) better understand the mechanisms behind pest resistance.
Scientific experts believe that a high dose and the planting of a refuge (a portion of the total acreage using non-Bt seed) will delay the development of insect resistance to Bt crops by maintaining insect susceptibility. In addition to a high dose and structured refuge, IRM plans include additional field research on pest biology, refuge size and deployment, resistance monitoring for the development of resistance (and increased insect tolerance of the protein), grower education, a remedial action plan in case resistance is identified, annual reporting and communication. IRM plans will change as more scientific data become available.
Beginning with the first Bt plant-pesticide registration, the Agency has taken steps to manage insect resistance to Bt with IRM plans being an important part of the regulatory decision. The Agency identified (later confirmed by the 1995 SAP) seven elements that should be addressed in a Bt plant-incorporated protectant resistance management plan: 1) knowledge of pest biology and ecology; 2) appropriate dose expression strategy; 3) appropriate refuge; 4) resistance monitoring and a remedial action plan should resistance occur; 5) employment of integrated pest management (IPM); 6) communication and education strategies on use of the product; and 7) development of alternative modes of action. IRM plans also include grower education and measurement of the level of compliance. Because IRM plans change as more scientific data become available, EPA has also imposed research data requirements as part of the terms and conditions of registration. EPA has also made changes to IRM requirements as the science has evolved.
b. High Dose/Structured Refuge Strategy
The 1998 Science Advisory Panel Subpanel agreed with EPA that an appropriate resistance management strategy is necessary to mitigate the development of insect resistance to Bt proteins expressed in transgenic crop plants. The 1998 Subpanel recognized that resistance management programs should be based on the use of both a high dose of Bt and structured refuges designed to provide sufficient numbers of susceptible adult insects. The high dose/refuge strategy assumes that resistance to Bt is recessive and is conferred by a single locus with two alleles resulting in three genotypes: susceptible homozygotes (SS), heterozygotes (RS), and resistant homozygotes (RR). It also assumes that there will be a low initial resistance allele frequency and that there will be extensive random mating between resistant and susceptible adults. Under ideal
IID2

Bt Plant-Incorporated Protectants October 15, 2001 Biopesticides Registration Action Document
circumstances, only rare RR individuals will survive a high dose produced by the Bt crop. Both SS and RS individuals will be susceptible to the Bt toxin. A structured refuge is a non-Bt portion of a grower’s field or set of fields that provides for the production of susceptible (SS) insects that may randomly mate with rare resistant (RR) insects surviving the Bt crop to produce susceptible RS heterozygotes that will be killed by the Bt crop. This will remove resistant (R) alleles from the insect populations and delay the evolution of resistance. The 1998 and 2000 SAP Subpanels noted that insect resistance management strategies should also be sustainable and to the extent possible, strongly consider grower acceptance and logistical feasibility.
Although the high dose/refuge strategy is the preferred strategy for IRM, effective IRM is still possible even if the transformed plant does not express the Bt protein at a high dose for all economically-important target pests (e.g., by increasing refuge size). The lack of a high dose could allow partially resistant (i.e. heterozygous insects with one resistance allele) to survive, thus increasing the frequency of resistance genes in an insect population. For this reason, numerous IRM researchers and expert groups have concurred that non-high dose Bt expression presents a substantial resistance risk relative to high dose expression (Roush 1994, Gould 1998, Onstad & Gould 1998, SAP 1998, ILSI 1998, UCS 1998, SAP 2001). The 1998 SAP Subpanel also noted that insect resistance management strategies should be sustainable and to the extent possible, strongly consider grower acceptance and logistical feasibility.
The 1998 SAP Subpanel defined (and the 2000 SAP Subpanel confirmed) a high dose as “25 times the protein concentration necessary to kill susceptible larvae.” The logic for this approach is spelled out in the 1998 SAP report as well as in the scientific literature on insect resistance management for Bt crops. In essence, Bt cultivars must produce a high enough toxin concentration to kill nearly all of the insects that are heterozygous for resistance. The Agency has adopted the 25X definition of high dose proposed by the 1998 SAP Subpanel.
The 1998 SAP Subpanel noted that a Bt plant-incorporated protectant could be considered to provide a high dose if verified by at least two of the following five approaches: 1) Serial dilution bioassay with artificial diet containing lyophilized tissues of Bt plants using tissues from non-Bt plants as controls; 2) Bioassays using plant lines with expression levels approximately 25-fold lower than the commercial cultivar determined by quantitative ELISA or some more reliable technique; 3) Survey large numbers of commercial plants in the field to make sure that the cultivar is at the LD99.9 or higher to assure that 95% of heterozygotes would be killed (see Andow & Hutchison 1998); 4) Similar to #3 above, but would use controlled infestation with a laboratory strain of the pest that had an LD50 value similar to field strains; and 5) Determine if a later larval instar of the targeted pest could be found with an LD50 that was about 25-fold higher than that of the neonate larvae. If so, the later stage could be tested on the Bt crop plants to determine if 95% or more of the later stage larvae were killed. The 2000 SAP concluded that the current Bt potato and Bt corn have Bt titers that will significantly exceed the 25X criteria for control of Colorado potato beetle and European corn borer, respectively. In terms of Bt cotton, the 2000 SAP concluded that “all cotton cultivars in the U.S. probably produced a high dose” for
IID3

Bt Plant-Incorporated Protectants October 15, 2001 Biopesticides Registration Action Document
TBW and PBW, while “none of the cultivars produce a high dose” for CBW.
As an alternate definition for high dose, Caprio et al. (2000) recommend that a higher, 50-fold value be adopted (rather than 25-fold) because current empirical data suggest that a 25-fold dose may not be consistently high enough to cause high mortality among heterozygotes with known Bt resistance alleles. The 2000 SAP Subpanel did not recommend changing the existing 25-fold definition, but noted that the “25X” definition is imprecise, provisional, and may require modification as more knowledge becomes available about the inheritance of resistance. The Subpanel concluded that current Bt corn and Bt cotton varieties have less than a 25-fold dose for CBW.
The size, placement, and management of the refuge is critical to the success of the high dose/structured refuge strategy to mitigate insect resistance to the Bt proteins produced in corn, cotton, and potatoes. The 1998 Subpanel defined structured refuges to "include all suitable non-Bt host plants for a targeted pest that are planted and managed by people. These refuges could be planted to offer refuges at the same time when the Bt crops are available to the pests or at times when the Bt crops are not available." The 1998 Subpanel suggested that a production of 500 susceptible adults in the refuge for every adult in the transgenic crop area (assuming a resistance allele frequency of 5 x 10⁻²) would be a suitable goal. The placement and size of the structured refuge employed should be based on the current understanding of the pest biology data and the technology. The 1998 SAP Subpanel also recognized that refuges should be based on regional pest control issues. The 2000 SAP Subpanel echoed the 1998 SAP’s recommendations that the refuge should produce 500:1 susceptible to resistant insects and that regional IRM working groups would be helpful in developing policies.
c. Predictive Models
EPA has used predictive models to compare IRM strategies for Bt crops. Because models cannot be validated without actual field resistance, models have limitations and the information gained from the use of models is only a part of the weight of evidence used by EPA in assessing the risks of resistance development. It was the consensus of the 2000 SAP Subpanel that models were an important tool in determining appropriate Bt crop IRM strategies. They agreed that models were “the only scientifically rigorous way to integrate all of the biological information available, and that without these models, the Agency would have little scientific basis for choosing among alternative resistance management options.” They also recommended that models must have an agreed upon time frame for resistance protection. For example, conventional growers may desire a maximum planning horizon of five years, while organic growers may desire an indefinite planning horizon. The Subpanel recommended that model design should be peer reviewed and parameters validated. Models should also include such factors as level of Bt crop adoption, level of compliance, economics, fitness costs of resistance, alternate hosts, spatial components, stochasticity, and pest population dynamics.
IID4

Bt Plant-Incorporated Protectants October 15, 2001 Biopesticides Registration Action Document
EPA’s Office of Research and Development, National Risk Management Research Laboratory and Office of Pesticide Programs held a small expert group workshop in June, 2001 that focused on model design and parameter validation for Bt corn IRM. This workshop was the first in a series of four workshops intended to provide EPA with information on developing a standardized framework for evaluating Bt corn IRM. These meetings are open to the public. A Bt corn IRM framework document will be written following all four workshops and will be available to the public.
d. Resistance Monitoring
The need for proactive resistance detection and monitoring is critical to the survival of Bt technology. The Agency mandates that registrants monitor for insect resistance (measurement of resistance-conferring alleles) to the Bt toxins as an important early warning sign to developing resistance in the field and whether IRM strategies are working. Grower participation (e.g., reports of unexpected damage) is also important for monitoring. Resistance monitoring is also important because it provides validation of biological parameters used in models. However, resistance detection/monitoring is a difficult and imprecise task. It requires both high sensitivity and accuracy. Good resistance monitoring should have well-established baseline susceptibility data prior to introduction of Bt crops. The chances of finding a resistant larvae in a Bt crop depend on the level of pest pressure, the frequency of resistant individuals, the location and number of samples that are collected, and the sensitivity of the detection technique. Therefore, as the frequency of resistant individuals or the number of collected samples increases, the likelihood of locating a resistant individual increases (Roush & Miller 1986). If the phenotypic frequency of resistance is one in 1,000, then more than 3,000 individuals must be sampled to have a 95% probability of one resistant individual (Roush & Miller 1986). Current sampling strategies have a target of 100 to 200 individuals per location. Previous experience with conventional insecticides has shown than once resistant phenotypes are detected at a frequency >10%, control or crop failures are common (Roush & Miller 1986). Because of sampling limitations and monitoring technique sensitivity, resistance could develop to Bt toxins prior to it being easily detected in the field.
The 2000 SAP Subpanel concluded that resistance monitoring programs should be peer reviewed and used to assess the success of current IRM plans. EPA’s Office of Research and Development, National Risk Management Research Laboratory and Office of Pesticide Programs held a small expert group workshop in July, 2001 that focused on resistance monitoring plan design and detection techniques for Bt corn IRM. A Bt Corn IRM framework document will be written for this workshop and will be available to the public.
Each of the following monitoring techniques described below have a number of advantages and disadvantages:
1) Grower Reports of Unexpected Damage
IID5

Bt Plant-Incorporated Protectants October 15, 2001 Biopesticides Registration Action Document
Growers can be encouraged to report any unsuspected control problems to a local technical expert. Toll-free telephone numbers and an Internet site can be provided by registrants to report any unusual control problems. A confirmed grower report of unexpected pest damage in a Bt crop may be a way to document a control failure and may be a useful monitoring system for determining the success or failure of existing resistance management strategies. However, once a grower detects a control failure, and resistance has been verified, the only available response may be to alter existing resistance management strategies.
2) Systematic Field Surveillance
Registrant sponsored surveys of grower Bt fields for damaged plants could be used to monitor resistance allele frequency of the development of resistance and gauge the geographic area where resistant populations exist. An in-field detection system (for quick determination of the presence or absence of Cry proteins in corn plants) has already been developed for Cry1Ab.
3) Discriminating Concentration Assay / Diagnostic Dose
The discriminating dose/diagnostic dose bioassay is currently required by the EPA. Discriminating dose bioassays are most useful when resistance is common or conferred by a dominant allele (resistance allele frequency >1%) (Andow & Alstad 1998). It should be considered as one of the central components of any monitoring plan, but other monitoring methods may have value in conjunction with the discriminating concentration assay.
Of the techniques available, the diagnostic dose has been the best developed and most thoroughly tested. Hawthorne et al. (2001) consider the diagnostic dose to be less expensive than in-field screens and the F2 screen. It is best used when the frequency of resistance alleles is high (>10-2) or the resistant allele is dominant. However, it is unclear (and likely pest-specific) whether resistance is carried by dominant or recessive alleles and what the frequency of resistance alleles are in pest populations. Measurement of low resistant allele frequencies (<10-2) would not be possible using the diagnostic dose without extremely large sample sizes. Low resistant allele frequencies are probably more likely to be encountered with currently registered Bt crops.
The October 2000 SAP Subpanel was asked whether the current resistance monitoring plans were adequate. They indicated that the diagnostic or discriminating dose technique could at best, detect resistance when the resistance allele frequency has reached 1%. This is a level in which some field failure may be observed. At this lower level of precision, the least expensive methods are the discriminating dose assays (see U.S. EPA/USDA 1999, p. 47, Figure 3). Previous experience with conventional insecticides has shown that once resistant phenotypes are detected at a frequency >10%, control or crop failures are common (Roush & Miller 1986). If resistance is carried on a recessive allele, the frequency of individuals in a population that demonstrate resistance will equal the square of the allele frequency. For example, if the initial
IID6

Bt Plant-Incorporated Protectants October 15, 2001 Biopesticides Registration Action Document
resistance allele frequency is one in 1,000, then one would need to assay more than a million larvae to find one homozygous resistant individual. Typically, discriminating dose assays are based on 100-300 larvae to detect resistance at a frequency of 1-3% (Roush & Miller 1986).
4) F2 Screen
The F2 screen may be a useful monitoring technique for Bt corn, especially for the detection of rare recessive resistant alleles. The technique also allows fewer samples to be collected to detect potential susceptibility shifts than the discriminating dose assay. The F2 screen may be most useful to analyze populations that are expected to be at high risk to the development of resistance. Each isofemale line allows for characterization of four genomes, thus improving the sensitivity over the discriminating dose assay by 10-fold (Andow & Alstad 1998). The F2 screen could be an effective method for detecting changes in the allele frequency of a recessive or partially recessive allele and can be used to verify some of the assumptions underlying high dose/refuge resistance management (Andow & Alstad 1998, Andow et al. 1998). If resistance alleles are found, they can be characterized to estimate the fitness of the genotypes, determine whether there is a cost of resistance, and enable predictions of the evolution of resistance. The F2 screen is conducted by sampling mated females from natural populations, rearing the progeny of each female as an isofemale line and sib-mating her F1 larvae using an appropriate screening procedure such as a discriminating concentration assay or Bt crop, and performing statistical analysis. Hawthorne et al. (2001) indicate that the F2 screen is probably the only current method available to detect rare recessive alleles.
A number of the October, 2000 SAP Subpanel members indicated that the F2 screen accompanied by field screening “could be very effective for detecting low frequencies of recessive and dominant resistance alleles.” The F2 screen can be a powerful method for detecting rare recessive alleles in natural populations. As described by Andow and Alstad (1998), it relies on inbreeding field-collected individuals so that all recessive alleles are expressed in the F2 generation where they can be screened for the phenotype of interest. This method has been used to estimate the frequency of resistance to Cry toxins from Bacillus thuringiensis in ECB (Andow et al. 1998, 2000, Bourguet et al. submitted), Scirpophaga incertulas (Walker) (rice stem borer) (Bentur et al. 2000), and Plutella xylostella (L.) (diamondback moth) (Zhao et al. 2001).
Andow and Alstad (1998) also provide a statistical method for estimating the probability that the screen erroneously does not identify the targeted resistance allele. This is the probability of a false negative, and its calculation is based on the probability of inheritance of the allele, the assumption that F1 families mate randomly, and the probability that other mortality factors may interfere with the phenotypic evaluation of the F2 individuals.
Current insect resistance management strategies assume that resistance alleles are initially rare. That is, it is assumed that Bt resistance alleles are <10-3 for the high dose/refuge strategies
IID7

Bt Plant-Incorporated Protectants October 15, 2001 Biopesticides Registration Action Document
currently used for Bt crops. Studies using the F2 screen by Andow et al. (1998, 2000) and Andow and Alstad (1998, 1999) indicate that resistance alleles may be present at frequencies <9 X 10⁻³ in southern Minnesota and <3.9 X 10⁻³ in central Iowa. A F2 screen of 1,200 isofemale lines of ECB collected in France and in the northern U.S. corn belt during 1999 and 2000 indicated that the frequency of resistance alleles in France was less than 1.27 X 10⁻³ with 95% certainty and in the U.S. was less than 1.24 X 10⁻³ with 95% certainty (Bourguet et al. 2001). These collective data support the assumption that the frequency of Bt resistance alleles in natural populations of ECB is less than 10-3, validating one of the key assumption of the high dose/refuge strategy.
Using the F2 screen would increase the probability of detecting rare resistant alleles and the threshold of detection would be lowered to <0.005. A sample of 100 female lines has a precision of ± 0.0025 for dominant alleles and ± 0.0025 for recessive resistance alleles. Leaving aside issues of accuracy, the theoretically best resolution of allele frequency is ± 0.0025 for dominant alleles and ± 0.05 for recessive alleles for a screen of 100 larvae using the discriminating dose (see Andow in U.S. EPA/USDA 1999, p. 42-43).
The time-frame to respond before control failures occur depends on the precision of monitoring and the recessivity/dominance of resistance. If the goal of resistance monitoring is to detect resistance at a low enough resistance allele frequency so that changes to the insect resistance management plan can be made to increase the longevity of the product and prevent field failure, then current resistance monitoring plans need refinement. The F2 screen is one method of refinement that can detect and measure resistance at frequencies of # 0.005 for approximately $5000 per site. This level of precision can provide seven to 12 years to respond with alternative resistance management tactics (see Andow in U.S. EPA/USDA 1999, p.47, Figure 1b).
A potential obstacle to the F2 screen is that it may be labor intensive and not suitable for routine screening purposes (Hawthorne et al. 2001). Andow has conducted a cost analysis for various monitoring techniques and have concluded that in general the F2 screen is more expensive than other methods for detecting dominant resistant alleles when the resistance allele frequency is >0.01 (see Andow in U.S. EPA/USDA 1999, p. 49, Figure 3). It is estimated that 750-1200 family lines must be screened to have a 95% probability of detecting a dominant resistance allele that is a frequency of 10-3 and would cost $13.90-19.70 per family line (Andow et al. 1998, 2000). However, for recessive alleles, Andow estimates that the F2 screen is the least expensive method and can estimate resistance allele frequencies to a high level of precision (<0.005) for under $5,000 per location (see U.S. EPA/USDA 1999, p. 41-49). Hawthorne et al. (2001), on the other hand, estimated the cost for each F2 screen to be $14,000 to $20,000 per population. This, they conclude, would be too expensive for routine monitoring efforts, especially if there is replication at each site. The area of cost and cost-effectiveness of the F2 screen should be further evaluated.
Hawthorne et al. (2001) concluded that there is a need to further evaluate the precision and
IID8

Bt Plant-Incorporated Protectants October 15, 2001 Biopesticides Registration Action Document
accuracy of the F2 screen by using colonies with known frequencies of resistance alleles. Zhao et al. (2001) also come to this same conclusion. They validated the F2 screen using a synthetic laboratory population of the diamondback moth (Plutella xylostella L.) for detecting the frequency of rare resistance alleles to Cry1Ac and Cry1C toxins of Bt. When using Bt broccoli as the diagnostic method, only one F2 family was detected for Cry1Ac resistance and no family was detected for Cry1C resistance. Six families were detected for either Cry1Ac or Cry1C resistance using the diagnostic diet bioassay. Four F2 families were confirmed to contain one copy of an allele resistant to Cry1Ac in the original single-pair matings and four other F2 families contained an allele resistant to Cry1C. These results suggest that transgenic plants expressing a high level of a Bt toxin in a F2 screen may underestimate the frequency of resistance alleles with false negatives, or fail to detect true resistance alleles. The authors concluded that the diagnostic diet assay was a better F2 screen method to detect resistance alleles, especially for the Cry1Ac resistance in diamondback moth. Zhao et al. (2001) conclude that further validation of the F2 screen method for each insect-crop system should be conducted before the procedures used in the F2 screen can be used routinely to detect rare Bt resistance alleles in field populations.
5) Screening Against Test Stocks
Gould et al. (1997) used a series of genetic crosses with test stocks of highly resistant TBW selected on Cry1Ac in the laboratory to estimate the resistance allele frequency in a natural population. This method can identify recessive or incompletely dominant resistance alleles from field-collected males. Using a colony of TBW that can survive on transgenic Bt cotton producing the Cry1Ac delta endotoxin, they crossed field-collected males with virgin-colony females so that all F1 progeny would be heterozygous for resistance. By using an assay that discriminates between heterozygotes, they could establish which wild males carried a resistance allele. Using this allelic recovery method, Gould et al. (1997) estimated the resistance allele frequency to be 1.5 X 10⁻³. This method is only useful when there are previously identified resistance alleles.
6) Sentinel Bt-Crop Field Plots
Venette et al. (2000) proposed the use of an in-field screen to examine resistance allele frequency. This method uses Bt sweet corn to screen for European corn borer and corn earworm that are resistant to the Bt protein. That is, the Bt crop is the discriminatory screen for resistant individuals. By sampling large numbers of Bt-expressing plants for live corn borer larvae, the frequency of resistance can be estimated and resistant individuals can be collected for documentation of resistance. For example, Venette et al. (2000) suggest that sampling ears (18-21 days post-silking stage) for European corn borer can increase sampling efficiency by two-orders of magnitude (over splitting stalks). Late-planted sentinel Bt sweet corn would provide a highly attractive oviposition site for females and reduce the number of plants required to attain an acceptable sample size. If the Bt sweet corn is planted at the appropriate time, larval attack will cause extensive damage, and large areas of Bt sweet corn can be sampled rapidly by
IID9

Bt Plant-Incorporated Protectants October 15, 2001 Biopesticides Registration Action Document
examining this damage. For example, if 10 resistant larvae are found in a sample of 5,000 Bt corn ears, and 50 larvae were recovered from 50 plants in the non-Bt field, then the expected phenotypic frequency of resistance would be 0.002. If potential resistant individuals or populations are identified in the field then they still must be brought to the laboratory so that resistance can be documented and quantified. Hawthorne et al. (2001) commented that the in-field screen coupled to a F2 screen for verification of resistance might be an efficient method to detect resistance and capture resistance alleles especially in designated high-risk areas. The in-field screening method described by Venette et al. (2000) might be an alternative approach used for early detection of rare Bt-resistant phenotypes as well as an alternative method to estimate the initial frequency of resistance alleles.
There are potential problems with this method that must be addressed prior to its widespread adoption as discussed by Hawthorne et al. (2001). There is a high number of false positives that would reduce the efficiency and accuracy of resistance allele measurement. One source of false positives is the occurrence of weakly or non-expressing “off-type” plants among the sampled plants. Hawthorne et al. (2001) note that GeneCheck™ strips can be used to eliminate many of these “off-types.” Another source might be surviving susceptible larvae that are incorrectly scored as resistant larvae because of larval movement between Bt and non-Bt off-types or weeds. A second problem is that there might not be sweet corn varieties that contain the same Bt genes
as the field corn varieties. This would reduce the efficiency of sampling. Currently, there is only BT11 Cry1Ab field corn and sweet corn. As noted by Hawthorne et al. (2001), there are also additional concerns related to the large effort needed during harvest to complete an in-field screen. This type of effort limits its practicality.
e. Compliance with IRM requirements
Grower compliance with refuge and IRM requirements is a critical element for resistance management. Significant non-compliance with IRM among growers may increase the risk of resistance for Bt corn. However, it is not known what level of grower non-compliance will compromise the risk protection of current refuge requirements.
The Agency recognizes that compliance is a complex issue for Bt crops and IRM. There is currently disagreement as to the appropriate refuge size/deployment and the level of grower compliance necessary to achieve risk reduction. EPA considers the development of Bt-resistant insects to constitute an adverse environmental effect, therefore, IRM, and subsequently grower compliance, is very important. Optimally, refuge requirements would change over time as pest susceptibility changes. However, changes to refuge requirements are difficult to implement. Therefore, the Agency must set safe refuge requirements that preserve the pest(s) susceptibility and protect the benefits of Bt crops. Currently, the financial burden of implementing these refuge requirements is borne primarily by the growers. Increasing refuge size and/or limiting refuge deployment to better mitigate the risk of resistance is likely to increase costs to growers and result in a higher rate of grower non-compliance. Grower compliance with IRM strategies
IID10

Bt Plant-Incorporated Protectants October 15, 2001 Biopesticides Registration Action Document
for current Bt crops is tied into the belief that new technologies, such as plants expressing multiple Bt toxins and other new synthetic insecticides, will reduce the risk of resistance.
To minimize the effects of non-compliance, it may be necessary to develop a broad compliance program as part of an IRM strategy. Ideally this program would include four major objectives: 1) an understanding of the effect of non-compliance on IRM; 2) identification of compliance mechanisms to maximize adoption of IRM requirements; 3) measurement of the level of compliance; and 4) establishment of an enforcement structure to ensure compliance and penalize non-compliance.
1) Effects of Non-Compliance on IRM
As a first step towards developing a compliance program, it is necessary to understand the impact of non-compliance on the development of pest resistance (i.e., the level of non-compliance that significantly increases the likelihood of resistance). Many of the models that have been developed to evaluate refuge and resistance scenarios have assumed 100% compliance. However, based on existing surveys of grower compliance (discussed later in this section), it is unlikely that 100% compliance can be achieved. On the other hand, research and modeling work may show that some level of non-compliance can be tolerated without significantly increasing the risk of pest resistance. Models also tend to assume 100% adoption of the Bt technology. Compliance and adoption are both important factors that should be considered. Ultimately, models will need to be updated to reflect some degree of non-compliance, so that the potential impact can be more thoroughly understood.
2) Compliance Mechanisms
There have been a number of compliance mechanisms proposed by various parties (including the 2000 SAP Subpanel) to ensure grower conformity, reward compliance, and penalize non-compliance. These include such techniques as: grower contracts, grower certification tests, fines and other penalties, community refuge, sales incentives, crop insurance of the refuge, deposit/refund for planting refuge, databases of non-compliant growers, county/area-wide compliance goals and sales restrictions, intensified grower education, and grower audits. The 2000 SAP noted that, at present, there is little information on the relative effectiveness of different compliance options and that many mechanisms have both benefits and drawbacks. The potential efficacy of compliance mechanisms may depend on the perspective of the grower. For example, if non-compliance is the result of confusion over the requirements, increased education may be of value. However, if non-compliance is a willful act, then a punishment or incentive-based approach may be more appropriate (Hurley & Mitchell 2000). The 2000 SAP consensus was that compliance would be best managed through education and grower contracts, but also that sales incentives, refuge insurance, and refuge deposit/refund programs may have value if managed properly. Also, the 2000 SAP recognized that mechanisms that would reduce the cost of compliance will be more effective at improving compliance.
IID11

Bt Plant-Incorporated Protectants October 15, 2001 Biopesticides Registration Action Document
Mitchell et al. (2000) developed a model to evaluate crop (refuge) insurance and sales incentives as potential compliance mechanisms. The cost to growers (i.e., lost yield, higher inputs) to adhere to IRM requirements can be an impediment to compliance. Therefore, by providing growers with incentives to reduce the cost of refuge mandates, compliance may be increased. Both insurance and sales incentives have the potential to reduce this cost of compliance to growers, although both have drawbacks as well. For refuge insurance to be profitable for private insurance companies, it would likely be too expensive for growers and would provide limited benefits. Sales incentives may be less costly to administer, but would require frequent, costly monitoring to ensure proper refuge implementation.
3) Measurements of Compliance
To assess the effectiveness of a compliance program, it is necessary to be able to accurately measure the level of grower compliance. The 2000 SAP noted several parties, other than the registrant alone, could verify compliance: 1) grower visits by industry, EPA, state authorities, USDA, or other third-parties; or 2) USDA/NASS or other third-party grower surveys. To date, compliance has been primarily measured through grower surveys conducted by industry or academics (e.g., Pilcher & Rice 1997, Rice & Pilcher 1999). However, the 2000 SAP indicated that while surveys such as these are useful for tracking grower attitudes, they are not always reliable for determining actual grower compliance. The format of the surveys (mail or phone interviews) may encourage non-compliant growers to misrepresent their actions or “cheat” in their responses. Without confirmatory visits to individual farms (i.e., audits), it is impossible to verify the accuracy of grower responses. The end result may be increased “false-positives,” which may artificially inflate estimates of grower compliance. As such, actual non-compliance may be significantly higher than the survey results would suggest. To resolve this problem, the 2000 SAP suggested utilizing surveys created and conducted by independent parties to assess grower practices. In addition to this recommendation, it may be useful to conduct some on-farm visits for firsthand verification of compliance. Such visits could be performed as part of a survey process, to evaluate the accuracy of grower survey responses. The use of mapping systems, such as the Global Positioning System (GPS), may also prove useful for determining the size and position of Bt and non-Bt fields for compliance verification. The Arizona Cotton Research and Protection Council (ACRPC) has utilized GPS with Bt cotton grown in Arizona in conjunction with grower visits to assess the level of refuge compliance (Carrière et al. 2001).
4) Enforcement Structure / Penalties for Non-compliance
For a compliance program to be effective, a regulatory enforcement/compliance framework will be needed. Appropriate stakeholders and regulatory bodies will need to create clearly defined roles for compliance. At the present time, EPA’s authority is over the product registrations and registrants, but not individual growers. Registrants have been responsible for compliance at the grower level through the use of grower contracts. However, the 2000 SAP noted that EPA’s reliance on industry to monitor and enforce compliance “was seen as a major problem.” The
IID12

Bt Plant-Incorporated Protectants October 15, 2001 Biopesticides Registration Action Document
SAP recommended that a third party compliance monitoring program should be developed. Thecompliance monitoring program should be accompanied by an appropriate enforcement program. Potential penalties for non-compliance might include: 1) sales restrictions at a county, state,regional, or national level; 2) sales prohibitions to specific growers; 3) registrant fines andwarnings; and 4) increased refuge for specific non-compliant growers (through growercontracts). Results of grower surveys and compliance issues will be discussed in detail in both the specificBt corn IRM and Bt cotton IRM sections.
A summary of the Agency’s risk assessment of insect resistance development and insectresistance management plans to mitigate resistance is provided below for Bt corn, Bt cotton, andBt potato products. Other Agency risk assessments of insect resistance management are found inthe following memoranda: A. Reynolds and R. Rose (OPP/BPPD) to M. Mendelsohn(OPP/BPPD), dated September 11, 2000; S. Matten (OPP/BPPD) to W. Nelson (OPP/BPPD),dated July 10, 2000; S. Matten (OPP/BPPD) to W. Nelson (OPP/BPPD), dated September 11,2000; and S. Matten (OPP/BPPD) to W. Nelson and L. Hollis (OPP/BPPD), dated July 5, 2000. Subsequent information has been added to the Agency’s risk assessment of insect resistancedevelopment and IRM plans following the October 18-20, 2000 SAP meeting as new databecame available.
2. Corn
The Agency’s IRM assessment focuses on Cry1Ab field corn, Cry1Ab sweet corn, and Cry1F field corn. EPA has used the best available scientific information in its IRM assessment and has updated its IRM position as information has become available.
In 1995, at the time of the initial registrations of Bt corn, there was no scientific consensus on the details of the IRM plans necessary for prevention of the development of resistance in the two primary target pests, European corn borer (ECB) and CEW. At that time, the putative values for adequate refuge size ranged from 0% to 50% of non-Bt corn or other host plants per farm. While the minimum adequate refuge size or structure could not be determined until further research was conducted, it was thought that market penetration of these crops would be sufficiently slow that considerable non-Bt corn would remain to act as natural refuges while the additional research was conducted. Thus, the initial Bt corn registrants instituted voluntary IRM plans with the requirement that these registrants must submit a refuge strategy by April 1999. From 1995-1997, the registrants agreed to various voluntary refuge requirements in the Corn Belt (0% to 20%).
Since 1995, all Bt corn registrations have included a resistance monitoring plan for ECB and CEW that contained the following elements: 1) development of baseline susceptibility responses and a discriminating concentration to detect changes in sensitivity; 2) routine surveillance; and
IID13

Bt Plant-Incorporated Protectants October 15, 2001 Biopesticides Registration Action Document
3) remedial action if there is suspected resistance. One of the key purposes of resistance monitoring is to learn whether a field control failure resulted from resistance or other factors that might inhibit expression of the Bt delta-endotoxin. The extent and distribution of resistant populations can be mapped and alternative control strategies implemented in areas in which resistance has become prevalent. If monitoring techniques are sensitive enough to discriminate between resistant and susceptible individuals, it should be possible to detect field resistance before significant loss of efficacy and eliminate any resistant individuals using other control tactics. In addition, EPA mandated that all registrants must require customers to notify them of incidents of unexpected levels of ECB and CEW damage. Registrants are required to investigate these reports and identify the cause of the damage by local field sampling of the plant tissue and suspect insect populations followed by appropriate in vitro and in planta assays. Any confirmed incidents of resistance are required to be reported to EPA. Based on these investigations, appropriate remedial action is required to mitigate ECB and/or CEW resistance. These remedial actions include: informing customers and extension agents in the affected areas of ECB and/or CEW resistance, increasing monitoring in the affected areas, implementing alternative means to reduce or control ECB or CEW populations in the affected areas, implementing a structured refuge in the affected areas, and cessation of sales in the affected and bordering counties. All registrants have instructed growers to have regular surveillance programs and report any unexpected levels of ECB and CEW damage. Since 1995, the Agency is aware of no field evidence of ECB, CEW or southwestern corn borer resistance to any of the Bt proteins produced in corn. In January 2000, the Agency required that the registrants provide a more detailed resistance monitoring plan that focused on ECB, CEW, and SWCB. The registrants provided the Agency with a revised monitoring plan in March 2000. This monitoring plan is discussed in detail later in this section.
Based on the 1998 SAP Subpanel recommendations, the Agency began to institute mandatory refuge requirements on Bt field corn and popcorn products. In 1999, a coalition of Bt corn registrants (working with the National Corn Growers Association), the Agricultural Biotechnology Stewardship Technical Committee (ABSTC), approached EPA with a uniform IRM plan for their products. With some modifications to this plan, EPA put in place a consistent set of required refuge strategies for all Bt field corn products beginning with the 2000 growing season. These requirements greatly strengthened the IRM plan to mitigate ECB, CEW, and SWCB resistance to Bt proteins produced in field corn. Beginning with the 2000 growing season, EPA required a 20% non-Bt field corn refuge to be planted within ½ mile (<1/4 mile in areas where insecticides have been historically used to treat ECB and SWCB) (EPA letter to Bt corn registrants, 1/31/00). EPA also required a 50% non-Bt field corn (<½ mile, 1/4 mile preferred) refuge for Bt Cry1Ab field corn products in certain southern counties and states where most cotton is grown (EPA letter to Bt corn registrants, 1/31/00). The larger refuge was necessary to mitigate the development of resistance to Bt proteins in CEW populations feeding on both corn and cotton. These same refuge requirements were mandated for the Cry1F field corn products registered in May 2001.
IID14

Bt Plant-Incorporated Protectants October 15, 2001 Biopesticides Registration Action Document
a. Current Insect Resistance Management (IRM) Plans for Bt corn
1) MON 810 and BT11 (Cry1Ab Field Corn)
These products are known to produce a “high dose” for ECB based on the 25 X definition described by the 1998 SAP Subpanel (SAP 1998) and confirmed by the 2000 SAP Subpanel (SAP 2001). Below are EPA's current terms and conditions for IRM for the Cry1Ab Bt corn plant-incorporated protectant registrations for the 2001 growing season:
• “For Bt field corn grown outside cotton-growing areas (e.g., the Corn Belt), grower agreements (stewardship agreements) will specify that growers must adhere to the refuge requirements as described in the grower guide/product use guide and/or in supplements to the grower guide/product use guide. Specifically, growers must plant a minimum structured refuge of at least 20% non-Bt corn. Insecticide treatments for control of ECB, CEW and/or Southwestern corn borer (SWCB) may be applied only if economic thresholds are reached for one or more of these target pests. Economic thresholds will be determined using methods recommended by local or regional professionals (e.g., Extension Service agents, crop consultants). Instructions to growers will specify that microbial Bt insecticides must not be applied to non-Bt corn refuges.”
• Beginning with the 2000 growing season, “grower agreements (stewardship agreements) for Cry1Ab Bt field corn grown in cotton-growing areas specified that growers must adhere to the refuge requirements as described in the grower guide/product use guide and/or in supplements to the grower/product use guide. Specifically, growers in these areas must plant a minimum structured refuge of 50% non-Bt corn. Cotton-growing areas include the following states: Alabama, Arkansas, Georgia, Florida, Louisiana, North Carolina, Mississippi, South Carolina, Oklahoma (only the counties of Bryan, Caddo, Canadian, Garvin, and Grady), Tennessee (only the counties of Carroll, Chester, Crockett, Fayette, Franklin, Gibson, Hardeman, Hardin, Haywood, Hendersen, Lake, Lauderdale, Lawrence, Lincoln, McNairy, Madison, Obion, Rutherford, Shelby, and Tipton), Texas (except the counties of Carson, Dallam, Hansford, Hartley, Hutchinson, Lipscomb, Moore, Ochiltree, Roberts, and Sherman), Virginia (only the counties of Greensville, Isle of Wight, Northampton, Southampton, Sussex, Suffolk) and Missouri (only the counties of Butler, Dunkin, Mississippi, New Madrid, Pemiscot, Scott, Stoddard).”
• “Requirements for refuge deployment will be described in the Grower Guides/Product Use Guides as described in Section D of the Agricultural Biotechnology Stewardship Technical Committee (ABSTC) IRM Plan submitted
IID15

Bt Plant-Incorporated Protectants October 15, 2001 Biopesticides Registration Action Document
to EPA on April 19, 1999. Growers must continue to plant only non-Bt corn in the refuge and to plant the refuge within ½ mile of their Bt corn acreage. In regions of the Corn Belt where conventional insecticides have historically been used to control ECB and SWCB, growers wanting the option to treat these pests must plant the refuge within ¼ mile of their Bt corn. Refuge planting options include: separate fields, blocks within fields (e.g., along the edges or headlands), and strips across the field. When planting the refuge in strips across the field, growers must be instructed to plant multiple non-Bt rows whenever possible.”
• “The registrant will monitor for the development of resistance using baseline susceptibility data and/or a discriminating concentration assay when such an assay is available. The registrant will proceed with efforts to develop a discriminating concentration assay. The registrant will ensure that monitoring studies are conducted annually to determine the susceptibility of ECB and CEW populations to Cry1Ab. This resistance monitoring program will be developed to measure increased tolerance to Bt corn above the various regional baseline ranges.”
• “Populations of ECB and CEW will be collected from representative distribution areas that contain the registrant's Bt corn plant-pesticide and monitored/screened for resistance, with particular focus on those areas of highest distribution. The results of monitoring studies will be communicated to the Agency on an annual basis, by January 31 of the year following the population collections for a given growing season.”
• “In addition, the registrant will instruct its customers (growers and seed distributors) to contact the registrant (e.g., via a toll-free customer service number) if incidents of unexpected levels of ECB and/or CEW damage occur. The registrant will investigate and identify the cause for this damage by local field sampling of plant tissue from corn hybrids that contain the registrant's Bt corn plant-pesticide and sampling of ECB and CEW populations, followed by appropriate in vitro and in planta assays. Upon the registrant's confirmation by immunoassay that the plants contain Cry1Ab protein, bioassays will be conducted to determine whether the collected ECB population exhibits a resistant phenotype.”
• “Until such time that a discriminating concentration assay is established and validated by the registrant, the registrant will utilize the following to define a confirmed instance of ECB and/or CEW resistance:
Progeny from the sampled ECB or CEW population will exhibit both of the following characteristics in bioassays initiated with neonates
IID16

Bt Plant-Incorporated Protectants October 15, 2001 Biopesticides Registration Action Document
1. An LC50 in a standard Cry1Ab diet bioassay that exceeds the upper limit of the 95% confidence interval of the mean historical LC50 for susceptible ECB or CEW populations, as established by the ongoing baseline monitoring program. The source of Cry1Ab crystal protein standard for this bioassay will be Bacillus thuringiensis subsp. kurstaki strain HD1.
2. > 30% survival and > 25% leaf area damaged in a 5-day bioassay using Cry1Ab-positive leaf tissue under controlled laboratory conditions.
Based upon continued experience and research, this working definition of confirmed resistance may warrant further refinement. In the event that the registrant finds it appropriate to alter the criteria specified in the working definition, the registrant must obtain Agency approval in establishing a more suitable definition.
The current insect monitoring program was expanded to include SWCB and CEW, in addition to ECB. The expanded program must focus monitoring in areas that typically have a high density of Bt corn or have historically been prone to high levels of corn borer pressure and where the refuge areas may more likely be treated with insecticides.”
• “The current definition of confirmed insect resistance must be used as described above in the ABSTC IRM Plan. Agency approval will be sought prior to implementation of any modified definition of confirmed insect resistance.”
• “When resistance has been demonstrated to have occurred, the registrant must stop sale and distribution of Bt corn in the counties where the resistance has been shown until an effective local mitigation plan approved by EPA has been implemented. The registrant assumes responsibility for the implementation of resistance mitigation actions undertaken in response to the occurrence of resistance during the growing season. EPA interprets “suspected resistance” to mean, in the case of reported product failure, that the corn in question has been confirmed to be Bt corn, that the seed used had the proper percentage of corn expressing Bt protein, that the relevant plant tissues are expressing the expected level of Bt protein, that it has been ruled out that species not susceptible to the protein could be responsible for the damage, that no climatic or cultural reasons could be responsible for the damage, and that other reasonable causes for the observed product failure have been ruled out. The Agency does not interpret “suspected resistance” to mean grower reports of possible control failures, nor does the Agency intend that extensive field studies and testing to fully scientifically confirm insect resistance be completed before responsive measures
IID17

Bt Plant-Incorporated Protectants October 15, 2001 Biopesticides Registration Action Document
are undertaken.”
• “The registrant will maintain a (confidential) database to track sales (units and location) of its Bt corn on a county-by-county basis. The registrant will provide annually, on a CBI basis, sales data for each state indicating the number of units of corn hybrids that contain the registrant's Bt corn plant-pesticide that were sold. As part of the overall sales report, the registrant will provide a listing of an estimate of the acreage planted with such states and counties with sales limitations. This information will be provided by January 31 of the year following each growing season.”
• “The registrant will provide grower education. The registrant will agree to include an active partnership with such parties as: university extension entomologists and agronomists, consultants, and corn grower groups. The registrant will implement a grower education program (in part, as requested by the registrant, through the Grower Agreement setting forth any resistance management requirements) directed at increasing grower awareness of resistance management, in order to promote responsible product use. Insect Resistance Management educational materials for each growing season must be provided to the Agency as they become available for distribution. Survey results and other available information must be used to identify geographic areas of non-compliance with insect resistance management plans. As described in the ABSTC IRM Plan, an intensified grower education program will be conducted in these geographic areas prior to the following growing season. If individual non-compliant growers are identified, they must be restricted from future purchases of Bt corn seed.”
• “Several aspects of the IRM Plan will operate in synergy to promote grower compliance, however, the cornerstones of the compliance program must be the:
1. Grower Guides
These guides must be distributed to each seed customer and updated on an annual basis, as needed. The guides provide complete information for growers regarding routine IRM practices that must be employed, and will be a primary educational and reference tool. Agreed-upon requirements and additional information that was not included in the grower guides for the 2000 growing season, (e.g., because the requirements were enacted after printing and distribution of the grower guides) is required to be conveyed via supplemental communications to Bt field corn seed customers.
2. Stewardship Agreement (grower agreement).
IID18

Bt Plant-Incorporated Protectants October 15, 2001 Biopesticides Registration Action Document
Each grower who purchases Bt field corn seed must be required to sign a stewardship agreement, which will obligate the grower to follow the required IRM practices as specified in the grower guide/product use guide and/or in supplements thereof.
3. A Strong and Multi-Pronged Grower Education Program.
A variety of methods must be employed to promote grower education and to continue to reinforce the need for adherence to all aspects of the IRM program.
4. Additional mechanisms must also be used to promote grower compliance. For example, training of sales personnel, seed dealers and technical support staff as well as coordination and reinforcement of IRM requirements through other organizations (e.g., NC-205, the Cooperative Extension Service, USDA, National Corn Growers Assn. (NCGA), American Crop Protection Assn., Biotechnology Industry Organization, crop consultants and other crop professionals).”
• “The registrant will confer with the EPA as the registrant develops various aspects of its resistance management research program. The registrant agrees, as a condition of this registration, to submit annually, progress reports on or before January 31st each year on the following areas, as a basis for developing a long-term resistance management strategy which include:
1. Research data on CEW relative to resistance development and the registrant's plans for producing resistance predictive models to cover regional management zones in the cotton belt based on CEW biology and cotton, corn, soybeans, and other host plants. These models must be field tested and must be modified based on the field testing performed during the period of the conditional registration. EPA might modify the terms of the conditional registration based upon the field testing validation of the model and might require refuge in the future. EPA notes that there is some scientific work and even some models for CEW on other crops in at least NC and TX that could be used for reference. EPA wants to be in close communication with the registrant as the model development and testing is ongoing. The requirement for development of resistance predictive models may be modified if the registrant provides the results of research that demonstrates resistance to CEW would have no significant impact on the efficacy of foliar Bt products and other Bt crops. Actual usage data of Btk on crops to control specific pests as well as successes and failures and field validated research would be necessary to support such a waiver request. [Satisfied thus far - some work is ongoing.]
IID19

Bt Plant-Incorporated Protectants October 15, 2001 Biopesticides Registration Action Document
2. ECB pest biology and behavior including adult movement and mating patterns, larval movement, survival on silks, kernels, and stalks, and overwintering survival and fecundity on non-corn hosts. A combination of a comprehensive literature review and research can fulfill this condition. [Satisfied thus far - some work is ongoing.]
3. The feasibility of “structured” refuge options for ECB including both “block” refuge, “50-50 early/late season patchwork;” research needs to be done in both northern and southern areas on ECB as well as CEW. [Satisfied thus far - some work is ongoing.]
4. Development of a discriminating concentration (diagnostic concentration) assay for field resistance (field screening) for ECB, CEW and other lepidopteran pests of corn. Specific sampling locations will be established in each state to determine if increases in Bt protein tolerance are occurring before crop failures develop. Increased tolerance levels need to be identified before field failure occurs. In monitoring for tunneling damage, the number of trivial tunnels may be less indicative of resistance development than the total extent of tunneling damage (e.g., length of tunnels). The extent of tunneling damage must be monitored as well as the number of tunnels. [Satisfied thus far - some work is ongoing.]
5. Effects of corn producing the Cry1Ab delta endotoxin on pests other than ECB, including but not limited to CEW, fall armyworm (FAW), and the stalk borer complex. [Satisfied thus far - some work is ongoing.]
6. The biology of ECB resistance including receptor-mediated resistance and its potential effect on population fitness, as well as the effects on insect susceptibility to other Cry proteins. More data are needed on protein expression in various parts of the plant at different stages plant development in regard to ECB, CEW and other secondary pests of corn (i.e. stalk borer complex, FAW, and SWCB). [Satisfied thus far - some work is ongoing.]
7. The registrant must assess the feasibility of using the F2 screen, sentinel plots, and in-field screening kits to increase the sensitivity of resistance monitoring in 2000. By January 31, 2001, the registrant must provide the Agency with the results from these investigations. [This information has been submitted and is included in this reassessment.]
8. The registrant must implement a survey approach similar to the Iowa State University Bt Corn Survey (e.g., Pilcher and Rice 1999). A
IID20

Bt Plant-Incorporated Protectants October 15, 2001 Biopesticides Registration Action Document
statistically valid sample, as determined by independent market research, of Bt corn growers in key states will be surveyed by a third-party. Bt corn growers will be included based upon a proportionately stratified random sample designed to balance the survey evenly across seed companies and geographies. In addition to demographic information, the survey will include questions related to insect resistance management such as:
a) What is your primary source of information on Bt corn?
b) What percentage of your acres were planted to Bt corn this year?
c) Are you following a recommended insect resistance management strategy?
d) If you plant most of your acreage to Bt corn, are you likely to scout your non-Bt corn for economically damaging populations of corn borers?
e) Did you treat your Bt corn acres with an insecticide?
f) What planting pattern did you use for your refuge?
/ Planted Bt corn as one block in one field./ Planted Bt corn in one block in every field./ Split seed boxes in the planter and alternated every row or several
rows with Bt and non-Bt corn in every field. / Planted Bt corn in large strips alternated with large strips of a
non-Bt corn hybrid. / Planted Bt corn in an entire field and planted the border around the
field with non-Bt corn. / Planted pivot corners to non-Bt corn with the irrigated area of the
field planted to Bt corn.” [Survey results were submitted and are discussed in this reassessment.]
2) TC 1507 (Cry1F Field Corn)
The following requirements specified in the registrations for Cry1F event TC 1507 for 2001 were based on the Agency’s requirements for Cry1Ab expressing corn. This is due to the possibility of cross-resistance between Cry1Ab and Cry1F. TC 1507 is known to produce a “high dose” for ECB based on the 25 X definition described by the 1998 SAP Subpanel (SAP 1998).
“1) Several aspects of the Insect Resistance Management Plan will operate in synergy to
IID21

Bt Plant-Incorporated Protectants October 15, 2001 Biopesticides Registration Action Document
promote grower compliance, however, the cornerstones of the compliance program must be the:
a) Grower Guides
Grower Guides and/or Product Use Guides must be submitted to the Agency at the time of distribution to growers. These Guides must be distributed to each seed customer and updated on an annual basis, as needed. The Guides provide complete information for growers regarding routine IRM practices that must be employed, and will be a primary educational and reference tool. Agreed-upon requirements and additional information that cannot be included in the Grower Guides for 2001 (e.g., because the requirements were enacted after printing and distribution of the Grower Guides) must be conveyed via supplemental communications to Cry1F field corn seed customers.
b) Stewardship Agreement (grower agreement).
Each grower who purchases Cry1F field corn seed must be required to sign a Stewardship Agreement, which will obligate the grower to follow the required IRM and non-target insect protection practices as specified in the Grower Guide/Product Use Guide and/or in supplements thereof.
c) A Strong and Multi-Pronged Grower Education Program.
A variety of methods must be employed to promote grower education and to continue to reinforce the need for adherence to all aspects of the IRM program.
d) Additional mechanisms must also be used to promote grower compliance, including:
Training of sales personnel, seed dealers and technical support staff. Coordination and reinforcement of IRM requirements through other organizations (e.g., NC-205, the Cooperative Extension Service, USDA, National Corn Growers Assn. (NCGA), American Crop Protection Assn., Biotechnology Industry Organization, crop consultants and other crop professionals).
“2) (Stewardship Agreements/Grower Agreements) will specify that growers must adhere to the refuge requirements as described in the Grower Guide/Product Use Guide and/or in supplements to the Grower Guide/Product Use Guide. Specifically, growers must plant a minimum structured refuge of at least 20% non-Bt corn. Insecticide treatments for control of European corn borer, corn earworm and/or Southwestern corn borer may be applied only if economic thresholds are reached for one or more of these target pests.
IID22

Bt Plant-Incorporated Protectants October 15, 2001 Biopesticides Registration Action Document
Economic thresholds will be determined using methods recommended by local or regional professionals (e.g., Extension Service agents, crop consultants). Instructions to growers will specify that microbial Bt insecticides must not be applied to non-Bt corn refuges.
“3) For the 2001 growing season, grower agreements (Stewardship Agreements) for Cry1F field corn grown in cotton-growing areas will specify that growers must adhere to the refuge requirements as described in the Grower Guide/Product Use Guide and/or in supplements to the Grower/ Product Use Guide. Specifically, growers in these areas must plant a minimum structured refuge of 50% non-Bt corn. Cotton growing areas include the following States: Alabama, Arkansas, Georgia, Florida, Louisiana, North Carolina, Mississippi, South Carolina, Oklahoma (only the counties of Bryan, Caddo, Canadian, Garvin, and Grady), Tennessee (only the counties of Carroll, Chester, Crockett, Fayette, Franklin, Gibson, Hardeman, Hardin, Haywood, Hendersen, Lake, Lauderdale, Lawrence, Lincoln, McNairy, Madison, Obion, Rutherford, Shelby, and Tipton), Texas (except the counties of Carson, Dallam, Hansford, Hartley, Hutchinson, Lipscomb, Moore, Ochiltree, Roberts, and Sherman), Virginia (only the counties of Greensville, Isle of Wight, Northampton, Southampton, Sussex, Suffolk) and Missouri (only the counties of Butler, Dunkin, Mississippi, New Madrid, Pemiscot, Scott, Stoddard).
“4) Requirements for refuge deployment will be described in the Grower Guides/Product Use Guides as described in Section D of the Industry IRM Plan submitted on April 19, 1999. Growers must continue to be required to plant only non-Bt corn in the refuge and to plant the refuge within ½ mile of their Cry1F corn acreage. In regions of the corn belt where conventional insecticides have historically been used to control ECB and SWCB, growers wanting the option to treat these pests must plant the refuge within ¼ mile of their Cry1F corn. Refuge planting options include: separate fields, blocks within fields (e.g., along the edges or headlands), and strips across the field. When planting the refuge in strips across the field, growers must be instructed to plant multiple non-Bt rows whenever possible.
“5) The registrants will monitor for the development of resistance using baseline susceptibility data and/or a discriminating concentration assay when such an assay is available. The registrants will proceed with efforts to develop a discriminating concentration assay. The registrants will ensure that monitoring studies are conducted annually to determine the susceptibility of ECB and corn earworm (CEW) populations to the Cry1F protein. T his resistance monitoring program will be developed to measure increased tolerance to Bt corn above the various regional baseline ranges.
“Populations of ECB and CEW will be collected from representative distribution areas that contain Cry1F corn plant-pesticide and monitored/screened for resistance, with particular focus on those areas of highest distribution. The results of monitoring studies
IID23
Bt Plant-Incorporated Protectants October 15, 2001 Biopesticides Registration Action Document
will be communicated to the Agency on an annual basis, by January 31 of the year following the population collections for a given growing season.
“In addition, the registrants will instruct its customers (growers and seed distributors) to contact the registrants (e.g., via a toll-free customer service number) if incidents of unexpected levels of ECB and/or CEW damage occur.
“Upon exclusion of the causes specified in section 7a of this document, the registrants will investigate and identify the cause for this damage by local field sampling of plant tissue from corn hybrids that contain Cry1F corn plant-pesticide and sampling of ECB & CEW populations, followed by appropriate in vitro and in planta assays. Upon the registrant’s confirmation by immunoassay that the plants contain Cry1F protein, bioassays will be conducted to determine whether the collected ECB population exhibits a resistant phenotype.
“Until such time that a discriminating concentration assay is established and validated by the registrant, the registrant will utilize the following to define a confirmed instance of ECB and/or CEW resistance:
“Progeny from the sampled ECB or CEW population will exhibit both of the following characteristics in bioassays initiated with neonates
1. An LC50 in a standard Cry1F diet bioassay that exceeds the upper limit of the 95% confidence interval of the mean historical LC50 for susceptible ECB or CEW populations, as established by the ongoing baseline monitoring program. The source of Cry1F crystal protein standard for this bioassay will be Bacillus thuringiensis subspecies aizawai.
2. > 30% survival and > 25% leaf area damaged in a 5-day bioassay using Cry1F-positive leaf tissue under controlled laboratory conditions.
“Based upon continued experience and research, this working definition of confirmed resistance may warrant further refinement. In the event that the registrants find it appropriate to alter the criteria specified in the working definition, the registrants must obtain Agency approval in establishing a more suitable definition.
“The insect monitoring programs must include Southwestern corn borer (SWCB) and corn earworm (CEW), in addition to European corn borer (ECB). The program must focus monitoring in areas that typically have a high density of Bt corn or have historically been prone to high levels of corn borer pressure and where the refuge areas may more likely be treated with insecticides.
IID24

Bt Plant-Incorporated Protectants October 15, 2001 Biopesticides Registration Action Document
“6) The current definition of confirmed insect resistance must be used as described in Section E of the Industry IRM Plan. Agency approval will be sought prior to implementation of any modified definition of confirmed insect resistance.
“7) a) When field resistance has been demonstrated to have occurred, you must stop sale and distribution of Cry1F corn in the counties where the field resistance has been shown until an effective local mitigation plan approved by EPA has been implemented. The registrant assumes responsibility for the implementation of resistance mitigation actions undertaken in response to the occurrence of resistance during the 2001 growing season. EPA interprets "suspected resistance" to mean, in the case of reported product failure, that the corn in question has been confirmed to be Cry1F corn, that the seed used had the proper percentage of corn expressing Cry1F protein, that the relevant plant tissues are expressing the expected level of Cry1F protein, that it has been ruled out that species not susceptible to the protein could be responsible for the damage, that no climatic or cultural reasons could be responsible for the damage, and that other reasonable causes for the observed product failure have been ruled out. The Agency does not interpret “suspected resistance” to mean grower reports of possible control failures, nor should extensive field studies and testing to fully scientifically confirm insect resistance be completed before responsive measures are undertaken.
“7) b) The registrants will maintain a (confidential) database to track sales (units and location) of its Cry1F corn on a county-by-county basis. The registrants will provide annually, on a CBI basis, sales data for each state indicating the number of units of corn hybrids that contain the registrant’s Cry1F corn plant-pesticide that were sold. As part of the overall sales report, the registrant will provide a listing of an estimate of the acreage planted within such states and counties with sales limitations. This information will be provided by January 31 of the year following each growing season.
“The registrants will provide grower education. The registrants will agree to include an active partnership with such parties as: university extension entomologists and agronomists, consultants, and corn grower groups. The registrants will implement a grower education program (in part, as requested by the registrants, through the Grower Agreement setting forth any resistance management requirements) directed at increasing grower awareness of resistance management, in order to promote responsible product use. Insect Resistance Management educational materials for the 2001 growing season must be provided to the Agency as they become available for distribution. IRM educational materials must be developed and distributed at the same time that growers receive seed. Survey results and other available information must be used to identify geographic areas of non-compliance with insect resistance management plans. As described in the Industry IRM Plan submitted to EPA on April 19, 1999, an intensified grower education program will be conducted in these geographic areas prior to the following growing season. If individual non-compliant growers are identified, they must
IID25

Bt Plant-Incorporated Protectants October 15, 2001 Biopesticides Registration Action Document
be prohibited from future purchases of Cry1F corn seed.
“The registrants will confer with the EPA as the registrants develop various aspects of its resistance management research program. The registrants agree, as a condition of these registrations, to generate data and to submit annually progress reports on or before January 31st each year on the following areas as a basis for developing a long-term resistance management strategy which include:
a) The registrants must submit available research data on CEW relative to resistance development and the registrants’ plans for producing resistance predictive models to cover regional management zones in the cotton belt based on Helicoverpa zea biology and cotton, corn, soybeans, and other host plants. These models must be field tested and must be modified based on the field testing performed during the period of the conditional registration. EPA might modify the terms of the conditional registration based upon the field testing validation of the model and might require refuge in the future. EPA notes that there is some scientific work and even some models for H. zea on other crops in at least NC and TX that could be used for reference. EPA wants to be in close communication with the registrants as the model development and testing is ongoing. The requirement for development of resistance predictive models may be modified if the registrants provide the results of research that demonstrates resistance to CEW would have no significant impact on the efficacy of foliar Bt products and other Bt crops. Actual usage data of Bta on crops to control specific pests as well as successes and failures and field validated research would be necessary to support such a waiver request.
b) ECB pest biology and behavior including adult movement and mating patterns, larval movement, survival on silks, kernels, and stalks, and overwintering survival and fecundity on non-corn hosts. A combination of a comprehensive literature review and research can fulfill this condition.
c) The feasibility of "structured" refuge options for ECB including both "block" refuge, "50-50 early/late season patchwork;" research needs to be done in both northern and southern areas on ECB as well as CEW.
d) Development of a discriminating concentration (diagnostic concentration) assay for field resistance (field screening) for ECB, CEW and SWCB. Sampling will be done in accordance with the Industry Plan to determine if increases in Cry1F toxin tolerance are occurring before crop failures develop. Increased tolerance levels need to be identified before field failure occurs. In monitoring for tunneling damage, the number of trivial tunnels may be less indicative of resistance development than the total extent of tunneling damage (e.g. length of
IID26
Bt Plant-Incorporated Protectants October 15, 2001 Biopesticides Registration Action Document
tunnels). The extent of tunneling damage must be monitored as well as the number of tunnels.
e) Effects of corn producing the Cry1F delta endotoxin on pests other than ECB, including but not limited to CEW, fall armyworm, and the stalk borer complex.
f) The biology of ECB resistance including receptor-mediated resistance and its potential effect on population fitness, as well as the effects on insect susceptibility to other Cry proteins.
g) [The registrants] must assess the feasibility of using the F2 screen, sentinel plots, and in-field screening kits to increase the sensitivity of resistance monitoring in 2001. By January 31, 2002, [the registrants] must provide the Agency with the results from these investigations.
h) You must implement a survey approach similar to the Iowa State University Bt Corn Survey (e.g., Pilcher and Rice, 1999) A statistically valid sample, as determined by Independent market research, of Bt corn growers in key states will be surveyed by a third-party. Bt corn growers will be included based upon a proportionately stratified random sample designed to balance the survey evenly across seed companies and geographies. In addition to demographic information, the survey will include questions related to insect resistance management such as:
1) What is your primary source of information on Bt corn?
2) What percentage of your acres were planted to Bt corn this year?
3) Are you following a recommended insect resistance management strategy?
4) If you plant most of your acreage to Bt corn, are you likely to scout your non-Bt corn for economically damaging populations of corn borers?
5) Did you treat your Bt corn acres with an insecticide?
6) What planting pattern did you use for your refuge?
/ Planted Bt corn as one block in one field./ Planted Bt corn in one block in every field./ Split seed boxes in the planter and alternated every row or severalrows with Bt and non-Bt corn in every field./ Planted Bt corn in large strips alternated with large strips of a
IID27

Bt Plant-Incorporated Protectants October 15, 2001 Biopesticides Registration Action Document
non-Bt corn hybrid./ Planted Bt corn in an entire field and planted the border aroundthe field with non-Bt corn./ Planted pivot corners to non-Bt corn with the irrigated area of thefield planted to Bt corn.”
Table D1. Active Ingredient
Summary of Current Bt Field Corn Refuge Requirements ECB Dosage
Refuge Size in Corn Belt
Refuge Size in Cotton Areas
Grower Agreement
Proximity Comments/ Other Restrictions
MON 810, BT 11, & TC 1507
High dose 20% sprayed or unsprayed
50% sprayed or unsprayed
yes ½ mile; (½ mile, ¼ mile preferred for 50% sprayed/ unsprayed refuge)
¼ mile prox. for areas w/ pesticide treat. for ECB, SWCB
3) BT11 Sweet Corn (Cry1Ab)
A key to understanding the resistance management issues with Attribute BT11 sweet corn is to appreciate the differences in the cultural practices of sweet corn versus field corn. Field corn is frequently grown in large blocks on farms of 500 - 1,000 acres. This results in large areas of field corn monoculture. Conversely, sweet corn is usually grown in blocks of 40 acres or less on farms that produce several crops that are also host plants for ECB and CEW.
In contrast to BT11 field corn, specific refuge requirements were not mandated for this Bt sweet corn product because sweet corn harvesting occurs before insects mature and reproduce. Sweet corn is harvested 18-21 days after silking while the plant has active photosynthesis. As a result, in transgenic sweet corn varieties, Bt protein production is high at the time of harvest. EPA mandated specific resistance monitoring requirements for ECB, CEW, and FAW, as well as sales reporting requirements. Novartis is required through labeling and technical material to have growers destroy any Cry1Ab (BT11) sweet corn stalks that remain in the fields following harvest in accordance with local production practices. Stalk destruction is intended to reduce the possibility of any insects, including resistant insects, surviving to the next generation. The major aspects of the 1998 insect resistance management plan for Attribute BT11 sweet corn are summarized below.
• “Cry1Ab sweet corn may only be sold for commercial sweet corn production as described in Appendix A of [Jellinek, Schwartz & Connolly, Inc. letter to EPA dated 2/13/98], not for small roadside or home growers. The Agency believes this stipulation is important in ensuring all of the aspects of Novartis Seeds (Vegetables) resistance
IID28

Bt Plant-Incorporated Protectants October 15, 2001 Biopesticides Registration Action Document
management program are met.”
• “Novartis Seeds’ (Vegetables) must require growers to destroy any Cry1Ab sweet corn stalks that remain in the fields following harvest. This activity must take place either immediately following harvest or a short period of time (a maximum of 1 month) later in accordance with local production practices. Stalk destruction prior to winter will insure that any larvae that happen to be present in the plants after harvest are eliminated. This instruction must appear on all supplemental labeling, technical material, and grower guides.”
• “Novartis Seeds’ (Vegetables) will perform baseline susceptibility studies and monitor for the development of resistance in ECB, CEW, and FAW populations using baseline susceptibility data and/or a discriminating concentration assay when such an assay is available. Novartis Seeds’ (Vegetables) will proceed with efforts to develop discriminating concentration assays for ECB, CEW and FAW, and will ensure that monitoring studies are conducted annually to determine the susceptibility of ECB, CEW, and FAW populations to the Cry1Ab protein. This resistance monitoring program will be developed to measure increased tolerance to the Cry1Ab protein above the various regional baseline susceptibility ranges.
Novartis Seeds (Vegetables) must participate in baseline susceptibility and monitoring efforts for ECB and CEW currently underway as a condition of registration for Novartis Seeds’ (Field Crops) Bt field corn registrations (EPA Reg. Nos. 66736-1 and 67979-1). Monitoring locations will be chosen to ensure that representative growing areas of Bt sweet corn are included. For Bt sweet corn monitoring, adjacent plots of Bt field corn may be substituted when practical, provided such plots are within 1500 feet of the Bt sweet corn to be monitored. Novartis may summarize both Bt field and sweet corn ECB and CEW monitoring in one annual report. However, this yearly monitoring report must provide details as to how and where Bt sweet corn was monitored in addition to that information for Bt field corn. The insect populations will be monitored for changes in the susceptibility to the Cry1Ab protein. In monitoring for tunnel damage, the number of trivial tunnels may be less indicative of resistance development than the total extent of tunneling damage (e.g., length of tunnels). The extent of tunneling damage should be monitored as well as the number of tunnels.
Novartis Seeds (Vegetables) must consult with the Agency as well as academic expert(s), on an annual basis, to ensure that this monitoring program is sufficient to measure changes in sensitivity to Cry1Ab in these pests that may result from exposure to the active ingredient in Cry1Ab expressing sweet corn.
Within one year from the date of this registration [1998], baseline susceptibility studies must be conducted on FAW populations collected from sweet corn growing areas in
IID29

Bt Plant-Incorporated Protectants October 15, 2001 Biopesticides Registration Action Document
south Texas and south Florida. Monitoring studies will be conducted on FAW populations collected from sweet corn distribution areas in states in which Novartis Seeds’ (Vegetables) Cry1Ab sweet corn plantings exceed 1000 acres. The collected populations of FAW will be monitored for changes in susceptibility to the Cry1Ab protein. [Data submitted and discussed in this review.]
Reports of resistance monitoring will be submitted to the Agency on an annual basis, by January 31 of the year following the ECB, CEW, and FAW population collections for a given growing season and include units sold per state of the Novartis Seeds (Vegetables) Cry1Ab corn. These annual reports will also describe progress towards development of a discriminating dose assay for ECB, CEW, and FAW and any additional research information related to the development of a long-term resistance management strategy. Novartis Seeds’ (Vegetables) will confer with the EPA as it develops various aspects of its resistance management research program. [Satisfied thus far.]
In addition, Novartis Seeds (Vegetables) will instruct its customers (growers and seed distributors) to contact Novartis Seeds (Vegetables) (e.g., via a toll-free customer service number) if incidents of unexpected levels of ECB, CEW, or FAW damage occur. Novartis Seeds (Vegetables) will investigate and identify the cause for this damage by local field sampling of plant tissue from its hybrids and sampling of ECB, CEW, and FAW populations, followed by appropriate in vitro and in planta assays. Upon Novartis Seeds (Vegetables)'s confirmation by immunoassay that the plants contain Cry1Ab protein, bioassays will be conducted to determine whether the collected ECB, FAW or CEW population exhibits a resistant phenotype.
Until such time that a discriminating concentration assay is established and validated by Novartis Seeds (Vegetables), Novartis Seeds (Vegetables) will utilize the following to define a confirmed instance of ECB, FAW & CEW resistance:
Progeny from the sampled ECB, FAW or CEW population will exhibit both of the following characteristics in bioassays initiated with neonates:
1. An LC50 in a standard Cry1Ab diet bioassay that exceeds the upper limit of the 95% confidence interval of the mean historical LC50 for susceptible ECB, FAW or CEW populations, as established by the ongoing baseline monitoring program. The source of Cry1Ab crystal protein standard for this bioassay will be Bacillus thuringiensis subsp. kurstaki strain HD1;
2. > 30% survival and > 25% leaf area damaged in a 5-day bioassay using Cry1Ab-positive leaf tissue under controlled laboratory conditions.
Based upon continued experience and research, this working definition of confirmed
IID30

Bt Plant-Incorporated Protectants October 15, 2001 Biopesticides Registration Action Document
resistance may warrant further refinement. In the event that Novartis Seeds (Vegetables) finds it appropriate to alter the criteria specified in the working definition, Novartis Seeds (Vegetables) must obtain Agency approval in establishing a more suitable definition.”
• “Novartis Seeds (Vegetables) will report all instances of confirmed ECB, FAW, and CEW resistance, as defined above, to the Agency within 30 days. Upon identification of a confirmed instance of ECB, FAW, or CEW resistance Novartis Seeds (Vegetables) will take the following immediate mitigation measures:
1. notify growers, extension agents, and university cooperators in the affected area;
2. recommend to customers and extension agents in the affected area the use of alternative control measures to reduce or control the local ECB, CEW, or FAW population;
3. require customers and extension agents in the affected area to disc and incorporate crop residues into the soil immediately following harvest, to minimize the possibility of overwintering of ECB, CEW, or FAW;
4. intensify field surveillance for excessive feeding damage and define boundaries of the affected epicenter.
Within 90 days of a confirmed instance of ECB, FAW and/or CEW resistance, as defined above, Novartis Seeds (Vegetables) will: 1) notify the Agency of the immediate mitigation measures that were implemented; 2) submit to the Agency a proposed long-term resistance management action plan for the affected area; 3) work closely with the Agency in assuring that an appropriate long-term resistance management action plan for the affected area is implemented; and 4) implement an action plan that is approved by EPA and that consists of some or all the following elements, as warranted:
1. Informing customers and extension agents in the affected area of ECB, FAW, and/or CEW resistance;
2. Increasing monitoring in the affected area, and ensuring that local ECB, FAW, or CEW populations are sampled on an annual basis;
3. Recommending alternative measures to reduce or control ECB, FAW, or CEW populations in the affected area;
4. Implementing a structured refuge strategy in the affected area based on the latest research results and coordinated by the Agency with other
IID31
Bt Plant-Incorporated Protectants October 15, 2001 Biopesticides Registration Action Document
registrants;
5. If the above elements are not effective in mitigating resistance, Novartis Seeds (Vegetables) will voluntarily cease sale of all of Novartis Seeds (Vegetables)'s Cry1Ab corn in the county experiencing loss of product efficacy and the bordering counties until an effective local management plan approved by EPA has been implemented. During the voluntary suspension period, Novartis Seeds (Vegetables) may sell and distribute in these counties only by obtaining EPA approval to study resistance management in those counties. The implementation of such a strategy will be coordinated by the Agency with other registrants.
If EPA agrees that an effective resistance management plan has been implemented which mitigates resistance, Novartis Seeds (Vegetables) can resume sales in the affected county(ies).”
• “Novartis Seeds (Vegetables) will maintain a (confidential) database to track sales (units and location) of its Bt corn on a county-by-county basis. Novartis Seeds (Vegetables) will provide annually, on a CBI basis, sales data for each state indicating the number of units of corn hybrids that contain Novartis Seeds (Vegetables)'s Bt corn plant-incorporated protectant that were sold. As part of the overall sales report, Novartis Seeds (Vegetables) will provide a listing of an estimate of the acreage planted with such states and counties with sales. This information will be provided by January 31 of the year following each growing season.”
• “Novartis Seeds (Vegetables) will provide grower education. Novartis Seeds (Vegetables) has identified primary targets of their education and communication programs. In the processing market, these targets will be field representatives, operations managers, and quality assurance staff. For the commercial fresh market, communication targets will be dealer sales representatives and the growers.
The key communication points will be the:
C importance of insect resistance management (IRM);C customer/grower roles and responsibilities in IRM;C cultural techniques that impact IRM;C importance of scouting for ECB, CEW and FAW damage;C importance of chemical control for lepidopteran pests as needed; andC importance of reporting unexpected levels of insect feeding damage to Novartis
Seeds (Vegetables).
This material will be delivered to the communication targets through on-site presentations, a
IID32

Bt Plant-Incorporated Protectants October 15, 2001 Biopesticides Registration Action Document
Grower Guide, and an 800 number to which growers can report unexpected damage.
In its Grower Guide, supplemental labeling, and technical material, Novartis Seeds (Vegetables) must specify:
1) Growers are required to destroy any Cry1Ab sweet corn stalks that remain in the fields following harvest. This activity could take place either immediately following harvest or a short period of time later in accordance with local production practices. Stalk destruction prior to winter will insure that any larvae that happen to be present in the plants after harvest are eliminated. The statement “Growers are required to destroy any Attribute BT11 (Cry1Ab) sweet corn stalks that are remaining in fields within 1 month following harvest” would suffice.
and
2) Control for lepidopteran pests, as needed, must not utilize Bt microbial products. The statement “No Bt microbial pesticides may be used as supplemental insecticide sprays.” would suffice;
3) no Bt microbial pesticides may be used as supplemental insecticide sprays;
4) seed dealers and/or processors may not sell Cry1Ab sweet corn to growers who have been found to not comply with any of the items above.
Novartis Seeds (Vegetables) will ensure compliance through an annual auditing of Cry1Ab sweet corn seed growers, processors, and Novartis seed dealers. A report of compliance among sweet corn seed growers, processors, and Novartis seed dealers must be submitted to EPA along with the sales report required in the notice of registration. This information will be provided by January 31 of the year following each growing season.”
b. Analysis of the Risks Associated with Current IRM Plans and Alternatives
The risk that insect pests may become resistant to Bt plant-incorporated protectants and Bt microbial sprays has been acknowledged by many organizations and individuals including EPA's Scientific Advisory Panel (SAP) and Pesticide Program Dialogue Committee (PPDC). SAP meetings and reports in 1995, 1998, and 2000 have confirmed that EPA's approach and elements required in an insect resistance management plan are appropriate. EPA believes that pest biology and the dose of the Bt protein expressed in the various plant tissues influence the size and placement needed for an effective refuge. This section is a summary of the key elements of several options for IRM plans for corn and compares the level of risk of resistance development for each scenario. An additional Agency assessment of the IRM plan for Bt corn is found in the Agency’s memorandum, A. Reynolds and R. Rose (OPP/BPPD) to M. Mendelsohn
IID33

Bt Plant-Incorporated Protectants October 15, 2001 Biopesticides Registration Action Document
(OPP/BPPD), dated September 11, 2000. IRM for TC 1507 is reviewed R.Rose (OPP/BPPD) memorandum to M. Mendelsohn (OPP/BPPD) dated January 24, 2001. Subsequent information has been added to the Agency’s risk assessment of insect resistance development and IRM plans following the October 18-20, 2000 SAP meeting and as new data became available.
1) Pest Biology
Knowledge of pest biology is critical for the development of effective IRM strategies and to increase confidence that the IRM plans will be effective at reducing the likelihood that insects will become resistant to Bt proteins.
a) ECB (Primary Target Pest)
ECB is a major pest of corn throughout most of the United States. The pest has 1-4 generations per year, with univoltine (i.e., one generation per year) populations in the far North (i.e., all of North Dakota, northern South Dakota, northern Minnesota, and northern Wisconsin), bivoltine (i.e., two generations per year) populations throughout most of the Corn Belt, and multivoltine (3-4 generations) populations in the South (Mason et al. 1996). The February, 1998 SAP meeting on IRM identified a number of areas needing additional research including larval movement, adult movement, mating behavior, pre- and post-mating dispersal, ovipositional behavior, fitness, and overwintering habitat (SAP 1998). Since the first registrations of Bt corn hybrids in 1995, a significant amount of research has been undertaken in many of these areas, although additional work could enhance the knowledge base for this pest. A summary of key aspects of ECB biology that relate to IRM is presented below:
i. Larval Movement
ECB larvae are capable of significant, plant-to-plant movement within corn fields. Research conducted in non-transgenic corn showed that the vast majority of larvae do not move more than two plants within a row (Ross & Ostlie 1990). However, in transgenic corn, unpublished data (used in modeling work) from F. Gould (cited in Onstad & Gould 1998) indicates that approximately 98% of susceptible ECB neonates move away from plants containing Bt. Recent multi-year studies by Hellmich (1996, 1997, 1998) have attempted to quantify the extent of plant-to-plant larval movement. It was observed that 4th instar larvae were capable of movement up to six corn plants within a row and six corn plants across rows from a release point. Movement within a row was much more likely than movement across rows (not surprising, due to the fact that plants within are row are more likely to be “touching” as opposed to those across rows). In fact, the vast majority of across row movement was limited to one plant. This type of information has obvious implications for optimal refuge design. Larvae moving across Bt and non-Bt corn rows may be exposed to sublethal doses of protein, increasing the likelihood of resistance (Mallet & Porter 1992). Given the extent of ECB larval movement between plants, seed mixes have been determined to be an inferior refuge option (Mallet & Porter 1992, SAP
IID34
Bt Plant-Incorporated Protectants October 15, 2001 Biopesticides Registration Action Document
1998, Onstad & Gould 1998).
ii. Adult Movement
Information on movement of adult ECB (post-pupal eclosion) is necessary to determine appropriate proximity guidelines for refuges. Refuges must be established within the flight range of newly emerged adults to help ensure the potential for random mating. An extensive, multi-year project to investigate ECB adult dispersal has been undertaken by the University of Nebraska (Hunt et al. 1997, 1998a). Results from these mark and recapture studies (with newly emerged, pre-mated adults) showed that the majority of ECB adults did not disperse far from their emergence sites. The percentage recaptured was very low (< 1%) and the majority of those that were recaptured were caught within 1500 feet of the release site. Few moths were captured outside of 2000 feet. These results have specifically led to recommendations and guidelines for refuge proximity and deployment (discussed later in this document).
iii. Mating Behavior
In addition to patterns of adult movement, ECB mating behavior is an important consideration to insure random mating between susceptible and potentially resistant moths. In particular, it is important to determine where newly emerged females mate (i.e., near the site of emergence or after some dispersal).
It is well established that many ECB take advantage of aggregation sites (usually clusters of weeds or grasses) near corn fields for mating. Females typically mate the second night after pupal eclosion (Mason et al. 1996). One recent study suggested that it may be possible to manipulate aggregation sites to increase the likelihood of random mating between susceptible and potentially resistant ECB (Hellmich et al. 1998). Another recent study (mark/recapture studies with newly eclosed ECB) conducted by the University of Nebraska showed that relatively few unmated females moved out of the corn field from which they emerged as adults (Hunt et al. 1998b). This was especially true in irrigated (i.e., attractive) corn fields. In addition, a relatively high proportion of females captured close to the release point (within 10 feet) were mated. This work suggests that females mate very close to the point of emergence and that refuges may need to be placed very close to Bt fields (or as in-field refuges) to maximize the probability of random mating.
In terms of male mating behavior, a study by Showers et al. (2001) looked at male dispersal to locate mates. The study was carried out using mark-recapture techniques with pheromone-baited traps placed at 200, 800, 3200, and 6400 m from a release point. Results showed that males in search of mates were trapped more frequently at traps placed at 200 m from the release site. However, significant numbers were also trapped at 800 m or greater from the release site (Showers et al. 2001). Similar to Hunt et al., this work suggests that refuges may need to be placed relatively close to Bt fields to maximize random mating.
IID35

Bt Plant-Incorporated Protectants October 15, 2001 Biopesticides Registration Action Document
iv. Ovipositional Behavior
ECB ovipositional (egg-laying) behavior is important for refuge design. For instance, if oviposition within a corn field is not random, certain types of refuge (i.e., in-field strips) may not be effective.
After mating, which occurs primarily in aggregation sites, females move to find suitable corn hosts for oviposition. Most females will oviposit in corn fields near the aggregation sites, provided there are acceptable corn hosts. Oviposition begins after mating and occurs primarily at night. Eggs are laid in clusters of up to sixty eggs (one or more clusters is deposited per night) (Mason et al. 1996).
It is known that females generally prefer taller and more vigorous corn fields for oviposition (Beck 1987). This has implications for refuge design. To avoid potential host discrimination among ovipositing females, the non-Bt corn hybrid selected for refuge should similar to the Bt hybrid in terms of growth, maturity, yield, and management practices (i.e., planting date, weed management, and irrigation). It should be noted that research has shown no significant difference in ovipositional preferences between Bt and non-Bt corn (derived from the same inbred line) when phenological and management characteristics are similar (Orr & Landis 1997, Hellmich et al. 1999). Within a corn field suitable for egg laying, oviposition is thought to be random and not restricted to border rows near aggregation sites (Shelton et al. 1986, Calvin 1998).
v. Host Range
ECB is a polyphagous pest known to infest over 200 species of plants. Among the ECB plant hosts are a number of species of common weeds, which has led some to speculate that it may be possible for weeds to serve as an ECB refuge for Bt corn. In response to this, a number of recent research projects have investigated the feasibility of weeds as refuge. Studies conducted by Hellmich (1996, 1997, 1998) have shown that weeds are capable of producing ECB, although the numbers were variable and too inconsistent to be a reliable source of ECB refuge. This conclusion was also reached by the 1998 SAP Subpanel on IRM. In addition to weeds, a number of grain crops (e.g., wheat, sorghum, oats) have been investigated for potential as a Bt corn ECB refuge (Hellmich 1996, 1997, 1998, Mason et al. 1998). In these studies, small grain crops generally produced less ECB than corn (popcorn or field corn) and are unlikely to produce enough susceptible adult insects.
b) CEW
As was the case with ECB, the 1998 SAP identified a number of research areas that need additional work with CEW. In addition to increased knowledge regarding larval/adult movement, mating behavior, and ovipositional behavior, a better understanding of movement
IID36

Bt Plant-Incorporated Protectants October 15, 2001 Biopesticides Registration Action Document
between corn/cotton and long distance migration is also needed (SAP 1998). Additional research regarding CEW biology has occurred since 1998. These data have been submitted as part of the annual research reports required as a condition of registration. The Agency has reviewed these data and has concluded that additional information would be useful for effective long-term improvements of IRM strategies to mitigate CEW resistance.
i. Host Range and Corn to Cotton Movement
CEW is a polyphagous insect (3-4 generations per year), feeding on a number of grain and vegetable crops in addition to weeds and other wild hosts. Typically, it is thought that CEW feeds on wild hosts and/or corn for two generations (first generation on whorl stage corn, second generation on ear stage corn). After corn senescence, CEW moves to other hosts, notably cotton, for 2-3 additional generations. By utilizing multiple hosts within the same growing season, CEW presents a challenge to Bt resistance management in that there is the potential for double exposure to Bt protein in both Bt corn and Bt cotton (potentially up to five generations of exposure in some regions).
Given the wide host range of CEW, it has been speculated that wild hosts (weeds) and other non-Bt crops (e.g., soybean) may be able to serve as refuge for CEW. However, research into the value of these alternate hosts as reliable producers of CEW is still lacking (1998 SAP).
ii. Overwintering Behavior
CEW are known to overwinter in the pupal stage. Although it is known that CEW migrate northward during the growing season to corn-growing regions (i.e., the U.S. Corn Belt and Canada), CEW typically are not capable of overwintering in these regions. Rather, CEW are known to overwinter in the South, often in cotton fields. Temperature, moisture, and cultivation practices are all thought to play some role in the overwintering survival of CEW (Caprio & Benedict 1996).
Overwintering is an important consideration for IRM--resistant insects must survive the winter to pass their resistance genes on to future generations. In the Corn Belt, for example, CEW incapable of overwintering should not pose a resistance threat. Given that different refuge strategies may be developed based upon where CEW is a resistance threat, accurate sampling data would help to precisely predict suitable CEW overwintering areas.
iii. Adult Movement and Migration
CEW is known to be a highly mobile pest, capable of significant long distance movement. Mark/recapture studies have shown that CEW moths are capable of dispersing distances ranging from 0.5 km (0.3 mi.) to 160 km (99 mi.) (some migration up to 750 km (466 mi.) was also noted) (Caprio & Benedict 1996). The general pattern of migration is a northward movement,
IID37

Bt Plant-Incorporated Protectants October 15, 2001 Biopesticides Registration Action Document
following prevailing wind patterns, with moths originating in southern overwintering sites moving to corn-growing regions in the northern U.S. and Canada.
It has been assumed that CEW migration proceeds progressively northward through the course of the growing season. However, observations made by Dr. Fred Gould (N.C. State University) indicate that CEW may also move southward from corn-growing regions back to cotton regions in the South (described in remarks made at the 1999 EPA/USDA Workshop on Bt Crop Resistance Management in Cotton, Memphis, TN 8/26/99). If this is true (and more investigation is needed for confirmation of this effect), the result may be additional CEW exposure to Bt crops. In addition, the assumptions regarding CEW overwintering may need to be revisited--moths that were thought to be incapable of winter survival (and thus not a resistance threat) may indeed be moving south to suitable overwintering sites.
Most CEW flight movement is local, rather than migratory. Heliothine moths move primarily at night, with post-eclosion moths typically flying short distances of less than 200 m (Caprio & Benedict 1996). However, as was indicated by the 1998 SAP, additional research would be useful, particularly as it pertains to CEW and optimal refuge design. On the other hand, given the long distance movements typical of CEW and the lack of high dose in Bt corn hybrids, the 2000 SAP noted that refuge placement for this pest is of less importance than with other pests (e.g., ECB) (SAP 2001).
iv. Mating/Ovipositional Behavior
Dr. Michael Caprio (entomologist, Mississippi State University) has indicated that there is significant localized mating among females (i.e., within 600 m (1969 ft.) of pupal eclosion), typically with males that emerged nearby or moved in prior to female eclosion (Caprio 1999). CEW females typically deposit eggs singly on hosts. A recent study (conducted in cotton fields) found that 20% of the eggs found from released CEW females were within 50-100 m (164-328 ft.) of the release point, indicating some localized oviposition. However, males were shown to be able to move over 350 m (1148 ft.) to mate with females (Caprio 2000). These data indicate that, in terms of CEW, refuges may not have to be embedded or immediately adjacent to a Bt field to be effective (although the data do not exclude these options). Additional research with mating and ovipositional behavior would provide useful information for CEW IRM.
v. Larval Movement
CEW larvae, particularly later instars, are capable of plant-to-plant movement. At the recommendation of the SAP (1998), EPA has eliminated seed mixes as a viable refuge option for CEW.
c) SWCB and Other Secondary Pests
IID38

Bt Plant-Incorporated Protectants October 15, 2001 Biopesticides Registration Action Document
Some SWCB pest biology data have been provided as part of the annual research reports required as a condition of registration. However, there is still relatively limited information available and more data on SWCB pest biology would be beneficial to help develop IRM strategies for regions in which SWCB and ECB are both pests of economic concern. The 1998 SAP also noted the relative lack of information for SWCB, concluding that “[c]ritical research is needed for SWCB...including: short-term movement, long-distance migration, mating behavior relative to movement (i.e. does mating occur before or after migration)...” Because of this, it is unknown whether IRM strategies designed for ECB (another corn boring pest) will also function optimally for SWCB.
SWCB is an economic pest of corn in some areas (i.e., SW Kansas, SE Colorado, north Texas, west Oklahoma) and can require regular management. Like ECB, SWCB has 2-4 generations and similar feeding behavior. First generation larvae feed on whorl tissue before tunneling into stalks before pupation, while later generations feed on ear tissue before tunneling into stalks. Females typically mate on the night of emergence and can lay 250-350 eggs (Davis 2000).
Research to investigate the movement patterns of SWCB has been initiated (Buschman et al. 1999). In this mark/recapture study, the following observations were made regarding SWCB from the 1999 data: 1) more males than females were captured at greater distances from the release point (similar to ECB); 2) most recaptures of SWCB were within 100 feet of the release site, although some were also noted at 1200 feet; and 3) the moth movement patterns for ECB and SWCB appear to be similar in most regards. Given these results, it is likely that this part of the IRM strategy (refuge proximity guidelines established for ECB) will also be applicable to SWCB. However, the 1999 results were hampered by low SWCB numbers available for testing and the authors have indicated that this work will continue during the 2000 season.
Research for other secondary pests (e.g., BCW, FAW, SCSB, others) is also lacking and could be useful for specific regions in which these pests may pose an additional concern. However, the 1998 SAP indicated that CEW and SWCB should have the highest priority for biology research among the secondary corn pests.
2) High Dose
A high level of Bt protein expression (termed “high dose”) is considered to be an essential aspect of high dose/structure refuge strategy to mitigate the risk of Bt resistance. The lack of a high dose could allow partially resistant (i.e., heterozygous insects with one resistance allele) to survive, thus increasing the frequency of resistance genes in an insect population. For this reason, numerous IRM researchers and expert groups have concurred that non-high dose Bt expression presents a substantial resistance risk relative to high dose expression (Roush 1994, Gould 1998, Onstad & Gould 1998, SAP 1998, ILSI 1998, UCS 1998). To mitigate the additional resistance risk of a non-high dose Bt corn product, alternate refuge strategies (i.e., larger refuges) may need to be developed.
IID39

Bt Plant-Incorporated Protectants October 15, 2001 Biopesticides Registration Action Document
The 1998 and 2000 SAPs defined high dose as “25 times the protein concentration necessary to kill susceptible larvae” and provided five techniques to verify high dose (defined earlier in this document). However, the 2000 SAP noted that this definition is imprecise, provisional, and may require modification as more knowledge becomes available about the inheritance of resistance (SAP 2001). It is also important to consider protein expression over the course of the growing season as some Bt corn hybrids may not maintain a steady level of protein expression over the season. The 1998 SAP noted these concerns indicating that the “toxin concentration encountered by the pest” should be the true measure.
Among the currently registered Bt corn products, most have been evaluated to determine high dose (via the 1998 SAP verification techniques) for ECB (the primary target pest). It is likely that BT11, MON 810, and TC 1507 corn have a high dose for ECB. It is also known that none of the currently registered Bt corn products expresses a high dose for CEW (CEW is known to be less susceptible to Bt proteins than other targeted lepidopteran pests). High dose evaluations for other secondary pests (i.e., SWCB, FAW, etc.) have been sporadic. Ideally, high dose could be evaluated for all susceptible pests, so that appropriate resistance management strategies could be developed. However, verification of the high dose using the 1998 SAP Subpanel techniques may be best directed at the major target pests of Bt corn (ECB, CEW, and SWCB), due to the fact that these pests play a larger role in the formulation of IRM strategies. Below, each registered Bt corn product is discussed individually in regard to high dose (as defined by the 1998 SAP) for each of the labeled target pests. It is not expected that label claims of “control” or “suppression” for individual target pests are indicative of high dose.
a) Novartis BT11 Cry1Ab Corn
According to their grower guides, Novartis BT11 corn is targeted against ECB (claims of “control”), SWCB (“control”), CEW (“control” of 1st generation, “suppression” of 2nd gen.), FAW (“suppression”), and SCSB (“suppression”).
Novartis has not submitted any data to the Agency to confirm high dose, via the 1998 SAP guidelines, for any of the targeted pests. However, the Agency is able to conclude that BT11 probably produces a season-long high dose for ECB based on the review of all available data submitted to the Agency. Submitted studies have shown consistent control of ECB from the whorl stage to kernel maturity (VanDuyn et al. 1997, Catangui & Berg 1998). BT11 has also been shown to be effective against late instar ECB (Walker et al. 1999).
For CEW, several submitted studies suggest that BT11 does not contain a season-long high dose. These studies revealed excellent control of first generation CEW on whorl stage BT11, but also showed significant survival of second generation CEW on BT11 corn ears (Dively & Horner 1997, VanDuyn et al. 1997). However, in both studies, surviving second generation CEW showed fitness costs (i.e., reduced weight and delayed developmental time). Other research has shown similar results (VanDuyn et al. 1998).
IID40

Bt Plant-Incorporated Protectants October 15, 2001 Biopesticides Registration Action Document
For SWCB, no information on the potential for high dose has been submitted to the Agency. For FAW, one submitted study with BT11 showed good control during whorl stage, but significant infestation during ear stage (Benedict et al. 1998). It is therefore unlikely that BT11 contains a full season high dose for FAW. For SCSB, one study with a limited data set has been submitted, showing good control (VanDuyn 1998). With additional data, it may be possible to confirm whether BT11 contains a high dose for SCSB.
b) Monsanto MON 810 Cry1Ab Corn
According to grower guides and product labels, MON 810 is targeted against ECB (claim of “control”), SWCB (“control”), SCSB (“control”), CEW (“suppression”), CSB (“suppression”), and FAW (“suppression”).
For ECB, Monsanto has submitted information to verify (with the 1998 SAP guidelines) that MON 810 expresses a high dose (reviewed by EPA, R.Rose/S.Matten memo to M.Mendelsohn, 5/30/99). SAP techniques #2, 3, and 5 were utilized to confirm the high dose expression.
For SCSB, submitted research has shown that MON 810 provides good control versus non-Bt corn (VanDuyn et al. 1997, VanDuyn 1998, VanDuyn et al. 1998), although there is not enough information (due to low pest pressure in the tests) to determine if there is a high dose expression. With additional data, it may be possible to determine whether there is a high dose expression for control of SCSB.
For CEW, submitted studies have shown significant larval survival on MON 810 corn, particularly in ear stage corn (Dively et al. 1997, Dively & Horner 1997, VanDuyn et al. 1997, Benedict et al. 1998, VanDuyn et al. 1998). Therefore, it is unlikely that MON 810 expresses a season-long high dose for CEW. For FAW, MON 810 was found to have good whorl stage control, but significant ear infestation later in the season (Benedict et al. 1998). Given this, and the known lower sensitivity of FAW to Cry1A proteins, it is unlikely that MON 810 has a season-long high dose for FAW. High dose has not been verified for SWCB or CSB with the 1998 SAP techniques. With additional data, it may be possible to verify whether there is a high dose expression for control of SWCB or CSB.
c) Pioneer and Dow TC 1507 Cry1F Field Corn
TC 1507 is targeted against ECB, BCW, FAW, and SWCB (label claims “control” of these pests).
For ECB, data has been submitted to demonstrate high dose (using the 1998 SAP criteria -techniques #4 and #5) (MRID# 451311-01; reviewed in R.Rose memo to M.Mendelsohn, 1/24/01).
IID41

Bt Plant-Incorporated Protectants October 15, 2001 Biopesticides Registration Action Document
Other submitted data showed that TC 1507 provides good protection against SWCB and FAW, although insufficient information was submitted to determine high dose (MRID# 450201-14; reviewed in R.Rose memo to M.Mendelsohn, 1/24/01). This same data also showed some damage to TC 1507 plants from CEW and BCW. It is unlikely that TC 1507 expresses a high dose for these pests.
d) Novartis Attribute Cry1Ab Sweet Corn
Attribute sweet corn is targeted against ECB, CEW, and FAW. Attribute contains the same Bt gene as the BT11 hybrid.
For ECB, like BT11, it is probable that Attribute sweet corn expresses a high dose, although it has not been verified with the SAP criteria. Research submitted to EPA specifically for Bt sweet corn has shown virtually no survival of ECB (Dively & Linduska 1998).
For FAW and CEW, it is less likely that Bt sweet corn will express a high dose. Several submitted studies have shown (limited) FAW and CEW survival and damage on Attribute Bt sweet corn (Dively & Linduska 1998, Whalen & Spellman 1999, Lynch et al. 1999).
The current knowledge base for high dose expression is summarized in the following table.
Table D2. High Dose Summary
HYBRID SEASON-LONG HIGH DOSE FOR CORN PESTS
ECB CEW SWCB FAW SCSB CSB
BT11 Probable NO Unknown NO Unknown Unknown *
Bt Sweet Corn (BT11)
Probable NO Unknown* NO Unknown * Unknown *
MON 810 YES NO Unknown NO Unknown Unknown
TC 1507 YES NO Unknown Unknown Unknown * Unknown *
YES = high dose verified with 1998 SAP recommended techniques; NO = information indicates that no high dose is likely; Probable = information indicates high dose likely (but not verified by SAP guidelines); Unknown = no or insufficient information available for high dose determination; * = untargeted pest
3) Refuge
The February 1998 and October 2000 FIFRA SAP Subpanels agreed that a high dose/refuge strategy is necessary to mitigate target insect resistance to Bt field corn (SAP 1998, 2001). A structured refuge should be planted and managed to produce 500 insects susceptible to Bt for
IID42

Bt Plant-Incorporated Protectants October 15, 2001 Biopesticides Registration Action Document
every one potentially resistant insect. Refuge options should address regional differences and varying levels of the dose of Bt in the crop that effect refuge management as well as the need for feasibility and flexibility for the growers. However, if there is not a high dose for the primary target pests, the risk of resistance increases. Larger refuges, increased monitoring, and possible sales restrictions may be used to mitigate some or all of this risk.
a) Deployment of Refuges for all Events
There have been a number of approaches proposed for the optimal design of refuges for Bt corn. These include external blocks, in-field strips, seed mixes, temporal refuge strategies, and non-corn hosts. A number of research projects have been undertaken to identify the most appropriate refuge design.
i. Hosts for the Refuge
Non-Bt field corn should provide the best refuge to increase the probability that susceptible insects will mate with potentially resistant ECB from the Bt corn. Non-Bt corn hybrids used as refuges should be selected for growth, maturity, fertility, irrigation, weed management, planting date, and yield traits similar to the Bt corn hybrid. Hybrids that are not agronomically similar may result in different developmental times in corn pests that could lead to assortive (non-random) mating between plants in refuge and Bt fields.
Recent research has shown that temporal and alternate host, non-corn refuges (e.g. weeds, oats, alfalfa, soybeans) are inadequate strategies (Rice et al. 1997, Ostlie et al. 1997b, Calvin et al. 1997, Mason et al. 1998, Hellmich 1998). In addition, non-Bt popcorn may also be viable as refuge for Bt corn (Hellmich 1998).
ii. Seed Mixes vs. In-Field Strips vs. External Blocks
The NC-205 group has recommended three options for refuge placement relative to Bt corn: blocks planted adjacent to fields, blocks planted within fields, or strips planted within fields (Ostlie et al. 1997). In general, refuges may be deployed as external blocks on the edges or headlands of fields or as strips within the Bt corn field.
Research has shown that ECB larvae are capable of moving up to six corn plants within or between rows with the majority of movement occurring within a single row. Later instar (4th and 5th) ECB are more likely to move within rows than between rows (Hellmich 1998). This is a cause for concern because heterozygous (partially resistant) ECB larvae may begin feeding on Bt plants, then move to non-Bt plants (if planted nearby) to complete development, thus defeating the high dose strategy and increasing the risk of resistance. For this reason, seed mixes (refuge created by mixing seed in the hopper) have been eliminated as possible ECB refuges (Mallet & Porter 1992, Buschman et al. 1997).
IID43

Bt Plant-Incorporated Protectants October 15, 2001 Biopesticides Registration Action Document
Buschman et al. (1997) suggested that the within field refuge is the ideal strategy for an IRM program. Since the ECB larvae tend to move within rows, the authors suggest intact corn rows as an acceptable refuge. Narrow (filling one or two planter boxes with non-Bt corn seed) or wide strips (filling the entire planter with non-Bt seed) may be used as in-field refuges. Data indicate that in-field strips may provide the best opportunity for ECB produced in Bt corn to mate with ECB from non-Bt corn. Since preliminary data suggests that the refuge should be within 100 rows of the Bt corn, Buschman et al. (1997) recommended alternating strips of 96 rows of non-Bt corn and 192 rows of Bt corn. This would result in a 33% refuge that is within 100 rows of the Bt corn.
In-field strips (planted as complete rows) should extend the full length of the field and include a minimum of six rows planted with non-Bt corn alternating with a Bt corn hybrid. NC-205 has recommended planting six to 12 rows of non-Bt corn when implementing the in-field strip refuge strategy (NC 205 Supplement 1998). The 2000 SAP also agreed that, due to larval movement, wider refuge strips ($6 rows) are superior to narrower strips, although planter sizes may restrict strip sizes for some smaller growers (SAP 2001). In-field strips may offer the greatest potential to ensure random mating between susceptible and resistant adults because they can maximize adult genetic mixing. Modeling indicates that strips of at least six rows wide are as effective for ECB IRM as adjacent blocks when a 20% refuge is used (Onstad & Guse 1999). However, strips that are only two rows wide might be as effective as blocks, but may be more risky than either blocks or wider strips given our incomplete understanding of differences in survival between susceptible borers and heterozygotes (Onstad & Gould 1998).
Given the concerns with larval movement and need for random mating, either external blocks or in-field strips (across the entire field, at least 6 rows wide) are the refuge designs which may provide the most reduction in risk of resistance development. Research indicates that random mating is most likely to occur with in-field strips.
iii. Proximity
The issue of refuge proximity is a critical variable for resistance management. Refuges must be located so that the potential for random mating between susceptible moths (from the refuge) and possible resistant survivors (from the Bt field) is maximized. Therefore, pest flight behavior is a critical variable to consider when discussing refuge proximity. Refuges planted as external blocks should be adjacent or in close proximity to the Bt corn field (Onstad & Gould 1998, Ostlie et al. 1997b). NC-205 initially recommended that refuges should be planted within ½ sections (320 acres) (NC-205 Supplement 1998). Subsequently, the recommendation was revised to specify that non-Bt corn refuges should be placed within 1/2 mile of the Bt field (1/4 mile “would be even better”) (Ortman 1999).
Hunt et al. (1997) has completed a study which suggests that the majority of ECB do not
IID44

Bt Plant-Incorporated Protectants October 15, 2001 Biopesticides Registration Action Document
disperse far from their pupal emergence sites. According to this mark-recapture study, the majority of ECB may not disperse more than 1500 to 2000 feet. A majority (70-98%) of recaptured ECB were trapped within 1500 feet of the release point. However, in an addendum to the 1997 study, the authors caution that the 1500 foot distance does not necessarily represent the maximum dispersal distance for ECB (Hunt et al. 1998a).
Another mark-recapture ECB project was devoted to within-field movement of emerging ECB (in particular unmated females) (Hunt et al. 1998b). Relatively few unmated females were recaptured (10 over the entire experiment), although the majority of those were found within 85 ft of the release point. This suggests that unmated females may not disperse far from the point of pupal eclosion (this was especially true in the irrigated field). In addition, a relatively high proportion of mated females (31%) in irrigated fields were trapped within 10 feet of the release point, suggesting that mating occurred very close to the point of emergence. Both of these observations indicate that many emerging ECB females may not disperse outside of their field of origin. With respect to resistance management and refuge proximity, these results suggest that refuges should be placed in close proximity to Bt corn fields (or as in-field refuge) to increase the chance of random mating (especially for irrigated fields).
In terms of male ECB dispersal, another mark-recapture study by Showers et al. (2001) showed that males dispersing in search of mates may move significant distances (> 800 m). However, a greater percentage of males were trapped at closer distances (200 m) to the release point. Based on this research, the authors suggest that, in terms of male movement, the current refuge proximity guidelines of ½ mile should be adequate to ensure mating between susceptible moths and any resistant survivors from the Bt field.
While it is clear that ECB dispersal decreases further from pupal emergence points, the quantitative dispersal behavior of ECB has not been fully determined. However, in terms of optimal refuge placement, it is critical that refuge proximity be selected to maximize the potential for random mating. Based on Hunt et al. data, the closer the refuge is to the Bt corn, the lower the risk of resistance. Since the greatest number of ECB were captured within 1500 feet of the field and most females may mate within ten feet of the field, placing refuges as close to the Bt fields as possible should increase the chance of random mating and decrease the risk of resistance. Currently, the proximity requirement for Bt corn is ½ mile (1/4 mile in areas where insecticides have been historically used to treat ECB and SWCB) (EPA letter to Bt corn registrants, 1/31/00). The 2000 SAP agreed with this guideline, stating that “...refuges should be located no further than a half mile (within 1/4 mile if possible) from the Bt corn field” (SAP 2001).
iv. Temporal and Spatial Refuge
The use of temporal and spatial mosaics has received some attention as alternate strategies to structured refuge to delay resistance. A temporal refuge, in theory, would manipulate the life
IID45

Bt Plant-Incorporated Protectants October 15, 2001 Biopesticides Registration Action Document
cycle of ECB by having the Bt portion of the crop planted at a time in which it would be most attractive to ECB. For example, Bt corn fields would be planted several weeks before conventional corn. Because ECB are thought to preferentially oviposit on taller corn plants, the hope is that the Bt corn will be infested instead of the shorter, less attractive conventional corn. However, there are indications from experts in the field that temporal refuges are an inferior alternative to structured refuges (SAP 1998). Research has shown that planting date cannot be used to accurately predict and manipulate ECB oviposition rates (Calvin et al. 1997, Rice et al. 1997, Ostlie et al. 1997b, Calvin 1998). Local climatic effects on corn phenology make planting date a difficult variable to manipulate to manage ECB. Additional studies will have to be conducted under a broad range of conditions to fully answer this question. In addition, a temporal mosaic may lead to assortive mating in which resistant moths from the Bt crop mate with each other because their developmental time differs from susceptible moths emerging from the refuge (Gould 1994).
Spatial mosaics involve the planting of two separate Bt corn events, with different modes of action. The idea is that insect populations will be exposed to multiple proteins, reducing the likelihood of resistance to any one protein. However, currently registered products only express one protein and the primary pests of corn (ECB, CEW, SWCB) generally remain on the same plant throughout the larval feeding stages, individual insects will be exposed to only one of the proteins. In the absence of structured refuges producing susceptible insects, resistance may still have the potential to develop in such a system as it would in a single protein monoculture.
v. CEW North to South Movement and Refuge Issues
It is known that during the growing season CEW move northward from southern overwintering sites to corn-growing regions in the Corn Belt. However, as discussed in the pest biology section (D.2.b.1.b.iii), observations of CEW north to south migration (from corn-growing regions to cotton-growing regions) have been noted. Although more research is needed for confirmation, this phenomena could result in additional exposure to Bt crops and increased selection pressure for CEW resistance. This effect is compounded by the fact that neither Bt cotton or any registered Bt corn event contains a high dose for CEW. As such, it may be necessary to consider additional mitigation measures for CEW.
In considering this issue, the 2000 SAP indicated that CEW refuge is best considered on a regional scale (instead of structured refuge on an individual farm basis), due to the long distance movements typical of this pest (i.e., refuge proximity is not as important for CEW). According to the SAP, a 20% refuge (per farm) would be adequate for CEW, provided the amount of Bt corn in the region does not exceed 50% of the total corn crop. If the regional Bt corn crop exceed 50%, however, additional structured refuge may be necessary (SAP 2001). However, the SAP did not define what a “region” should be (i.e., county, state, or other division).
Based on the last available acreage data for Bt corn, it should be noted that a number of counties
IID46

Bt Plant-Incorporated Protectants October 15, 2001 Biopesticides Registration Action Document
in the Corn Belt exceed the 50% threshold recognized by the 2000 SAP. Because of this, there may be additional risk for CEW resistance. This risk could be mitigated with additional structured refuge in regions with greater than 50% Bt corn. However, additional research will likely be needed to fully determine the risk of CEW north-south movement and appropriate mitigation measures.
b) Refuge Options
i. High Dose Events; MON 810, BT11, TC 1507 (Field Corn)
Non-Cotton Growing Regions That Don't Spray Insecticides on a Regular Basis (e.g., Corn Belt)
This region encompasses most of the Corn Belt east of the High Plains. The original USDA NC-205 refuge recommendations included a 20-30% untreated structured refuge or a 40% refuge that could be treated with non-Bt insecticides (Ostlie et al. 1997a). In the case of ECB, the primary pest of corn for most of the U.S., it is known that on average less than 10% of growers use insecticide treatment to control this pest (National Center for Food and Agriculture Policy 1999). Due to the fact that many growers do not regularly treat for ECB, NC-205 modified their position in a May 24, 1999 letter to Dr. Janet Andersen (Director, BPPD). In this letter, NC-205 amended their recommendation to a 20% non-Bt corn refuge that may be treated with insecticides and should be deployed within 1/2 mile (1/4 mile is better) of the Bt corn. Specific recommendations in the letter were: “1) insecticide treatment of refuges should be based on scouting and accepted economic thresholds, 2) treatment should be with a product that does not contain Bt or Cry toxin, 3) records should be kept of treated refuges and shared with the EPA, 4) the potential impact of sprayed refuges should be monitored closely and evaluated annually, and 5) monitoring for resistance should be most intense in higher risk areas, for example where refuges are treated with insecticides” (Ortman 1999).
Since most growers (>90%) do not typically treat field corn with insecticides to control ECB, a refuge of 20% non-Bt corn that may be sprayed with non-Bt insecticides if ECB densities exceed economic thresholds should be viable for the Corn Belt. Refuges can be treated as needed to control lepidopteran stalk-boring insects with non-Bt insecticides or other appropriate IPM practices. Insecticide use should be based on scouting using economic thresholds as part of an IPM program.
Non-Cotton Growing Regions That Spray Insecticides on a Regular Basis (e.g., the High Plains for SWCB)
NC-205 (1998) has noted that there are some areas that regularly require insecticide treatment
IID47

Bt Plant-Incorporated Protectants October 15, 2001 Biopesticides Registration Action Document
(e.g., the High Plains for SWCB or spider mites) and that separate refuge strategies may be needed for these regions. This is because highly effective insecticides may significantly reduce the number of susceptible adults emerging from the refuge. In a May 1999 letter sent to Dr. Andersen (BPPD Division Director), NC-205 stated: “A refuge management strategy that is more conservative than the one applied across the greater Corn Belt, yet less restrictive than the one proposed for areas growing both corn and cotton, may be most appropriate in the heavily treated areas jointly infested with SWCB and ECB” (Ortman 1999). The size of the refuge is based on the amount of non-Bt corn needed to produce 500 susceptible insects for every resistant insect. When insecticide sprays are used on the refuge, fewer susceptible insects are produced and the refuge area may need to be larger to produce the 500:1 ratio.
Entomologists from Kansas State University (Dr. Randy Higgins, Dr. Lawrence Buschman, and Dr. Phillip Sloderbeck) have indicated that the frequent use of highly effective insecticides in areas that are co-infested with both SWCB and ECB is the issue of concern rather than the mere presence of SWCB. Using highly effective insecticides in these areas will decrease the number of susceptible insects emerging from the refuge and reduce refuge efficacy (Buschman and Sloderbeck 1999; Higgins 1999). The 2000 SAP rationalized that a 20% refuge treated with an insecticide with high efficacy (>90% kill) will be equivalent to a 2% unsprayed refuge (SAP 2001). As a result of the Agency’s new IRM requirements for Bt corn products for the year 2000, areas that are routinely treated with insecticides were more specifically identified by the Agricultural Biotechnology Stewardship Technical Committee (ABSTC) in a letter to Dr. Janet Andersen dated March 31, 2000. This area includes counties in southwest Kansas, southeast Colorado, and the Texas/Oklahoma Panhandle.
After reviewing the insecticide issue, the 2000 SAP concluded that insecticide use may negatively impact IRM if only the refuge (and not the Bt crop) is treated. The panel did not, however, reach a consensus on whether additional measures would be needed to mitigate the potential risk. Some panel members felt that additional refuge is needed in these areas, while others thought that current refuge requirements (20%) are adequate and would help maintain compliance. Another potential mitigation alternative proposed by the panel was to restrict insecticide use to allow for only those treatments that provide <70% kill. The panel also noted that additional information is needed to define these areas and that the NC-205 group is currently looking at the issue and is planning to survey grower insecticide use practices (SAP 2001). NC-205 may be able to provide additional information in the future.
Based upon all of the available information, it can be concluded that corn-growing regions with frequent insecticide treatments may pose an additional risk to IRM strategies for Bt corn, although without additional research, this potential risk cannot be quantified at this time. If additional information should be made available (e.g., from NC-205) that identifies high insecticide treatment as a distinct risk for Bt corn IRM, additional mitigation measures may be necessary. These could include increased refuge or restrictions on the amount of Bt corn sold in the treatment areas. However, at present it would be premature to speculate on any specific
IID48

Bt Plant-Incorporated Protectants October 15, 2001 Biopesticides Registration Action Document
measures that might need to be taken.
ii. High Dose (MON 810, BT11, and TC 1507) Field Corn Events in All Cotton-Growing Regions
As part of their April 1999 and January 2000 submissions, the NCGA/Industry Coalition requested growers be required to plant a minimum of 20% non-Bt corn in the northern portion of the corn/cotton region. The northern corn/cotton region corresponds to northern Arkansas, Missouri Bootheel, northern Texas, and the states of North Carolina, Oklahoma, Tennessee and Virginia. A minimum 50% refuge of non-Bt corn was suggested for the southern portion of the corn/cotton-growing region. The southern corn/cotton region corresponds to the entire states of Alabama, Florida, Georgia, Louisiana, Mississippi, South Carolina, as well as southern Texas and southern Arkansas.
Cotton-growing regions represent a higher risk for resistance due to the potential double exposure of CEW to both Bt corn (Cry1Ab, Cry1F) and Bt cotton (Cry1Ac) during the same growing season. Dr. Mike Caprio (Mississippi State University) developed a corn-cotton ecosystem model for resistance evolution in CEW to Bt-endotoxins expressed in plants to examine the movement of CEW between corn, cotton, soybean, and other wild hosts (Caprio 1997). In the model, the presence of Bt cotton (160 fields) and the ratio of Bt corn/non-Bt corn fields (120 total fields) are important factors. As the ratio of non-Bt corn decreases relative to Bt corn, the time to resistance also decreases; meaning that less non-Bt corn planted as a refuge results in quicker resistance. This effect was most pronounced when the percent of Bt to non-Bt corn exceeded 50%. Caprio’s model suggests that even without cross-resistance as a variable, a sizable proportion of non-Bt corn (at least 50%) should be planted with Bt corn in Bt cotton growing regions to avoid the quick evolution of resistance. The years to resistance are also impacted by the percent of Bt cotton relative to Bt corn. A second model, developed by Storer et al. (1999), has also examined CEW resistance in corn/cotton regions (represented by eastern North Carolina). This model showed that resistance can develop rapidly when the percentage of Bt cotton is high relative to Bt corn (which is true for some northern cotton growing regions), underscoring the need for robust refuge in these regions.
In terms of the proposed “northern cotton-growing region,” a significant increase in Bt cotton in these areas has been observed over the past several growing seasons. From 1996 to 1999, the percent Bollgard acreage increased in North Carolina from 3% to 19% (total increase: 250,000 acres), in Oklahoma from 7% to 20% (total increase: 57,773 acres), in Tennessee from 2% to 68% (total increase: 380,000 acres), and in Virginia from 1% to 7% (total increase: 6,214 acres) (MRID # 450294-01). This shows that the Bt cotton acreage cannot be predicted accurately and may not be an appropriate justification for reduced refuge.
Dr. Fred Gould (North Carolina State University) has also identified resistance risk issues in southern cotton growing regions (described in remarks made at the 1999 EPA/USDA Workshop on Bt Crop Resistance Management in Cotton, Memphis, TN 8/26/99). According to Dr. Gould,
IID49

Bt Plant-Incorporated Protectants October 15, 2001 Biopesticides Registration Action Document
CEW are thought to feed on corn in Mexico in the early spring before moving to cotton in the southern U.S. and ultimately corn in more northern areas. If these CEW diapause in the northern areas and all die over the winter, they pose no resistance problem. However, some indirect evidence has indicated that at least some CEW move from northern areas to southern cotton growing regions to overwinter. CEW that move from the north to south to overwinter could be exposed for four generations or more to Bt crop hosts.
Drs. Caprio, Van Duyn, and Gould recommend a minimum of a 50% non-Bt corn refuge that may be treated only as necessary with non-Bt insecticides is needed in all cotton-growing regions to reduce the risk of resistance. Smaller refuges may present a greater risk and may result in a more rapid evolution of resistance. Since cotton is a preferred overwintering site for CEW, post-harvest plowing of Bt cotton fields to destroy potentially overwintering CEW pupae may also be an effective tool to decrease the risk of resistance, but further research is necessary.
iii. Non-High Dose Events
Non-Cotton Growing Regions That Do Not Spray Insecticides on a Regular Basis (e.g., Corn Belt)
As indicated earlier, there are no specific non-high dose products for ECB that will be considered in this scientific review. It is also clear that a high dose/refuge strategy is preferred for IRM with Bt crops. However, an assessment of non-high dose is included here to provide a comprehensive review of all possibilities.
Research regarding refuge size for non-high dose Bt events is limited. In general, non-high dose Bt corn hybrids pose a higher risk (approximately five times higher) of resistance than high dose events (Onstad & Gould 1998, Gould & Onstad 1998). The International Life Sciences Institute/Health and Environmental Sciences Institute (ILSI/HESI) has recommended larger refuges (e.g. 40% unsprayed in the North) for non-high dose, or high risk varieties (ILSI 1998). The Union of Concerned Scientists (UCS) has also suggested that a separate resistance management strategy should be developed for varieties that do not meet the high dose refuge strategy. UCS recommended a 50% refuge that should not be sprayed with insecticides for Bt corn varieties that do not contain a high dose (UCS 1998).
For non-high dose events, larger refuges may be necessary (Gould 1998, ILSI 1998, UCS 1998). Based on the ILSI and UCS reports, at least a 40% unsprayed refuge in non-cotton growing regions (Corn Belt) is needed to mitigate the threat of resistance. According to the National Center for Food and Agriculture Policy (1999), the percent insecticide use for ECB control in U.S. field corn is on average < 10%. Since most refuges will not be routinely sprayed and some growers need the option of spraying if pests reach economic injury levels, mandating an unsprayed refuge should not be necessary. The risk of insect resistance to the non-high dose events may also be limited by restricting sales (e.g., a total sales cap or in areas where ECB are
IID50
Bt Plant-Incorporated Protectants October 15, 2001 Biopesticides Registration Action Document
univoltine). Since ECB exposure to Bt is limited in areas where there is one generation per year, restricting the use of non-high dose events to these areas will likely decrease the risk of resistance.
Non-Cotton Growing Regions That Spray Insecticides on a Regular Basis (e.g., the High Plains for SWCB)
Non-high dose plants have an increased risk of insect resistance which is compounded if the refuge is sprayed with insecticides. The ILSI panel has recommended larger refuges for these non-high dose, or “high” risk Bt corn varieties. For areas where the refuge will be sprayed with insecticides, the ILSI recommended an 80% non-Bt corn refuge (ILSI 1999). Since there is an increased risk of resistance in areas that are routinely sprayed with insecticides, restricting sales of non-high dose events may reduce the risk. In addition to planting restrictions, larger refuges (e.g., the ILSI Panel's recommended 80% insecticide treatable refuge) are an option that could be implemented to mitigate the risk of resistance.
4) Monitoring
a) Monitoring Strategies
A monitoring program for Bt corn is useful to evaluate the effectiveness of resistance management programs. Detecting shifts in the frequency of resistance genes through resistance monitoring can be an aggressive method to detect the onset of resistance before widespread crop failure occurs.
In general, resistance monitoring plans should include a detailed sampling strategy for all pests susceptible to the expressed Bt proteins regardless of whether they are stated on the label. For Bt field corn, and sweet corn, the susceptible pests would include, but are not limited to: ECB, SWCB, and CEW. To be effective, the monitoring for resistance should be undertaken in areas where the pests are known to regularly overwinter. For FAW and BCW (target pests of TC 1507 Cry1F corn), resistance monitoring is less of a concern. These secondary corn pests overwinter in the south (FAW overwinters only in south Texas, south Florida, and the Caribbean) and migrate north during the growing season. Both FAW and BCW are also polyphagous insects that feed on a variety of other crops and weeds and corn is not necessarily a primary host for these pests. Therefore, resistance to Bt corn is not likely and a specific resistance monitoring plan should not be necessary. However, if large amounts of Bt corn (particularly Cry1F corn targeting FAW) were to be planted in areas in which FAW overwinters (e.g., >1000 acres), selection pressure for resistance may increase and a resistance monitoring plan could be warranted. Other secondary corn pests such as SCSB and CSB may also need to be monitored (on a case-by-case basis), as these pests may be of local or regional significance.
The resistance monitoring plan should not be tied to specific sales thresholds, but be based on
IID51

Bt Plant-Incorporated Protectants October 15, 2001 Biopesticides Registration Action Document
sampling areas in which selection pressure for ECB resistance development is the greatest. Samples should be distributed throughout all corn-growing areas, but can be concentrated in higher resistance risk areas (SAP 1998, 2001).
Dr. Blair Siegfried (entomologist, University of Nebraska) has indicated that at least 100 or more insects, with a target of 500-1000 insects, should be collected per location (noted at the June 18, 1999 EPA/USDA Bt Crop Insect Resistance Management Workshop in Chicago, IL). Sampling locations should be selected to reflect all crop production practices and should be separated by a sufficient distance to reflect distinct populations. More intensively planted Bt corn areas in which selection pressure is expected to be higher should also be targeted.
The utilization of sensitive and effective resistance monitoring techniques is critical to the success of an IRM plan. The following monitoring techniques can be considered as part of a tiered approach to monitoring: 1) Grower reports of unexpected damage; 2) Systematic field surveying of Bt corn; 3) Discriminating concentration assay; 4) F2 screen; 5) Screening against resistant colonies; 6) Sentinel Bt-crop field plots. These techniques were discussed in detail in the Introduction (section D.1).
b) Agricultural Biotechnology Stewardship Technical Committee's (ABSTC) Tiered Approach
In response to requirements detailed in Agency letters to Bt corn registrants (12/20/99 and 1/31/00), the ABSTC submitted (March 31, 2000) a refined Bt field corn resistance monitoring plan for ECB, SWCB, and CEW for the 2000 growing season. The ABSTC plan concentrates resistance monitoring in areas where Bt corn market penetration is highest as well as areas with the highest insecticide use. The plan includes the identification of counties growing more than 50,000 acres of field corn (Bt and non-Bt) to focus monitoring efforts. The ABSTC's proposed plan is designed to detect resistance when it reaches 1-5% (a level that may allow for detection of resistance before field failures occur). Four corn-growing regions were identified and monitoring for each pest will occur in the regions in which the pests are prevalent. The ABSTC proposed a sampling goal of 4-6 locations in Regions I and III and 2-3 locations in Regions II and IV. When possible, at least 200 first or second flight adults (100 females), 100 second flight egg masses, or 100 diapausing larvae per site will be collected in each region, though insect population levels may limit the number collected. It should be noted that the ABSTC plan applies to both Cry1Ab (MON 810 and BT 11) and Cry1F (TC 1507) Bt field corn hybrids.
The October, 2000 SAP concluded that it did not have enough detailed information to adequately evaluate the current resistance monitoring plans. The SAP Subpanel suggested that there be a “careful peer review to assess the adequacy of all Bt resistance monitoring programs.”
A number of the October, 2000 SAP members indicated that the F2 screen accompanied by field screening “could be very effective for detecting low frequencies of recessive and dominant
IID52

Bt Plant-Incorporated Protectants October 15, 2001 Biopesticides Registration Action Document
resistance alleles.” The F2 screen can be a powerful method for detecting rare recessive alleles in natural populations and is described in detail in the Introduction (section D.1.d.4).
The time-frame to respond before control failures occur depends on the precision of monitoring and the recessivity/dominance of resistance. If the goal of resistance monitoring is to detect resistance at a low enough resistance allele frequency so that changes to the insect resistance management plan can be made to increase the longevity of the product and prevent field failure, then the current ABSTC resistance monitoring plan needs further consideration. The F2 screen can detect and measure resistance at frequencies of less than or equal to 0.005 for approximately $5000 per site. This level of precision can provide seven to 12 years to respond with alternative resistance management tactics (see U.S. EPA/USDA 1999, p.47, Figure 1b). Hawthorne et al. (2001) concluded that there is a need to further evaluate the precision and accuracy of the F2 screen by using colonies with known frequencies of resistance alleles. Zhao et al. (2001) also come to this same conclusion.
The October, 2000 SAP Subpanel indicated that the diagnostic or discriminating dose technique could at best, detect resistance when the resistance allele frequency has reached 1%. This is a level in which some field failure may be observed. At this lower level of precision, the least expensive methods are the discriminating dose assays (see U.S. EPA/USDA 1999, p. 47, Figure 1b).
One performance standard to consider is that a resistance monitoring plan could be designed so that there is at least a 95% confidence level in detecting resistance and that there is also a 95% confidence level that resistance will not go undetected. The chance of finding a resistant larvae in a Bt crop depends on the level of pest pressure, the frequency of resistant individuals, and the number of samples that are collected. Therefore, as the frequency of resistant individuals or the number of collected samples increases, the likelihood of locating a resistant individual increases (Roush & Miller 1986). If the phenotypic frequency of resistance is one in 1,000, then more than 3,000 individuals must be sampled to have a 95% probability of one resistant individual (Roush & Miller 1986). The current ABSTC strategy proposes to detect resistance alleles once they reach a frequency of one in 100. This level of detection may not be low enough to detect resistance alleles prior to some field failure. Previous experience with conventional insecticides has shown than once resistant phenotypes are detected at a frequency >10%, control or crop failures are common (Roush & Miller 1986). Using the F2 screen could increase the probability of detecting rare resistant alleles, so that the threshold of detection would be lowered to <0.005 or 50-fold more sensitive than the diagnostic or discriminating dose assay.
The October, 2000 SAP agreed that sampling efforts must be concentrated in areas of high risk in which high usage of a Bt crop would be used as an interim definition. This is also the same recommendation made by the February, 1998 SAP (SAP 1998). The 2000 ABSTC resistance monitoring plan identifies those counties that are >50% Bt corn sales with at least 50,000 acres of Bt and non-Bt corn. Based on the 1999 sales data, there were approximately 40-50 counties
IID53

Bt Plant-Incorporated Protectants October 15, 2001 Biopesticides Registration Action Document
that exceeded this level of market penetration. Most of these counties were located in Minnesota, Iowa, and South Dakota (Region I as defined by the ABSTC plan). The ABSTC resistance monitoring plan has a goal of 4-6 sampling locations in Region I. The October, 2000 SAP Subpanel indicated that it would be difficult to determine how many areas of high risk should be sampled, but that genetic differentiation of insect samples over large transects could help answer that question. Further evaluation of the ABSTC’s sampling strategy including statistical analysis and detection sensitivity is recommended.
c) Monitoring Results
EPA currently mandates that both baseline susceptibility and a discriminating concentration be developed for certain primary target pests including ECB and CEW. Baseline susceptibility data should be collected for each labeled/target pest and consideration should be given for all potentially susceptible pests (e.g., SWCB, BCW, FAW, SCSB) with focus on major economic pests. This information is essential to managing resistance in pest populations, especially in assessing whether a field control failure was due to actual resistance or other factors affecting expression of the Bt protein. These baseline data are helpful in documenting the extent and distribution of resistant populations. Continued monitoring efforts are needed to provide the Agency with standardized information to determine whether resistance evolution is occurring.
Dr. Blair Siegfried (University of Nebraska) has coordinated a standardized monitoring program for ECB (since 1995) and CEW involving LC50 susceptibility determinations and diagnostic concentration (LC99) bioassays to determine susceptibility levels to Bt corn. In terms of baseline susceptibility (LC50), bioassays have been conducted for ECB (Siegfried et al. 1999a, Siegfried & Spencer 2000) and CEW (Siegfried et al. 2000a). For 1999, ECB were collected from 14 separate sites and F1 and/or F2 generations were bioassayed to determine LC50s. Bioassays utilized dilutions of purified Cry1Ab obtained from Bt kurstaki strain HD1-9 (provided by Novartis) spread on artificial diet. Neonate larvae were exposed to the diet less than 24 hours after hatching and mortality and larval weight were recorded seven days later. For 2000, 13 ECB populations were sampled using similar procedures with formulated Cry1Ab protein (CellCap, provided by Dow/Mycogen). ECB are more sensitive to the CellCap Cry1Ab formulation, therefore, susceptibility results from 2000 are not directly comparable with those from 1995-1999. The results for ECB are displayed in Table D3 and show no significant change in ECB susceptibility (LC50 and EC50) to Cry1Ab over the first five years (1995 - 1999) of testing.
Table D3. Mean Susceptibility of ECB to Cry1Ab from 1995 to 2000 (Siegfried et al. 1999a) Year LC50 (ng Cry1Ab/cm2) ± SEM EC50 (ng Cry1Ab/cm2) ± SEM
1995 4.34 ± 0.68 0.37 ± 0.007
IID54

Bt Plant-Incorporated Protectants October 15, 2001 Biopesticides Registration Action Document
Year LC50 (ng Cry1Ab/cm2) ± SEM EC50 (ng Cry1Ab/cm2) ± SEM
1996 6.25 ± 1.25 1.25 ± 0.14
1997 2.12 ± 0.53 0.42 ± 0.007
1998 2.57 ± 0.28 0.43 ± 0.05
1999 4.01 ± 0.49 0.62 ± 0.11
2000* 0.12 - 0.49 ** Not Reported * Data for 2000 from Siegfried & Spencer (2000) ** Data collected for 2000 were obtained using a different Cry1Ab formulation (CellCap) that is more toxic to ECB. As such results from 2000 are not directly comparable with results from previous years (1995-1999). LC50 values are given as a range (without SEM).
For 1999 diagnostic concentration analysis (LC99), baseline susceptibility studies conducted by Marçon et al. (2000) were used to determine the discriminating concentration for ECB. These tests with the discriminating concentrations were conducted in a similar manner to the bioassays to determine LC50 values. For 2000, a new discriminating dose (10 ng/cm2) was established for the CellCap Cry1Ab formulation. The results (for both 1999 and 2000 populations) showed nearly 100% mortality for ECB at the discriminating dose (LC99) (Siegfried et al. 1999a, Siegfried & Spencer 2000).
For CEW, baseline susceptibility (LC50) values ranged from 70.3 ng/cm2 (lab colony) to 221.3 ng/cm2 (field colony) (Siegfried et al. 2000a). A separate diagnostic concentration analysis (using similar methods to those used for ECB) was conducted for CEW (using a dose of 6600 ng/cm2), which showed nearly 100% mortality (Siegfried et al. 1999b). The ABSTC had contacted Dr. Doug Sumerford (USDA) about conducting Cry1Ab susceptibility assays for CEW as part of his monitoring efforts for Bt cotton. However, due to resource and time constraints, Dr. Sumerford indicates he might not be able to perform these assays using Cry1Ab in the future (Sumerford 2001). As such, it is unclear who will assess CEW susceptibility to Cry1Ab in the future.
Since none of the populations monitored (ECB and CEW) demonstrated <99% mortality at a diagnostic concentration and the LC50 for ECB hasn't significantly changed in five years, it can be concluded that ECB and CEW susceptibility to Cry1Ab has not changed as a result of selective pressure from Bt corn.
Additional monitoring work has been done with SWCB. Based on collections from 1998 and 1999, a study was conducted by Trisyono and Chippendale (1999) to determine SWCB susceptibility to Cry1Ab and establish a diagnostic concentration. A bioassay was conducted that established a diagnostic concentration for SWCB of 110 ng Cry1Ab protein/g diet. Susceptibility data (LC50s and EC50s), determined after 7 and 14 days of exposure to Cry1Ab, are summarized in Table D4 below. SWCB monitoring was also conducted for the 2000 growing
IID55

Bt Plant-Incorporated Protectants October 15, 2001 Biopesticides Registration Action Document
season, using similar methodology (Song et al. 2000) to obtain susceptibility data (LC50s and EC50s). The susceptibility data are summarized in Table D4 below. A diagnostic concentration assay was performed (7 day test dose = 0.35 µg Cry1Ab/g diet, 14 day test dose = 5 µg Cry1Ab/g diet) which resulted in 100% mortality for all tested populations.
Taken together, the SWCB monitoring results show that, to date, no appreciable increase in susceptibility has resulted from exposure to Cry1Ab corn. Although the susceptibility data were variable and require further refinement, results indicated that the laboratory colonies evaluated were not as susceptible to Cry1Ab as the field collected populations. Furthermore, the results from 1998 and 1999 indicated that a bioassay using growth inhibition is more sensitive than one based on larval mortality. Trisyono and Chippendale (1999) suggested that bioassays based on growth inhibition rather than larval mortality may have greater benefits because they require a smaller amount of Bt protein, sublethal effects can be observed, the time of observation is flexible (weight gain is being compared to a control), and variation may be minimized.
Table D4. SWCB Susceptibility to Cry1Ab from 1998 to 2000 (Trisyono and Chippendale 1999; Song et al. 2000)
Year LC50 (µg Cry1Ab/g diet) EC50 (ng Cry1Ab/g diet)
Field Populations Lab Colony Field Populations Lab Colony
1998 7-day: 0.22 - 1.09 14-day: 0.04 - 0.09
7-day: 1.01 14-day: 0.28
7-day: 2.2 - 6.6 14-day: 2.4 - 5.4
7-day: 7.6 14-day: 6.2
1999 7-day: 0.07 - 0.17 14-day: 0.02 - 0.05
7-day: 1.06 - 1.12 14-day: 0.26 - 0.34
7-day: 2.6 - 3.7 14-day: 1.9 - 3.3
7-day: 4.2 - 6.3 14-day: 4.9 - 5.1
2000* 7-day: 0.08 - 0.15 14-day: 0.04 - 0.09
7-day: 0.98 14-day: 0.27
14-day: 2.51 - 4.88 14-day: 4.97
* The units for the 2000 data are µg Cry1Ab/ml diet for LC50 values and ng Cry1Ab/ml diet for EC50 values.
There are no monitoring results to date for Cry1F field corn, due to the fact that registration for TC 1507 hybrids was initially granted for the 2001 growing season. However, baseline susceptibility to Cry1F has been established for a number of pests including ECB and SWCB. For ECB, susceptibility (LC50) ranged from 0.17 µg Cry1F/g diet (1st instar) to 10.67 µg Cry1F/g diet (4th instar) (MRID# 453077-01; reviewed in R.Rose memo to M.Mendelsohn, 1/24/01). For SWCB, the LC50 to Cry1F was estimated to be 0.70 µg Cry1F/cm2 diet (MRID# 450201-01; reviewed in R.Rose memo to M.Mendelsohn, 1/24/01).
There is also a monitoring program for FAW, as part of the Bt sweet corn registration. The results of this program are described in the Bt sweet corn section (D.2.b.10).
5) Remedial Action
Remedial action plans are a potential response measure should resistance develop to Bt crops.
IID56

Bt Plant-Incorporated Protectants October 15, 2001 Biopesticides Registration Action Document
Since resistance may develop in “localized” pest populations, it may be possible to contain the resistance outbreak before it becomes widespread. A specific remedial action plan should clearly indicate what actions the registrant will take in cases of “suspected” resistance (i.e., unexpected damage) and “confirmed” resistance. The remedial action plan can also include appropriate adaptations for regional variation and the inclusion of appropriate stakeholders. To fully mitigate resistance, a critical element of any remedial action plan should be that once pest resistance is confirmed, sales of all Bt corn hybrids that express a similar protein or a protein in which cross-resistance potential has been demonstrated would be ceased in the affected region.
A remedial action plan has been proposed by ABSTC for Bt corn (applicable to MON 810, BT 11, and TC 1507), consisting of two elements: 1) strategies for unexpected damage; and 2) strategies for confirmed resistance. Both components are discussed in the following sections.
a) Actions to be Taken if Unexpected Levels of Insect Damage Occur
ABSTC proposed a strategy for unexpected pest damage in Bt corn in the “Industry Insect Resistance Management for Cry1A Plant-Expressed Protectants in Field Corn” (submitted 4/19/99). Aventis submitted a similar plan in 1998 (MRID 445042-01). The language of the ABSTC plan is as follows:
“Customers (growers and seed distributors) will be instructed to contact the registrant or authorized distributor if incidents of unexpected levels of target insect damage occur during use of the registrant's Bt corn products. Registrants (or their authorized distributors) will investigate and identify the cause for this damage by local field sampling of plant tissue from corn hybrids that contain the Bt corn plant-expressed protectant and sampling of local pest populations, followed by appropriate in vitro and in planta assays. Upon confirmation by immunoassay that the plants contain the appropriate Cry1A/Cry1F protein, bioassays will be conducted to determine whether the collected insect population exhibits a resistant phenotype.
Where available and validated for a target pest species, a discriminating concentration assay will be employed to define a confirmed instance of resistance. For other target pests, until such time that a discriminating concentration assay is established and validated, registrants will utilize the following to define a confirmed instance of insect resistance:
Progeny from the sampled pest population will be considered resistant if they exhibit BOTH of the following characteristics in bioassays initiated with neonates:
1. An LC50 in a standard diet bioassay (incorporating the appropriate Cry1A/Cry1F protein) that exceeds the upper limit of the 95% confidence interval of the mean historical LC50 for susceptible pest populations, as established by the
IID57

Bt Plant-Incorporated Protectants October 15, 2001 Biopesticides Registration Action Document
ongoing baseline monitoring program.
2. > 30% survival and > 25% leaf area damaged in a five-day bioassay using the appropriate Cry1A/Cry1F-positive leaf tissue under controlled laboratory conditions.
Based upon continued experience and research, this working definition of confirmed resistance may warrant further refinement. In the event that the registrants find it appropriate to alter the criteria specified in the working definition, the registrants will obtain Agency approval in establishing a more suitable definition.”
In the January 31, 2000 letter to Bt corn registrants, the Agency agreed with this strategy and the working definition of “confirmed resistance.” The letter also clarifies the Agency’s interpretation of “suspected” resistance to be:
“...in the case of reported product failure, that corn in question has been confirmed to be Bt corn, that the seed used had the proper percentage of corn expressing Bt protein, that the relevant plant tissues are expressing the expected level of Bt protein, that it has been ruled out that species not susceptible to the protein could be responsible for the damage, that no climatic or cultural reasons could be responsible for the damage, and that other reasonable causes for the observed product failure have been ruled out. The Agency does not interpret ‘suspected resistance’ to mean grower reports of possible control failures, nor does the Agency intend that extensive field studies and testing to fully scientifically confirm insect resistance be completed before responsive measures are undertaken.”
Two other elements that could further mitigate the risk of resistance in the event of unexpected damage (i.e., these measures could be undertaken while the cause of the suspected resistance is investigated) are:
1) The immediate use of alternate control measures to control the pest suspected of resistance to Bt corn in the affected region.
2) The destruction of crop residues in the affected region immediately after harvest (i.e. within one month) with a technique appropriate for local production practices to minimize the possibility of resistant insects overwintering and contributing to the next season’s pest population.
A panelist on the 2000 SAP also noted, that given the logistics of monitoring, it may take two years from resistance detection to remedial action plan implementation. During this period of “suspected” resistance, the panelist noted that increasing refuge size could help to prolong susceptibility (SAP 2001).
IID58

Bt Plant-Incorporated Protectants October 15, 2001 Biopesticides Registration Action Document
b) Remedial Measures in Confirmed Cases of Insect Resistance
In cases of “confirmed” resistance (as defined in section A above), ABSTC has proposed the following strategy for Bt corn hybrids:
“The registrant will report all instances of confirmed pest resistance, as defined above, to the Agency within 30 days. Upon identification of a confirmed instance of resistance, registrants will take the following immediate mitigation measures:
1. Notify customers and extension agents in the affected area,
2. Recommend to customers and extension agents in the affected area the use of alternative control measures to reduce or control the local target pest population, and
3. Where appropriate, recommend to customers and extension agents in the affected area that crop residues be incorporated into the soil following harvest, to minimize the possibility of overwintering insects.
Within 90 days of a confirmed instance of pest resistance, as defined above, registrants will:
1. Notify the Agency of the immediate mitigation measures that were implemented,
2. Submit to the Agency a proposed long-term resistance management action plan for the affected area,
3. Work closely with the Agency in assuring that an appropriate long-term resistance management action plan for the affected area is implemented, and
4. Implement an action plan that is approved by EPA and that consists of some or all the following elements, as warranted:
a. Informing customers and extension agents in the affected area of pest resistance,
b. Increasing monitoring in the affected area, and ensuring that local target pest populations are sampled on an annual basis,
c. Recommending alternative measures to reduce or control target pest populations in the affected area,
IID59

Bt Plant-Incorporated Protectants October 15, 2001 Biopesticides Registration Action Document
d. Implementing intensified local IRM measures in the affected area based on the latest research results. The implementation of such measures will be coordinated by the Agency with other registrants; and
e. If the above elements are not effective in mitigating resistance, registrants will voluntarily cease sale of all Bt corn hybrids subject to the Industry IRM Plan in the county experiencing loss of product efficacy and in the bordering counties until an effective local management plan approved by EPA has been implemented. During the voluntary suspension period, registrants may sell and distribute in these counties only after obtaining EPA approval to study resistance management in those counties. The implementation of such a strategy will be coordinated by the Agency with other registrants and stakeholders.
If EPA agrees that an effective local resistance management plan has been implemented which mitigates resistance, the registrants can resume sales in the affected county(ies).”
The Agency has agreed with this strategy for confirmed resistance, with the condition that once resistance has been confirmed, the sale and distribution of Bt corn in the affected counties must be halted until an EPA-approved mitigation plan is in place. In addition, Bt corn registrants will assume responsibility for resistance mitigation actions (EPA letter to Bt corn registrants, 1/31/00).
In addition to the remedial strategy for confirmed resistance proposed by ABSTC, the following elements could further mitigate the risk of resistance development:
1) Immediate suspension of the sale of Bt corn hybrids expressing the same or similar Bt protein (i.e. same mode of action, cross-resistant varieties) as the suspected Bt corn hybrid harboring the resistant population in the affected region (this was mandated in the 1/31/00 letter).
2) The mandatory use of alternate control measures and post-harvest crop residue destruction in the affected region (the ABSTC plan “recommends” these measures).
3) For mitigation of resistance in the growing season(s) following a confirmed resistance incident(s), use of the following procedures:
a) Maintenance of the sales suspension of all Bt corn hybrids (with the same protein or similar Bt proteins as the Bt corn hybrids with the resistant population) in the affected region, which would remain in place until resistance has been determined to have returned to acceptable levels.
b) The development and use of alternative resistance management strategies for
IID60

Bt Plant-Incorporated Protectants October 15, 2001 Biopesticides Registration Action Document
controlling the resistant pest(s) on corn in the affected region.
c) Notification of all relevant personnel (e.g., growers, consultants, extension agents, seed distributors, processors, university cooperators, and state/federal authorities) in the affected region of the resistance situation.
d) Intensified monitoring and surveillance in the affected region(s) for resistance and definition of the boundaries of the affected region. These studies could also include assays to track the decline of resistance in the field and determine the potential for cross-resistance in the resistant population.
In discussing remedial action, the 2000 SAP suggested that eradication of a resistance gene (as part of a remedial action plan) may prove to be too difficult. Rather, a plan based on slowing the spread of resistance genes (and possibly causing their decline) may prove more practical. As part of a plan to slow resistance genes, the SAP suggested the following elements: 1) education of growers/crop consultants to look for unexpected pest damage; 2) monitoring for plant damage, pest susceptibility, and resistance allele frequency (with rapid verification and alternate control strategies for verified resistance); 3) sales suspensions of the affected product in the region until it can be shown that the product’s benefits will outweigh its risks; 4) continual monitoring to determine the effectiveness of the remedial action plan; and 5) an assessment of how the resistance problem occurred (SAP 2001).
6) Cross-Resistance
Cross-resistance is an area of major concern for resistance management and poses risks to both transgenic Bt crops and microbial Bt insecticides. Cross-resistance occurs when a pest becomes resistant to one Bt protein, which then allows the pest to resist other, separate Bt proteins. The threat of cross-resistance is particularly acute with Bt corn, since there are multiple Bt proteins and hybrids currently registered and commercially available (Cry1Ab and Cry1F are presently registered). In addition, some pests of corn are also pests of other crops for which Bt transgenic varieties are or may soon be available or of crops on which microbial Bt insecticides may be used (e.g., CEW on cotton, FAW on tomato). Cross-resistance also poses a risk to pyramid strategies, in which multiple proteins are deployed simultaneously in the same hybrid. However, it should be noted that, to date, the development of cross-resistance has not been shown in insect pests exposed in the field to Bt crops producing different Bt proteins.
In general, it is possible for resistance to Bt proteins to occur through a number of different mechanisms, some of which may result in cross-resistance to other proteins. The most well documented mechanism of resistance is reduced (midgut) binding affinity to Bt proteins. Different Cry proteins may bind to distinct receptors in an insect gut. Modifications to these insect crystalline protein receptors have been implicated in resistance to Cry proteins. Other mechanisms that may lead to resistance (and ultimately cross-resistance) include protease
IID61

Bt Plant-Incorporated Protectants October 15, 2001 Biopesticides Registration Action Document
inhibition, metabolic adaptations, gut recovery, and behavioral adaptations (Heckel 1994, Tabashnik 1994).
Regarding binding sites, cross-resistance may result if two proteins share the same binding site (receptor) in the insect midgut. Therefore, if exposure to one Bt protein results in a modification of the receptor, other proteins sharing this site will be affected as well. An example of a possible shared binding site resulting in cross-resistance was observed with tobacco budworm (TBW). In this case, TBW selected for resistance to Cry1Ac were also found to be resistant to the Cry1Aa, Cry1Ab, and Cry1F proteins (Gould et al. 1995).
Overall, cross-resistance patterns and their underlying physiological mechanisms are very complex and somewhat unpredictable, even within a closely related group of proteins and susceptible insects. To mitigate the risks of cross-resistance to Bt corn, additional research will be needed to fully assess the potential for cross-resistance with each Bt protein and targeted pest. To date, research has been focused primarily on shared binding site studies with a limited subset of Bt protein and corn pests (notably ECB). Further mitigation measures could include the restrictions of certain hybrids determined to be at risk for cross-resistance. This has been done in southern cotton growing regions where CEW, a pest of corn and cotton, may be exposed to multiple Bt toxins in both Bt corn and Bt cotton.
Cross-resistance patterns in ECB, the major pest of corn, have proven to be complicated. The binding of three Bt insecticidal crystal proteins to the midgut epithelium of ECB larvae was characterized by performing binding experiments with both isolated brush border membrane vesicles and gut tissue sections (Denolf et al. 1993). Results demonstrated that two independent insecticidal crystal protein receptors are present in the brush border of ECB gut epithelium. From competition binding experiments, it was concluded that Cry1Ab and Cry1Ac are recognized by the same receptor. Also, the Cry1B protein did not compete for the binding site of Cry1Ab and Cry1Ac and was determined to have a different receptor. Cry1D and Cry1E, two proteins that are not toxic to ECB, were not bound to the gut epithelial cells. Other experiments using laboratory-selected resistant strains to predict survival and cross-resistance in the field on Bt corn with ECB have provided different results. A Cry1Ac-resistant ECB strain (produced by Dr. Hutchinson, University of Minnesota) and a Cry1Ab-resistant ECB strain (produced by Dr. Keil, University of Delaware) had a moderate level of resistance, about 30 to 60X. None of the resistant larvae survived on Bt corn beyond the second instar. It is interesting to note that the Cry1Ac-resistant ECB were not cross-resistant to Cry1Ab and that Cry1Ab-resistant ECB are not cross-resistant to Cry1Ac (Hutchison, personal communication, reviewed by U.S. EPA 1998). Based on receptor binding studies, one would have expected both resistant strains to survive on Bt corn. It can be concluded that although two proteins are closely related, there may be different binding mechanisms or binding affinity in ECB relative to other pests, such as DBM or TBW.
Based upon the binding properties of Cry1A and Cry2A proteins in CEW, TBW, and ECB
IID62

Bt Plant-Incorporated Protectants October 15, 2001 Biopesticides Registration Action Document
larvae, there appears to be a much lower probability of cross-resistance developing to Cry2A delta endotoxins from resistance to Cry1Ab or Cry1Ac. Because the Cry1A and Cry2A proteins exhibit different binding characteristics and very low amino acid homology, they likely possess different modes of action. However, there is some evidence for the development of broad cross-resistance to Cry1 and Cry2A in at least two laboratory-selected strains: beet armyworm (BAW) (Moar et al. 1995) and TBW (Gould et al. 1992).
Collectively, laboratory-selected strains and isolated field populations indicate that there is a genetic potential for Bt cross-resistance to develop to multiple or single Cry delta endotoxins in a number of corn pests from exposure to Cry1Ab. However, cross- resistance patterns and physiological mechanisms are complex and unpredictable, even within related groups of proteins and susceptible pests. Research has suggested that Cry1Ab and Cry1Ac may share binding sites in several tested insect species, although this may not necessarily result in cross-resistance in the field. Other proteins, including Cry2A and Cry1F, may also be at risk for cross-resistance with Cry1Ab, although additional research is clearly needed. Due to the potential cross-resistance between Cry1Ab and Cry1Ac, areas in which Bt corn (expressing Cry1Ab) and Bt cotton (Cry1Ac) are grown may pose additional risks for resistance in CEW, a pest of both corn and cotton during the same growing season.
Binding studies have also been conducted with Cry1F (expressed in TC 1507 field corn) to determine cross-resistance potential with other Bt toxins including Cry1Ab, Cry1Ac, and Cry9C in ECB. The results showed that Cry1Ab likely recognizes multiple binding sites in ECB brush border membrane vessicles (BBMV), one of which may be shared by Cry1F. Given this result, there is some potential for cross-resistance between Cry1F and Cry1Ab (MRID# 450201-15; reviewed in R.Rose memo to M.Mendelsohn, 1/24/01).
Given the unpredictability of cross-resistance among pest species, it would be useful to generate cross-resistance data for SWCB, SCSB, CSB, BCW, and other secondary pests, to gain a more complete understanding of the implications for Bt corn.
7) Compliance
There have been several recent surveys and estimates of the level of grower compliance for Bt corn IRM. Dr. Marlin Rice (Iowa State University) has conducted regular grower surveys to measure grower attitudes towards various aspects of Bt corn, including compliance with IRM guidelines. These surveys have shown that the great majority of growers understand and are receptive to the need for refuge and resistance management. However, they also demonstrate that some level of non-compliance must be expected. The results from the 1996 grower survey showed that 23.5% of sampled growers would follow a prescribed IRM strategy, 57.1% would if compatible with their growing practices, 7.2% would not follow IRM, and 12.2% “didn’t know” (Pilcher & Rice 1997). Results from the 1998 grower survey showed that 25.5% of growers would implement recommended IRM, 58.9% would if compatible with their growing practices,
IID63

Bt Plant-Incorporated Protectants October 15, 2001 Biopesticides Registration Action Document
2.6% would not follow IRM recommendations, and 12.9% “didn’t know” (Rice & Pilcher 1999).
In terms of compliance information submitted by industry, the ABSTC (representing Monsanto, Novartis, and Mycogen) conducted a compliance survey for the 2000 growing season (MRID# 453205-03). The ABSTC compliance plan consists of grower contracts, intensified education for regions showing low compliance, and restrictions on future use of Bt corn for individual growers repeatedly out of compliance. The compliance survey was conducted by a marketing research firm and included telephone surveys of 501 total growers, each farming at least 200 acres. This survey did not involve visits to individual farms (i.e., grower audits). Compliance was assessed for two Bt corn IRM requirements: percent refuge (required to be 20% or greater) and refuge proximity (required to be within ½ mile of the Bt field). Survey respondents indicated that 87% planted an appropriate amount of refuge (at least 20%), while 13% had less than the required amount or no refuge. In terms of proximity, 82% of growers reported refuges planted within ½ mile of the Bt field (18% reported refuges planted greater than ½ mile from the Bt field). When both refuge percentage and proximity are considered together, 71% of growers were in total compliance. It should be noted that growers were sampled in southern cotton growing regions, where a 50% refuge is required. It is unclear from the survey whether these growers were counted as compliant for planting a refuge of less than 50%, but greater than 20%.
Based on the results of the survey, the ABSTC will work to improve their educational programs. The report did not elucidate what, if any, additional measures will be taken to improve compliance for future growing seasons.
Collectively, these surveys indicate that 100% compliance is not likely and that some level of non-compliance must be expected. An expectation of 30% (or greater) non-compliance may be reasonable, given these survey results. However, the 2000 SAP indicated that while surveys such as these are useful for tracking grower attitudes, they are not reliable for determining actual grower compliance (SAP 2001). The format of the surveys (mail or phone interviews) may encourage non-compliant growers to misrepresent their actions or “cheat” in their responses. Without confirmatory visits to individual farms (i.e., audits), it may be impossible to verify the accuracy of grower responses. The end result could be increased “false-positives,” which may artificially inflate estimates of grower compliance. As such, actual non-compliance may be significantly higher than the survey results would suggest. To resolve this problem, the 2000 SAP suggested utilizing surveys created and conducted by independent parties to assess grower practices (SAP 2001). In addition to this recommendation, it may be useful to conduct some on-farm visits for firsthand verification of compliance. Such visits could be performed as part of a survey process, to evaluate the accuracy of grower survey responses.
8) Grower Education
Growers are perhaps the most essential element for the implementation and success of any IRM
IID64

Bt Plant-Incorporated Protectants October 15, 2001 Biopesticides Registration Action Document
plan as they will ultimately be responsible for ensuring that refuges are planted according to guidelines and that Bt fields are monitored for unexpected pest damage. Therefore, a program that educates growers as to the necessity of IRM and provides guidance as to how to deploy IRM should be an integral part of any resistance management strategy. The 2000 SAP also suggested that a comprehensive education program may help increase IRM compliance (SAP 2001). Ideally, the educational messages presented to growers should be consistent (among different registrants) and reflect the most current resistance management guidelines. Specific examples of education tools for growers can include grower guides, technical bulletins, sales materials, training sessions, Internet sites, toll-free numbers for questions or further information, and educational publications.
9) Annual Reports
Written reports on various aspects of IRM, submitted on an annual basis to EPA, are of great aid in the evaluation of the success of resistance management for Bt corn. The Agency has received annual reports from Bt corn registrants (as a requirement of registration) on Bt corn sales/market penetration, IRM-related research, grower education, grower compliance and resistance monitoring. It is particularly useful to receive reports from Bt corn registrants on grower compliance and resistance monitoring.
10) Bt Sweet Corn IRM
Attribute Bt sweet corn is a BT11 hybrid and expresses the Cry1Ab protein. It is thought that Attribute, like BT11 field corn, contains a high dose for ECB. The other targeted pests, for which there is not a high dose, are CEW and FAW.
Refuge for Bt sweet corn was not recommended for the following reasons: 1) sweet corn is typically harvested earlier than field corn (18-21) days after silking (before most lepidopteran larvae complete development); and 2) all Bt sweet corn residues were to be destroyed within one month of harvest (a practice that presumably would destroy any live larvae left in corn stalks). The 2000 SAP agreed that this approach should be sufficient to mitigate pest resistance to Bt sweet corn. Several panelists, however, suggested a shorter crop destruction period (i.e., 14 days instead of one month) (SAP 2001).
The terms and conditions of the Bt sweet corn registration stipulate that, based on IRM concerns, the product is for commercial use only and is not available to growers planting less than 40 acres. However, should smaller growers (i.e., those planting less than 40 acres) adhere to the crop destruct requirements for Bt sweet corn (to destroy any overwintering insects), it is unlikely these growers will pose a threat to pest resistance given the limited acreage involved. As such, from an IRM perspective, it should be possible to lift the acreage restrictions on smaller growers for Bt sweet corn.
IID65
Bt Plant-Incorporated Protectants October 15, 2001 Biopesticides Registration Action Document
Regarding crop destruction, it is possible that the crop destruct requirement may not be adequate in itself to mitigate the threat of resistance for ECB. Specifically, there are data (Mason et al. 1983) that show variance among different crop destruct techniques in terms of the number of surviving ECB. The variation in the efficacy of crop destruct techniques may increase the risk for ECB resistance in Bt sweet corn. This risk may be mitigated by either: 1) prescribing a specific and effective crop destruct technique; or 2) utilizing structured refuge. Regarding option #1, it should be noted that corn cultivation practices vary (i.e., plow vs. no-till) and certain crop destruct techniques may not be compatible with all practices. In addition, additional research could help to verify the most appropriate crop destruct technique.
The threat of resistance for CEW and FAW in sweet corn should be lower than ECB, due to the fact that CEW and FAW typically complete development in corn ears (unlike stalk-boring ECB), which are mostly harvested and removed from the field prior to crop destruction (Lynch et al. 1999). Also, FAW is known to overwinter only in south Florida, south Texas, and the Caribbean.
As part of the registration, a FAW monitoring program has been developed to determine susceptibility to Cry1Ab (other Bt sweet corn target pests, ECB and CEW, are part of the monitoring program for Bt field corn, described in the Monitoring section - D.2.b.4). Susceptibility was determined with diet assays utilizing toxin overlays for FAW populations collected from four geographic locations in 1998 and 1999. For 1998, the LD50 range was 0.90 -1.50 µg Cry1Ab/cm2 and for 1999, the LD50 range was 2.14 - 10.22 µg Cry1Ab/cm2 (Lynch et al. 2000). The decreased susceptibility observed in 1999 not likely an increase in tolerance to the toxin (the lab colony used as a control showed similar trends) and presumably is the result of population variability or experimental effects.
It should be noted that for FAW, resistance monitoring is less of a concern, due to the fact that resistance is not likely. Therefore, a specific FAW resistance monitoring plan may not be necessary for Bt sweet corn. However, should there be significant Bt sweet corn acreage in areas where FAW overwinters (south Florida and south Texas), it would be beneficial for FAW to be monitored for resistance.
c. Summary of Risk Analysis for Bt Corn IRM
1) Proximity of Refuge:
Refuges need to be placed close enough to the Bt field to maximize the likelihood of random mating between resistant survivors from the Bt field and susceptible insects from the refuge. Given the knowledge of ECB pest biology (adult movement, mating, and oviposition behavior), risks to resistance will be mitigated if the refuge is placed as close to the Bt field as possible. In-field refuge options (such as strips) may provide the best scenario to ensure random mating. For external refuge options (i.e., blocks), it would be advantageous to locate refuges as close to the
IID66

Bt Plant-Incorporated Protectants October 15, 2001 Biopesticides Registration Action Document
Bt field as possible. Hunt, et al (1997) report most ECB adults disperse within 1500 feet from where they were released. To plant the refuge further than 1/4 mile from the Bt corn field may decrease the chance of random mating and increase the risk of resistance. Expert groups, such as NC-205 and the 2000 SAP, have recommended a refuge proximity of 1/2 mile (preferably 1/4 mile) for Bt corn.
2) Refuge Options
Refuge Scenario #1: High Dose Events (MON 810, BT 11, and TC 1507) in Non-Cotton Growing Regions That Don't Spray Insecticides on a Regular Basis (e.g., Corn Belt)
This region encompasses most of the Corn Belt east of the High Plains. The initial USDA NC-205 refuge recommendations (issued in 1997) included a 20-30% untreated structured refuge or a 40% refuge that could be treated with non-Bt insecticides. However, due to the fact that many growers do not regularly treat for ECB (< 10%), the USDA NC-205 modified their position to include a 20% refuge that may be treated with insecticides. NC-205 stated that insecticide use should be based on scouting using economic thresholds.
Refuge Scenario #2: High Dose Events (MON 810, BT 11, and TC 1507) in Non-Cotton Growing Regions That Spray Insecticides on a Regular Basis (e.g., the High Plains for SWCB)
NC-205 has noted that there are some areas that regularly require insecticide treatment (e.g. the High Plains for SWCB or spider mites) and that separate refuge strategies may be needed for these regions. Insufficient numbers of susceptible moths may be produced in sprayed refuges in this area. To mitigate this effect, larger refuges may need to be considered. The affected region includes counties in Southwest Kansas, Southeast Colorado and the Texas and Oklahoma Panhandles. It should be noted that NC-205 is currently studying this issue and may provide additional information in the future. EPA will independently evaluate any information received from NC-205 (or other sources) on this issue.
Refuge Scenario #3: High Dose (MON 810, BT 11, and TC 1507) Events in All Cotton-Growing Regions
Cotton-growing regions represent a higher risk for resistance due to the potential double exposure of CEW to both Bt corn (Cry1Ab and Cry1F) and Bt cotton (Cry1Ac) during the same growing season. Modeling by Dr. Mike Caprio suggests that a sizable proportion of non-Bt corn (at least 50%) must be planted with Bt corn in Bt cotton growing regions to avoid the quick evolution of resistance. Smaller refuges present a greater risk and may result in a more rapid evolution of resistance. Cotton experts Dr. John Van Duyn and Dr. Dick Hardee have also communicated a recommendation for a 50% non-Bt corn refuge in cotton growing areas. For
IID67

Bt Plant-Incorporated Protectants October 15, 2001 Biopesticides Registration Action Document
this scenario, the recommendations include refuges which may be treated to control lepidopteran stalk-boring insects as needed with non-Bt insecticides or other appropriate IPM practices. Insecticide use should be based on scouting using economic thresholds as part of an IPM program.
Refuge Scenario #4: Non-High Dose Events in Non-Cotton Growing Regions That Do Not Spray Insecticides on a Regular Basis (e.g., Corn Belt)
Although there are no specific non-high dose products for ECB that have been considered in this reassessment, an assessment of non-high dose is provided for a comprehensive review of all possibilities.
In general, non-high dose Bt corn hybrids pose a higher risk of resistance than high dose events. The International Life Sciences Institute/Health and Environmental Sciences Institute (ILSI/HESI) has recommended larger refuges (e.g., 40% unsprayed in the North) for non-high dose, or “high risk” varieties. The Union of Concerned Scientists (UCS) has recommended a 50% refuge that should not be sprayed with insecticides for Bt corn varieties that do not contain a high dose (UCS 1998).
As noted for Refuge Scenario #1, because most refuges will not be routinely sprayed and some growers need the option of spraying if pests reach economic injury levels, mandating an unsprayed refuge should not be necessary. ILSI and UCS recommended a refuge of 40% or more non-Bt corn (treatable with non-Bt insecticides if ECB densities exceed economic thresholds) for the Corn Belt.
The risk of insect resistance to the non-high dose events may also be limited by restricting sales (e.g., a total sales cap or in areas where ECB are univoltine). Since ECB exposure to Bt is limited in areas where there is one generation per year, restricting the use of non-high dose events to these areas may decrease the risk of resistance.
Refuge Scenario #5: Non-High Dose Events in Non-Cotton Growing Regions That Spray Insecticides on a Regular Basis (e.g., the High Plains for SWCB)
Non-high dose plants have an increased risk of insect resistance that is compounded if the refuge is sprayed with insecticides. The ILSI panel has recommended larger refuges for these non-high dose, or “high” risk Bt corn varieties. For areas where the refuge will be sprayed with insecticides, ILSI recommended an 80% non-Bt corn refuge (ILSI 1999). Restricting sales of non-high dose events can also reduce the risk of resistance development.
Table D5. Summary Table of the Five Potential Bt Corn Refuge Scenarios (as described above)
IID68

Bt Plant-Incorporated Protectants October 15, 2001 Biopesticides Registration Action Document
Dose Region Recommended refuge by NC-205; ILSI
Proximity Notes
High Dose Corn Belt, no regular pesticide treatment for ECB, SWCB
20% sprayable*
< 1/4 mile from Bt field
High Dose Corn Belt, regular pesticide treatment for ECB, SWCB
> 20% sprayable
< 1/4 mile from Bt field
Region includes counties in SW KS, SE CO and TX, OK Panhandle
High Dose and Non-high Dose
Cotton Region 50% sprayable
< 1/4 mile from Bt field
Non-high Dose
Corn Belt, no regular pesticide treatment for ECB, SWCB
40% sprayable*
< 1/4 mile from Bt field
Sales restrictions are also an option
Non-high Dose
Corn Belt, regular pesticide treatment for ECB, SWCB
80% sprayable
< 1/4 mile from Bt field
Sales restrictions are also an option
*Use of insecticide sprays only recommended by NC-205
3) Information to Improve the Risk Assessment
Although the Agency has considered the most up-to-date scientific information in this risk assessment, resistance management is a developing field. Therefore, the IRM strategies may be improved with the collection of additional information, the results of which can be submitted in annual research reports. These data are summarized in Table D6 below.
Table D6. Summary of Data Which Would be Likely to Improve Insect Resistance Management Strategies for Bt Corn Products
Data Pests
Pest Biology: e.g., larval movement, adult movement, mating behavior, pre- and post-mating dispersal, ovipositional behavior, fitness, and overwintering habitat and survival
ECB, CEW, SWCB
North to South Movement CEW
High Dose Verification (using 1998 SAP techniques) ECB and SWCB
Resistance Allele Frequency ECB, CEW, SWCB, FAW (Bt sweet corn)
Cross-Resistance - Cry1F, Cry2A, Cry1A proteins ECB, CEW, SWCB
IID69

Bt Plant-Incorporated Protectants October 15, 2001 Biopesticides Registration Action Document
Data Pests
Evaluation (field studies and models) of Refuge Options (20% external refuge (sprayable) v. 20% in-field) - [Issues to consider: production of susceptible insects (500:1 ratio) in insecticide treated and non-insecticide treated refuges, adequacy of size, structure, and deployment of the refuge, rotation of refuge.]
ECB, CEW, SWCB
Models: development, validation, refinement of existing and new models
ECB, SWCB, CEW
Collection of Baseline Susceptibility Data and Validation of Discriminating/Diagnostic Dose
ECB, SWCB, CEW, FAW (Bt sweet corn)
Evaluation of Resistance Monitoring Techniques, e.g., discriminating v. diagnostic dose, F2 screen, sentinel plots, gene mapping
ECB, CEW, SWCB
Grower Compliance - more detailed information on refuge (%, deployment, and management), impact of non-compliance
ECB, CEW, SWCB
3. Cotton
a. Current Insect Resistance Management (IRM) Plan
The Agency granted a conditional registration in October 1995 for the Cry1Ac delta endotoxin from Bacillus thuringiensis subspecies kurstaki and the genetic material necessary for its production in cotton to control tobacco budworm (TBW), cotton bollworm (CBW), and pink bollworm (PBW).
An IRM plan for cotton has been in place since registration in October 1995. However, an amended plan was accepted in July 2000, predominately to strengthen the refuge requirements. An additional amendment was accepted in March 2001 to allow a pilot community refuge program for 2001. Below are EPA's terms and conditions of the Bt cotton plant-incorporated protectant registration for the IRM requirements as of March 2001.
• “Provide literature, information, and research results on target pest biology and ecology such as inter-field movement and behavior, the importance of development rate, survival and fecundity on non-cotton hosts of CBW, TBW, and PBW, and the effect of different hosts on the development, survival and fecundity of these pests in order to assess the significance of selected non-cotton hosts as refugia.”
• “Data evaluating the potential for cross resistance.”
IID70

Bt Plant-Incorporated Protectants October 15, 2001 Biopesticides Registration Action Document
• “Data for baseline susceptibility for PBW, CBW, and TBW. Where the information does not already exist, data must be submitted which provide baseline susceptibility and discriminating doses for these pests.”
• “Monitoring for resistance should be in specific locations in selected states which will be monitored annually at a central laboratory location, with duplicate sample collections sent to a second lab for confirmation. Monsanto will also follow up on grower, extension specialist or consultant reports of less than expected results or control failures (such as increases in damaged squares or bolls) for the target lepidopteran pests (PBW, CBW, and TBW) as well as for cabbage looper, soybean looper, saltmarsh caterpillar, cotton leafperforator and European corn borer. Monsanto must articulate in its IRM plan how resistance management strategies would be altered should resistance be detected. A preliminary report on results of this monitoring must be submitted to the Agency annually by November 1 each year and a final report will be submitted to the Agency annually by January 31 each year for the duration of the conditional registration.”
• “Annual reports are submitted to EPA on the use of Bollgard® cotton by acreage, locality (state and region, if applicable), and variety.”
• “Monsanto will develop and distribute 1) educational materials for growers, 2) the technical bulletin on the use of the product, and 3) materials on how to monitor and report resistance.”
• “Monsanto will investigate the influence of Bt cotton on secondary lepidopteran pests (cabbage looper, soybean looper, saltmarsh caterpillar cotton leafperforator and European corn borer).”
• “Monsanto must submit data relevant to the expression and degradation of the Cry1Ac endotoxin in various plant parts in correlation with susceptible doses for lepidopteran pests.”
• Growers were required to choose and implement one of the following refuge options for the 2000 growing season (Note: These were the refuge requirements for the 1996-2000 growing seasons):
“1. For every 100 acres of cotton with the Bollgard gene planted, plant 25 acres of cotton without the Bollgard gene that CAN be treated with insecticides (other than foliar Btk products) that control the tobacco budworm, cotton bollworm and pink bollworm.
IID71

Bt Plant-Incorporated Protectants October 15, 2001 Biopesticides Registration Action Document
2. For every 100 acres of cotton with the Bollgard gene planted, plant 4 acres of cotton without the Bollgard gene that CANNOT be treated with acephate, amitraz, endosulfan, methomyl, profenofos, sulprofos, synthetic pyrethroids, and/or Btk insecticides labeled for the control of tobacco budworm, cotton bollworm, and pink bollworm. This cotton must be managed (fertility, weed control and management of other pests) in a similar manner as Bollgard cotton.
NOTE: If cotton with the Bollgard gene exceeds 75% of the total amount of the cotton planted in any single county or Parish in any year, growers in that county or Parish choosing option B the following year will be required to plant the 4% refugia within one mile of the respective Bollgard cotton field. Monsanto will notify growers who are in an affected county or Parish. If EPA grants registration for cotton containing the Btk insect control protein with a similar mode of action as the Cry1Ac insect control protein to another company(s), the EPA will determine when the total cotton within a county or Parish exceeds the 75% level. This determination will be made using annual reports or planted acreage submitted by the registrants. Should EPA determine the combined acreage of cotton containing the Btk insect control protein exceeds 75%, they will inform the registrants by January 1, that the refuge must be planted within one mile of the respective Bollgard cotton or other Btk cotton fields.”
• Growers must chose one of three structural refuge options beginning with the 2001 growing season:
“1. 95:5 external structured unsprayed refugeEnsure that at least 5 acres of non-Bollgard cotton (refuge cotton) must be plantedfor every 95 acres of Bollgard cotton. This refuge may not be treated with anyinsecticide labeled for the control of tobacco budworm, cotton bollworm, or pinkbollworm. The size of the refuge must be at least 150 feet wide. The refuge mustbe managed (fertility, weed control and management of other pests) similarly toBollgard cotton. The refuge must be planted within ½ linear mile from the edgeof the Bollgard cotton field.
2. 80:20 external sprayed refugeEnsure that at least 25 acres of non-Bollgard cotton must be planted for every 100acres of Bollgard cotton. All cotton may be treated with insecticides (excluding
IID72
Bt Plant-Incorporated Protectants October 15, 2001 Biopesticides Registration Action Document
foliar B.t.k. products) labeled for control of the tobacco budworm, cotton bollworm, or pink bollworm. Ensure that a refuge is maintained within 1 linear mile (preferably within ½ mile) from the edge of the Bollgard cotton.
3. 95:5 embedded refuge Plant at least 5 acres of non-Bollgard cotton (refuge cotton) must be planted for every 95 acres of Bollgard cotton. The refuge cotton must be embedded as a contiguous block within the Bollgard cotton field. For very large fields, multiple blocks across the field may be used. For small or irregularly shaped fields, neighboring fields farmed by the same grower can be grouped into blocks to represent a larger field unit, provided the block exists within one mile squared of the Bollgard cotton and the block is at least 150 feet wide. Within the larger field unit, one of the smaller fields planted to non-Bollgard cotton may be utilized as the embedded refuge. This refuge may be treated with any insecticide (excluding foliar B.t.k. products labeled for the control of TBW, CBW, or PBW whenever the entire field is treated. The refuge may not be treated independently of the Bollgard cotton field.
For areas affected by PBW only, the refuge cotton may be planted as single rows within the Bollgard cotton field.
In cases where placement of the refuge within one mile of the Bollgard cotton would be in conflict with state seed production regulations, the grower must plant the refuge as close to the Bollgard cotton as allowed.
4. A community refuge program will be allowed as a pilot for the 2001 growing season. The community refuge for insect resistance management must meet the requirements of either the 5% unsprayed option (#1) and/or the 20% sprayed option (#2), or an appropriate combination of the two options. The 5% embedded option (#3) is not allowed to be part of the community refuge program. Monsanto must implement the 2001 community refuge pilot program as described in the Bollgard® Cotton 2001 Refuge Guide and Errata and perform the following actions.
a. Require each community refuge coordinator to submit a signed community refuge form and copy of the field map with refuge distances (to scale) or suitable scalar representation of the community refuge to Monsanto by May 15, 2001; provide EPA with a copy of the signed form and a copy of the field map (to scale) or suitable scalar representation of the community refuge;
b. Conduct two phone audits of all community refuge coordinators; c. Include the community refuge program users in the on-farm audit
IID73

Bt Plant-Incorporated Protectants October 15, 2001 Biopesticides Registration Action Document
program by Monsanto and invite EPA to accompany Monsanto on some of these visits;
d. Provide a written report to EPA at the end of the 2001 growing season on community refuge use and compliance; and
e. Conduct a review of the program by Monsanto, National Cotton Council (NCC), and EPA after the 2001 growing season.”
The chart below provides the status of the conditional IRM data requirements: (1) to submit literature and information on target pest biology and ecology including the data on the effectiveness of non-cotton hosts as potential refuges (literature review due June 1, 1996 and research data due January 31, 1998) [MRID 44042501, satisfied]
(2) research data concerning target pest biology, including data regarding the effect of different hosts on the development, survival and fecundity of these pests in order to assess the significance of selected non-cotton hosts as potential refuges [MRID 44042501, partially satisfied - some information is lacking]
(3) to develop a protocol for determining the likelihood of cross-resistance to other Bt endotoxins (due April 1, 1996) and submit data to evaluate the potential for cross-resistance (due January 31, 1998) [Submission, May 22, 1996, no MRID, satisfied]
(4) to submit a plan for a workable monitoring program (surveillance, tracking and remediation elements) (due March 1, 1996) [Submission April 2, 1996, no MRID, partially satisfied - some information is lacking]
(5) to submit an annual report of monitoring data (annually November 1 each year for preliminary results and January 31 each year for the final report for the duration of the registration) [Satisfied thus far; Submissions: Sept. 16, 1996, Nov. 5, 1996, Jan. 28, 1997(D255743), Feb. 28, 1997, June 25, 1997, July 6, 1997, and Nov. 15, 1997 (D242056); June 23, 1999 (MRID 448633-01, D259355), Jan. 28, 2000 (D263381)
(6) to submit annual use reports (annually November 1 each year for the duration of the registration [Satisfied thus far; Submissions: Nov. 5, 1996, Sept. 25, 1997 (S531144), Nov. 15, 1997 (D242056); Oct. 22, 1998 (D251290); June 23, 1999 (MRID 448633-01, D259355); Jan. 28, 2000 (MRID 450294-01, D263371)]
(7) to continue development and distribution of grower education materials [Satisfied thus far],
(8) to continue to investigate the influence of Bt cotton on secondary lepidopteran pests (cabbage looper, soybean looper, saltmarsh caterpillar, cotton leafperforator, and European corn borer) [MRID 450293-01, satisfied]
(9) to submit data relevant to the expression and degradation of the Cry1Ac endotoxin in various plant parts in correlation with susceptible doses for lepidopteran pests (due January 1, 1998) [MRID 445166-01, satisfied]
b. Analysis of the Current IRM Plans and Alternatives
The risk of TBW, CBW, and PBW developing resistance to the Cry1Ac delta-endotoxin as expressed in Bollgard® cotton has been recognized by many organizations and individuals including EPA’s Scientific Advisory Panel (SAP) and Pesticide Program Dialogue Committee (PPDC), National Cotton Council, Arizona Bt Cotton Working Group, and entomologists of the Cotton Insect Pest Management Forum. SAP reports from 1995, 1998, and 2000 have confirmed
IID74

Bt Plant-Incorporated Protectants October 15, 2001 Biopesticides Registration Action Document
that EPA’s approach and elements for an insect resistance management plan are appropriate, but that modifications may be necessary as new information becomes available. The SAP in 1998 stated that a high dose/refuge strategy should be mandated by the Agency for Bt crops, but this strategy should be developed within the current understanding of the technology and be flexible to the growers who have to implement it. The 1998 SAP defined a high dose as 25X the toxin concentration to kill susceptible individuals and the 500:1 ratio of susceptible to resistant individuals that a refuge should produce as part of a long-term insect resistance management strategy. The 2000 SAP confirmed these definitions, but stressed that the “25X” definition for high dose was provisional in nature and would be influenced by the inheritance of resistance in insects from a Bt crop in the field. EPA has agreed with the SAP’s suggestion and is using the 25X definition recommended by the SAP. Understanding the pest biology and the dose of the Bt protein are key to determining the necessary size and placement of an effective refuge. In 1999, EPA held a workshop on cotton IRM which included the registrant, academic and USDA researchers, growers, public interest groups, and other stakeholders. The workshop has helped EPA strengthen this reassessment and the IRM program for 2001.
The section below summarizes the most current understanding of the effectiveness of current IRM plans and compares the risk of resistance development in alternative IRM strategies. Additional Agency assessments of the IRM plans for Bt cotton are found in the Agency memoranda, S. Matten (OPP/BPPD) to W. Nelson (OPP/BPPD) dated July 10, 2000 and September 11, 2000, respectively. Subsequent information has been added to the Agency’s risk assessment of insect resistance development and insect resistance management plans following the October, 2000 SAP meeting and as new data became available.
1) Pest Biology
Knowledge of pest biology is critical for the development of effective IRM strategies. For example, refuges must be designed with a solid understanding of the target pest to maximize the production of susceptible insects and increase the likelihood of random mating between susceptible and potentially resistant pests.
TBW, CBW, and PBW differ in their impact on cotton on a regionally-specific basis. For example, in the Southeast, CBW is the predominant pest. In the Midsouth (Mississippi Delta), TBW is the most important pest; whereas, PBW is the only lepidopteran pest of importance in Arizona and California. However, there are many parts of the cotton belt in which TBW and CBW are both significant economic pests.
Key literature information (Caprio & Benedict 1996) regarding pest biology, adult movement, mating behavior, gene flow, and alternate hosts for TBW, CBW, and PBW has been reviewed previously by the Agency and is summarized in its 1998 White Paper on Bt plant-pesticide resistance management (U.S. EPA 1998).
IID75
Bt Plant-Incorporated Protectants October 15, 2001 Biopesticides Registration Action Document
TBW and CBW
Published data indicate that both CBW and TBW are highly mobile insects, capable of significant long distance movement, with CBW being more mobile than TBW. Mark/recapture studies have shown that CBW moths are capable of dispersing distances ranging from 0.5 km (0.3 mi.) to 160 km (99 mi.) (some migration up to 750 km (466 mi.) was also noted) (Caprio & Benedict 1996). The general pattern of migration is a northward movement, following prevailing wind patterns, with moths originating in southern overwintering sites moving to corn-growing regions in the northern U.S. and Canada. Observations based on carbon isotope studies made by Dr. Fred Gould (entomologist, North Carolina State University) indicate that CBW may also move southward from corn-growing regions back to cotton regions in the South: 48-72% of the moths collected in Louisiana and Texas cotton fields in late September and early October developed on C4 plants (e.g., corn, sorghum, other grasses) (Gould’s remarks, see U.S. EPA/USDA 1999c). If this is true (and more investigation is needed for confirmation of this effect), the result may be additional CBW exposure to Bt crops. In addition, the assumptions about CBW overwintering may need to be revisited--moths that were thought to be incapable of winter survival (and thus not a resistance threat) may indeed be moving south to suitable overwintering sites. Monsanto, in its October 11, 2000 comments to the Agency, noted that CBW moths in question may actually have come from sources other than northern corn, such as grain sorghum or C4 weeds. The general consensus of the 2000 SAP was that southward CBW migration was not proven, but that there was considerable circumstantial evidence for it. They concluded that potential southward movement should be considered in resistance management. The SAP recommended further scientific investigation of CBW migration.
The importance of movement at a localized level is important for the design of a refuge because of the need for random mating and oviposition. The 1998 SAP Subpanel noted that research has shown that substantial local population substructure can develop during the summer as a result of restricted movement of TBW and therefore deployment of a refuge is important (SAP 1998). Dr. Michael Caprio (entomologist, Mississippi State University) has indicated that there is significant localized mating among females (i.e., within the same field of pupal eclosion), although males may disperse over great distances and mate. Caprio found that 20% of the eggs following releases were located within a circle ranging from 50 to 100 m (164-328 ft.) from the release point (100-200 m (328-756 ft.) in diameter) (Caprio 2000a). On the other hand, given the long distance movements typical of CBW and the lack of high dose in Bt corn and Bt cotton hybrids, the 2000 SAP noted that refuge placement for this pest is of less importance than with other pests (e.g., TBW, PBW).
TBW and CBW are polyphagous insects, feeding on a number of grain and vegetable crops in addition to weeds and other wild hosts (Caprio & Benedict 1996). That is, there are many possible alternate hosts for CBW and TBW during the season. However, the exact utilization patterns vary with climate and cultivation practices. The complexity of movement of CBW and TBW amongst various alternate hosts requires more study before it is possible to determine
IID76

Bt Plant-Incorporated Protectants October 15, 2001 Biopesticides Registration Action Document
which alternate hosts may serve as a refuge.
By utilizing multiple hosts within the same growing season, CBW presents a challenge to Bt resistance management in that there is the potential for double exposure to Bt protein in both Bt corn and Bt cotton (potentially up to five or more generations of exposure in some regions). Cross-resistance to one or multiple Bt proteins in Bt corn and Bt cotton becomes a concern not only for insects exposed to Bt crops, but insects that move to other crops in which Bt microbial pesticides are used.
Overwintering is also an important consideration for IRM--resistant insects must survive the winter to pass their resistant genes on to future generations. In the Corn Belt, for example, CBW incapable of overwintering should not pose a resistance threat. Given that different refuge strategies may be developed based upon where CBW is a resistance threat, accurate sampling data will be needed to accurately predict suitable CBW overwintering areas.
PBW
PBW, in contrast to either CBW or TBW, is fairly restricted to cotton in the U.S. and has very limited mobility. In Arizona, only okra and wild cotton act as possible alternative hosts for PBW, but these areas where okra and wild cotton grow are very small and isolated from the cotton growing areas.
Understanding pink bollworm dispersal is essential to setting guidelines for the distance between refuges and Bt cotton. Studies of PBW in non-Bt cotton show that some adults disperse long distances, but most do not (see discussion in Tabashnik et al. 1999, Carrière et al. 2001). Tabashnik et al. (1999) measured male dispersal at a single site of 259 ha (1 mile2) containing 69% Bt cotton and 31% non-Bt cotton. The distribution of wild males caught in pheromone traps suggested that many moved at least 0.24 miles (400 m) from non-Bt cotton to Bt cotton; yet, the movement was not sufficient to achieve a random distribution of males between non-Bt and Bt cotton. Using sterile males, 66-94% dispersed 0.24 miles (400 m) or less from the release sites. Carrière et al. (2001) estimated dispersal distances of PBW by tracking movement of males and females from isolated non-Bt cotton refuges (source) into surrounding Bt cotton (sink). Carrière et al. (2001) noted that because Bt cotton acts as a deadly sink most moths flying in Bt cotton at the end of the growing season (September-November) must originate from refuges. Their results show that dispersal of females from non-Bt cotton to Bt cotton was dramatically reduced at only 0.5 miles (0.83 km) from the border of the refuge.
Together the results from both male and female dispersal experiments (Tabashnik et al. 1999, Carrière et al. 2001) and previously published data on PBW dispersal suggest that refuges for PBW should be close to Bt cotton to promote random mating of resistant and susceptible individuals. Both Tabashnik et al. (1999) and Carrière et al. (2001) recommended that the
IID77

Bt Plant-Incorporated Protectants October 15, 2001 Biopesticides Registration Action Document
distance between Bt cotton fields and refuges should be no more than 1 mile (1.67 km) to favor mating between the RR (resistant individuals) from the Bt cotton fields and the SS (susceptible) from the refuges. More precise evaluation of the effect of size and distance of refuges on the number of moths dispersing to Bt cotton fields is being conducted by Carrière and his research group in Arizona.
Based on the published research, additional information is needed to address larval and adult movement, mating behavior, ovipositional preferences, population dynamics, gene flow, survival and fecundity, fitness costs, and the use of alternate cultivated or wild hosts as refuges. Until there is further evidence that other hosts are proved to be suitable, only non-Bt cotton should be relied upon as refuge. The varied cropping systems for cotton, including local and regional differences, should also be considered. Additional research will improve the strength and reliability of an IRM plan to effectively reduce the likelihood that TBW, CBW, or PBW will become resistant to the Cry1Ac delta-endotoxin.
2) Secondary Pests
Monsanto [MRID 450293-01, January 28, 2000 submission] has analyzed data involving the influence of Bt cotton on secondary lepidopteran pests: cabbage looper (Trichoplusia ni Hubner), soybean looper (Pseudoplusia includens Walker), saltmarsh caterpillar (Estigmene acrea Drury), cotton leafperforator (Buccalatrix thurberiella Busk), and European corn borer (Ostrinia nubilalis Hubner). To look for any changes in the status of these insects the 1996-2000 Cotton Insect Loss Surveys were examined (see Williams 1996, 1997, 1998, 1999, 2000 or http://www.msstate.edu/Entomology/Cotton.html). The types of data analyzed were: acres infested, acres treated, and bales lost to these five lepidopteran species by state and state-regions. Their analysis indicates no change in the secondary status of these pests either nationally or regionally although levels of infestation may vary widely from year to year. For example, the number of acres treated for secondary lepidopteran pests remained at or below 400,000 acres since 1996 while acres treated for CBW/TBW ranged from 4.4 million acres to 6.9 million acres. However, the Cotton Insect Loss Surveys do not allow the parameters surveyed to be specified for Bollgard Bt cotton and non-Bollgard (non-Bt) acres. Further study of how Bt cotton and insect resistance management plans have impacted secondary lepidopteran pests is warranted.
3) High Dose
The 1998 and 2000 SAP Subpanels agreed that Bollgard cotton expressing Cry1Ac produces a high dose for TBW and PBW, but only a moderate dose for CBW. With CBW, 20% of more of the individuals may survive exposure to the Cry1Ac delta-endotoxin. An effective insect resistance management strategy for Bollgard® cotton must consider the differential effect of having a high dose for TBW and PBW, but only a moderate dose for CBW. The 2000 SAP Subpanel stated that for CBW, the amount of refuge in a region (i.e., percentage of Bt cotton in an area) is more important than refuge deployment on individual farms (i.e., refuge proximity
IID78

Bt Plant-Incorporated Protectants October 15, 2001 Biopesticides Registration Action Document
and structure) because of the long-distance movement of CBW and the lack of a high dose.
4) Refuge
a) General Issues
i. Influence of Bt Corn on Insect Resistance to Bt Cotton
Growing corn in cotton production areas could have a major influence of the development of H. zea resistance to Bt produced in transgenic cotton. CBW feeds on corn and then moves into cotton as the corn senesces. Bt corn that expresses the Bt protein in the ear will increase the selection pressure for evolution of CBW resistance in cotton-growing areas because several more generations of CBW carrying a resistance allele(s) will be exposed to the Bt protein. CBW may potentially be exposed to the Bt protein produced in Bt corn and Bt cotton over the course of six generations. When Bt corn and Bt cotton are grown in the same area, multiple exposure to the Bt proteins should influence the size of the refuge. The results of a spatially explicit model using corn, cotton, soybean, and wild-host patches indicate that at high market penetration of Bt cotton, the risk of resistance is high and use of Bt corn should be accompanied by large refuges (ILSI 1999). A second model predicted that the time to CBW resistance would be reduced in the presence of both Bt corn and Bt cotton (ILSI 1999). The interrelationship of Bt corn and Bt cotton on the development of CBW resistance to Bt cotton should be studied further.
ii. Factors Affecting Refuge
a. Alternate Hosts
Monsanto provided a study by Schneider and Cross (Mississippi State University) entitled Summer Survey of Tobacco Budworm and Cotton Bollworm Populations in the Delta and Hills of Mississippi: 1999 Report (Schneider & Cross 1999) that examines the relative importance of non-crop refuges (e.g., weeds and wild host plants) with respect to crop refuges (non-Bt cotton and soybean) in one county in each of the “Hills” and “Delta” cropping areas of Mississippi. In both the Delta and the Hills areas, local larval population densities of CBW and TBW were higher on Abuliton theophrasti (velvet leaf) than on Lonicera japonica (honeysuckle), and TBW densities were higher on these hosts than were densities of CBW. However, the small number of fields involved in this study make it difficult to generalize the results. Therefore, results of Schneider and Cross cannot be extended beyond the localized area in which they did the research in Mississippi. Until there are more data, alternate hosts cannot be relied upon to provide suitable numbers of susceptible TBW or CBW and non-Bt cotton may be the only viable refuge.
Dr. Nick Storer (formerly of North Carolina State University and now part of Dow Agrosciences) examined the role of soybeans in the evolution of H. zea resistance to Bt produced by transgenic corn and cotton in eastern North Carolina (personal communication, April 19,
IID79

Bt Plant-Incorporated Protectants October 15, 2001 Biopesticides Registration Action Document
2001). Using his model, soybeans provided an extra refuge primarily for the third and fourth generation. H. zea does not use soybeans when corn is an available host. For example, the model predicts that selection with 75% Bt cotton deployment and 50% soybeans is comparable with selection at 25% Bt cotton deployment without soybean for third and fourth generations of H. zea. If Bt corn deployment is high, the second generation of H. zea is more important to resistance development. Soybean will provide little value as a refuge for the second generation. Further model testing is necessary to examine how soybean influences the evolution of H. zea resistance.
Although the Agency is aware that pests such as CBW have alternate hosts, there is little, if any empirical evidence to support their inclusion as efficient refuge. This conclusion is supported by both the 1998 and 2000 SAP Subpanels (SAP 1998, 2001). The February, 1998 SAP (SAP 1998) was asked by the Agency to consider the utility of alternate hosts (for CBW) as refuge. They concluded that “until it is shown that non-cotton hosts produce enough susceptible moths to significantly delay the evolution of resistance in CBW/CEW populations exposed to moderate Bt doses, non-Bt cotton acreage must be considered the primary source of susceptible of susceptible CBW/CEW moths.” The October, 2000 SAP Subpanel was also asked by the Agency to consider the role of alternate hosts as refuge. Again, this SAP Subpanel, just as the 1998 SAP Subpanel, concluded that there was not enough empirical evidence to support alternate hosts as efficient refuge. They noted that CBW resistance models do not consider soybean as a refuge because most information indicates that it isn’t a reliable host each season. They state: “A best case scenario model would include soybean as a refuge. If there were better empirical data on soybeans, a more realistic model could be developed that accounted for the true year to year variation in the utility of soybean as a refuge” (SAP 2001). Gould and Tabashnik (1998) also indicated in their analysis of Bt cotton IRM plans “with soybean and corn, more research is needed to determine how many useful adult insects are produced per acre at different locations during several years.” Therefore, based on evidence provided to the Agency, until such time as there is sufficient empirical data that demonstrate that alternate hosts are producing insects in sufficient quantity, temporal synchrony, fitness, and proximity to the resistant insects that would be coming off Cry1Ac Bt cotton fields, then only non-Bt cotton can be used as an efficient refuge.
b. Concerns with Sprayed Refuge
Shelton et al. (2000) used Bt broccoli and diamondback moth as a model system to validate the need for a structured refuge through actual field tests. Their results indicated that a seed mix strategy is less effective at conserving susceptible alleles than a separate refuge. Shelton et al. (2000) indicated that great care should be used to ensure that refuges sprayed with highly efficacious insecticides produce adequate numbers of susceptible alleles. As Shelton et al. (2000) noted each insect/Bt crop system will need to have its own unique insect resistance management requirements.
IID80

Bt Plant-Incorporated Protectants October 15, 2001 Biopesticides Registration Action Document
Gould & Tabashnik (1998) in their evaluation of Bt cotton IRM options commented that a 20 percent external refuge that can be treated extensively with insecticidal sprays may result in almost no refuge because all of the susceptible target larvae would be killed. They cited computer simulations and small-scale experiments which indicated that the use of Bt cotton and heavily treated insecticides on the non-Bt cotton refuge may promote rapid resistance to Bt as well as to the insecticides used in the refuge. The 2000 SAP Subpanel commented that “the use of economic thresholds is better than prophylactic insecticide applications to the refuge, and any incentive that encourages a grower to avoid controlling pests on the refuge will be helpful.” They noted that “any action that results in fewer susceptible insects emerging from the refuge will accelerate the evolution of resistance.” For example, the 2000 SAP Subpanel stated that if an insecticide with 90% effectiveness is used, then the effective refuge size of a 20% refuge becomes 2%. Further research is needed on the impacts of insecticides on the refuge efficacy and the production of at least 500:1 susceptible to resistant insects in the refuge.
c. Proximity
Efforts to determine the appropriate size of refuges have relied in part on models, most of which assume that random mating occurs between adults emerging from refuges and Bt cotton (Tabashnik 1994a, 1994b, Gould 1998, Gould & Tabashnik 1998). If refuges are too far from Bt cotton, the chance for random mating is reduced which tends to accelerate the evolution of resistance (Caprio 1998). The February 1998 SAP Subpanel recommended that the Agency reexamine the current Bt cotton refuge options with regard to the distance between refuges and transgenic crops and the expected production of susceptible insects from different types of refuges. Without appropriate deployment, a refuge’s efficiency could be minimized. The October 2000 SAP Subpanel did not resolve whether the distance between Bt and non-Bt fields should be less than 1 mile or less than ½ mile. However, this distance should not differ between sprayed or unsprayed external refuges. Available TBW, CBW, and PBW dispersal data support placement of refuges at less than 1 mile (< ½ mile is even more optimal, since closer is better) from Bt fields.
TBW/CBW
TBW is a highly mobile moth (in terms of long-distance, migratory movement) as demonstrated by mark/recapture studies and from studies of genetic structure (Caprio & Benedict 1996). However, the importance of movement at a localized level is important for the design of a refuge because of the need for random mating and oviposition. The 1998 SAP Subpanel noted that research has shown that substantial local population substructure can develop during the summer as a result of restricted localized movement of TBW and therefore, deployment of a refuge is important (SAP 1998). Because of this, Gould & Tabashnik (1998) recommended that the maximum distance between Bt cotton fields and the non-Bt cotton refuge should be less than or equal to one mile.
IID81

Bt Plant-Incorporated Protectants October 15, 2001 Biopesticides Registration Action Document
Based on ovipositional patterns for CBW, Caprio (2000a) has indicated that untreated embedded refuges should be at least 100 m (328 ft.) wide to minimize the risk of rapid resistance evolution associated with source-sink dynamics (i.e., the refuge must be wide enough so that all females do not lay all of their eggs in the Bt portion of a field and close enough to the Bt portion of the field so that there can be random mating and random oviposition of adults). Caprio (personal communication, 2000b) indicates a spatial restriction for the refuge of less than one km (or 0.6 miles) may be more appropriate for CBW based on his movement studies.
CBW larvae, particularly later instars, are capable of plant-to-plant movement. For this reason, seed mixes do not appear to be viable refuge option for CBW (SAP 1998).
PBW
PBW larvae movement is limited between plants. Gould & Tabashnik (1998) recommended in-field refuges as the best approach to PBW resistance management because “they reduce or eliminate the isolation by distance that could reduce hybrid matings between susceptible adults from refuges and resistant adults from Bt cotton.” Gould (1998) states that “a within-field refuge (e.g., seed mixture or row by row mixing) would be best because of limited larval and adult movement.” Tabashnik et al. (1999) and Carrière et al. (2001) recommended that the distance between Bt cotton fields and refuges should be no more than one mile (1.67 km) to favor mating between the RR (resistant individuals) from the Bt cotton fields and the SS (susceptible) from the refuges. Therefore, PBW adult dispersal information support placement of the refuge as close to the Bt cotton fields as possible, but no more than one mile, to maximize random mating.
d. Asynchronous Development
Asynchronous emergence of susceptible moths from refuges and resistant moths from Bt cotton is another factor that affects random-mating and thus resistance management. If this happened, most of the susceptible moths might mate with each other before the resistant moths emerged which would greatly decrease the ability of the refuge to delay resistance. Laboratory studies have shown that temporal mating can potentially occur among TBW and PBW populations from non-Bt and Bt cotton, since development is delayed for resistant larvae feeding on Bt cotton (Liu et al. 1999, Peck et al. 1999). At the present time, because there are no reports of resistance to Bt cotton in the field, there is no way of verifying whether the developmental asynchrony observed in the resistant strain of PBW selected in the laboratory will hasten or slow the evolution of resistance. These results indicate there is uncertainty associated with developmental asynchrony and its effect on the high dose/refuge strategy and further research should be conducted.
Peck et al. (1999) have shown in model simulations for TBW that interactions between developmental asynchrony and season length increase uncertainty because they either hasten or slow the evolution of resistance. However, it is important to note that there is considerable overlap in generations of this insect occurring in the field, especially late in the season (Shelton
IID82

Bt Plant-Incorporated Protectants October 15, 2001 Biopesticides Registration Action Document
& Roush 1999). Asynchronous development may have either negative or positive effects on the effectiveness of the high dose/refuge strategy in the field; therefore, further study is warranted.
Adamczyk et al. (2000) found that there were clear differences in the CBW and fall armyworm survival and development when these larvae were fed Bt cotton leaves from 17 commercially available varieties. Adamczyk’s research demonstrates that current Bt cotton varieties express different levels of Cry1Ac endotoxin throughout the plant and that reproductive isolation of populations of intrinsically tolerant Lepidoptera (CBW and FAW) may occur and complicate the refuge strategies even further. This issue needs to be further evaluated. The 2000 SAP Subpanel concluded that for CBW, none of the current cultivars (Bt cotton or Bt corn) produce a high dose. The Subpanel indicated that variation among the cultivars could impact the rate of CBW adaptation, but the major problem remains that none of the cultivars produce a high dose. The Subpanel pointed out that there were CBW strains (selected in the laboratory) with 100-fold levels of resistance that have been developed in Mississippi and North Carolina.
The Subpanel also noted that variation in degree of purity of Bt seed sold could also affect resistance management. They commented that if the seed sold had a significant percentage of non-Bt expressing plants and larvae move among plants, then this could negatively impact resistance management.
e. CBW Issues
Bt cotton only produces a moderate dose for control of CBW. The dosage in Bt cotton plants is high enough to kill >80% of the CBW larvae (see discussion in EPA’s White Paper, U.S. EPA 1998). Gould (1998) noted that if a moderate dose is to be sustainable then the refuge size should be significantly larger, but some of the spatial requirements may be less strict then they are for the high dose. The 2000 SAP Subpanel agreed with Gould’s analysis for CBW that refuge size is more important than spatial requirements for the refuge. Gould & Tabashnik (1998) cited the need for very large, 30 to 50 percent, refuges to manage CBW resistance based on modeling results. With moderate dose Bt crops, “larval movement is not expected to reduce recessiveness significantly.” However, Gould (1998) also stated that wild hosts and other crops could serve as part of a larger refuge for CBW, but that we lack data on the contribution of these hosts to overall pest population size in different geographic areas.
Pyrethroid Oversprays
Because Bollgard controls only about 60% to 90% of the CBW populations, supplementary pyrethroid sprays are a common practice where CBW are prevalent. Brickle et al. (2000a) note that South Carolina growers typically make 1 to 4 pyrethroid applications to Bt cotton for supplemental control of bollworms. Because CBW is not controlled by the level of Bt produced by current varieties of Bt (Bollgard) cotton, there is an important need for information on pyrethroid and alternative chemistries for CBW control in Bt cotton.
IID83

Bt Plant-Incorporated Protectants October 15, 2001 Biopesticides Registration Action Document
Monsanto presented the argument that the use of pyrethroids in combination with Bollgard produces 99% or better control of CBW and ensures that the overall selection pressure for Bt resistance is weak and countered by other substantial pressures (Monsanto 2000). Brickle et al. (2000a, b) studied the comparative efficacy of three rates of six different insecticide chemistries against CBW in Bt cotton and non-Bt cotton: Tracer® (a spinosyn), Larvin® (a carbamate), Karate® (a pyrethroid), Pirate® (a pyrrole), Proclaim® (an avermectin), and Steward® (an oxadiazine) in a single field (random-block design with replicated treatments) near Denmark, South Carolina. Brickle et al.’s (2000a) data indicate the highest rate of Karate® was less effective on conventional cotton (probably because of a low level of pyrethroid resistance with the local bollworm population) than reduced rates of either Tracer®, Larvin®, and Steward®. In Bt cotton, the highest rate of Karate®, Larvin®, and Steward® provided control of bollworm (99%, 99%, and 95% control, respectively). Neither Pirate® nor Proclaim® were effective for bollworm control in conventional cotton, although the highest rate of Proclaim provided 90% control in Bt cotton. Data provided by Brickel et al. (2000a) indicate that Karate, Larvin, Tracer, and Steward provided better control of bollworm in Bt cotton than in conventional (non-Bt) non-irrigated cotton fields in South Carolina. Brickle et al. (2000a) indicate that bollworms collected from Bt cotton were significantly smaller than those collected from conventional cotton, but the LC50s were no different for bollworms collected from Bt cotton and non-Bt cotton. The authors hypothesized that the weakened physiological state of surviving CBW on Bt cotton may result in a synergistic relationship between the Bt protein and certain supplemental insecticides. This synergism would improve efficacy in Bt fields vs. non-Bt fields. However, Brickle et al. (2000a) do not provide any data to substantiate this synergistic relationship. There is no information from this study on how the CBW resistance rate to Bt would be impacted through the use of supplemental insecticides or whether the frequency of Bt resistance alleles would be impacted (positively or negatively) by the use of supplemental insecticides such as pyrethroids. Even if there is 99% control of the CBW coming of the Bt (Bollgard) fields, there is no evidence that the 1% surviving individuals do not have a higher or lower frequency of Bt resistance alleles. Supplemental insecticides may have a disproportionate effect on resistant versus susceptible Bt alleles. There is no mention that pyrethroid and other insecticide resistance may actually be accelerated through the use of insecticide oversprays on Bt cotton, especially if lower rates of these insecticides are used. At the same time, resistance evolution may be decreased if there is a low enough dose. Further research is needed to fully evaluate this issue. Additional information on how pyrethroids or other insecticides may affect other non-target insects (e.g., natural enemies) is also needed.
In follow-up field studies conducted by Brickle et al. (2000b), the authors evaluated the comparative efficacy of the same six insecticides (as in Brickle et al. 2000a) against the cotton bollworm in irrigated (Bamberg, South Carolina) and non-irrigated fields (Blackville, South Carolina). The previous study (Brickle et al. 2000a) was conducted on a non-irrigated field near Denmark, South Carolina. Results from Brickle et al. (2001b) indicate that lower rates of Karate-Z®, Tracer®, and Larvin® can be used to control CBW populations in non-irrigated (dryland) Bt cotton. This result is the same as it was in the previous study (Brickle et al. 2000a).
IID84
Bt Plant-Incorporated Protectants October 15, 2001 Biopesticides Registration Action Document
In contrast to the results on dryland cotton, lower rates of insecticides under irrigated conditions were not effective. The authors conclude that lower rates under irrigated conditions should not be recommended to control CBW in Bt fields. Brickle et al. (2001b) speculate that there is an interaction of water stress on endotoxin expression, but further research is necessary to understand this interaction. The authors also indicate that more detailed studies are needed to determine if the mode of entry influences the efficacy associated with these chemistries and Bt cotton.
Growers use of multiple modes of action to control a particular economic pest of concern is part of Integrated Pest Management (IPM). Therefore, it is important to understand how insecticides with different modes of action will be used on Bt and non-Bt fields and what impact bollworm survivors might have on either Bt resistance or other insecticide resistance. Based on the information presented by Brickle et al. (2000a, b), the effect of insecticide treatments to supplement Bt cotton to control CBW should be investigated further to understand the relationship of CBW survival on Bt and effective refuge size. The data are too preliminary to make any substantive conclusions.
When the 2000 SAP Subpanel was asked about the effect of insecticide oversprays on Bt cotton, it concluded that pyrethroid oversprays would not provide a high dose for control of CBW. The use of multiple modes of action, such as Bt cotton and pyrethroids, may result in high levels of overall mortality of CBW, but would not constitute a “high dose” as defined by the 1998 SAP (SAP 1998). To prevent frequent or overuse of insecticides on Bt cotton fields to control surviving CBW (because Bt cotton expresses only a moderate dose for control of CBW), the use of appropriate economic thresholds is critical. Increase in the use of pyrethroids might increase the evolution of resistance. Further study of effective economic thresholds for use of insecticides on Bt cotton fields is necessary to evaluate the implications for IRM.
North to South Movement
Dr. Fred Gould (North Carolina State University) has indicated that there is a concern for the impact of southward movement of CBW on refuge effectiveness (Gould’s comments in U.S. EPA/USDA 1999c and personal communication, June 3, 1999). According to Gould, a number of researchers believe that CBW may be feeding on corn in Mexico in the early spring and moving to cotton in the southern U.S. before moving to corn in more northern areas. If these CBW diapause in the northern areas, and all die over the winter, they pose no resistance problem. However, some indirect evidence has indicated that at least some CBW adults move from northern areas to southern cotton growing regions to overwinter. CBW that move from the north to south to overwinter could be exposed to Bt crop hosts for four generations or more. Gould has gathered data that indicated between 48-72% of the CBW in Louisiana and Texas that oviposited in cotton in August and early September developed on corn as larvae. Data collected in Texas indicated that these CBW are migrating from northern areas. While more confirmatory data are needed, preliminary data indicate that there may be additional CBW exposure to Bt
IID85

Bt Plant-Incorporated Protectants October 15, 2001 Biopesticides Registration Action Document
crops and thus more of a concern for CBW resistance development. Monsanto, in its October 11, 2000 comments to the Agency, noted that CBW moths in question may actually come from sources other than northern corn, such as grain sorghum or C4 weeds. Further scientific investigation of CBW migration is recommended to examine the impact on Bt corn and Bt cotton refuge size and placement.
The general consensus of the 2000 SAP Subpanel was that southward CBW migration was not proven, but that there was considerable circumstantial evidence for it. They concluded that potential southward movement should be considered in resistance management. The Subpanel recommended further scientific investigation of CBW migration. Given the long distance movements typical of CBW and the lack of high dose in Bt corn and Bt cotton hybrids, the 2000 SAP noted that refuge placement for this pest is of less importance than with other pests (e.g., TBW and PBW).
Estimated Frequency of Non-Recessive Bt Resistance Genes
Burd et al. (2001) have estimated the frequency of non-recessive Bt genes in CBW. Adult female CBW moths were collected from four locations in eastern North Carolina in August-October 2000. Based on previous lab studies, Burd et al. (2000) concluded that inheritance for CBW resistance to Cry1Ac was dominant or incompletely dominant. Resistant individuals, including heterozygotes, would survive when screened on a discriminating dose of the toxin. To estimate the frequency of resistance, Burd et al. assumed that heterozygote individuals would mate with homozygous susceptible individuals. Offspring would be ½ heterozygote and ½ homozygote susceptible. They assumed that if 50% of a screened line were the same size as their non-Bt control counterparts, then this would be considered to be a resistant line. A total of 583 female lines were screened on Cry1Ac diet at a discriminating dose of 5 µg toxin/ml of diet. This represented 2332 genomes because each mated female carries two of her own alleles and two from her male counterpart. One individual out of 583 screened appeared to carry a major gene for resistance to Cry1Ac. The estimated gene frequency for resistance to the Cry1Ac toxin was 1/2332 or 0.00043. Similarly, a total of 646 female lines was screened on Cry2A diet at a discriminating dose of 5 µg toxin/ml of diet. The estimated gene frequency for resistance to the Cry2A toxin was 1/2584 or 0.00039. These estimates can be used for the parameter value of the initial gene frequency of CBW resistance to Bt in resistance management models.
Resistance Monitoring Studies
Resistance monitoring studies have indicated that there is a statistically significant increase of CBW “tolerance” (not resistance) to Cry1Ac (about 10-fold) observed from 1996-1998 in South Alabama, Florida Panhandle, South Carolina, and Georgia (Sumerford et al. 1999). These results have caused increased concern over the cause of “tolerance” and whether the refuge strategies are adequate for CBW. It should be noted that tolerance refers to decreased pest susceptibility to a toxin (which may result from a number of factors), while resistance refers to a
IID86
Bt Plant-Incorporated Protectants October 15, 2001 Biopesticides Registration Action Document
genetic basis (i.e., inheritance of resistance alleles) that results in reduced susceptibility. Resistance monitoring efforts are discussed below.
f. Use of Acephate and Methyl Parathion in Unsprayed Refuges
The October 31, 1995 registration agreement does not allow the use of acephate, methyl parathion, or a number of lepidopteran control agents to be used on the 4% unsprayed refuge. In 1996, Monsanto requested that the Agency grant approval of the use of 0.5 lb ai/A acephate for control of plant bugs and stink bugs in the refuge. Monsanto supplied data and expert opinion in its January 28, 2000 submission (Monsanto 2000) that indicated that neither acephate nor methyl parathion is effective against TBW or CBW at 0.5 lb ai/A. Monsanto states that a rate of 0.5 lb ai/A is sufficient to control plant bugs, but a rate of 1.0 to 1.3 lb ai/A is required for lepidopteran control.
EPA’s science review dated October 10, 1996 concluded that use of acephate should not be permitted to preserve the integrity of the refuge (already a small percentage of a grower’s cotton acreage) to allow susceptible lepidopteran larvae to develop with minimal selection pressure. Monsanto added the use of 0.5 lb ai/A acephate or methyl parathion on the 4% refuge to their grower guides in 1997 and 1998 for the purposes of controlling plant bugs and stink bugs in the non-Bt cotton refuge, with the claim TBW, CBW, and PBW would be unaffected. The use of these two compounds was discontinued for the 2000 season pending further data from Monsanto on the effect of 0.5 lb ai/A acephate and methyl parathion on TBW, CBW, and PBW control in non-Bt cotton refuges.
Dr. Mitchell Roof, Clemson University, (expert in Monsanto’s submission) indicated that methyl parathion is very effective against stink bugs. “At the rate of 0.5 lb ai/acre, methyl parathion would have little impact on bollworms or budworms, but would be quite effective on stink bugs.” He indicates that acephate is largely ineffective against bollworms and budworms at 0.5 lb ai/A, but would be effective against thrips.
The methyl parathion label lists bollworm on the label with a use rate of 2.5 to 6 pints/acre. Budworm does not appear on the label. It is not clear from any of the information provided whether growers would use greater than the 0.5 lb a.i./rate of acephate and methyl parathion to control other insect pest complexes such as stink bugs and plant bugs. Higher rates would affect the control of TBW and CBW. Additional information could help assess whether a 0.5 lb ai/A acephate or methyl parathion will affect the production of susceptible adults in the refuge.
The 2000 SAP Subpanel pointed out that there would not be significant mortality in field population of either TBW or CBW at a 0.5 lb a.i./A rate of methyl parathion or acephate, especially for methyl parathion. The Subpanel discussed both positive and negative points associated with the use of 0.5 lb a.i./A rate of acephate and methyl parathion on “unsprayed” refuge fields. Acephate at this application rate may increase generation time in the refuge to
IID87

Bt Plant-Incorporated Protectants October 15, 2001 Biopesticides Registration Action Document
coincide with any delays in development of Bt cotton. Methyl parathion at this application rate will have no effect on CBW or TBW generation time. Both compounds will reduce beneficial insect populations and impact IPM programs that depend on the production of beneficial insects. However, controlling other insect pest populations, such as plant bugs and stink bugs, which feed on the fruit, will increase the available substrate for TBW and CBW. However, this will lead, as the SAP Subpanel noted, to earlier maturity of the refuge crop. The 2000 SAP Subpanel concluded that the positive and negative factors associated with the use of 0.5 lb a.i./A rate of methyl parathion or acephate on the “unsprayed” refuge would probably cancel themselves out. Given the evidence presented and the conclusion of the SAP, it is not expected that use of acephate or methyl parathion (at 0.5 lb a.i./A) will significantly impact refuges for Bt cotton.
g. PBW Issues
Evaluation of PBW-Resistant Colonies
Sims et al. (2001) and Patin et al. (1999) discuss the results of selection with Cry1Ac in the laboratory produced from 1997 field strains. Pink bollworm from the 1997 collections that survived concentrations of 3.2 and 10 µg Cry1Ac protein/ml were pooled into a composite strain designated AZP-R. This strain was then reared for one generation on diet containing 10 µg Cry1Ac protein/ml and tested for susceptibility to Cry1Ac. In bioassays in which Cry1Ac was added to artificial diet, the F6 generation of the resistant strain, AZP-R, was 100 to 460-fold less susceptible than the individual populations from which it was derived, based on LC50s (Patin et al. 1999). By the F14 generation, the LC50 of AZP-R was 320 µg /ml Cry1Ac versus 162 µg /ml for the F6 generation (Sims et al. 2001). These results show that by 1999, the resistance of AZP-R to Cry1Ac was approximately 200 to 900-fold, based on contrasts of LC50s with the 1997 collections. AZP-R showed a 177-fold reduction in toxicity to Cry1Ac relative to the LC50 from the pooled data from all field populations in Arizona (Patin et al. 1999). Findings presented by Patin et al. (1999) and Sims et al. (2001) clearly show that a gene or genes conferring strong PBW resistance to Cry1Ac exist in field populations.
Two different greenhouse evaluations (Liu et al. 1999, Tabashnik et al. 2000) showed that laboratory-selected resistant PBW can survive on a Bt cotton. These results are the first to show that a laboratory-selected resistant insect (PBW) can survive on a Bt crop that is grown commercially in the U.S.
Tabashnik et al. (2000) found that survival for AZP-R strain was 3.1% (28/897) on Bt cotton and 7.8% (43/551) on non-Bt cotton. Survival of the 1997-derived Safford strain was 0.12% (1/801) on Bt cotton and 7.6% (78/1027) on non-Bt cotton. These authors suspected that the one Safford survivor was homozygous for resistance based on the estimated frequency of 2.6% resistant homozygotes.
In another set of greenhouse experiments, Liu et al. (1999) looked at the genetics of laboratory-
IID88

Bt Plant-Incorporated Protectants October 15, 2001 Biopesticides Registration Action Document
selected resistance and larval development time in a second resistant strain of PBW called APHIS-98R. They found that the laboratory-selected resistance was recessive in inheritance (i.e., the resistant-susceptible heterozygotes died on the transgenic Bt cotton plants). Recessive resistance is consistent with one of the assumptions of the refuge strategy. Shelton and Roush (1999) pointed out in their recent commentary in Nature Biotechnology that in other cases in which inheritance of resistance to Bt was studied using transgenic crops that recessive inheritance was considered to be the most important factor determining the success of the refuge strategy.
Liu et al. (1999) found that resistant larvae on Bt cotton required an average of 5.7 days longer to develop than susceptible larvae on non-Bt cotton. They concluded that “this developmental asynchrony favors non-random mating that could reduce the expected benefits of the refuge strategy.” This means that because resistant insects developed more slowly than their susceptible counterparts, they may be out of phase for random mating and dilution of resistance in the field, especially late in the season.
Peck et al. (1999) have shown in computer simulations for TBW that interactions between developmental asynchrony and season length increase uncertainty because they either hasten or slow the evolution of resistance. However, there is considerable overlap in generations of this insect occurring in the field, especially late in the season (Shelton & Roush 1999). Asynchronous development may have either negative or positive effects on the effectiveness of the high dose/refuge strategy in the field; therefore, further study is warranted. The laboratory findings of Liu et al. (1999) for PBW are worth examining further under typical field conditions in Bt cotton fields. Field experiments should be conducted to measure whether susceptible adults would be present at the same time as resistant adults.
Measurements of Initial Resistant Allele Frequency
The ability to rapidly select for resistance in Bt cotton in laboratory strains derived recently from field populations of PBW (Patin et al. 1999) implies that the frequency of alleles for resistance to Cry1Ac in 1997 was higher than expected in Arizona field population of PBW. In particular, these results suggest that the allele frequency was higher than 0.001, which is typically assumed in resistance management models and was found to be the case for TBW (Gould et al. 1997). Tabashnik et al. (2000) reported that the direct and indirect estimated frequency of a recessive allele conferring resistance to Cry1Ac in strains of PBW derived from 10 Arizona cotton fields during 1997-1999. Results are summarized in Table D7.
IID89
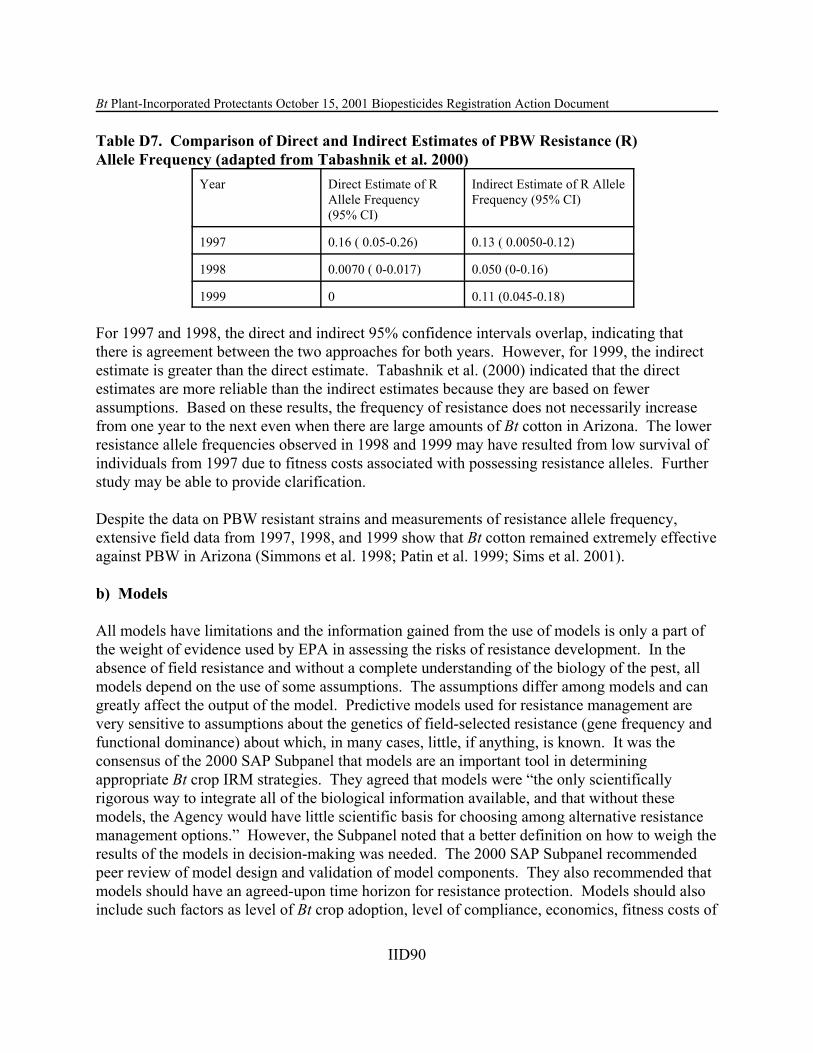
Bt Plant-Incorporated Protectants October 15, 2001 Biopesticides Registration Action Document
Table D7. Comparison of Direct and Indirect Estimates of PBW Resistance (R) Allele Frequency (adapted from Tabashnik et al. 2000)
Year Direct Estimate of R Allele Frequency (95% CI)
Indirect Estimate of R Allele Frequency (95% CI)
1997 0.16 ( 0.05-0.26) 0.13 ( 0.0050-0.12)
1998 0.0070 ( 0-0.017) 0.050 (0-0.16)
1999 0 0.11 (0.045-0.18)
For 1997 and 1998, the direct and indirect 95% confidence intervals overlap, indicating that there is agreement between the two approaches for both years. However, for 1999, the indirect estimate is greater than the direct estimate. Tabashnik et al. (2000) indicated that the direct estimates are more reliable than the indirect estimates because they are based on fewer assumptions. Based on these results, the frequency of resistance does not necessarily increase from one year to the next even when there are large amounts of Bt cotton in Arizona. The lower resistance allele frequencies observed in 1998 and 1999 may have resulted from low survival of individuals from 1997 due to fitness costs associated with possessing resistance alleles. Further study may be able to provide clarification.
Despite the data on PBW resistant strains and measurements of resistance allele frequency, extensive field data from 1997, 1998, and 1999 show that Bt cotton remained extremely effective against PBW in Arizona (Simmons et al. 1998; Patin et al. 1999; Sims et al. 2001).
b) Models
All models have limitations and the information gained from the use of models is only a part of the weight of evidence used by EPA in assessing the risks of resistance development. In the absence of field resistance and without a complete understanding of the biology of the pest, all models depend on the use of some assumptions. The assumptions differ among models and can greatly affect the output of the model. Predictive models used for resistance management are very sensitive to assumptions about the genetics of field-selected resistance (gene frequency and functional dominance) about which, in many cases, little, if anything, is known. It was the consensus of the 2000 SAP Subpanel that models are an important tool in determining appropriate Bt crop IRM strategies. They agreed that models were “the only scientifically rigorous way to integrate all of the biological information available, and that without these models, the Agency would have little scientific basis for choosing among alternative resistance management options.” However, the Subpanel noted that a better definition on how to weigh the results of the models in decision-making was needed. The 2000 SAP Subpanel recommended peer review of model design and validation of model components. They also recommended that models should have an agreed-upon time horizon for resistance protection. Models should also include such factors as level of Bt crop adoption, level of compliance, economics, fitness costs of
IID90

Bt Plant-Incorporated Protectants October 15, 2001 Biopesticides Registration Action Document
resistance, alternate hosts, spatial components, stochasticity, and pest population dynamics.
Several resistance management models used by EPA are discussed below. These models differ in their assumptions and outputs. Deterministic models have no random events. The same input will always produce the same output. Under discrete, non-random conditions, deterministic models may examine resistance evolution within a single field or several thousand fields. In contrast, stochastic, spatially-explicit models incorporate both random events and a spatial dimension. In stochastic models, a given input may produce many different outputs because some of the parameters in the model are random variables. These models can be used to look at resistance evolution in multiple fields or patches used by multiple growers (a regional approach) and consider the impact of population dynamics and population structure.
i. Gould’s Deterministic Model for TBW and CBW Resistance Management
Dr. Fred Gould, entomologist, North Carolina State University (personal communication to S. Matten, 2000) modeled the performance of several refuge scenarios (see Table D8 below). The model assumes diploid genetics, random mating, three generations per year, an initial resistance allele frequency of 0.001, does not include density dependence, and is deterministic. Gould varied the degree of mortality of susceptible larvae to account for crops with differing compatibility with the high dose concept. He also varied the degree of recessiveness of the resistance alleles. All scenarios were for external unsprayed refuge options. This model is conservative and represents a worst case approach. Results of this model point to the need for more detailed models that include population dynamics and population structure.
Table D8. Gould’s Deterministic Model for TBW and CBW Resistance Management Fitness of Bt plants
RR = (homozygous resistant fitness) ; Rr = (heterozygote fitness); rr= (homozygous susceptible fitness)
Years to Resistance Allele Frequency Reaching 0.50 for Varied Refuge Sizes (Unsprayed) (Resistance = 0.50 Allele Frequency)
4% refuge
5% refuge 10% refuge 20% refuge
Case 1: Extremely high efficacy against susceptible insects RR =1.0; Rr =0.01; rr =0.0001
5.3 6.3 11.0 22.7
Case 2: Very high efficacy against susceptible insects RR=1.0; Rr=0.01; rr=0.001
5.7 6.7 11.7 24
IID91

Bt Plant-Incorporated Protectants October 15, 2001 Biopesticides Registration Action Document
Fitness of Bt plants
RR = (homozygous resistant fitness) ; Rr = (heterozygote fitness); rr= (homozygous susceptible fitness)
Years to Resistance Allele Frequency Reaching 0.50 for Varied Refuge Sizes (Unsprayed) (Resistance = 0.50 Allele Frequency)
4% refuge
5% refuge 10% refuge 20% refuge
Case 3 [Case for TBW]: Extremely high efficacy against susceptible insects RR=1.0; Rr=0.001; rr=0.0001
12 14.7 29 62.3
Case 4 [Case for TBW]: Very high efficacy against susceptible insects RR=1.0; Rr=0.002; rr=0.001
12 14.7 28.3 61
Case 5: Moderate/high efficacy against susceptible insects RR=1.0; Rr=0.02; rr=0.01
6 7 12 23.3
Case 6 [Case appropriate for CBW]: Moderate efficacy against susceptible insects RR=1.0; Rr=0.2; rr=0.1
4 4.3 5.3 7.7
ii. Caprio’s Spatial, Stochastic Model for CBW Resistance Management
Mike Caprio, entomologist, Mississippi State University (personal communication to S. Matten, 2000b, Caprio 2001) modeled the effect of different refuge scenarios (see Table D9 below) on CBW resistance. Caprio’s model assumed that no corn was in the area, so the results are based on CBW being exposed to cotton through four generations/year. Most areas will have a substantial refuge in corn during the first two generations, so this model might represent a worst case (depending on whether or not Bt corn is growing in the area), but not an unlikely one when considering the entire cotton belt (there is not a great deal corn grown in much of the cotton belt). In the model, he assumed 5% survivorship of susceptibles, 2 X 10⁻³ initial gene frequency, and that resistance is a partially recessive trait (h = 0.1). Overwintering survival was estimated to be 25%. Dispersal associated with overwintering and the first spring generation (from non-crop hosts to cotton) was assumed to be 90%. This estimate was probably low, but was used to overcome scale limitations associated with complex simulations. The daily dispersal rate for the first two generations on crop hosts was assumed to be 80%/day. It is assumed that cotton is not a very good host during this time and CBW moves from field to field. Refuges are assumed to be in the same location each year. However, Caprio noted that this shouldn’t be a problem given the high overwintering dispersal and high dispersal during the first two generations. Wild hosts are not simulated. For the last two generations, dispersal is set at 25%/day (i.e., 25% of adults
IID92

Bt Plant-Incorporated Protectants October 15, 2001 Biopesticides Registration Action Document
leave a patch per day -- a field may consist of many patches, a patch is 10 acres). Caprio calculated that about 46% of the eggs from females emerging in the refuges are laid in the refuge. With dispersal set to 50% per day, 21% of eggs from females emerging in the refuges are laid in the refuge. This is about what Caprio estimated for refuges that are approximately 300 feet wide (67% dispersal parameter). Larval movement is ignored in this model. The number given by the model is years until 50% of the fields have resistance allele frequencies above 50%.
Table D9. Caprio’s Model for H. zea (CBW) Resistance Management Refuge Option Years to Resistance
Untreated (more like a seed mix or single row)
4% 3.46 years (+ 2 extinctions)
16% 5.3 years (+ 2 extinctions)
32% 9.5 years
Sprayed external refuges (economic threshold at 4% with 90% efficacy of
the larval population)
0% 2.2
10% 7.25
20% 10.5
30% 14.5
Embedded untreated refuges (50% Dispersal)
1.25% 8.6
2.5% 10.3
5.0% 19.2
10.0% 24.8
Embedded untreated refuges (67% Dispersal)
1.25% 7.0
2.5% 8.0
5.0% 12.0
10.0% 22.4
Caprio’s simulations for untreated refuges predict that a seed mix or single rows would not be used to effectively manage CBW resistance. To delay resistance more than 10 years, Caprio’s
IID93

Bt Plant-Incorporated Protectants October 15, 2001 Biopesticides Registration Action Document
model indicates there would have to be greater than 30% non-Bt cotton in a (untreated) seed mix. Caprio's simulations predicts that embedded (untreated) options give the greatest benefit for resistance management with the least amount of non-Bt cotton planted assuming the refuge is wide enough to create sufficient isolation between the refuges and Bt-fields. This isolation ensures that females from refuges lay enough eggs in refuges to maintain a large susceptible population in those areas. At the same time, the refuge should be close enough to the Bt portion of the field so that the increased isolation does not lead to an increase in non-random mating that could overcome the effectiveness of the non-random oviposition. Caprio's simulation suggests there must be a balance between isolation limiting source-sink effects (and delaying resistance evolution) and isolation increasing non-random mating (and hastening resistance evolution). These simulations did not consider the influence of alternate hosts, such as corn, on the development of CBW resistance to Bt. However, corn is not a major crop in the cotton areas in the Delta.
iii) Livingston’s Efficient Refuge Model
Monsanto cited in its January 28, 2000 submission, the results of an economic model first developed by Dr. Michael Livingston (formerly of Texas Tech University and now of North Carolina State University) and presented at the January 2000 Beltwide Cotton Conferences. Livingston et al. (2000a) has created an efficient Bt cotton refuge model that maximizes the present value of profits attainable by cotton producers over planning horizons of various lengths in the Louisiana cotton production region. Livingston et al.’s model seeks to maximize economics (i.e., grower profits) while achieving a socially acceptable rate of resistance evolution. This model differs from strictly biological models that predict the number of years until resistance occurs (resistance allele frequency reaches a certain level) under different refuge scenarios. These models have been revised since the January 2000 Beltwide Cotton Conferences (Livingston et al. 2001a – “Efficient Refuge Guidelines for Cotton Producers” and Livingston et al. 2001b - “Characteristics of Pyrethroid Resistance Evolution in Tobacco Budworm and Bollworm (Lepidoptera: Noctuidae) Field Populations.” The revised models will be discussed below.
Livingston et al. (2001a) derived sprayed and unsprayed refuges that maximize the present value of average profits per acre received by representative Louisiana (or mid-South) cotton producers. The economic model incorporated genetic models of Bt cotton and pyrethroid resistance evolution in TBW and CBW (Livingston et al. 2001b). Sprayed and unsprayed refuges maximize grower profitability subject to producer behavior and resistance evolution over an eleven-year planning horizon. Refuges were derived from two- through eleven-year horizons, initiated at the beginning of the 2000 growing season. The first season of Bt cotton introduction was 1996. Thus, the total time horizon covers a 15-year period from the time in which Bt cotton was first commercialized. Alternative cultivated and non-cultivated hosts for TBW and CBW were considered as part of the model.
IID94
Bt Plant-Incorporated Protectants October 15, 2001 Biopesticides Registration Action Document
Sprayed refuges were insensitive to the interest rate, pest-free yield, output price, and technology fees. Sprayed refuges increased with the time horizon and varied considerably with genetic parameters that influenced Bt resistance evolution in the TBW, but not with parameters that influenced pyrethroid resistance in either TBW or CBW. Unsprayed refuges increased with the time horizon, but less so than sprayed refuges, and were sensitive to several economic and genetic parameters.
The producer received higher profits under sprayed relative to unsprayed refuges, and average sprays were lower under unsprayed refuges. Both species became less resistant to Bt under sprayed relative to unsprayed refuges, and both species became more resistant to pyrethroids under sprayed relative to unsprayed refuges. Producer use of unsprayed refuges was not recommended under the default model.
The most important determinants of sprayed refuges were the time horizon and genetic parameters that characterized Bt resistance evolution in the TBW. In order of decreasing importance, these factors were: degree of dominance, initial resistance allele frequency, susceptible fitness, and fitness cost. If the degree of dominance is closer to 0.05, for example, producers could make five and six percent more per acre under fourteen and nine percent sprayed and unsprayed refuges over a five-year horizon (initiated at the beginning of the 2000 growing season), respectively, relative to earnings under the default degree of dominance (d = 0.1 for Bt).
Unsprayed refuges generally increased with the time horizon, but did not increase beyond 11% between the four- and eight-year horizons because pyrethroid susceptibility in the TBW was a renewable resource under the default model. The more important determinants of unsprayed refuges were, in order of decreasing importance: harvested yield per unsprayed refuge acre, output price, initial frequency, degree of dominance, the time horizon, susceptible fitness, the technology fee, interest rate, and fitness cost. The representative producer earned higher returns, used less insecticides per Bt acre, and managed Bt resistance more effectively under sprayed relative to unsprayed refuges (although average insecticide treatments were lower for unsprayed refuges).
Producer advantages of using sprayed relative to unsprayed refuges declined with harvested yield per unsprayed refuge acre. Producer use of unsprayed refuges was not recommended for producers who harvest less than 600 pounds per unsprayed refuge acre; however, use of unsprayed refuges was recommended for producers who harvest 600 pounds or more per unsprayed refuge acre.
Results of the Livingston et al. (2001a) model indicated that the wide host range of CBW had two impacts on Bt resistance evolution. First, the small proportion of the CBW in cotton during the early season increased the refuge size. Second, a significant proportion of CBW remained in non-cotton hosts even when the majority of the CBW populations were in cotton. This also
IID95

Bt Plant-Incorporated Protectants October 15, 2001 Biopesticides Registration Action Document
increased its effective refuge size. CBW inherited Bt resistance as a partially dominant trait, with d = 0.75 based on Burd et al. (2000).
All of the social costs and benefits of refuge were not incorporated into the analysis and, to the extent that the excluded costs were higher (lower) than the excluded benefits, refuge guidelines derived in the study were too high (low) from the standpoint of social efficiency. Livingston et al. (2001a) indicated the excluded costs and benefits may be estimated based on available data and that the costs and benefits should be appropriately weighted in the final outcome. Unfortunately, some of these costs and benefits will be difficult or impossible to estimate without a lot of data.
If the model is run for 5 years (which includes the end of the 9th year of commercial Bt cotton use), the sprayed refuge size would be 21% and the unsprayed refuge size would be 11% for both TBW and CBW based on average producer profits, Bt and non-Bt costs, and resistance evolution. After 11 years (which includes the end of the 15th year of commercial Bt cotton use), the model predicted that the sprayed refuge size would be 41% and the unsprayed refuge size would be 14%. A brief summary is presented below.
Table D10. Predicted efficient refuges, sprayed and unsprayed and grower profits (Adapted from Livingston et al. 2001a)
Time Horizon (T0 = 2000)
[Year 5 after 1st
commercialization]
Sprayed Refuge
Annualize Present Value Profit per
Acre
Unsprayed Refuge
Annualize Present Value Profit per
Acre
2 [thru end of 2001] 5% $269 4% $263
3 11 261 8 247
4 17 253 11 234
5 21 246 11 222
6 26 240 11 214
7 29 234 11 207
8 33 228 11 200
9 36 223 13 194
10 39 218 14 189
11 41 214 14 184
iv) Peck’s Spatial, Stochastic TBW Model
Peck et al. (1999) developed a stochastic, spatially-explicit, simulation model to examine the
IID96

Bt Plant-Incorporated Protectants October 15, 2001 Biopesticides Registration Action Document
factors that may influence the regional development of TBW resistance to Bt (Cry1Ac) produced in transgenic cotton. The model follows the fate of a meta-population of TBW arrayed in a grid representing individual agricultural fields. The region size is 25 to 1,250 fields. The model has a daily time step. The initial gene frequency (q0) is unknown, but the q0 set was to 0.03 because lower values caused extinctions of the resistance alleles due to the stochastic nature of the model or took too long for the computer simulation to run. The selection coefficients on Bt were: RR = 1, RS = 0.02, SS= 0.1. The refuge size in seed mixtures was 20% and the field-level refuge size was 20%. There was no larval movement and no mortality of moving larvae. Migration was 0.045 per generation. The initial population size in the null run was 60,000 per generation. The K (spraying threshold) was 150,000. The R0 (reproductive potential) was 9. The pesticide mortality in non-Bt fields was 90% and the daily adult mortality was 15%. Winter survival of pupae was 5%. A year occurs every 120 days. The maximum adult movement distance was three fields each day. Resistance was defined in three ways: 1) when 50% of the transgenic fields have a resistance allele frequency of >50%; 2) when 50% of the transgenic fields have reached a resistance allele frequency of >90%; and 3) when 50% of the transgenic fields reach 60% of their spraying threshold (the maximum population size a field can sustain before economic damage occurs).
Using this model, Peck et al. (1999) found that the spatial scale and the temporal pattern of refuges can have a strong effect on the development of TBW resistance to Bt cotton. Specifically, the time to resistance was significantly longer (49 years) in regions where the same fields were used as a refuge from year to year and adult movement among fields is limited. In regions where the refuge fields are changed randomly from year to year, the region develops resistance more quickly (17 years). Peck et al. (1999) concluded that it would only take a minority of growers who do not employ refuges properly to start a regional resistance problem. These authors found that 20% (sprayed) refuges did delay resistance. Peck et al. (1999) noted that a delay in larval development on Bt plants can alter the rate of resistance development to increase or decrease the rate of resistance development. They commented that designing controls to limit the overwintering potential of the last generation may be effective in slowing resistance. Exploring the interaction among parameters is very difficult with this complex model, but this type of model is useful to examine a number of challenges to managing resistance in Bt cotton (e.g., how the refuge is managed year to year) and the scale (regional level) of management of resistance. Neither the spatial scale nor temporal pattern of placement of refuges has been investigated in the field. Further study is recommended.
v) Storer’s Spatial, Stochastic CEW/CBW Model
Storer et al.’s spatial, stochastic computer model was developed to simulate the evolution of resistance in H. zea (CEW/CBW) to Bt cotton in an agroecosystem that includes both Bt corn and Bt cotton, such as eastern North Carolina (Storer et al. 1999). This model is adapted from that developed by Peck et al. (1999) for simulating resistance evolution in TBW. The model has multiple fields, each field is 10 acres, for a total of 5260 or 9000 acres modeled. The proportion
IID97

Bt Plant-Incorporated Protectants October 15, 2001 Biopesticides Registration Action Document
of region planted to corn was 55%, with the remainder planted to cotton. As a default, 75% of corn fields and 25% of cotton fields were planted to Bt varieties (other ratios were also tested). The initial frequency of resistance alleles was assumed to be 10-4 (not known). The functional dominance of resistance alleles was assumed to be 0.5 (based on Gould et al. 1995). The susceptible survival on Bt cotton was 25%. The proportion of the region as corn was 55%. The percentage adoption of Bt corn and Bt cotton was 100%.
Using this model, Storer et al. (1999) found that selection for resistance is more intense in Bt cotton fields than in Bt corn fields. For example, the R-allele frequency if 75% of cotton is Bt and 25% of corn is Bt increased more rapidly than if 25% of cotton is Bt and 75% of corn is Bt. Storer et al. (1999) concluded that the greater importance of Bt cotton with regard to resistance development was due to spraying of non-Bt cotton fields when they reached economic threshold levels which reduced the effective refuge size. The spatial distribution of transgenic and non-transgenic plantings can affect both the region-wide evolution of resistance and, especially when the on-farm refuge size is small, the resistance levels in sub-populations. Storer et al. (1999) concluded that farm-level refuge requirements are important even for a highly mobile pest such as H. zea. Once established, H. zea resistance could spread to farms in a regions that do not use Bt. Preliminary modeling work conducted by Storer showed that soybean, as an alternate host for H. zea, can slow the rate at which resistance evolves in eastern North Carolina, where soybean is planted on roughly the same number of hectares as corn and cotton combined.
c) Refuge Scenarios for Evaluation
The table below provides a comparative summary of various Bt cotton refuge scenarios which have been proposed or are currently in place.
IID98

Bt Plant-Incorporated Protectants October 15, 2001 Biopesticides Registration Action Document
Table D11. Refuge Scenarios for TBW, CBW, PBW Resistance Management Refuge Scenarios
External Unsprayed (Structured)
Embedded External Sprayed
TBW, CBW, and PBW: Required refuge for 2001 growing season [Multiple growers may use a community refuge program involving either the 5% unsprayed or 20% sprayed refuge options for the 2001 growing season.]
* Seed growers must plant the refuge within 1 mile of the Bollgard cotton and as close as possible to Bt cotton fields when there is a conflict with seed production regulations
5% external unsprayed (150 ft. wide); planted within ½ mile
5% embedded - at least 150ft. wide (approx. 50 rows); For small or irregularly shaped fields, neighboring fields farmed by the same grower can be grouped into blocks to represent a larger field unit, provided the block exists within one mile squared of the Bollgard cotton and is at least 150 ft. wide. The refuge may treated as long as the whole field(s) (Bt and non-Bt) is treated.
For PBW only, the refuge cotton may be planted as single rows within the Bollgard field.
20% planted within 1 linear mile, ½ mile preferred
TBW and CBW only: Cotton Pest Insect Management Forum
None 10% embedded refuge that is at least 300 ft wide (approx. 80-100 rows); For small or irregularly shaped fields, neighboring fields farmed by the same grower can be grouped into blocks to represent a larger field unit, provided the block exists within one mile squared of the Bollgard cotton and is at least 300 ft. wide. The refuge may be treated as long as the whole field(s) (Bt and non-Bt) is treated.
30% planted within 1 square mile area of the Bt cotton (at no point should a Bt cotton field be >1 linear mile from a non-Bt cotton refuge field)
TBW, CBW, and PBW: Gould and Tabashnik (1998)
None 16.7% embedded refuge (eight rows non-Bt cotton for every 48 rows of Bt cotton) – The non-Bt cotton should be planted in at least sets of two or more adjacent rows. The refuge may treated as long as the whole field(s) (Bt and non-Bt) is treated.
50% within 1 square mile area of the Bt cotton for TBW and CBW or immediately adjacent for PBW
IID99

Bt Plant-Incorporated Protectants October 15, 2001 Biopesticides Registration Action Document
Refuge Scenarios
External Unsprayed (Structured)
Embedded External Sprayed
PBW only: Arizona Bt Cotton Working Group
None 10% embedded refuge in which at least one row of non-Bt cotton must be planted within every six to ten rows of Bt cotton. The refuge may treated as long as the whole field(s) (Bt and non-Bt) is treated.
20% within each square mile of land (one section), non-Bt cotton should be no more than one mile from the leading edge of each Bt cotton field
PBW eradication/ suppression in California: CA Cotton Pest Control Board
0% non-Bt cotton:100% Bt Cotton -San Joaquin Valley; include Imperial and Palo Verde
None None
d) Evaluation of Refuge
EPA has used models by Gould, Caprio, Livingston, Peck, and Storer in its comparative evaluation of refuge options. Each of these models has limitations based on the assumptions in the models. Predictive models are very sensitive to assumptions about the genetics of resistance (gene frequency and functional dominance) about which little, if anything, is known. While Gould’s and Caprio’s models are more conservative than Livingston’s, Peck’s, and Storer’s models, they do provide useful comparisons of refuge options, especially sprayed and unsprayed refuge options. It is also important to remember that the predicted years are not absolute, but provide a measure of the relative success of various refuge options (in terms of predicted years to resistance). Both Gould’s and Caprio’s models assume 100% compliance and 100% adoption of Bt cotton. Both of these assumptions are not realistic based on the data. In many areas across the Cotton Belt, there is greater than 80% adoption of Bt cotton and in some cases, adoption is greater than 90%. Resistance monitoring data do not show that TBW or CBW resistance to Bt has occurred in the field. The spatial scale and temporal pattern of refuge placement should be investigated in the field. These models are useful tools for consideration in making resistance management decisions and do provide an indication that different refuge options should be considered for the long-term management of TBW, CBW, and PBW resistance to Bt.
External Unsprayed Refuge Options v. Embedded (Sprayable) Refuge Options for CBW and
IID100

Bt Plant-Incorporated Protectants October 15, 2001 Biopesticides Registration Action Document
TBW
Beginning with the 2001 growing season, EPA mandated structure and deployment requirements for the 95:5 external unsprayed refuge option, at least 150 feet wide and planted within ½ linear mile from the edge of the Bollgard cotton field, and instituted a 95:5 embedded option. These requirements addressed one of the 1998 SAP Subpanel’s concerns regarding having specific deployment of the non-Bt cotton refuge.
The 95:5 embedded option allows for a non-Bt block (or blocks if the field is very large) of at least 150 feet wide to be planted within a Bt cotton field or allows for non-Bt cotton fields to be embedded within one mile-squared of the Bt cotton fields. An embedded refuge may be treated with non-Bt insecticides only if all of the surrounding Bt cotton fields (or rows) are treated. That is, the refuge may not be treated separately from the Bt cotton fields (or rows). These requirements sought to improve the likelihood of random mating between resistant adults emerging from Bt cotton fields and susceptible adults arising from the non-Bt fields and reduce source-sink effects. They also sought to reduce potential abuse of the external “unsprayed” refuge fields.
The 2000 SAP Subpanel evaluated the technical adequacy of and grower feasibility of implementing the three refuge options: 95:5 external unsprayed refuge option, 95:5 embedded refuge option, and the 80:20 external sprayed refuge option. They agreed that the 95:5 external unsprayed refuge was the weakest refuge option, especially for management of CBW resistance based on that lack of a high dose and genetics. The strong concern of the Subpanel were that the 95:5 external unsprayed refuge was “that it is of minimal size and farmers have a history of not complying with its use.” The 2000 SAP believed that “compliance with the Agency’s requirements that the refuge cotton should be grown in an agronomically similar fashion to the Bt cotton could increase the effectiveness of refuges compared to the current situation where some of the refuge areas are under fertilized, grown on poor soils, or planted late.” The Subpanel made the general statement that the “5% external unsprayed refuge could be used if there was 100% compliance and a monitoring program was instituted that could identify resistance at a low allele frequency.” There were Panelists that did not want the 95:5 external unsprayed refuge option under any circumstances. Expanding the external refuge size to 90:10 would increase the technical level of resistance protection, perhaps as much as two-fold for TBW, but less dramatically for CBW (only 20%), but would exacerbate existing economic (e.g., yield loss), logistical, practical, agronomic management, and compliance problems already associated with the 95:5 external unsprayed refuge option. The 2000 SAP Subpanel generally believed that a real balance is needed between feasibility and use of a specific refuge plan. Based on all of the available data and models, the 95:5 or 90:10 external unsprayed refuge option would be the weakest refuge options in terms of resistance management.
Livingston et al. (2001a) derived sprayed and unsprayed refuges that maximize the present value of average profits per acre received by representative Louisiana (or mid-South) cotton producers.
IID101

Bt Plant-Incorporated Protectants October 15, 2001 Biopesticides Registration Action Document
If the model is run for 5 years (which includes the end of the 9th year of commercial Bt cotton use), the unsprayed refuge size would be 11% for both TBW and CBW based on average producer profits, Bt and non-Bt costs, and resistance evolution. After 11 years (which includes the end of the 15th year of commercial Bt cotton use), the model predicted that the unsprayed refuge size would be 14%. A brief summary is presented in Table D10.
Dr. Mike Caprio’s (Mississippi State University) simulations for untreated refuges (Table D9) show that a seed mix or single rows cannot be used effectively to manage CBW resistance. Under the conditions of this simulation, to substantially delay resistance more than 10 years, there would have to be greater than 32% non-Bt cotton in a (untreated) seed mix. Caprio's simulations predict embedded (untreated) options provide for the longest period to resistance with the least amount of non-Bt cotton planted. Under this model, dispersal and proximity dramatically affect the years of protection. The refuge must be wide enough so that all females do not lay all of their eggs in the Bt portion of a field and close enough to the Bt portion of the field so that there can be random mating and random oviposition of adults. These simulations did not consider the influence of alternate hosts, such as corn, on the development of CBW resistance to Bt and are therefore more conservative. However, there is not much corn in the Delta (an area in which Bt cotton use is very high).
The width (structure) of refuge also affects the years to resistance. Structure refers to the dimension (minimum width or number of rows) and proximity of the refuge to the Bt cotton fields. Structure of the refuge balances the advantages of increased isolation between refuges and Bt-fields in limiting source-sink effects while at the same time limiting the negative effects of non-random mating. Based on oviposition and dispersal data generated by Caprio, a refuge of 100 rows or about 300 feet is more ideal than one that is less than 300 feet wide. Increasing the width of the refuge from 150 feet to 300 feet is predicted to increase the likelihood that susceptible adult females will lay at least some of their eggs within the refuge and not within the Bt cotton fields (a “source-sink” effect). Thus, dispersal and random oviposition affect refuge size and structure needed to reduce the risk of resistance development. Resistance risk can be decreased if the width is increased from 150 feet to 300 feet, although the uncertainty is very high. Caprio’s model indicates that an approximately 300 foot wide embedded (untreated) refuge would be about 35-40% better (or about 5-7 years to resistance using the 50% dispersal scenario) than an approximately 150 foot wide embedded (untreated) refuge (using the 67% dispersal scenario) although there is considerable uncertainty (Caprio, personal communication, 2000).
IID102

Bt Plant-Incorporated Protectants October 15, 2001 Biopesticides Registration Action Document
Table D12. Comparison of Refuge Scenarios Using the Gould and Caprio Models [TableD8 and D9] for CBW Resistance Management
Refuge Scenarios Years to Resistance
External unsprayed (based on Gould model)
95:5 4.3
90:10 5.3
Embedded (based on Caprio model)
95:5 (150 ft. blocks) [67% dispersal] 12.0
95:5 (300 ft. blocks) [50% dispersal] 19.2
90:10 (150 ft. blocks) [67% dispersal] 22.4
90:10 (300 ft. blocks) [50% dispersal] 24.8
External Sprayed (based on Caprio model)
80:20 10.5
70:30 14.5 Source: EPA, based on Gould and Caprio's Models
Gould’s simulation for the case representing CBW (Case 6 in Table D8) indicates that the time to resistance would be increased from 4.3 years to 5.3 years, a 20% increase in the IRM benefit, if refuge is increased from 5% to 10%. A structured refuge in close proximity to the Bt cotton field should also increase the years to resistance. The advantage of the 95:5 or 90:10 embedded refuge is that deploying the refuge within the field improves the likelihood of random mating between susceptible and resistant individuals and random oviposition. Refuge distance requirements and minimization of treatment of the refuge will increase the likelihood of success for the high dose/refuge strategy for insect resistance management in Bt cotton. However, the size of the embedded refuge may still be too small for the long-term for management of CBW based on its genetics and lack of a high dose.
Caprio explains (personal communication, June 16, 2000) that the embedded concept was developed as a compromise between an external sprayed refuge and an external unsprayed refuge to protect the grower from yield losses and the possibility for growers to spray the refuge. Allowances have been made so that growers would be able to spray the embedded refuge when the Bt cotton was sprayed while a 95:5 external unsprayed refuge (structured or unstructured) does not. If treatment of the entire field was necessary then both susceptible and resistant individuals should have been proportionately affected (Caprio, personal communication June 16, 2000 and SAP 2001). Caprio explains that Bt cotton fields (or set of fields) with embedded refuges should be sprayed less than an external refuge. Furthermore, there is little incentive for a
IID103
Bt Plant-Incorporated Protectants October 15, 2001 Biopesticides Registration Action Document
grower using an embedded refuge to treat the narrow embedded refuge blocks when an economic threshold has not been reached in the Bt cotton portion of the field (or a set of small fields within a certain narrowly defined area).
One member of the 2000 SAP Subpanel stated that a 90:10 embedded refuge would be about two-times as effective in producing susceptible moths than the 95:5 embedded refuge (assuming equal compliance) and would help to reduce the “source-sink” effect. This same member noted that computer simulation indicates there is less difference in resistance delay between the two options for TBW than for CBW. This is because refuge size is dictated by CBW based on its genetics and the lack of a high dose for this insect. According to that SAP member, even a 90:10 embedded refuge may be inadequate for CBW. Another member of the Subpanel felt that the embedded refuge would delay TBW or CBW resistance to the Bt (Cry1Ac) endotoxin produced in Bollgard cotton better than either the external unsprayed or external sprayed refuge options.
Based on Gould’s model (see Table D8) using Case 3 and 4 for TBW, a grower could get a 2-fold resistance management benefit (i.e., more than 2 times as many years until resistance development) of deploying a 90:10 (10%) in-field (or theoretically an unsprayed external) refuge versus deploying a 95:5 (5%) unsprayed external refuge. Based on Gould’s simulation, the time to resistance would be increased from approximately 14.7 years to 28-29 years before resistance would be expected to occur. Gould & Tabashnik (1998, Figure 1 on p. 104) indicated that the level of protection of their 16.7% in-field option would be in the range of about 12 years for CBW (longer for TBW).
The major arguments against an embedded option are that it will be logistically and economically difficult to implement because of design and planting issues, growers and consultants cannot easily distinguish the Bt cotton and non-Bt cotton rows, and grower non-compliance may be increased (Andrews et al. 2000). The National Cotton Council (NCC 2000) agrees with the concerns raised by Andrews et al. (2000). Both Andrews et al. (2000) and NCC (2000) indicate that more research is needed on the embedded refuge such as the full scale field demonstration of the embedded versus external refuge being conducted this year in Louisiana. They argue that flexibility should govern how refuge is placed and that voluntary compliance is the best method. For seed producers, they argue they cannot comply with an in-field or embedded refuge option because of seed certification distance requirements (see NCC 2000 and statements made by Tom Kirby, Delta and Land Pine in U.S. EPA/USDA 1999c).
Another argument against a 90:10 embedded refuge is that, in areas that have high TBW resistance problems to pyrethroids, it will be too large for growers to afford the expected losses caused by resistant-TBW and will not fit well within the special needs of areas undergoing boll weevil eradication (Andrews et al. 2000). Planting an embedded option may be more labor (cost) intensive than planting an external refuge. Scouting embedded fields would also be an issue and new scouting practices would have to be developed. Field mapping is a necessity to distinguish Bt cotton and non-Bt cotton blocks within a single field. Unexpected damage (or
IID104

Bt Plant-Incorporated Protectants October 15, 2001 Biopesticides Registration Action Document
other performance problems) would have to be investigated very thoroughly to determine the cause.
Balancing the concerns about logistical, economic, and cultural challenges associated with in-field refuge options is the experience of consultants and growers who were able to adjust to the logistical, economic, and attitudinal challenges associated with implementing mandatory refuge options in 1996. Monsanto’s grower compliance surveys indicated that greater than 91% of all growers surveyed complied with the refuge requirements even in the first year of mandatory refuge implementation. These data indicated that cotton growers were able to adjust to planting refuge options fairly readily, although there is still some non-compliance. Second, consultants and extension entomologists changed their scouting practices for Bt cotton after the 1996 growing season because TBW/CBW were feeding lower in Bt cotton plants on blooms (blooms express lower levels of the Cry1Ac protein) than non-Bt cotton plants. In this instance, consultants and extension experts adapted scouting practices to Bt cotton.
External Unsprayed Refuge Options v. Embedded (Sprayable) Refuge Options for PBW
The 95:5 external unsprayed refuge option has new structure and distance requirements for the 2001 growing season, at least 150 feet wide and planted within ½ linear mile from the edge of the Bollgard cotton field. The 95:5 embedded option required by EPA to be implemented for the 2001 growing season allows for the non-Bt cotton to be planted as single rows for PBW resistance management. In-field refuges are seen by several researchers as the best resistance management strategies for PBW (Gould & Tabashnik 1998, Gould 2000) for the following reasons: 1) random mating between SS and RR moths is greatly facilitated; 2) grower decisions regarding placement of external refuges are no longer necessary; 3) larval movement between rows is limited; 4) Bt and non-Bt cotton grown in the same field will have more comparable phenology and will facilitate synchrony of PBW populations; 5) field trials have shown that yield is not reduced in in-field refuges relative to the cumulative areas of Bt cotton plus external refuges; and 6) insecticide use could be reduced in in-field refuges compared with external refuges.
Gould & Tabashnik (1998) proposed a 16.7% in-field option (i.e., eight rows non-Bt cotton within every 48 rows cotton) versus a 90:10 (>10%) embedded option proposed by the Arizona Bt Cotton Working Group (PBW). Gould & Tabashnik (1998) recommended blocks of eight rows of non-Bt cotton for every forty-eight rows of cotton. The non-Bt cotton may be planted in sets of two or more adjacent rows. The Arizona Bt Cotton Working Group in January 1999 recommended the use of in-field refuges of at least 10% non-Bt cotton for the Arizona cotton fields not involved in seed production. The group recommended in-field refuges of at least one row of non-Bt cotton within every six to ten rows of Bt cotton.
The major disadvantages of either the 16.7% in-field or 90:10 embedded option are related to grower feasibility, both in a logistical and economic sense. That is, growers may not be willing
IID105

Bt Plant-Incorporated Protectants October 15, 2001 Biopesticides Registration Action Document
to deploy a 90:10 versus 95:5 embedded (or in-field) refuge because of the economic costs. However, results (see below) from pilot field experiments conducted on in-field refuges in Arizona show that there are a number of economic benefits to using at least a 10% in-field refuge.
PBW do not disperse to a great extent. Both Tabashnik et al. (1999) and Carrière et al. (2001) recommended that the distance between Bt cotton fields and refuges should be no more than 1 mile (1.67 km) to favor mating between the RR (resistant individuals) from the Bt cotton fields and the SS (susceptible) from the refuges. PBW dispersal information from both papers indicates that the majority of male and female dispersal is considerably less than one mile.
Preliminary field data discussed by Carrière et al. (2001) indicate that the proportion of attacked non-Bt cotton bolls declines as the percentage of non-Bt cotton in in-field refuges decreases. As a result, these authors recommend in-field refuges of at least 10% be used for resistance management of PBW until further data are collected.
One member of the 2000 SAP Subpanel summarized the technical effectiveness and grower feasibility of each of the proposed refuge options for PBW resistance management. This member indicated that the 90:10 embedded refuge (single rows, not for seed production) was good both from a technical effectiveness and grower feasibility point-of-view. A 95:5 embedded refuge was considered to be less effective if planted as single rows. He indicated that a 90:10 external unsprayed refuge, planted within one mile, would be technically more effective than the 95:5 external unsprayed refuge, planted within one mile, but that grower adoption would be less likely for the 90:10 option.
Results of a two-year field study described in Patin et al. (1999, also MRID 448633-01) indicate that in-field refuges of one row of non-Bt cotton for each five rows of Bt cotton showed promise as an alternative effective refuge for managing PBW resistance to the Cry1Ac delta-endotoxin expressed in Bollgard® cotton. The in-field refuges allow susceptible PBW to be generated systematically throughout Bt fields and create a better opportunity for resistant individuals to randomly mate with susceptible individuals (a key for the success of any high dose/refuge strategy). The data show that there were an adequate number of adult moths produced in the internal in-field plot. In-field treatments had somewhat higher densities of large PBW larvae than did the external refuge non-Bt cotton plants. Based on two years of evaluations at Eloy, the yield of the in-field refuge plots was comparable to, or better than, the external plots. An in-field refuge would also simplify grower decisions regarding deployment of the refuge and potentially reduce non-compliance with the current external refuge strategies.
Large scale commercial replicated tests of three infield refuge planting scenarios were conducted in 1998 on 2,500 acres of cotton near Vicksburg, Arizona to compare the development of PBW infestation levels (Antilla et al. 1999). The three in-field refuge scenarios were based on different planter-box configurations: 12.5%, 16.7%, 25%. Results demonstrated that no
IID106
Bt Plant-Incorporated Protectants October 15, 2001 Biopesticides Registration Action Document
statistical differences exist between the medians of the three refuge treatments.
A second non-replicated test was conducted on Youngker Farms in Buckeye, Arizona (Antilla et al. 1999). Two fields approximately one mile apart were compared. One field had a 25% infield refuge in the form of two non-Bt rows (DPL 5415) next to six Bt rows (DPL 33B). The other field was 100% non-Bt (DPL 5415). Yields from the non-Bt rows (40% infestation rate in October) averaged 3.23 bales per acre versus 3.49 for adjacent Bt, a difference of 0.26 bales. No chemical treatments were made on this field for PBW control. There was 125 pound reduction in yield for the non-Bt field component. Using an estimate of 70 cents value per pound and prorated over 25% of the field, there was net loss of $21.87 per acre to the grower. Yields from the full field non-Bt external refuge average 3.06 bales per acre with infestation levels averaging 12.6%. This field was chemically treated 16 times for PBW control at a cost of $146.41 per acre. These results indicate that Arizona growers could gain a considerable benefit from an in-field refuge.
Based on field experiments conducted in Arizona since 1997, an embedded or in-field refuge, configured with at least one row of non-Bt cotton within every six to ten rows of Bt cotton, appears to be effective for PBW resistance management. An in-field refuge also provides growers with no yield reduction relative to the cumulative areas of Bt cotton plus external refuges.
80:20 v. 70:30 External Sprayed Refuge Options for TBW, CBW, and PBW
Beginning with the 2001 growing season, the 80:20 external sprayed refuge requirement will have a specific deployment requirement of one linear mile (½ mile preferred). The distance requirement will improve the refuge efficiency of producing susceptible moths in close proximity to putative resistant moths. The 2000 SAP Subpanel did not resolve whether the distance between Bt and non-Bt cotton fields should be less than 1 mile or less than ½ mile. However, this distance should not differ between external sprayed and external unsprayed refuge options. Based on available TBW and CBW dispersal data, a distance requirement of one linear mile (½ mile preferred) should be adequate.
Based on PBW dispersal data, both Tabashnik et al. (1999) and Carrière et al. (2001) recommended that the distance between Bt cotton fields and refuges should be no more than 1 mile (1.67 km) to favor mating between the RR (resistant individuals) from the Bt cotton fields and the SS (susceptible) from the refuges. In January 1999, the Arizona Bt Cotton Working Group recommended that the external unsprayed and external sprayed refuges be planted within 1 mile or within 1 mile2 of Bt cotton fields.
Based on computer simulations for CBW (see Caprio’s model, Table D9 and Table D12), a 30% external refuge sprayed at a 4% infestation level (90% of the larval populations is controlled) may delay resistance 30% longer relative to a 20% external sprayable refuge or approximately
IID107

Bt Plant-Incorporated Protectants October 15, 2001 Biopesticides Registration Action Document
four more years --- 10.5 years to 14.5 years. Caprio comments (personal communication to S. Matten, 2000b) that this same trend is seen for TBW and there would be an even greater number of years until resistance would occur because there is a high dose for TBW and only a moderate dose for CBW.
Livingston et al. (2001) examined both Bt and pyrethroid resistance development in an efficient refuge model that derived sprayed and unsprayed refuges that maximize the present value of average profits per acre received by representative Louisiana (or mid-South) cotton producers. If the model is run for 5 years (which includes the end of the 9th year of commercial Bt cotton use), the optimal sprayed refuge size would be 21% for both TBW and CBW based on average producer profits, Bt and non-Bt costs, and resistance evolution. After 11 years (which includes the end of the 15th year of commercial Bt cotton use), the model predicted that the optimal sprayed refuge size would be 41%. A brief summary is presented in Table D10.
Peck et al. (1999) developed a spatial, stochastic model for TBW resistance management on a regional level. Using this model, Peck et al. (1999) found that the spatial scale and the temporal pattern of refuges can have a strong effect on the development of TBW resistance to Bt cotton. Factors such as movement in early spring, reproductive potential, and initial gene frequency has a significant impact on the development of resistance. They concluded that an external 20% (sprayed) refuge can delay resistance (>20 years) especially if the refuges remain fixed year-to-year. The model predicted that it would only take a minority of growers (not defined) who do not employ refuges properly to start a regional resistance problem.
An external sprayable refuge option can be used by seed producers and non-seed producers alike. In general, an external sprayable refuge option remains a lower risk option than an external unsprayed option because there are greater economic incentives to manage the “sprayed” refuges than “unsprayed” refuges that are placed external to Bt cotton fields. There are a number of insecticides, representing several different classes of chemistry, that have been recently introduced that provide effective control of budworm and bollworm. These new materials, along with older materials, can be used in an effective system for management of insect pests in non-Bt cotton that are cost competitive with the Bt cotton system (comments by Dr. Blake Layton, Mississippi State University, in U.S. EPA/USDA 1999c). As a consequence, grower compliance has been reported to be less of an issue with the external “sprayed” refuge than with the external “unsprayed” refuge option.
Gould & Tabashnik (1998) proposed a 50% (50:50) external sprayed refuge for TBW, CBW, and PBW. These authors recommended that the refuge be deployed within one square mile of the Bt cotton fields for TBW and CBW resistance management. This same proximity recommendation was proposed by Van Duyn et al. (2000) for their 70:30 (30%) external sprayed refuge for TBW and CBW. Gould & Tabashnik (1998, Figure 1 on p. 104) indicated that the years to resistance of the external sprayed option would be in the range of about 12 years for CBW (longer for TBW).
IID108

Bt Plant-Incorporated Protectants October 15, 2001 Biopesticides Registration Action Document
Gould & Tabashnik (1998) recommended that the non-Bt cotton refuge should be planted immediately adjacent to the Bt cotton fields (or rows) for PBW resistance management. The Arizona Bt Cotton Working Group proposed that the refuge should be placed within one square mile of the Bt cotton fields and the non-Bt cotton should be no more than one mile from the leading edge of each Bt cotton field.
One member of the 2000 SAP Subpanel familiar with PBW control issues indicated that the 70:30 external sprayed refuge option (planted within one mile) was technically very good, but would have unacceptable yield losses. This member indicated that a 80:20 sprayed refuge, planted within one mile, was good both from a technical effectiveness and grower feasibility point-of-view.
The major disadvantages of the option of larger sprayed refuges are related to grower feasibility, both in a logistical and economic sense. That is, growers may not be willing to deploy a 30% or 50% external sprayed refuge versus a 20% external sprayed refuge.
Critics of increasing the external sprayed refuge size have different viewpoints. Gould has indicated (personal communication to S. Matten, 2000) that a 10% unsprayed refuge would be approximately equivalent to a 40 to 50% sprayed refuge based on the efficacy of cotton insecticides used for lepidopteran control. Therefore, Gould’s model predicts that a 40 to 50% external refuge that is treatable would approximately double the time to resistance versus a 20% external sprayed refuge --- from about 12 years to 28-29 years for TBW. As noted in Caprio’s model, a 30% sprayed refuge (versus a 20% sprayed refuge) would increase the predicted time to resistance from about 10.5 years to 14.5 years.
On the other hand, Andrews et al. (2000) and the National Cotton Council (2000) express the viewpoint that increasing the size of the refuge will reduce the likelihood for profitable cotton production in the southeastern Cotton Belt where tobacco budworm resistance to pyrethroids is high. An external sprayed refuge may potentially increase the likelihood of cotton bollworm resistance to pyrethroids as well as be less likely to fit within the special needs of areas undergoing boll weevil eradication. They also express the concern that an increase in refuge size will potentially reduce grower compliance because of the impact on grower profitability. Both TBW and CBW become more resistant to pyrethroids under sprayed relative to unsprayed refuges than to Bt based on the predictions of the Livingston et al. (2001a) efficient refuge model.
One of the 2000 SAP Subpanel members did not support a sprayed refuge because “it advocates simultaneous use of two technologies in the same time frame where one technology would normally be used...thus, Bt-acreage at the grower or community level should be limited to 50%.” Insect resistance to multiple technologies should be considered.
For an external sprayed refuge to be efficacious, a low level of susceptible TBW, CBW, or PBW
IID109
Bt Plant-Incorporated Protectants October 15, 2001 Biopesticides Registration Action Document
must survive in non-Bt cotton fields to provide a refuge benefit. The rate of resistance development to the Bt protein in TBW, CBW, or PBW can be reduced if the refuge fields are managed appropriately. Therefore, it is very important for growers to base all insecticide spray applications to the non-Bt cotton fields on scouting results and the use of specific economic thresholds. The Cooperative Extension Service publishes insect scouting guides and thresholds for cotton grown in each state. The danger of aggressive spray programs in the non-Bt cotton refuge fields is that they will not be based on proper scouting and economic thresholds; therefore, only a few caterpillars will survive and the refuge benefits would be negligible or non-existent. In addition, aggressive spray programs may increase the likelihood of resistance not only to the Bt endotoxin, but also to pyrethroid sprays (and other, new chemistries). The 2000 SAP stated that “the use of economic thresholds is better than prophylactic insecticide applications to the refuge, and any incentives that encourages a grower to avoid controlling pests on the refuge would be helpful” (SAP 2001). Based on the evidence, treatment of refuges, using specific scouting and economic thresholds, is warranted.
Community Refuge Options for TBW, CBW, or PBW
EPA approved Monsanto’s amendment on March 1, 2001 to allow for a pilot community refuge program to be implemented for the 2001 growing season. This program will allow two or more growers to share a refuge or refuges. Community refuges may be beneficial to growers with numerous small fields or some isolated fields that may impose difficulty in deploying a refuge on their own farm. It may also assist growers in being able to comply with the new refuge structure and deployment requirements instituted for the 2001 growing season. These requirements were imposed to increase the degree of random mating between resistant and susceptible adults. Because of the numerous logistical, implementation, and compliance issues associated with a community refuge program, EPA is allowing a community refuge program on a “trial” basis for the 2001 growing season. The 2001 pilot community refuge program may provide useful information on whether multiple growers are able to comply with the new refuge options that include specific deployment requirements. Monsanto reports that there will be approximately >90 community refuges (Reding 2001b). Nearly 90% of the communities have indicated they will be using the 20% external sprayed refuge. Further information will be forthcoming during and after the 2001 growing season.
EPA has mandated several conditions on the community refuge program to measure growers’ success (or lack of) in working together to implement and comply with the 5% unsprayed and/or 20% sprayed refuge requirements as a community. The pilot program is limited to the 5% unsprayed and/or 20% sprayed refuge options. Description of possible community refuge program options is provided in Monsanto’s 2001 Grower Guide. Growers participating in a community refuge program must sign a community refuge form and supply a scalar map of their community refuge to Monsanto. Monsanto has provided EPA with a copy of the signed form and a copy of the field maps for all the communities (Reading 2001). Inclusion of a field map will allow a quick review of the apparent compliance with refuge size and deployment and be a
IID110

Bt Plant-Incorporated Protectants October 15, 2001 Biopesticides Registration Action Document
simple tool in assisting Monsanto and EPA with site visits during the 2001 pilot year. Monsanto must conduct two phone audits of all community refuge coordinators including the community refuge program users in the on-farm audit program by Monsanto, and invite EPA to accompany Monsanto on some of these visits. Monsanto must also provide a written report to EPA on community refuge compliance and conduct a review of the community refuge program in conjunction with the National Cotton Council and EPA at the end of the 2001 growing season. Because this reassessment is being written prior to the conclusion of the 2001 growing season, it is not possible to evaluate the success of the pilot community refuge program. So far, Monsanto has provided EPA with information regarding the communities and a draft telephone questionnaire.
Seed Mixtures for PBW
Patin et al. (1999) referred to experiments by Watson (1995) that indicated that seed mixtures of Bt (80-90%) and non-Bt (10-20%) cotton seed were evaluated by Watson (1995) and judged to be promising. Further research would be useful to evaluate seed mixtures as a potential strategy for PBW resistance management.
Area-Wide Suppression Programs for PBW: California, West Texas, Arizona, New Mexico
PBW area-wide suppression/eradication programs for a two to three-year period may also be a consideration for those isolated areas in which PBW is a major economic concern. These areas include parts of California (San Joaquin, Imperial, Palo Verde Valleys), Arizona (Palo Verde Valley), New Mexico, and western Texas (El Paso-Trans Pecos Area). However, since PBW is also a major pest in the Mexicali and Juarez areas in Mexico, any large-scale area-wide suppression/eradication program should also involve these areas.
The Texas Boll Weevil Eradication Foundation (“The Foundation”) has initiated a PBW suppression/eradication program in 2001 (see February 13, 2001 letter from C. Allen, TX Boll Weevil Eradication Foundation to Dr. J. Andersen, OPP/BPPD). In January 1999, cotton producers in El Paso/Trans Pecos approved a referendum to initiate a two-phase boll weevil and pink bollworm eradication program on the region’s 45,000 acres of cotton. Implementation of the PBW suppression/eradication program is expected to take four years beginning with the 2001 growing season. For 2001, the Program uses the 80:20 external sprayed refuge and 95:5 embedded refuge options of the current refuge requirements for Bt cotton. In locations where the 95:5 embedded refuge is used, the Foundation has said it treats the entire field, including the refuge, with gossyplure and sterile moths. This Program will be carefully monitored. The Foundation and local grower advisory committees will be responsible for the daily program operations. USDA/APHIS experts will also provide technical support. The Foundation will provide EPA will regular updates. Program expansion in other PBW areas, Northern Mexico, New Mexico, Arizona, and Southern California, will depend on the passage of grower referenda and cooperation with Mexico.
IID111

Bt Plant-Incorporated Protectants October 15, 2001 Biopesticides Registration Action Document
The California Cotton Pest Control Board (CCPCB) has recommended consideration of a unique PBW suppression plan (see December 1, 1999 letter to EPA). This position was originally stated at the EPA/USDA Workshop on Bt Crop Resistance Management in Cotton held in Memphis, Tennessee on August 26, 1999. The CCPCB position focuses on the need for 100% Bt cotton in a specific area-wide PBW suppression program for a three-year period followed by a period without Bt cotton acreage. This plan would need to be evaluated carefully for its potential impacts on insect resistance because the CCPCB requests that the San Joaquin Valley in California be excluded from any refuge requirements.
Currently, an active regulated PBW suppression program is in place and very minimal acreage of Bt cotton is planted. However, CCPCB seeks to have the ability to plant 100 percent Bt cotton in this area if there is a serious outbreak of native moths. In this event, 100 percent Bt cotton would be accompanied by application of sterile PBW moths, active population monitoring, and other management tools already in place.
The CCPCB also would like 100% Bt cotton plantings in conjunction with expansion of PBW Control Areas into the California Southern desert areas of Imperial and Palo Verde Valleys. Currently, 96 percent Bt cotton and 4 percent non-Bt cotton refuge is planted in the Imperial and Palo Verde Valleys, in conjunction with sterile PBW moths and active populations monitoring conducted by the CCPCB. This program has been underway for three years and has resulted in dramatic PBW population reductions. However, CCPCB would like to use 100% Bt cotton in the final year of this area-wide suppression program.
Area-wide suppression/eradication programs using 100% Bt cotton may be very effective in reducing/eliminating PBW in very geographically isolated areas over a three-year period. This type of program would need coordination with Arizona because the Palo Verde Valley is partially in Arizona. This type of program would also need the involvement of Mexico because of the Mexicali Valley and the annual spring migration of PBW from Mexico to the U.S. However, an area-wide/eradication program is not a resistance management program. That is, structured refuges are designed to produce susceptible insects to mate with resistant individuals to dilute resistance. An area-wide suppression/eradication program is designed to remove an insect from a particular geographic area, not to maintain susceptible insects using a refuge. One danger of allowing 100% Bt cotton is that the only individuals that may survive would be resistant if the area-wide suppression/eradication fails. Thus, the likelihood of PBW resistance would be higher if 100% Bt cotton were planted and may occur within a couple of years if the area-wide suppression program fails.
Seed Producer Concerns
In the past, seed producers were exempt from the 96:4 external unsprayed and 80:20 external sprayed refuge requirements. Seed increase acres for 2000 are approximately 250,000 acres out of total of about 13 million acres (see Tom Kerby, Delta and Land Pine, remarks in U.S.
IID112

Bt Plant-Incorporated Protectants October 15, 2001 Biopesticides Registration Action Document
EPA/USDA 1999c). There are different isolation distances required by states (e.g., Alabama, Arkansas, Arizona, California, Mississippi, Minnesota, Texas) for producing certified seed. Arizona, for example, has about 30% of its approximately 350,000 cotton acres, planted for seed production. In general, fields or portions of fields producing Foundation or Registered seed must be isolated 1,320 feet from any other variety of a similar type or 2,640 feet plus an additional 20 buffer rows from other varieties of widely different types. Fields producing the Certified class of seed must be isolated 660 feet plus an additional 20 buffer rows from other varieties of widely different types or 20 feet from other varieties of similar types. Colored cotton must be isolated from white cotton by a distance of at least three miles. However, colored cotton may be isolated from white cotton by a distance of at least one mile, provided there is an intervening field of cotton of at least 250 feet (100 rows) wide covering the full length of the colored cotton field.
The three refuge requirements implemented for the 2001 growing season included approximately 250,000 acres of seed production. This represents a significant improvement over the current insect resistant management requirements. In particular, the 95:5 external unsprayed structured refuge and the 80:20 external sprayed refuge with distance requirements can be used by seed producers except where there are specific state limitations on seed certification distances. The 95:5 or 90:10 embedded refuge cannot be used by seed producers because of seed purity standards.
5) Monitoring
Annual resistance monitoring is a mandatory requirement of registration. Monsanto has provided EPA annual resistance monitoring reports. After five years, there is no evidence of TBW, CBW, or PBW resistance to the Cry1Ac delta endotoxin produced by Bollgard cotton cultivars under field situations. As Caprio et al. (1999) concluded, “to effectively monitor the frequency of resistance alleles in wild populations of insects, researchers must balance the concerns of statistical precision at low allelic frequencies, costs of sampling, and the organization and labor required to intensively sample many individuals or families.” To date, centralized testing facilities operated by the USDA/ARS/Southern Insect Management Research Unit for the TBW and CBW programs and by the University of Arizona/Extension Arthropod Resistance Management Laboratory for the PBW program help increase the efficiency and consistency of monitoring for insect susceptibility changes.
The February 1998 SAP Subpanel recommended a tiered approach to monitoring. In addition, the Subpanel recognized the need to evaluate large numbers of individuals from as many locations as possible. Monitoring should be focused on (but not limited to) high risk areas (i.e., those areas with concentrated acreage and high annual market penetration). At least 100 or more individuals should be collected per location with a target of at least 500-1000 individuals. Sampling locations should be selected to reflect all crop production practices and be separated to reflect distinct populations. However, there may be instances in which large sample sizes are not
IID113

Bt Plant-Incorporated Protectants October 15, 2001 Biopesticides Registration Action Document
realistic. This was also noted by the Subpanel. The October 2000 SAP Subpanel recommended that resistance monitoring should be focused in high risk areas based on market penetration information.
The results presented below indicate a reasonably well distributed number of sampling sites throughout the Cotton Belt. Although the plan for 2002 and beyond is a significant improvement, questions remain regarding the sampling plan - locations and sample size, statistical analysis, and the sensitivity of detection. The optimum amount of sampling effort required during each growing season remains unclear. An influence in the success of a resistance monitoring program is adequate financing of the testing facility and collection of samples.
a) TBW and CBW
Diagnostic doses for CBW and TBW have been developed over several years in insect control labs at Monsanto (Sims et al. 1996). The LC99 estimates for the full-length Cry1Ac protein are 6.6 µg/ml for TBW and 13322 µg/ml for CBW. The EC99 was 0.058 µg/ml for TBW and 28.8 µg/ml for CBW. Sims et al. (1996) validated the concept of a diagnostic dose in combination with a larval growth inhibition assay to unambiguously separate resistant from susceptible insects using a Cry1Ac protein resistant strain of TBW and F1 hybrids derived by crossing the resistant strain to a susceptible TBW strain. These data indicate that it may be hard to detect resistance with a simple LC50 test or to develop a simple diagnostic mortality dose. A combination of the diagnostic dose and larval growth inhibition assay seems to be the most efficient means of tracking population susceptibility, especially when the assay can be used to detect susceptibility changes in resistant heterozygotes.
Field populations of TBW and CBW from the eastern half of the U.S. Cotton Belt have been monitored from 1996 to 1999 for changes in susceptibility to the Cry1Ac proteins by Dr. Doug Sumerford, Dr. Dick Hardee, Dr. L. Adams, and Dr. W. Solomon of the USDA/ARS/SIMRU at Stoneville, Mississippi. The results of the resistance monitoring studies from 1996 to 1998 are summarized in Sumerford et al. (1999) (MRID 448633-01). Dr. Doug Sumerford provided EPA with additional resistance monitoring data for the 1999 growing season. The primary focus is on the diet overlay tests which are more reliable. The results of these bioassays are discussed below.
Monitoring efforts for CBW and TBW resistance were initiated in 1996. Eggs or larvae from CBW and TBW populations were collected from nine states. During 1997 and 1998, all field and laboratory populations of TBW and CBW were evaluated for tolerance to Cry1Ac via agar overlays containing a freeze-dried formulation of MVPII powder. The concentrations of Cry1Ac in the agar overlay were 0.05 and 5.0 :g/ml for TBW and CBW, respectively. The concentrations were based on the EC98 for the two species (Sims et al. 1996).
Results presented in Sumerford et al. (1999) indicated that there were no significant differences
IID114

Bt Plant-Incorporated Protectants October 15, 2001 Biopesticides Registration Action Document
for the percentages of <3rd instar larvae between field colonies of TBW and CBW and their respective laboratory control colonies for tests on non-toxic diet for all the tests from 1997 and 1998. However, when treated with Cry1Ac, significantly more larvae from CBW field colonies reached the 3rd instar than those from the laboratory control strain.
TBW and CBW populations from seven regions sampled in both 1997 and 1998 were pooled for analysis: Alabama, South Alabama/Florida Panhandle, Arkansas, Mississippi Delta, Georgia, South Carolina, and Texas. Results indicate that there were statistically significant regional differences in the percentage of CBW larvae $3rd instar (tolerant) after five days of feeding on Cry1Ac in 1998 (9.5%) as compared to 1997 (1.85%). The 1998 populations from southern Alabama and the panhandle of Florida were significantly more tolerant than all other regions: 20% in 1998 and 2% in 1997. Southern Alabama and the panhandle of Florida are areas where very high levels of Bt cotton were grown in 1996-1998. CBW populations from the Mississippi Delta, Georgia, South Carolina, and Alabama also showed statistically significant increases in CBW tolerance from 1997 to 1998. Results from data collected in 1999 (Sumerford 1999) indicate these same trends. There were no major changes in the tolerances of TBW larvae in the seven regions sampled, with the exception of Generation 3 from the Mississippi Delta.
Results from the Cry1Ac diet overlay tests presented in Sumerford et al. (1999) and comments by Sumerford & Hardee (2000a) indicated that CBW showed a significant decrease in susceptibility from 1997 to 1999. As noted in Sumerford et al. (1999), the measure of “tolerance” is based on a sub-lethal dose of Cry1Ac and should not be interpreted as resistance. Actual resistance is commonly defined as at least a 10-fold difference in LC50's between susceptible and resistant individuals. Results presented by Sumerford et al. indicate no evidence of field failure due to either TBW or CBW resistance. However, these results do indicate that factors may exist that allow CBW to better “tolerate” Cry1Ac in the field and “tolerance” may be increasing in field populations. The trend in decreased susceptibility for CBW from 1997 to 1999 is an area of concern and should be further investigated. Sumerford et al. (1999) concluded that the genetic basis of the detected small changes in CBW tolerance does not appear to be a major recessive gene, but the tolerance may be due to the quantitative effects of several genes with sub-lethal doses. More research is needed to determine the importance of minor genes in the development of resistance under field conditions.
While there may be entomologists who dispute the significance of the results published by Sumerford et al. (1999), the 2000 SAP Subpanel did not dismiss the CBW “tolerance,” but did indicate that the data are preliminary and are limited because of flaws in the experimental design necessary to make strong scientific statements. The 2000 SAP Subpanel noted that the Sumerford data are an indication that more research needs to be focused in the “problem areas.” The greatest concern with the data were the small sample sizes which could bias the results either way. The monitoring results presented by Sumerford et al. are not conclusive enough to warrant an increase in refuge size at this point in time, but they do raise concerns that should be more fully investigated. Continuation and/or increases in resistance monitoring can address this
IID115

Bt Plant-Incorporated Protectants October 15, 2001 Biopesticides Registration Action Document
need.
As noted above, there were limitations to the interpretation of the 1997-1999 resistance monitoring data for TBW and CBW based on the sampling strategy. The basic problems were two-fold: sampling was variable and sample size was inadequate. To remedy these two areas of concern, Sumerford & Hardee (2000a) indicated that they would conduct a more extensive resistance monitoring program for the year 2000. This program was to have a uniform collection protocol, increased sample size per location, and use, in part, a more sensitive monitoring technique, F2 screen. Implementation of this type of program would improve interpretation, accuracy, and precision of monitoring results and address some of the 1998 SAP Subpanel’s concerns stated above.
In 2000, drought conditions in the southern U.S. made it difficult to obtain large populations of CBW. Therefore, the 2000 TBW and CBW resistance monitoring program did not provide much data to be analyzed because of insufficient TBW and CBW populations. Results from the 2000 growing season provided by Drs. Doug Sumerford and Dick Hardee, USDA/ARS/SIMRU, (note dated January 4, 2001 “Summary of 2000 Bt Resistance Monitoring as of 4 January 2001") indicated that there was no significant pattern of Cry1Ac resistance in the larval collections of CBW (9 colonies from 5 states which produced sufficient numbers of individuals for testing). There was also no significant pattern of Cry1Ac resistance in the larval collections of TBW (11 colonies from 2 states which produced sufficient numbers of individuals for testing). However, these data are not sufficient to make any definitive conclusions.
Sumerford (personal communication, 2001a) used family analysis (prepared F1 (N=164) families and F2 (N=164) familes) to look for variation in the performance of full-sib families of CBW feeding on diet containing Cry1Ac during the summer of 2000. These families were generated from males collected from the Mississippi-Yazoo Delta. The larval weights of families resulting from field-collected males was significantly greater than the larval weights of families created from males of the susceptible laboratory colony. Based on these preliminary results, Sumerford’s group plans to dedicate more effort to examinations of the F2 families of CBW during the next three years beginning with the 2001 growing season.
Sumerford’s approach is a modification of the F2 screen developed by Andow et al. (1998). Instead of mated females collected from the field, males are collected from the field and then are crossed with susceptible, laboratory females by placing one- field-collected male with one laboratory female (about 100 to 600 per location). This allows males to be easily collected by pheromone traps from many locations and more control of matings for work with DNA markers and consequent linkage analysis of Bt-related traits. The major disadvantage is that field-collected males will only represent sampling of two haplotypes vs. four haplotypes represented by mated females. In addition, the genetic variability for Bt resistance among females within the susceptible laboratory colony must also be considered. Sumerford also creates the F2 families via individual, paired matings of F1 individuals for each family, in addition to the mass matings
IID116

Bt Plant-Incorporated Protectants October 15, 2001 Biopesticides Registration Action Document
of F1 individuals used by Andow et al. (1998). Individual, paired matings allow one to know how many and which individuals are creating the F2 families, although the disadvantage is that paired matings are labor intensive. Multiple F2 sib matings per F1 family allows a better examination of segregation patterns of potential resistance alleles. This is especially important to the analysis of dominant DNA markers (e.g., AFLP markers).
The goal in 2001 is to conduct systematic collections of CBW and TBW adults and larvae from 10 locations (primarily agricultural research stations) in 8 states (2 in Texas, 1 in Louisiana, 1 in Arkansas, 2 in Mississippi, 1 in Alabama, 1 in Florida, 1 in South Carolina, and 1 in Virginia) during the peak flights of July August, and September, in addition to collections submitted voluntarily to obtain sufficient samples for testing. Individual males (100 to 600 per location) will mated to individual females from a susceptible lab colony to create the F1 families. F1 eggs are collected from each paired mating for at least two egg dates. Upon hatching, 120 to 240 F1 individuals are placed on non-Cry1Ac diet. F1 pupae are harvested and divided into two groups: 1) individuals sib-mated via single pair matings and 2) individuals sib-mated via mass rearing (>20 individuals in a single, quart-size mating container). Two egg dates from each F2 single-pair mating and each F2 mass-mated group are tested on non-Cry1Ac and Cry1Ac diet. For each CBW F2 family, larvae are exposed to Cry1Ac for 7 days (LC75 for the laboratory colony) and weights are taken for larvae after 7d of exposure to the EC90 dose of Cry1Ac. After 7 days of exposure to diets, living larvae are transferred to fresh, non-Cry1Ac diet to complete larval development. The modified-F2 screen will also be used for TBW except that the Cry1Ac doses will be the LC75 for susceptible, laboratory colony, and EC98 for the growth-inhibition assay. Sixty-four individuals per egg date are tested on Cry1Ac diet. When F2 families are tested, the laboratory colony is also tested and an odds-ratio is calculated to compare the relative survivorship of F2 families and mass-mated groups to the control colony. For F2 families that show great survivorship, then a confirmatory process (for resistance) will be initiated by testing F3 individuals via the diagnostic dose and also via dose response assays. The range of doses will vary between 0 and 1000 micrograms/ml Cry1Ac.
Five days after pupation, each individual from non-Cry1Ac and Cry1Ac diets will be frozen and preserved at -80°C so that their DNA may be extracted for the purpose of developing marker linkage maps using random fragments of DNA. Sumerford’s group is beginning the mapping work with AFLPs. The goal with the AFLP markers is to look for significant, statistical associations between marker phenotypes exhibiting Mendelian segregation and Bt-resistance traits to find the relative positioning of resistance factors in the genomes of CBW and TBW. Signficant associations suggest that the regions of the genome linked to the AFLP markers contain an allele(s) affecting Cry1Ac resistance. AFLP-analysis will also help detect new loci associated with Bt resistance that may not have been previously reported. Family-based analysis of the performance of Cry2Ab and Cry1Ac is also planned for F2 families of CBW and TBW. This will also allow one to look at the genetic correlations for resistance to the two toxins. If, Sumerford finds alleles conferring Bt resistance, then these alleles can be isolated in F2 families, mapped to the region of the CBW genome, and then gene(s) conferring resistance can be cloned.
IID117

Bt Plant-Incorporated Protectants October 15, 2001 Biopesticides Registration Action Document
Sumerford’s group also plans to test the PCR primers developed by Gahan et al. (2001) for the YHD-2 resistance factor isolated from a laboratory-selected resistant colony of TBW, YHD-2 on field-collections of TBW. The Gahan et al.-identified DNA marker is one of many possible markers that could be used to detect resistance alleles associated with Bt (Cry1Ac) in TBW. That is, there could be many different possible mutations that could lead to Cry1Ac-resistance in TBW.
Collectively, the resistance monitoring work proposed for 2001 and beyond by Sumerford (USDA/ARS/SIMRU) will strengthen the current resistance monitoring program for TBW and CBW. However, increasing the sampling locations from ten to 20 would greatly improve the probability of detecting resistant individuals (Sumerford, personal communication, 2001b). Additionally, the resistance monitoring program should include sampling at multiple sites in Georgia, North Carolina, and western Tennessee, areas not currently included in the existing resistance monitoring program. Many counties in these areas have a high adoption (>60%) of Bt cotton. Additional sites should be included in Florida, Alabama, and South Carolina in areas in which there has been a history of high adoption. The probability of not sampling an individual male that contains at least one resistance allele across the entire Cotton Belt would decrease (see Table below). As shown in the Table below, if the number of F2 families is increased to 300, then the odds of sampling resistant individuals for 10 locations would be estimated to be 99.75% and for 20 locations would be estimated to be 99.94%. The Agency will continue to work closely with USDA/ARS/SIMRU on the resistance monitoring program for TBW and CBW.
Table D13. Probability of not sampling an individual male that contains at least one resistance allele across the entire cotton belt. (Sumerford, personal communication, 2001b)
# Families Tested Per Location
# Locations 10 20 40
100 (81.9%/Location) 300 (54.9%/Location) 500 (36.8%/Location)
13.5% 1.8% 0.03% 0.25% 0.06% <0.01%
<0.01% <0.01% <0.01% The allelic frequency is 0.001 and sampling at each site is assumed to be independent of other sites. These estimates also assume the allelic frequency is uniformly distributed across the cotton belt.
b) PBW
Arizona has conducted a statewide monitoring of PBW susceptibility to Cry1Ac from 1996 to present. The results from 1997 and 1998 were summarized in Patin et al. (1999) (MRID 448633-01). Patin et al. (1999) reported that there were no major decreases in susceptibility of field populations to Cry1Ac in 1996 and 1997. The LC50 values differed <5-fold between the seven populations evaluated and ranged from 0.35 to 1.7 µg Cry1Ac/ml. The susceptible reference population, APHIS-S, had an LC50 of 0.53 µg Cry1Ac/ml.
Sims et al. (2001) evaluated the susceptibility of PBW to Cry1Ac from 1997 to 1999. The mean corrected mortality in 1 µg/ml Cry1Ac assays was 52.3% in 1997, 90.6% in 1998, and 97.9% in 1999. Mean corrected mortality in bioassays of 10 µg/ml was 94.5% in 1997, 99.8% in 1998,
IID118

Bt Plant-Incorporated Protectants October 15, 2001 Biopesticides Registration Action Document
and 100% in 1999. Results from 1997 to 1999 show no evidence of reduced susceptibility of field populations of PBW to Cry1Ac. However, a 3.3-increase in larvae per boll surviving to $third instar in Bt cotton in 1999 was observed relative to 1998 (Dennehy et al. 2000a). One panelist from the 2000 SAP Subpanel indicated that better statistical methods need to be developed.
Based on the results of extensive field monitoring for resistance in Arizona, the susceptibility of PBW to Cry1Ac in the field appears to remain unchanged over time. However, there are resistant genes in Arizona PBW populations that confer high levels of resistance to Cry1Ac. In addition, the frequency of alleles for resistance to Cry1Ac in 1997 was higher than expected in Arizona. New PBW refuge options may prove to be more effective in reducing the risk of resistance development. In addition, the PBW resistance monitoring program would be more effective at finding resistance before it became widespread if the entire geographic areas in which PBW is an economic pest (e.g., parts of New Mexico, California, and Texas) is part of the program.
c) Summary
As part of the mandatory terms and conditions of the Bt cotton plant-incorporated protectant registration, Monsanto is required to submit monitoring data on the susceptibility of field-collected insect pests to Cry1Ac. No effects, outside the normal ranges of susceptibility to Cry1Ac have been reported for the tobacco budworm or pink bollworm. The cotton bollworm (also known as the corn earworm), however, has a natural tolerance to the Cry1Ac protein. Some degree of increased tolerance (not resistance) to the Cry1Ac protein found in Bt cotton in CBW populations from South Alabama, the Mississippi Delta, Georgia, the Florida Panhandle, and South Carolina has been reported based on laboratory bioassays during the three-year period from 1996 to 1998. However, as discussed above, increased tolerance should not be interpreted as resistance. There is no evidence of field failure of Bt cotton due to either TBW or CBW resistance. These results, however, do indicate that factors selecting for CBW resistance may already be increasing in the field and that continued monitoring and further analysis is necessary. The Agency will continue its close scrutiny regarding the susceptibility of CBW to the Cry1Ac protein. Sampling and statistical rigor should be improved.
6) Remedial Action Plans
Remedial action plans have the potential to be useful as a mitigation measure, should pests develop resistance to Bt cotton. EPA required a remedial action plan if there were either suspected or confirmed incidents of insect resistance as part of the terms and conditions of registration. Monsanto is required to instruct customers to contact the company regarding unexpected levels of TBW, CBW, or PBW damage or if resistance is suspected. Monsanto is to investigate and identify the cause of such damage. Based on these investigations, appropriate remedial action is required to mitigate resistance. Resistance monitoring will be intensified in
IID119

Bt Plant-Incorporated Protectants October 15, 2001 Biopesticides Registration Action Document
instances of suspected or confirmed resistance. Any confirmed incidents of resistance are required to be reported to the EPA under the terms and conditions of the registration as well as under FIFRA section 6(a)(2). Monsanto has instructed its customers to have regular surveillance programs and report any unexpected levels of TBW, CBW, and PBW damage to them and to their local extension agents. Remedial actions include: informing customers and extension agents in the affected areas of resistance problems, implementing alternative means to reduce or control the resistant populations, increasing monitoring in the affected areas, modifying refuges in the affected areas, and ceasing sales in the affected and bordering counties. Industry cooperation with extension and academic entomologists and consultants is considered important in communicating definitions of “unexpected damage” and appropriate remedial action.
The February 1998 SAP concluded that the 1995 remedial action plans “devised by EPA provide a framework for further refinement. The Subpanel recommended that the current remedial action plans be further defined and refined on a regional and crop-specific basis (SAP 1998).”
The October 2000 SAP Subpanel pointed out that there are two types of remedial action responses to be taken. The first approach is to reduce the selective advantage of the resistance allele by increasing mortality or reducing fecundity of resistant types in the Bt field. The second approach is to modify the mating system so that fewer resistance alleles are passed on to future generations. There was also discussion on the time frame in which remedial actions could and should be implemented. There could be considerable time lost prior to implementation of remedial actions because of the complexity of a multiple stakeholder process. One panel member commented that the time to implement a remedial action plant may take at least two years so increasing the refuge size may be necessary during this two year period. The SAP recommended that all remedial actions be based on the concept of using a Bt remedial action zone. The SAP Subpanel thought that a remedial action plan with a goal of eradication would be extremely costly and ultimately, impractical. Rather, the SAP Subpanel thought that a remedial action plan with a goal to slow the spread of the resistance gene would be more practical.
They outlined a general five-step remedial action plan. This plan would include the following:
! Education of the growers/crop consultant for any changes in level of control; ! Monitoring for changes in plant damage, insect susceptibility and/or allele
frequency. Validate resistance. Alternative strategies should be implemented in a well-defined remedial action area. Regional registration should be pursued until further clarification and a remedial action plan is put into place;
! Sales restrictions in the remedial action area until the Agency has data to indicate that returning it to market would have more benefit than risk. The stability of resistance would need to known;
! Document the success of the remedial actions and continue monitoring the pest population;
! Determine the cause of the resistance. Document compliance efforts that growers
IID120

Bt Plant-Incorporated Protectants October 15, 2001 Biopesticides Registration Action Document
undertook prior to resistance.
To address the concerns of the 1998 SAP Subpanel’s recommendations, the Arizona Bt Cotton Working Group developed a draft remedial action plan in October 1998 to address PBW resistance and finalized it in April 2000. The Arizona Bt Cotton Working Group remedial action plan is quite detailed and addresses the regional specific issues associated with PBW resistance (ABCWG 2000, Carrière et al. 2001). The remedial action plan includes a definition of putative resistance and verified resistance.
As part of the development of Arizona Bt Cotton remedial action plan, the Arizona Bt Cotton Rapid Response Team, led by the Arizona Cotton Research and Protection Council, was formed to investigate field reports of putative resistance and forward putatively resistant populations to the University of Arizona’s Extension Arthropod Resistance Management Laboratory (EARML) laboratory for testing susceptibility to Cry1Ac. The Rapid Response Team has documented no “in-field” resistance events since it was instituted. The basic components of the remedial action plan are summarized below:
! Verify resistance event. A resistance event becomes verified if a sample of 2000 cotton bolls yields >3% large pink bollworm larvae, pupae, or exit holes; if the standardized laboratory bioassays (Patin et al. 1999) demonstrate that resistance has a genetic basis; and if ELISA tests for the Bt endotoxin Cry1Ac provide a positive response for 25 bolls from plants where the pink bollworm larvae survived.
! Voluntary immediate actions are taken by growers to suppress a verified resistant PBW population. These include use of insecticides, sterile moth release, accelerated harvest, destruction of crop, and actions to reduce overwintering populations.
! Reconsideration of the resistance management plan for PBW is triggered by a resistance event. For example, use of larger refuge will be recommended for the next year.
! Bt cotton fields near the reported resistance event are sampled to determine the size of the affected area. A Bt resistance remedial action zone is defined based on the affected area. If resistant populations are found in more than three townships, the whole county is declared a Bt resistance remedial action zone. The remedial action zone should include all sections of land falling within six miles of the perimeter of the section(s) of land in which verified/reportable resistance occurred.
! No Bt cotton can be planted in the Bt remedial action zone, and measures to suppress PBW populations are implemented until bioassays demonstrate that the frequency of resistant individuals has declined to acceptable levels. (See Carrière et al. 2001 and Dennehy’s remarks found in U.S. EPA 1999c).
IID121

Bt Plant-Incorporated Protectants October 15, 2001 Biopesticides Registration Action Document
Sumerford & Hardee (2000b) have developed a plan to investigate “problem fields,” where growers experience unusual TBW and/or CBW damage in Bollgard fields beginning with the 2000 growing season. Their plan will test progeny from problem fields, use a sublethal diagnostic concentration, and dose-response assay to see if the isolated population fall outside the normal susceptibility parameters determined by baseline data.
Monsanto submitted a remedial action plan for instances of “suspected” and/or “confirmed” TBW and CBW resistance in its public comments submitted to the Agency on October 11, 2000. The Agency reviewed this plan and found that it had many useful elements in which a more detailed remedial action plan could be developed. However, the submitted plan did not call for immediate suspension of sales in areas in which there is “confirmed” resistance and did not provide an explicit definition of “confirmed” resistance. Further revisions to Monsanto’s submitted should be considered. The Agency will consider Monsanto’s plan as it develops a more detailed plan for TBW and CBW.
The 2000 SAP Subpanel thought the Arizona Bt Cotton Working Group’s plan for PBW remedial action was a good model to use for a detailed remedial action plan for TBW and CBW remedial action. Just as did the 1998 SAP Subpanel, the 2000 SAP Subpanel also suggested that regional working groups be formed to develop remedial action plans. One of the most important parts of a regional remedial action plan is immediate and coordinated action to manage insect resistance in affected areas such as those remedial actions performed by the Arizona Rapid Response Team. Also important would be having a “Bt remedial action zone” (rather than just county-wide) where no Bt cotton is planted in an area where resistance has developed until such time as insect bioassays demonstrate that the frequency of resistance has declined to acceptable levels.
7) Cross-Resistance
As discussed in Section D.2.b.6) above, cross-resistance is an area of major concern for resistance management and poses risks to both transgenic Bt crops and microbial Bt insecticides. Discussions of cross-resistance are complicated due to the fact that the exact nature and genetics of Bt resistance are not fully understood. Resistance may vary substantially from pest to pest, adding to the unpredictability of the system. Cross-resistance occurs when a pest becomes resistant to one Bt protein, which then allows the pest to resist other, separate Bt proteins. Some pests of cotton are also pests of other crops for which Bt transgenic varieties or microbial Bt insecticides are available (e.g., CBW on cotton, fall armyworm (Spodoptera frugiperda) on tomato). Cross-resistance also poses a risk to pyramid strategies, in which multiple proteins are deployed simultaneously in the same hybrid. However, the development of cross-resistance has not been shown to occur in insect pests exposed in the field to Bt crops producing different Bt proteins.
Regarding binding sites, cross-resistance may result if two proteins share the same binding site
IID122
Bt Plant-Incorporated Protectants October 15, 2001 Biopesticides Registration Action Document
(receptor) in the insect midgut. Therefore, if exposure to one Bt protein results in a modification of the receptor, other proteins sharing this site could be affected as well. An example of a possible shared binding site resulting in cross-resistance was observed with TBW. In this case, a laboratory strain of TBW selected for resistance to Cry1Ac were also found to be resistant to the Cry1Aa, Cry1Ab, and Cry1F proteins (Gould et al. 1995).
The complexity of cross-resistance within a single species or different species is demonstrated by a wealth of experimental evidence. Examples involving TBW are discussed below. Gould et al. (1995) selected a tobacco budworm strain (YHD2) for a high level of resistance to Cry1Ac (approximately 2000-fold). The YHD2 laboratory-selected strain was found to be cross-resistant to Cry1Aa, Cry1Ab, and Cry1F and showed limited cross-resistance to Cry1B, Cry1C, and Cry2A. Genetic experiments revealed that resistance in the YHD2 strain is partially recessive and is controlled mostly by a single locus or a set of tightly linked loci (Heckel et al. 1997). These results differ from Gould et al.’s 1992 published work using his more moderately-resistant laboratory strain of TBW (<50-fold) which showed some broad-spectrum resistance to Cry1Aa, Cry1Ab, Cry1B, Cry1C, and Cry2A (Gould et al. 1992). The resistance levels in this TBW strain were low, and subsequent work showed that resistance was inherited as a nearly additive trait (Heckel et al. 1997). These results show that cross-resistance in TBW follows a variable pattern for a closely related group of proteins. Therefore, it is difficult to predict what cross-resistance patterns are likely to be in the field because evolutionary responses will depend on the initial frequencies of each resistance allele, the dominance of the alleles, and how the proteins are used.
Because of the complexity and uncertainty associated with predicting cross-resistance, the Agency has taken measures to evaluate the cross-resistance of pest species to the Cry proteins expressed in Bt plants. EPA required that registrants submit data evaluating the cross-resistance potential of various insect pests to Bt proteins prior to registration.
Based on existing binding site studies with TBW and CBW, there is ample evidence of the cross-resistance potential among Cry1A proteins (U.S. EPA 1998, February 28, 1998 Agency Science Review Memorandum S. Matten to W. Nelson; also discussion above). However, these studies do not fully address the cross-resistance potential of TBW, CBW, and PBW to other Cry proteins such as Cry1F and Cry2A. Insects such as the TBW have been shown to have a broad cross-resistance potential to Cry1A, Cry1F, and Cry2A proteins (Gould et al. 1992). Cross-resistance issues are relevant to current Bt crops, especially Bt corn and Bt cotton that deploy Cry1A proteins in which TBW cross-resistance to a number of Bt proteins has been demonstrated in laboratory binding studies. Cross-resistance is also important to the livelihood of organic growers who use Bt foliar sprays on crops in which CBW is a problem.
Based on the available literature examining the receptor binding properties of Cry1A and Cry2A delta endotoxins in CBW, TBW, and ECB larvae, it is very unlikely that cross-resistance would develop to Cry2A delta endotoxins if resistance develops to Cry1A delta endotoxins in
IID123

Bt Plant-Incorporated Protectants October 15, 2001 Biopesticides Registration Action Document
commercially available Bt corn and Bt cotton. Based on the work of English et al. (1994), Cry1A and Cry2A proteins exhibit different binding characteristics and likely possess different modes of action. Because Cry1A and Cry2A proteins exhibit different binding characteristics and very low amino acid homology, they likely possess different modes of action. Therefore, Cry2A may indeed be useful in pyramiding or stacking with other cry genes or other non-Bt insecticidal genes to combat insect pest resistance. There is, however, some evidence for broad cross-resistance (low levels of resistance) to Cry1A and Cry2A in laboratory-selected strains of beet armyworm (Moar et al. 1995) and TBW (Gould et al. 1992). Insect resistance management strategies for Bt cotton and Bt corn lines that express both Cry1A and Cry2A delta-endotoxins require close consideration.
Monsanto indicates they are investigating the potential for cross-resistance between Cry1Ac and Cry2Ab for registration of Bollgard II (cotton varieties that express both Cry1Ac and Cry2Ab proteins). Preliminary studies by Bradley et al. (2000) and Gould (2000b) provided evidence that highly-resistant strains of TBW (YHD2) and CBW selected on Cry1Ac only showed a low amount of adaptation to the Cry2Ab component in Bollgard II plants. In addition, preliminary bioassays conducted by Dennehy et al. (2000b) showed that resistance to Cry1Ac in AZP-R does not confer cross-resistance to Cry2Ab. Insect resistance management strategies need to account for both Cry1Ac and Cry2Ab being pyramided in Bt cotton cultivars. Further study would be useful to further clarify cross-resistance patterns.
8) Grower Compliance
Grower compliance with refuge requirements is extremely important to the success of any insect resistance management strategy for Bt cotton. Lack of grower education and/or poor quality education programs impede successful grower compliance. There are several major grower compliance issues: 1) Is 100% grower compliance achievable; 2) How does lack of grower compliance affect refuge effectiveness; 3) How can the highest level of grower compliance be achieved (and rewarded) through incentives, education, etc.; 4) What level of grower compliance has been achieved with current refuge requirements; 5) How can grower compliance be assured; and 6) What actions might be imposed if there was an insufficient level of grower compliance. A general discussion of grower compliance issues is provided in the Introduction (Section D.1). Annual grower compliance reports submitted by the registrant (Monsanto for Bollgard cotton) help determine if refuge requirements are being implemented. The 2000 SAP Subpanel recommended that there should be third party grower compliance monitoring and measurement. In fact, the 2000 SAP Subpanel thought that reliance on registrant companies to monitor grower compliance presents concerns.
Monsanto representatives visited Bollgard growers during the summers of 1996, 1997, 1998, 1999, and 2000 to discuss their resistance management plans and to review other Integrated Pest Management practices. These representatives looked at field maps, visited fields, and used the gene check kits to confirm the refuge cotton plants were non-Bollgard. The IPM practices
IID124

Bt Plant-Incorporated Protectants October 15, 2001 Biopesticides Registration Action Document
discussed included: scouting followed by selective insecticide use to enhance natural enemy populations for additional control; managing for early maturity of varieties; post-harvest stalk destruction to minimize resistance to Bollgard in late-season infestations and soil management practices that encourage destruction of over-wintering pupae. Monsanto presented the results of their Bollgard grower compliance visits from 1996-1999 at the August 26, 1999 EPA/USDA Workshop on Bt Crop Insect Resistance Management (see U.S. EPA/USDA 1999c; also MRID 448633-01 and MRID 450294-01). Results of grower compliance visits for 2000 were provided by Monsanto (Reding 2001a). The results of Monsanto’s grower surveys are shown in Table D14 below.
Table D14. Percent Grower Compliance - Monsanto Study Year % Growers Following the
Refuge Guidelines
1996 99
1997 98
1998 91
1999 94
2000 95
Based on Monsanto’s grower compliance surveys from 1996-1999, results presented in the Table D14 above indicate that greater than 91% of Bollgard users complied with the refuge requirements from 1996 thru 2000. However, the specific questions and the methods in which grower compliance was assessed are not clear. It is not clear whether the Monsanto representatives visited the fields or just provided a survey of questions to the grower on refuge practices.
In 1999, Monsanto offered a refuge incentive program for certain counties in north Alabama and Tennessee to bolster compliance with the 4% unsprayed refuge option. The selected counties had a high percentage of Bollgard cotton. Growers who fulfilled the requirements of managing the 4% unsprayed option properly and who signed a certificate of refuge management compliance in addition to the grower technology agreement received rebate on the technology fee. Of the 117 growers who participated in the program, only two did not meet the requirement and qualify for rebates. Results of the program demonstrate that growers can manage the 4/100 unsprayed refuge option according to the survey results provided by Monsanto. The rebate program indicates the positive effect incentives can have on grower compliance.
The 2000 SAP Subpanel recognized that the use of the Global Positioning System (GPS) to map grower transgenic and non-transgenic fields in a region is an important compliance monitoring tool especially where it is coupled to grower visits. This system has been used effectively in Arizona (see Carrière et al. 2001). Using a refuge deployment distance of one mile for external
IID125

Bt Plant-Incorporated Protectants October 15, 2001 Biopesticides Registration Action Document
refuges, the Arizona Cotton Research and Protection Council (ACRPC) found in 1999 that 70% of all Bt cotton fields were in conformity with this distance. Prior to 2001, there were no mandatory distance requirements for refuge placement. The ACRPC plans to continue work using GPS and grower visits to look at adoption of refuge requirements. The 2000 SAP Subpanel noted this system may not be feasible or practical for all cotton-growing areas of the country.
New refuge deployment requirements instituted for the 2001 growing season may affect grower compliance. These requirements were imposed to increase the degree of random mating between resistant and susceptible adults. The 2001 pilot community refuge program may provide useful information on whether multiple growers are able to comply with the new refuge options that include specific deployment requirements. No information is currently available from the 2001 growing season.
9) Notification System - 75% Acreage Trigger for 4% Unsprayed Refuge Distance Requirements
Through the end of the 2000 growing season, the Agency has required that Monsanto notify Bollgard retailers and growers in counties/parishes that exceeded that 75% trigger in 1998 that the 4% unsprayed external refuge (if chosen) must be planted within 1 mile of the Bollgard® core acreage. No specific information regarding grower compliance with this distance requirement has been provided to the Agency.
In 1997, there were 33 counties that planted more than 75% of their cotton acreage to Bollgard® (U.S. EPA 1998). In 1998, there were a total of 56 counties/parishes that planted more than 75% of their cotton acreage to Bollgard (MRID 448633-01). Based on the 1999 sales information, Monsanto (MRID 450294-01) reported 115 counties/parishes planted at least 75% of their cotton acres to Bollgard.
Based on Monsanto’s farm surveys/audits, greater than 91% of the cotton growers have complied with the IRM refuge requirements since 1996. Monsanto’s reports to the Agency do not specify whether cotton growers complied with the one mile distance requirement for the 96/4 refuge option in counties/parishes under Notification or whether compliance was strictly measured as a function of refuge size or some other measurement of adequate refuge. In discussions with Monsanto, comments have been made that the Notification system is logistically difficult (i.e., Monsanto must send out thousands of letters to dealers and retailers notifying them of whether they are in counties that have exceeded the 75% trigger). In addition, the Agency has confirmation that not all growers, and certainly not all University/extension education and researchers, received copies of the Notification letters.
Beginning with the 2001 growing season, the Notification system has been replaced with mandatory structure and deployment requirements for the 95:5 embedded, 95:5 external
IID126

Bt Plant-Incorporated Protectants October 15, 2001 Biopesticides Registration Action Document
unsprayed structured, and 80:20 external sprayed refuge options. These three refuge options should help ensure better grower compliance with the refuge requirements as well as improve refuge efficacy. Research shows that refuge deployment is critical to ensure that susceptible moths emerge from refuge fields and can randomly mate with putative resistant moths emerging in Bt fields. These changes are in agreement with recommendations by the 1998 SAP Subpanel to reexamine the deployment of the 96:4 external unsprayed and the 80:20 external sprayed refuge options that have been in place for the 1996-2000 growing seasons.
10) Grower Education
Extremely critical to the success of IRM are communication and educational efforts designed to assure that growers understand and implement the resistance management strategy. Bt cotton grower education has been reviewed in EPA’s White Paper (U.S. EPA 1998). The importance of grower education was emphasized at the EPA/USDA Workshop on Bt cotton IRM held in August 1999 (U.S. EPA/USDA 1999c). The 2000 SAP Subpanel stressed the importance of grower education and its impact on grower compliance. Based on these comments, the extension of grower education should continue to benefit IRM.
Based on the review of Monsanto’s annual reports submitted for the 1996-1999 growing season, Monsanto has invested in programs and materials to educate growers on the value of incorporating the IRM plan into their farming practices. Monsanto conducts numerous grower and retailer meetings. They also provide financial support to academic and extension researchers. Monsanto also conducts annual grower compliance surveys and field visits. Specific scouting techniques have been developed for Bt cotton. A partnership developed between industry, National Cotton Council, State grower organization, universities, extension experts, consultants, and state/federal governmental regulatory agencies could be beneficial to promote insect resistance management. One example of very good partnership is the Arizona Bt Cotton Working Group.
11) Annual Plan Reports
Annual reports are useful to help assess the effectiveness of current Bt cotton IRM strategies. The Agency has received annual sales and resistance monitoring reports from Monsanto. Annual research, grower compliance, and grower education materials would also be pertinent for the Agency’s assessment of current and potential IRM strategies.
c. Summary of Bt Cotton IRM Risk Assessment
Bollgard cotton expressing Cry1Ac produces a high dose to control TBW, PBW, but only a moderate dose to control CBW. This conclusion was confirmed by the 1998 and 2000 SAP Subpanels. The 1998 and 2000 SAP Subpanels recommended that a refuge should produce 500:1 susceptible to one resistant individual in the Bt cotton fields.
IID127

Bt Plant-Incorporated Protectants October 15, 2001 Biopesticides Registration Action Document
Based on some data and computer model predictions, the current refuge options: 95:5 external unsprayed (planted <½ mile; >150 feet), 95:5 embedded (150 ft. wide within a single field), and 80:20 external sprayed (planted <1 mile, ½ mile preferred), even with the current structure and deployment requirements, may not be sufficient to produce enough susceptible individuals to mate with putatively resistant individuals coming from Bt cotton fields for CBW. The 2000 SAP Subpanel suggested that the 95:5 external unsprayed refuge option is the weakest of the three options in its management of TBW, CBW, and PBW resistance. The greatest area of concern for Bt resistance development is for CBW because of its genetics and insensitivity to the Cry1Ac endotoxin. Recent genetic studies by Burd et al. (2000) have shown that CBW inherited resistance as a dominant or incompletely dominant trait (d = 0.75). A key assumption of the high dose/refuge strategy is that of recessive inheritance of Bt resistance. Lacking both recessiveness and a high dose for CBW, current refuge options appear to be too small to adequately mitigate Bt resistance in the long-term (i.e., >10-15 years). Refuge management, choice of land for the refuge, structure of the refuge and proximity to the Bt cotton fields, spraying the “unsprayed” refuge, premature termination and grower compliance are issues that have and will affect the efficiency of the refuge. Further field testing of refuge options and field evaluation of parameters in resistance models can supply critical information.
The 2000 SAP and available evidence supports the conclusion that the 95:5 external unsprayed refuge option poses greater risk to TBW and CBW resistance development than either the embedded refuge option or external sprayed refuge option. For protection of TBW resistance to Bt, there would be about a two-fold benefit to expanding the 95:5 external unsprayed refuge to 90:10. Based on Gould’s resistance model for CBW, expanding the 95:5 external unsprayed refuge to 90:10 would increase resistance protection about 20%. Expanding the 95:5 external unsprayed refuge option to 90:10 could well increase non-compliance, abuse, economic, and logistical problems associated with the 95:5 external unsprayed refuge option.
Based on Gould’s and Caprio’s models, a 70:30 external sprayed refuge option or a 90:10 embedded option would appear to mitigate the TBW and CBW resistance risk better than the three refuge options to be implemented in 2001: 95:5 embedded, 95:5 external unsprayed structured, and 80:20 external sprayed. Caprio’s model predicts that the time to CBW resistance using the 90:10 embedded untreated (67% dispersal) option will be 22.4 years versus 12.0 years if there was only a 95:5 embedded option. In addition, Caprio’s model predicts that the 70:30 external sprayed option would increase the time to resistance from 10.5 years to 14.5 years (about a 30% increase over the 80:20 external sprayed option) for CBW. Gould’s model predicts about a two-fold increase in years to resistance for a 90:10 versus 95:5 refuge for TBW resistance management. The 2000 SAP Subpanel commented that the 90:10 embedded refuge option would provide about a two-fold advantage over the 95:5 embedded refuge option. The Livingston et al. (2001a) efficient refuge model for management of TBW and CBW resistance to Bt derived 21% and 41% sprayed refuges and 11% and 14% unsprayed refuges to maximize the present value of average profits per acre for a 9- or 15-year time horizon respectively, after Bt cotton was first commercialized. Based on the predictions of the Gould, Caprio, and Livingston
IID128

Bt Plant-Incorporated Protectants October 15, 2001 Biopesticides Registration Action Document
et al. models, larger refuges would be appropriate to maintain resistance protection for the longer time horizons (> 10 years).
In the case of PBW, 200 to 900-fold resistance has been selected in the laboratory from more tolerant field populations. These resistant colonies can survive and reproduce on Bt cotton grown in the greenhouse. These findings clearly show that a gene or genes conferring strong PBW resistance to Cry1Ac likely exist in field populations. Initial resistance allele frequency estimates for PBW were incorrect and, based on data collected in 1997, the resistance allele frequency was significantly higher than the 0.001 estimate in 1995. Further estimates in 1998 and 1999 showed no increase in the estimated resistance allele frequency and Bt cotton remained effective. Based on these results, the frequency of resistance does not necessarily increase from one year to the next even when there are large amounts of Bt cotton in Arizona. Preliminary field data indicate that a 95:5 embedded (single row option) may be inadequate to delay PBW resistance because it may not maintain a sufficient susceptible population in the refuge (Carrière et al. 2001). Arizona Bt Cotton Working Group has indicated that the lowest risk option for PBW developing resistance is the 90:10 in-field refuge option in which there is one non-Bt row planted for every six to ten rows of Bt cotton. The Arizona Bt Cotton Working Group clarifies that this option is not intended for seed producers.
The 2000 SAP Subpanel did not resolve whether the distance between Bt and non-Bt cotton fields should be less than 1 mile or less than ½ mile. However, this distance should not differ between external sprayed and external unsprayed refuge options. Based on TBW, CBW, and PBW dispersal data, the distance between Bt cotton fields and refuges should be no more than 1 mile (½ mile preferred, closer is better) to favor mating between the RR (resistant individuals) from the Bt cotton fields and the SS (susceptible) from the refuges.
EPA has used several resistance management models as part of its decision-making process for IRM requirements for Bt cotton. The 2000 SAP Subpanel agreed that resistance management models were important tools in determining appropriate Bt crop resistance management plans. Models should include factors such as level of adoption, level of compliance, economics, stochasticity, spatiality, and fitness costs. The Subpanel recommended peer review of model design and validation of the parameters in resistance management models. Regional working groups were recommended by both the 1998 and 2000 SAP Subpanels to help develop effective and practical long-term resistance management strategies.
Five years of resistance monitoring information for TBW, CBW, and PBW have indicated no significant changes in susceptibility to the Cry1Ac protein. Preliminary data for the 2000 growing season have not shown any significant changes in susceptibility. A drought in mid-South and southeastern U.S. affected the resistance monitoring program for TBW and CBW. The 2000 TBW and CBW resistance monitoring program did not provide much data to be analyzed because of insufficient TBW and CBW populations. Improvements in sampling and statistical design are warranted. The 2000 SAP Subpanel recommended peer review of
IID129

Bt Plant-Incorporated Protectants October 15, 2001 Biopesticides Registration Action Document
resistance monitoring programs. Potential CBW “tolerance” to the Cry1Ac endotoxin is still an issue for further examination.
The 2000 SAP Subpanel thought the Arizona Bt Cotton Working Group’s (ABCWG) remedial action plan for PBW was a good model to follow.
Increased grower education on the importance of implementing and managing good refuges is warranted. Community refuges may help compliance with refuge requirements. There are a number of logistical, implementation, compliance, and enforcement questions that have not been fully addressed. Evaluation of the 2001 pilot program will help answer these questions.
The 2000 SAP Subpanel noted the following possible compliance mechanisms: grower contracts, grower education, cost incentives, refuge deposit/refund, and refuge insurance. Monsanto had a model program in north Alabama and in one county in western Tennessee that provided incentives to growers to better manage the 96/4 external unsprayed refuge option. The 2000 SAP Subpanel recommends a third party compliance monitoring system Potential avenues of measurement include: carefully designed grower surveys with follow-up, grower visits/audits, and refuge mapping.
d. Information to Improve the Risk Assessment
Although the Agency has considered the most up-to-date scientific information in this risk assessment, resistance management is a developing field. Therefore, the IRM strategies may be improved with the collection of additional information, the results of which can be submitted in annual research reports. These data are summarized in Table D14 below.
Table D15. Summary of Data Which Would be Likely to Improve Insect Resistance Management Strategies for Bt Cotton Products
Data Pests
Pest Biology (more information): e.g., larval movement, adult movement, mating behavior, pre- and post-mating dispersal, ovipositional behavior, fitness, and overwintering habitat and survival
TBW, CBW, PBW
North to South Movement CBW
Resistance Allele Frequency TBW, CBW, PBW
Cross-Resistance - Cry1A, Cry2A proteins TBW, CBW, PBW
IID130

Bt Plant-Incorporated Protectants October 15, 2001 Biopesticides Registration Action Document
Data Pests
Field Evaluation (field studies and models) of Refuge Options - [Issues to consider: production of susceptible insects (500:1 ratio) in insecticide treated and non-insecticide treated refuges, pyrethroid oversprays, adequacy of size, structure, and deployment of the refuge, rotation of refuge.]
TBW, CBW, PBW
Models: development, validation of design and parameters, refinement of existing and new models [Include level of compliance, level of adoption, economics, fitness costs, spatiality, stochasticity]
TBW, CBW, PBW
Resistance Monitoring Program For TBW and CBW: increase sampling and statistical rigor, intensify program in high risk areas; For PBW: expand and intensify program in W. TX, NM, CA; examine statistical design and analysis
Field Evaluation of Resistance Monitoring Techniques, e.g., discriminating v. diagnostic dose, F2 screen, gene mapping
TBW, CBW, PBW
Step-by-step Remedial Action Plan [compare to AZ Bt Cotton Working Group Plan for PBW]
TBW, CBW
Grower Compliance - more detailed information on refuge (percent of refuge acres per farm, deployment, and management), impact of non-compliance
TBW, CBW, PBW
4. Potatoes
The Colorado Potato Beetle (CPB) has demonstrated a distinct ability to develop resistance to a wide variety of conventional insecticides. Based on the analysis of available scientific information, the Agency has determined that there is a potential for resistance to develop to the Bt Cry3A delta endotoxin produced in potatoes. The development of resistance could contribute to the loss of effectiveness of this plant-incorporated protectant.
Monsanto developed a resistance management plan for the Bt Cry3A delta endotoxin produced in potatoes. The Agency and the March 1, 1995 SAP subpanel reviewed the Monsanto resistance management plan and determined that it is a scientifically-sound and workable resistance management plan to address resistance to the Bt Cry3A delta endotoxin produced in potatoes as commercialization began. According to the SAP, the resistance management plan included all of the general elements necessary to reduce the selection pressure on the target pest, CPB, and therefore reduce the probability for resistance to occur. The 1995 SAP recommended that the plan be voluntary and that Monsanto should work with the Agency on refinements to the resistance management plan as more information is gathered during wide-scale commercial use. EPA agreed with the recommendation at that time and did not impose a mandatory IRM plan.
IID131
Bt Plant-Incorporated Protectants October 15, 2001 Biopesticides Registration Action Document
a. Current Insect Resistance Management (IRM) Plan
The SAP meeting in 1998 on resistance management recommended that the IRM plan for potatoes be mandatory instead of voluntary. Monsanto has made several modifications to its NewLeaf potato IRM plans over the last five years. In 2000, Monsanto amended their registration to make the refuge mandatory. Growers were already signing contracts which included a refuge requirement. In addition, the current plan focuses on placement of the refuge and encompasses the importance of overwintering sites. The Insect Resistance Management Plan includes:
1) Use NewLeaf potatoes in rotation to reduce CPB.
2) Plant and manage “refuges” to maintain susceptible insect populations. Specific grower recommendations are as follows:
1. Do not plant your entire potato acreage to NewLeaf potato varieties, but maintain at least 20% of the total acreage as “refuge”.
2. Do not use a foliar Bt application for CPB control on refuge acres. You may treat CPB in the refuge with insecticides to prevent damage. It is recommended that you use foliar insecticides only when populations reach damaging levels, according to local IPM recommendations.
3. Plant every NewLeaf potato field within ½ mile or less of the appropriate current year refuge or Plant every NewLeaf potato field within ½ mile of land that was the designated refuge (non-Bt potatoes) last year.
3) Use of every method available to reduce CPB populations such as crop rotation, propane flaming, trench trapping, and overwintering habitat destruction.
4) Monitoring for survival of CPB including a toll free number.
5) Grower education plan.
6) Monitoring for resistance development.
7) Remedial action plan.
b. Analysis of the Risks Associated with Current IRM Plans and Alternatives
The 1998 SAP Subpanel concluded that NewLeaf® and NewLeaf Plus® potato hybrids are maintaining a “ high dose” expression of Cry3A throughout the growing season to control Colorado potato beetle (CPB). The dose is at least 50 times that necessary to kill first-instar larvae. Experts meeting in December 1999 agreed that a 20% refuge is sufficient to produce the 500:1 susceptible insects to resistant insects needed for an efficient refuge. They also agree that a one-half mile maximum distance restriction for the refuge is a reasonable recommendation. EPA agrees with these experts. Monsanto has developed a discriminating dose assay, a surveillance and remedial action plan, and an extensive grower education communication and training program to
IID132

Bt Plant-Incorporated Protectants October 15, 2001 Biopesticides Registration Action Document
convey appropriate resistance management tactics. IPM and scouting are discussed in the technical material provided by Monsanto/NatureMark. Based on Monsanto’s annual grower surveys, grower compliance with the 20% refuge is >99%. In addition, the recent amendments to make the refuge mandatory and the focus on managing insect overwintering habitat have further decreased the likelihood that resistance of CPB to Cry3A will occur from exposure to Bt potatoes. The Agency’s full risk assessment of insect resistance development and insect resistance management assessment is found in the Agency’s memorandum from S. Matten OPP/BPPD to W. Nelson, OPP/BPPD, dated July 5, 2000.
References
Adamcyzk, JJ., Jr., L.C. Adams, and D.D. Hardee, 2000. Quantification of Cry1Ac-endotoxin in transgenic Bt cotton: Correlating insect survival to different protein levels among plant parts and varieties. 2000 Proceeding of the Beltwide Cotton Conferences. National Cotton Council.
Alyokhin, A.V. and D.N. Ferro, 1999. Relative fitness of Colorado potato beetle (Coleoptera: Chrysomelidae) resistant and susceptible to the Bacillus thuringiensis Cry3A toxin. J. Econ. Entomol. 92(3): 510-515.
Alyokhin, A., D.N. Ferro, C.W. Hoy, and G. Head, 1999. Laboratory assessment of flight activity displayed by Colorado potato beetles (Coleoptera: Chrysomelidae) fed on transgenic and Cry3a toxin-treated potato foliage. J. Econ. Entomol. 92(1): 115-120.
Andow, D. A. and D. N. Alstad, 1998. The F2 screen for rare resistance alleles. J. Econ. Entomol., 91: 572-578.
Andow, D. A. and W. D. Hutchison, 1998. Bt corn resistance management. In Now or never: Serious new plans to save a natural pest control. M. Mellon and J. Rissler [eds.]. Union of Concerned Scientists, Two Brattle Square, Cambridge, MA.
Andow, D. A., D. N. Alstad, Y.-H. Pang, P. C. Bolin, and W. D. Hutchison, 1998. Using a F2 screen to search for resistance alleles to Bacillus thuringiensis toxin in European corn borer (Lepidoptera: Crambidae). Journal of Economic Entomology 91: 579-584.
Andrews, G., B. Freeman, A. Harris, G. Herzog, G. Lentz, W. Moar, P. Roberts, M. Roof, R. Smith, M. Sullivan, and S. Turnipseed, 2000. April 4, 2000 letter from Dr. G. Andrews et al. to Dr. Janet Andersen, Director/BPPD.
Antilla, M. Whitlow, J. White, C. Youngker, T.J. Dennehy, R.T. Staten, 1999. Alternative infield refuge strategies for control of pink bollworm in Bt transgenic cotton. Proceedings of the Beltwide Cotton Conference. National Cotton Council. Pp. 1241-1243.
IID133

Bt Plant-Incorporated Protectants October 15, 2001 Biopesticides Registration Action Document
Arizona Bt Cotton Working Group, 2000a. January 31, 2000 Draft Report of the Arizona Bt Cotton Working Group Meeting held on January 21, 2000 (edited by Dr. Tim Dennehy, University of Arizona).
Arizona Bt Cotton Working Group, 2000b. A remedial action plan for responding to pink bollworm resistance to Bt cotton in Arizona. T. J. Dennehy, Chair. April 6, 2000 version.
Ballester, V., B. Escriche, J. Mensua, G. Riethmacher, and J. Ferré, 1994. Lack of cross-resistance to other Bacillus thuringiensis crystal proteins in a population of Plutella xylostella highly resistant to CryIA(b). Biocontrol Sci. Tech. 4: 437-443.
Bartlett, A. C., 1995. Resistance of the pink bollworm to Bt transgenic cotton. 1995 Proceedings Beltwide Cotton Conferences. National Cotton Council. Pp. 766-768.
Bartlett, A. T., J. Dennehy, and L. Antilla, 1997. An evaluation of resistance to Bt toxins in native populations of the pink bollworm. 1997 Proceedings of the Beltwide Cotton Conferences. Vol. 2. National Cotton Council. Pp. 885-888.
Beck, S.D., 1987. Developmental and season biology of Ostrinia nubilalis. Agricultural Zoology Review. 2: 59-96.
Benedict, J., D. Fromme, J. Cosper, C. Correa, G. Odvody, and R. Parker, 1998. Efficacy of Bt corn events MON 810, BT11, and Event 176 in controlling corn earworm, fall armyworm, sugarcane borer, and aflatoxin. Unpublished study submitted to EPA (part of Monsanto’s 1998 IRM research report). MRID # 447753-01.
Bentur, J. S., D. A. Andow, M. B. Cohen, A. M. Romena, and F. Gould, 2000. Frequency of alleles conferring resistance to a Bacillus thuringiensis toxin in a Philippine population of Scripophaga incertulas (Lepidoptera: Pyralidae). Journal of Economic Entomology. 93: 1515-1521.
Bing, J., 1997. Establishment and survival of second generation European corn borer on Event 176 hybrids. Unpublished study submitted to EPA (part of Mycogen’s 1997 IRM research report). MRID # 445436-02.
Boiteau, G., 1988. Sperm utilization and post-copulatory female-guarding in the Colorado potato beetle, Leptinotarsa decemlineata. Entomol. Expt. Appl. 47: 183-187.
Bourguet, D., A. Genissel, and M. Raymond, 2000. Insecticide resistance and dominance levels. Journal of Economic Entomology. 93: 1588-1595.
Bourguet, D., J. Chaufaux, M. Seguin, C. Buisson, J. L. Hinton, T. J. Stodola, L. Buschman, P.
IID134

Bt Plant-Incorporated Protectants October 15, 2001 Biopesticides Registration Action Document
Porter, G. Cronholm, and D. A. Andow, 2001. Is resistance to Bt maize rare enough to delay pest adaptation of the European corn borer? Submitted.
Bradley, J. R., 1995. Expectations for Transgenic Bt Cotton: Are They Realistic? 1995 Beltwide Cotton Conferences. National Cotton Council. Pp. 763-765.
Bradley, J.R., Jr., J. Van Duyn, and R. Jackson, 2000. Greenhouse evaluation of Bollgard II cotton genotypes for efficacy against feral and Cry1Ac selected strains of Helicoverpa zea. Project Code: CT99MON7 and CT99MON8. Study submitted to Monsanto.
Brickle, D.S., S.G. Turnipseed, and M.J. Sullivan, 2000a. The efficacy of different insecticides and rates against bollworms (Lepidoptera: Noctuidae) in B.t. and conventional cotton. Unpublished study. [Part of Monsanto’s January 28, 2000 submission]
Brickle, D.S., S.G. Turnipseed, and M.J. Sullivan, 2000b. Comparison of different chemistries and rates against bollworm in Bt and conventional cotton. 2000 Proceedings of the Beltwide Cotton Conferences. National Cotton Council. 971-975.
Burd, A. D., J.R. Bradley, Jr., J.W. Van Duyn, and F. Gould, 2000. Resistance of bollworm to CryIAc toxin (MVP). 2000 Proceeding of the Beltwide Cotton Conferences., National Cotton Council. Pp. 923-926.
Burd, A. D., J.R. Bradley, Jr. J.W. Van Duyn, F. Gould, and W. Moar, 2001. Estimated frequency of non-recessive B.T. resistance genes in Bollworm, Helicoverpa zea. Proceeding of the Beltwide Cotton Conferences, National Cotton Council. Pp. 820-822.
Buschman, L., P. Sloderbeck, and R. Higgins, 1997. Evaluation of refuge planting patterns for corn borer resistance management in Bt-corn. Unpublished study submitted to EPA (part of Novartis’ 1997 IRM research report). MRID # 444754-01.
Buschman, L., P. Sloderbeck, R. Hellmich, S. Ramaswarmy, and R. Higgins, 1999. Dispersal of European and southwestern corn borer moths in Bt cornfields. Unpublished study submitted to EPA (part of Monsanto’s 1999 IRM research report). MRID # 450369-02.
Buschman, L. and P. Sloderbeck, 1999. Letter to Dr. Janet L. Andersen (OPP/BPPD), dated 11/30/99.
California Cotton Pest Management Board, 1999. Letter to Dr. Sharlene R. Matten (OPP/BPPD), dated 12/1/99.
Calvin, D., L. Smith, and D. Lehto, 1997. Sequential plantings of field corn: temporal refugia for European corn borer and economic benefits of transgenic hybrids. Unpublished study
IID135

Bt Plant-Incorporated Protectants October 15, 2001 Biopesticides Registration Action Document
submitted to EPA (part of Novartis’ 1997 IRM research report). MRID# 444754-01.
Calvin, D., 1998. Tactical implementation of Bt corn hybrids in the Northeastern United States to manage European corn borer resistance. Unpublished study submitted to EPA (part of Monsanto’s 1998 IRM research report). MRID # 447753-01.
Caprio, M., 1997. Corn-cotton ecosystem model for resistance evolution in Helicoverpa zea to Bt-endotoxins expressed in plants. Unpublished study submitted to EPA (part of Novartis’ 1997 IRM research report). MRID # 444754-01.
Caprio, M., 1998. Evaluating resistance management strategies for multiple toxins in the presence of external refuges. J. Econ. Entomol. 91: 1021-1031.
Caprio, M., 1999. Personal communication. E-mail correspondence to R. Rose (OPP/BPPD). E-mail dated 2/24/99.
Caprio, M., 2000a. Dispersal and ovipositional patterns of tobacco bollworm (Helicoverpa zea) in the corn-cotton agroecosystem. Unpublished study.
Caprio, M., 2000b. Personal communication to Dr. S. Matten, OPP/BPPD. E-mail dated 5/10/2000.
Caprio, M., 2000c. Personal communication to Dr. S Matten, OPP/BPPD. E-mail dated 6/16/2000.
Caprio, M., 2001. Source-sink dynamics between transgenic and non-transgenic habitats and their role in the evolution of resistance. J. Econ. Entomol. 94: 698-705.
Caprio, M. and J. Benedict, 1996. Biology of the Major Lepidopteran Pests of Cotton (June 24, 1996. Submission by Monsanto, MRID 2204225-01.
Caprio, M.A., and E.J. Grafius, 1990. Effects of light, temperature, and feeding status on flight initiation in postdiapause Colorado potato beetles (Coleoptera: Chrysomelidae). Environ. Entomol. 19: 281-285.
Caprio, M.A., D.V. Sumerford, and S.R. Simms, 2000. Evaluating transgenic plants for suitability in pest and resistance management programs. In “Field Manual of Techniques in Invertebrate Pathology” (L. Lacey and H. Kaya, Eds.). Kluwer Academic Publishers (Boston). Pp. 805-828.
Carrière, Y., T.J. Dennehy, B. Pedersen, S. Haller, C. Ellers-Kirk, L. Antilla, Y.-B. Liu, E. Willott, and B.E. Tabashnik, 2001. Large-scale management of insect resistance to transgenic cotton in Arizona: can transgenic insecticidal crops be sustained? J. Econ. Entomol. 94(2): 315-325.
IID136

Bt Plant-Incorporated Protectants October 15, 2001 Biopesticides Registration Action Document
Catangui, M., 1997. Early and late planting study. Unpublished research report submitted to EPA (part of Mycogen’s 1997 IRM research report). No MRID #.
Catangui, M. and B. Berg, 1998. Performance of Bt-corn exposed to univoltine and bivoltine European corn borers in South Dakota, 1998. Unpublished study submitted to EPA (part of Novartis’ 1998 IRM research report). MRID # 447439-01.
Davis, F.M., 2000. Economic status of southwestern corn borer: December 1998. Unpublished report from USDA (ARS: Mississippi State).
Denholf, P., S. Jansens, M. Peferoen, D. Degheele, and J. Van Rie, 1993. Two different Bacillus thuringiensis delta-endotoxin receptors in the midgut brush border membrane of the European Corn Borer, Ostrinia nubilalis (Hübner) (Lepidoptera: Pyralidae). Applied and Environmental Microbiology. 59: 1828-1837.
Dennehy, T., A. Patin, B. Tabashnik, L. Antilla, Y.-B. Liu, and Y. Carrière, 2000a. Status of pink bollworm susceptibility to Bt cotton in Arizona: 1999 season preliminary update. Unpublished study.
Dennehy, T., M. Sims, B. Tabashnik, Y. Carrière, Y.-B. Liu, L. Antilla, and R. Staten, 2000b. Sustaining efficacy of Bt cotton in Arizona. Unpublished study.
DiCosty, U. R. and M. E. Whalon, 1997. Selection of Colorado potato beetle resistant to CryIIIA on transgenic potato plants. Resistant Pest Management. 9: 33-34.
Dively, G. and T. Horner, 1997. Bt endotoxin-expressing corn and its impact on insect pests and mycotoxin contamination. Unpublished study submitted to EPA by Novartis. MRID # 443474-01.
Dively, G., T. Horner, and D. Ames Herbert, 1997. Impact of Bt endotoxin-expressing transgenic corn on corn earworm and its implications to resistance development and area-wide suppression. Unpublished study submitted to EPA (part of Novartis’ 1997 IRM research report). MRID # 444754-01.
Dively, G. and J. Linduska, 1998. Studies of Bt protein-expressing sweet corn: assessment and management of non-target pests, characterization of blemished kernels, comparative performance of different hybrids, survivorship of target pests after harvest. Unpublished study submitted to EPA (part of Novartis’ 1998 IRM research report). MRID # 447439-01.
English, L., H.L. Robbins, M.A. Von Tersch, C.A. Kulesza, D. Ave, D. Coyle, C.S. Jany, S.L. Slatin, 1994. Mode of action of CryIIA: a Bacillus thuringiensis delta-endotoxin. Insect Biochem. Molec. Biol. 24: 1025-1035.
IID137

Bt Plant-Incorporated Protectants October 15, 2001 Biopesticides Registration Action Document
Estada, U. and J. Ferré, 1994. Binding of insecticidal crystal proteins of Bacillus thuringiensis to the midgut brush border of the cabbage looper, Trichoplusia ni (Hübner) (Lepidoptera: Noctuidae), and selection for resistance to one of the crystal proteins. Applied Environmental Microbiology. 60: 3840-3846.
Ferré, J., M. D. Read, J. Van Rie, S. Jansens, and M. Peferoen, 1991. Resistance to the Bacillus thuringiensis bioinsecticide in a field population of Plutella xylostella is due to a change in a midgut membrane receptor. Proceedings of the National Academy of Science USA. 88: 5119-5123.
Ferré, J., B. Escriche, Y. Bel, and J. Van Rie, 1995. Biochemistry and genetics of insect resistance to Bacillus thuringiensis insecticidal crystal proteins. FEMS Microbiology Letters. 132: 1-7.
Gahan, L.J., F. Gould, and D.G. Heckel. 2001. Identification of a gene associated with Bt resistance in Heliothis virescens. Science 293: 857-860.
Gould, F., 1998a. Evolutionary biology and genetically engineered crops. BioScience 38: 26-33.
Gould, F., 1998b. Sustainability of Transgenic Insecticidal Cultivars: Integrating Pest Genetics and Ecology. Annu. Rev. Entomol. 43: 701-726.
Gould, F., 1999. Personal communication to Dr. Sharlene Matten OPP/BPPD. E-mail dated 6/3/99.
Gould, F., 2000a. Testing Bt refuge strategies in the field. Nature Biotechnology 18: 266-267.
Gould, F., 2000b. Final Report: Efficacy of new Bt-cotton varieties against resistant strains of Heliothis virescens. Unpublished study submitted to Monsanto.
Gould, F., 2000c. Personal communication to Dr. Sharlene Matten, OPP/BPPD. E-mail dated January 31, 2000.
Gould, F. and B. Tabashnik, 1998. Bt-cotton resistance management. In “Now or Never: Serious New Plans to Save a Natural Pest Control. Ed. M. Mellon and J. Rissler. p. 65-105.
Gould, F., A. Martinez-Ramirez, A. Anderson, J. Ferré, F. Silva, and W. Moar, 1992. Broad spectrum Bt resistance. Proc. Natl. Acad. Sci. USA 89: 1545-1559.
Gould, F., A. Anderson, A.Reynolds, L. Bumgarner, and W. Moar, 1995. Selection and genetic analysis of a Heliothis virescens (Lepidoptera: Noctuidae) strain with high levels of resistance to Bacillus thuringiensis toxins. J. Econ. Entomol. 88: 1545-59.
IID138

Bt Plant-Incorporated Protectants October 15, 2001 Biopesticides Registration Action Document
Gould, F., A. Anderson, A. Jones, D. Sumerford, D. Heckel, J. Lopez, S. Micinski, R. Leonard, and M. Laster, 1997. Initial frequency of alleles for resistance to Bacillus thuringiensis toxins in field populations of Heliothis virescens. Proc. Natl. Acad. Sci. USA 94: 3519-23.
Granero, F., V. Ballester, and J. Ferré, 1996. Bacillus thuringiensis crystal proteins CryIAb and CryIFa share a high affinity binding site in Plutella xylostella (L.). Biochem. Biophys. Res. Comm. 224: 779-783.
Greenplate, J.T., 1999. Quantification of Bacillus thuringiensis insect control protein Cry1Ac over time in Bollgard cotton fruit and terminals. J. Econ. Entomol. 92: 1377-1383.
Hardee, D.D., J.W. Van Duyn, M.B. Layton, and R.D. Bagwell, 2001. Bt cotton and Management of Tobacco Budworm and Bollworm Complex. U.S. Department of Agriculture, Agriculture Research Service, ARS-154, Pp. 37.
Hawthorne, D., B. Siegfried, T. Shelton, and R. Hellmich, 2001. Monitoring for resistance alleles: a report from an advisory panel on insect resistance monitoring methods for Bt corn. Unpublished study submitted to EPA (part of Monsanto’s 2000 IRM monitoring report). MRID # 453205-02.
Heckel, D.G., 1994. The complex genetic basis of resistance to Bacillus thuringiensis toxin in insects. Biocontrol Sci. and Tech. 4: 405-417.
Heckel, D.G., L.C. Gahan, F. Gould, A. Anderson, 1997. Identification of a linkage group with a major effect on resistance to Bacillus thuringiensis Cry1Ac endotoxin in tobacco budworm (Lepidoptera: Noctuidae), J. Econ. Entomol. 90: 75-86.
Hellmich, R.L., 1996. 1996 Resistance management related field experiments: Ames, IA. Unpublished study submitted to EPA (part of Monsanto’s 1997 IRM research report). No MRID #.
Hellmich, R.L., 1997. 1997 Resistance management related field experiments: Ames, IA. Unpublished study submitted to EPA (part of Novartis’ 1997 IRM research report). MRID # 444754-01.
Hellmich, R.L., 1998. 1998 Resistance management related field experiments: Ames, IA. Unpublished study submitted to EPA (part of AgrEvo’s 1998 IRM research report). MRID # 447443-01.
Hellmich, R.L., L.S. Higgins, J.F. Witkowski, J.E. Campbell, and L.C. Lewis, 1999. Oviposition by European corn borer (Lepidoptera: Crambidae) in response to various transgenic corn events. Journal of Economic Entomology. 92 (5): 1014-1020.
IID139

Bt Plant-Incorporated Protectants October 15, 2001 Biopesticides Registration Action Document
Higgins, R., 1999. Personal communication to Dr. Sharlene Matten (OPP/BPPD). E-mail dated7/14/99.
Hunt, T.E., J.F. Witkowski, L.G. Higley, and R.L. Hellmich, 1997. Mark-recapture studyexamining adult European corn borer dispersal to and among attraction sites–year two of a threeyear study. Unpublished study submitted to EPA (part of Novartis’ 1997 IRM research report). MRID # 444754-01.
Hunt, T., J. Witowski, and L. Higley, 1998a. Mark-recapture study examining adult European corn borer dispersal to and among attraction sites: addendum to 1997 annual report. Unpublished data submitted to EPA (part of Mycogen and Monsanto’s 1998 IRM research report). MRID #s. 448545-01 & 447753-01.
Hunt, T., J. Witowski, and L. Higley, 1998b. Mark-recapture study examining adult European corn borer dispersal to and among attraction sites: year three of a three year study. Unpublished data submitted to EPA (part of Mycogen and Monsanto’s 1998 IRM research report). MRID #s. 448545-01 & 447753-01.
Hurley, T. and P. Mitchell, 2000. Economic refuge recommendations for multiple toxinBt corn and an assessment of insurance incentives for the voluntary adoption of refugerecommendations. Unpublished study submitted to EPA (part of Aventis’ 2000 IRM report). MRID # 454268-02.
International Life Science Institute, 1999. An evaluation of insect resistance management in Btfield corn: a science-based framework for risk assessment and risk management. Report of anexpert panel. November 23, 1998.
Lambert, B., L. Buysse, C. Decock, S. Jansens, C. Piens, B. Saey, J. Seurinck, K. Van Audenhove,J. Van Rie, A. Van Vliet, and M. Peferoen, 1996. A Bacillus thuringiensis insecticidal crystalprotein with a high activity against members of the family Noctuidae. Appl. Environ. Microbiol.62: 80-86.
Liu, Y-B, B.E. Tabashnik, T. J. Dennehy, A. L. Patin, and A.C. Bartlett, 1999. Development time and resistance to Bt crops. Nature. 100: 519.
Livingston, M., G. Carlson, and P. Fackler, 2000a. Efficient Bt refuge policy. 2000 Proceedings of the Beltwide Cotton Conferences. National Cotton Council. Pp. 345-348
Livingston, M., G. Carlson, and P. Fackler, 2000b. Bt resistance under conventional insecticide use. 2000 Proceedings of the Beltwide Cotton Conferences. National Cotton Council. Pp. 1033-1037.
IID140

Bt Plant-Incorporated Protectants October 15, 2001 Biopesticides Registration Action Document
Livingston, M.J., G.A. Carlson, and P. L. Fackler, 2001a. Efficient refuge guidelines for cotton producers. Journal of Econ. Ent. Submitted.
Livingston, M.J., G.A. Carlson, and P. L. Fackler, 2001b. Characteristics of pyrethroid resistance evolution in tobacco budworm and bollworm (Lepidoptera: Noctuidae) field populations. Journal of Econ. Ent. Submitted.
Luttrell, R.G., L. Wan, and K. Knighten, 1999. Variation in susceptibility of noctuid (Lepidoptera) larvae attacking cotton and soybean to purified endotoxin proteins and commercial formulations of Bacillus thuringiensis. J. Econ. Entomol. 92: 21-32.
Lynch, R.E., B.R. Wiseman, D. Plaisted, and D. Warnick, 1999. Evaluation of transgenic sweet corn hybrids expressing Cry1Ab toxin for resistance to corn earworm and fall armyworm (Lepidoptera: Noctuidae). Journal of Economic Entomology. 92 (1): 246-252.
Lynch, R., J. Hamm, and R. Myers, 2000. Fall armyworm susceptibility to Cry1Ab toxin: 1999 evaluations. Unpublished study submitted to EPA (part of Syngenta Seeds’ 2000 IRM report). No MRID # 454381-01.
Mahaffey, J. S., J. S. Bacheler, J. R. Bradley, Jr., and J. W. Van Duyn, 1994. Performance of Monsanto’s transgenic B.t. cotton against high populations of lepidopterous pests in North Carolina, 1994 Proceedings Beltwide Cotton Conferences. National Cotton Council. pp. 1061-1063.
Mallet, J. and P. Porter, 1992. Preventing insect adaptation to insect-resistant crops: are seed mixtures or refugia the best strategy? Proc. R. Soc. Long. B 255: 165-169.
Marçon, P., B. Siegfried, T. Spencer, and W. Hutchinson, 2000. Development of diagnostic concentrations for monitoring Bacillus thuringiensis resistance in European corn borer (Lepidoptera: Crambidae). Journal of Economic Entomology. 93 (3): 925-930.
Mason, C.E., M.R. Graustein, and J. Whalen, 1983. Effects of cultivation practices on overwintering European corn borer populations. Published in: Progress Through Research and Extension, Part 1 - Crops Reports. Delaware Agricultural Experiment Station, University of Delaware. pp. 18-19.
Mason, C., and 9 others, 1996. European corn borer: ecology and management. USDA North Central Regional Extension Publication No. 327. Published by Iowa State University, Ames, IA.
Mason, C., J. Whalen, C. Keil, and R. Uniatowski, 1998. Impact of Bt crop protection technology on management of European corn borer in Delaware. Unpublished study submitted to EPA (part of Novartis’ 1998 IRM research report). MRID # 447439-01.
IID141

Bt Plant-Incorporated Protectants October 15, 2001 Biopesticides Registration Action Document
Matten, S.R., 1994. December 23, 1994 Memorandum to W. Nelson: Evaluation of Monsanto document (September 1, 1994) [D207200] “Strategies to maximize the utility and durability of Colorado potato beetle resistant potatoes”
Matten, S.R. (For Pesticide Resistance Management Workgroup), 1995. May 2, 1995 Memorandum to W. Nelson: Analysis of SAP and public comments on pesticide resistance management for the Cry3A delta endotoxin expressed in potatoes and the PRMW recommendations.
Matten, S.R., 1999. May 17, 1999 Memorandum to L. Hollis and W. Nelson: Review of Monsanto’s proposed amendment and product grower guides to include specific refuge requirements for transgenic potato products, NewLeaf (Bacillus thuringiensis (Bt) Cry3A delta endotoxin) and NewLeaf Plus (Bacillus thuringiensis (Bt) Cry3A delta endotoxin and the Potato Leaf Roll Virus resistance gene), EPA Reg. Nos. 524-474 and 524-498, Submission letter dated April 26, 1999.
Matten, S. R., P. I. Lewis, G. Tomimatsu, D. W. S. Sutherland, N. Anderson, and T. L. Colvin-Snyder, 1996. The U. S. Environmental Protection Agency’s Role in Pesticide Resistance Management. In Molecular Genetics and Evolution of Pesticide Resistance. T. M. Brown (ed.) pp. 243-253. American Chemical Society Symposium Series No. 645, American Chemical Society, Washington D. C.
Mellon. M. and J. Rissler, 1998. Now or Never: Serious New Plans to Save a Natural Pest Control. Ed. M. Mellon and J. Rissler. Union of Concerned Scientists. Cambridge, Massachusetts. Pp.149.
Mills, J.M. and J. W. Mullins, 2000. Bollgard Technical Use Guide. Monsanto Company. [submitted as part of the January 28, 2000 submission; Responses to Points in the January 5, 2000 EPA Letter.]
Mitchell, P., T. Hurley, and B. Babcock, 2000. Insuring the stewardship of Bt corn: a carrot versus a stick. Unpublished study submitted to EPA (part of Aventis’ 2000 IRM report). MRID # 454268-02.
Moar, W., 2000. Comments on Bt Monitoring Results. In: Monsanto’s Responses to Points in the January 5, 2000 EPA Letter, Submission dated January 28, 2000. Pp. 15-17.
Moar, W. J., M. Pusztai-Carey, H. Van Faasen, D. Bosch, R. Frutos, C. Rang. K. Luo, and M.J. Adang, 1995. Development of Bacillus thuringiensis CryIC resistance by Spodoptera exigua (Hübner) (Lepidoptera: Noctuidae). Applied and Environmental Microbiology. 61: 2086-2092.
IID142
Bt Plant-Incorporated Protectants October 15, 2001 Biopesticides Registration Action Document
Monsanto Company, 1999. December 16, 1999. Summary of December 9 Research Meeting in Montreal, Canada. [No MRID].
Monsanto Company, 2000. Monsanto proposed IRM plan for 2001; Response to EPA’s January 5, 2000 letter; Monsanto request to amend the 524-478 conditional registration to an non-expiring, section 3 (c)5 registration, January 28, 2000.
Moyer, D.D., 1993. Trapping Colorado potato beetles with plastic lined trenches. Suffolk County Agricultural News, February 1993, Riverhead, NY.
National Center for Food and Agriculture Policy, 1999. Agriculture biotechnology: insect control benefits. 98 pp.
National Cotton Council (NCC), 2000. Letter from National Cotton Council to Dr. Janet Andersen, Director (OPP/BPPD) dated May 3, 2000.
National Resource Council (NRC), 2000. Genetically modified pest-protected plants: Science and regulation. National Academy Press. Washington D.C.
NC-205 Regional Research Committee, 1998. Supplemental Report, Supplement to: Bt corn and European corn borer: long-term success through resistance management. October, 1998.
Onstad, D.W. and F. Gould, 1998. Modeling the dynamics of adaptation to transgenic maize by European corn borer (Lepidoptera: Pyralidae). Journal of Economic Entomology. 91 (3): 585-593.
Onstad, D.W. and C.A. Guse, 1999. Economic analysis of transgenic maize and nontrangenic refuges for managing European corn borer (Lepidoptera: Pyralidae). Journal of Economic Entomology. 92 (6): 1256-1265.
Orr, D.B. and D.A. Landis, 1997. Oviposition of European corn borer (Lepidoptera: Pyralidae) and impact of natural enemy populations in transgenic versus isogenic corn. Journal of Economic Entomology. 90 (4): 905-909.
Ortman, E., 1999. Personal communication (on behalf of NC-205) to Janet L. Andersen (OPP/BPPD). E-mail dated 5/24/99.
Ostlie, K. R., W. D. Hutchinson, and R. L. Hellmich, 1997a. Bt-corn & European corn borer: long-term success through resistance management. North Central Regional Extension Publication NCR 602.
Ostlie, K., J. Luedeman, and M. Frenchik, 1997b. Corn planting dates and management
IID143

Bt Plant-Incorporated Protectants October 15, 2001 Biopesticides Registration Action Document
strategies for European corn borer. Unpublished study submitted to EPA (part of Novartis’ 1997 IRM research report). MRID # 444754-01.
Patin, A.L., T.J. Dennehy, M.A. Sims, B.E. Tabashnik, Y-B. Liu, L. Antilla, D. Gouge, T. J. Henneberry, R. Staten, 1999. Status of pink bollworm susceptibility to Bt in Arizona. 1999 Proceedings of the Beltwide Cotton Conferences. National Cotton Council. Pp. 991-996.
Peck, S., F. Gould, and S. Ellner, 1999. Spread of resistance in spatially extended regions of transgenic cotton: implications for management of Helitohis virescens (Lepidoptera: Noctuidae). J. Econ. Entomol. 91(6): 1-16.
Perlak, F.J., T.B. Stone, Y.M. Muskopf, L.J. Peterson, G.B. Parker, S.A. McPherson, J. Wyman, S. Love, G. Reed, and D. Biever, 1993. Genetically improved potatoes: Protection from damage by Colorado potato beetles. Plant Molec. Bio. 22: 313-321.
Pilcher, C.D. and M.E. Rice, 1997. Descriptive statistics of 1996 Bt corn survey. Unpublished study submitted to EPA (part of Novartis’ 1997 IRM research report). MRID # 444754-01.
Rahardja, U., and M. E. Whalon, 1995. Inheritance of resistance to Bacillus thuringiensis subsp. tenebrionis CryIIIA delta-endotoxin in Colorado potato beetle (Coleoptera: Chrysomelidae). J. Econ. Entomol. 88: 21-26.
Reding, K., 2001a. 2000 Bollgard cotton on-farm grower compliance survey report. Unpublished study submitted to EPA by Monsanto. No MRID #.
Reding, K., 2001b. Letter and attachments to Dr. Janet Andersen (OPP/BPPD), May 31, 2001.
Rice, M.E., J.J. Obrycki, and C. Pilcher, 1997. Adjusting planting dates to manage European corn borer in transgenic Bt corn and non-Bt corn. Unpublished study submitted to EPA (part of Novartis’ 1997 IRM research report). MRID # 444754-01.
Rice, M.E. and C.D. Pilcher, 1999. Descriptive statistics of 1998 Bt corn survey. Unpublished study submitted to EPA (part of Novartis’ 1999 IRM research report). MRID # 450568-01.
Ross, S.E. and K.R. Ostlie, 1990. Dispersal and survival of early instars of European corn borer (Lepidoptera: Pyralidae) in field corn. Journal of Economic Entomology. 83 (3): 831-836.
Roush, R.T., 1994. Managing pests and their resistance to Bacillus thuringiensis: can transgenic crops be better than sprays? Biocontrol Science and Technology. 4: 501-516.
Roush, R.T., 1997a. Managing resistance to transgenic crops. In: Advances in insect control: the role of transgenic plants. (Ed. Carozzi, N. And Koziel, M.) Pp. 271-294 (Taylor and Francis,
IID144

Bt Plant-Incorporated Protectants October 15, 2001 Biopesticides Registration Action Document
London; 1997).
Roush, R. T., 1997b. Bt-transgenic crops: just another pretty insecticide or a chance for a new start in resistance management? Pesticide Sci. 61: 328-334.
Roush, R. T., and G. L. Miller, 1986. Considerations for design of insecticide resistance monitoring programs. J. Econ. Entom. 79: 293-298.
Schneider, J.C. and D. Cross, 1999. Summer survey of tobacco budworm and cotton bollworm populations in delta and hills of Mississippi: 1999 Report. In: Monsanto’s Responses to Points in the January 5, 2000 EPA Letter, Submission dated January 28, 2000.
Science Advisory Panel (SAP), Subpanel on Plant-Pesticides (March 1, 1995), 1995. A set of scientific issues were considered in connection with Monsanto company’s application for registration of a plant-pesticide containing the active ingredient Bacillus thuringiensis subsp. tenebrionis delta-endotoxins. (Docket Number: OPP-00401).
Scientific Advisory Panel (SAP), Subpanel on Bacillus thuringiensis (Bt) Plant-Pesticides (February 9- 10, 1998), 1998. Transmittal of the final report of the FIFRA Scientific Advisory Panel Subpanel on Bacillus thuringiensis (Bt) Plant-Pesticides and Resistance Management, Meeting held on February 9-10, 1998. Report dated, April 28, 1998. (Docket Number: OPPTS-00231).
Scientific Advisory Panel (SAP), Subpanel on Insect Resistance Management (October 18-20, 2000), 2001. Report: sets of scientific issues being considered by the Environmental Protection Agency regarding: Bt plant-pesticides risk and benefit assessments. Report dated, March 12, 2001. (Pp. 5-33)
Shelton, A.M., J.P. Nyrop, A. Seaman, and R.E. Foster, 1986. Distribution of European corn borer (Lepidoptera: Pyralidae) egg masses and larvae on sweet corn in New York. Environmental Entomology. 15: 501-506.
Shelton, A. M. and R.T. Roush, 1999. False reports and the ears of men. Nature Biotechnology. 17 (9): 832.
Shelton, A.M., J.D. Tang, R.T. Roush, T. D. Metz, and E.D. Earle, 2000. Field tests on managing resistance to Bt-engineered plants. Nature Biotechnology. 18: 339-342.
Showers, W., R. Hellmich, M. Derrick-Robinson, and W. Hendrix III, 2001. Aggregation and dispersal behavior of marked and released European corn borer (Lepidoptera: Crambidae) adults. Env. Ent. 30(4): 700-710.
IID145
Bt Plant-Incorporated Protectants October 15, 2001 Biopesticides Registration Action Document
Siegfried, B., T. Spencer, and J. Nearman, 1999a. Monitoring Bt susceptibility of European cornborer and corn earworm to Cry1Ab. Unpublished study submitted to EPA (part of Monsanto’s1999 IRM research report). MRID # 450369-02.
Siegfried, B., T. Spencer, and J. Nearman, 1999b. Susceptibility of corn earworm to the Cry1Ab Bt endotoxin and validation of a diagnostic concentration. Unpublished study submittedto EPA (part of Novartis’ 1999 IRM research report). MRID # 450568-01.
Siegfried, B., T. Spencer, and J. Nearman, 1999c. Susceptibility of the European corn borer tothe Cry9C Bt endotoxin and validation of a diagnostic concentration. Unpublished studysubmitted to EPA (part of Aventis’ 1999 IRM research report). MRID # 451493-01.
Siegfried, B.D., T. Spencer, and J. Nearman, 2000a. Baseline susceptibility of the corn earworm(Lepidoptera: Noctuidae) to the Cry1Ab toxin from Bacillus thuringiensis. Journal of EconomicEntomology. 93(4): 1265-1268.
Siegfried, B.D., A.C. Zoerb, and T. Spencer, 2001. Development of European corn borer larvaeon Event 176 Bt corn: influence of survival and fitness. Entomologia Experimentalis et Applicata.100: 15-20.
Siegfried, B. and T. Spencer, 2000. Monitoring Bt susceptibility of European corn borertoCry1Ab: 2000 data summary. Unpublished study submitted to EPA (part of Monsanto’s 2000IRM report). MRID # 453205-02.
Simmons, A.L., T. J. Dennehy, B.E. Tabashnik, L. Antilla, A. Bartlett, D. Gouge, R. Staten, 1998. Evaluation of B.t. Cotton deployment strategies and efficacy against pink bollworm in Arizona. 1998 Proceedings of the Beltwide Cotton Conference. National Cotton Council. Pp. 1025-1030.
Sims, M.A., T. J. Dennehy, A. Patin, Y. Carrière, Y.-B. Liu, B. Tabashnik, L. Antilla, and M.Whitlow, 2001. Arizona’s multi-agency resistance management program for Bt cotton: Sustainingthe susceptibility of pink bollworm. 2001 Proceedings of the Beltwide Cotton Conference.National Cotton Council. 1175-1179.
Sims, S. B., J. T. Greenplate, T. B. Stone, M. A. Caprio, and F. L. Gould, 1996. Monitoringstrategies for early detection of Lepidoptera resistance to Bacillus thuringiensis insecticidalproteins. In Molecular Genetics and Evolution of Pesticide Resistance. T. M. Brown (ed.) Pp.229-242. American Chemical Society Symposium Series No. 645, American Chemical Society,Washington, D. C.
Song, Q., C. Luppens, and X. Gan, 2000. Monitoring the susceptibility of the southwestern cornborer, Diatraea grandiosella, to Bacillus thuringiensis toxin Cry1Ab. Unpublished studysubmitted to EPA (part of Monsanto’s 2000 IRM report). MRID # 453205-02.
IID146

Bt Plant-Incorporated Protectants October 15, 2001 Biopesticides Registration Action Document
Storer, N.P., F. Gould, and G.G. Kennedy, 1999. Evolution of regional-wide resistance in cotton bollworm to Bt cotton as influenced by Bt corn: Identification of key factors through computer simulation. 1999 Proceedings of the Beltwide Cotton Conference. National Cotton Council. 2: 952-956.
Storer, N.P., 2001. Personal communication to Sharlene R. Matten (OPP/BPPD). E-mail dated 4/19/01.
Sumerford, D., 1999. Abstract for Presentation at Cotton Incorporated Crop Management Seminar: “Cotton Production in the Southeast: New Technology for a New Millennium,” November 3-4, 1999, Augusta, GA.
Sumerford, D., 2001. Letter to Dan Mollenbeck, ABSTC IRM Subcommittee (1/24/01). Submitted to EPA (part of Monsanto’s 2000 IRM report). MRID # 453205-02.
Sumerford, D., 2001a. Personal communication to Sharlene R. Matten (OPP/BPPD). E-mail dated 8/20/01.
Sumerford, D., 2001b. Personal communication to Sharlene R. Matten (OPP/BPPD). E-mail dated 9/24/01.
Sumerford, D. and D. Hardee, 2000a. Comments on Bt Resistance Monitoring at Stoneville, MS. In: Monsanto’s Responses to Points in the January 5, 2000 EPA Letter, Submission dated January 28, 2000. Pp. 14.
Sumerford, D. and D. Hardee, 2000b. Monitoring studies for cotton: Drs. Sumerford and Hardee USDA-ARS-SIMRU, Stoneville, MS. May 2000.
Sumerford, D. and D. Hardee, 2001. Note: Summary of 2000 Bt resistance monitoring as of 4 January 2001. (1 p.)
Sumerford, D.V., D.D. Hardee, L.C. Adams, and W.L. Solomon, 1999. Status of Monitoring for Tolerance to Cry1Ac in populations of Helicoverpa zea and Heliothis virescens: Three-year summary. 1999 Proceeding of the Beltwide Cotton Conferences. Pp. 936-939.
Sumerford, D.V., D.D. Hardee, L.C. Adams, and W.L. Solomon, 2000. Tolerance to Cry1Ac in populations of Helicoverpa zea and Heliothis virescens (Lepidoptera: Noctuidae): Three-year summary. J. Econ. Entomol. Submitted.
Tabashnik, B. E., 1994a. Evolution of resistance to Bacillus thuringiensis. Annu. Rev. Entomol. 39: 47-79.
IID147

Bt Plant-Incorporated Protectants October 15, 2001 Biopesticides Registration Action Document
Tabashnik, B.E., 1994b. Delaying insect adaptation to transgenic plants: seed mixtures and refugia reconsidered. Proc. R. Soc. Lond. Ser. B 255: 7-12.
Tabashnik, B. E., N. Finson, M. W. Johnson, and W. J. Moar, 1993. Resistance to toxins from Bacillus thuringiensis subsp. aizawai in the diamondback moth (Lepidoptera: Plutellidae). Appl. And Environ. Microbiol. 59: 1332-1335.
Tabashnik, B. E., N. Finson, F. R. Groeters, W. J. Moar, M. W. Johnson, K. Luo, and M. J. Adang, 1994. Reversal of resistance to Bacillus thuringiensis in Plutella xylostella. Proc. Natl. Acad. Sci. USA 91: 4120-2124.
Tabashnik, B. E., Y.-B. Liu, N. Finson, L. Masson, and D. G. Heckel, 1997. One gene in diamondback moth confers resistance to four Bacillus thuringiensis toxins. Proceedings of the National Academy of Science USA. 94: 1640-1644.
Tabashnik, B.E., A. L. Patin, T.J. Dennehy, Y.-B. Liu, Y. Carrière, M.A. Sims, and L. Antilla, 2000. Frequency of resistance to Bacillus thuringiensis in field populations of pink bollworm. PNAS. 97: 12980-12984.
Tabashnik, B.E., A.L. Patin, T.J. Dennehy, Y.-B. Liu, E. Miller, and R.T. Staten, 1999. Dispersal of pink bollworm (Lepidoptera: Gelechiidae) males in transgenic cotton that produces a Bacillus thuringiensis toxin. J. Econ. Entomol. 92(4): 772-780.
Tabashnik, B.E., R.T. Roush, E.D. Earle, A.M. Shelton, 2000. Resistance to Bt toxins. Science 287: 42.
Tang, J. D., A. M. Shelton, J. Van Rie, S. De Roeck, W. J. Moar, R. T. Roush, and M. Peferoen, 1997. Toxicity of Bacillus thuringiensis spore and crystal protein to resistant diamondback moth (Plutella xylostella). Applied Environmental Microbiology. 62: 564-569.
Trisyono, A and M. Chippendale, 1999. Monitoring the susceptibility of the Southwestern corn borer, Diatraea grandiosella, to Bacillus thuringiensis. Unpublished study submitted to EPA (part of Monsanto’s 1999 IRM research report). MRID # 450369-02.
Trisyono, A. and M. E. Whalon, 1997. Fitness costs of resistance to Bacillus thuringiensis in Colorado potato beetle (Coleoptera: Chrysomelidae). J. Econ. Entomol. 90: 267-271.
U.S. Environmental Protection Agency, 1998. The Environmental Protection Agency's White paper on Bt Plant-Pesticide Resistance Management. U.S. EPA, Biopesticides and Pollution Prevention Division (7511W), 401 M Street, SW, Washington, D.C. 14 January 1998. [EPA Publication 739-S-98-001]
IID148

Bt Plant-Incorporated Protectants October 15, 2001 Biopesticides Registration Action Document
U.S. Environmental Protection Agency and U.S. Department of Agriculture, 1999a. EPA/USDA Position Paper on Insect Resistance Management for Bt Crops. http://www.epa.gov/pesticides/biopesticides/otherdocs/bt_position_paper_618.htm (posted June 18, 1999; minor revisions July 12, 1999).
U.S. Environmental Protection Agency and U.S. Department of Agriculture, 1999b. Report of the EPA/USDA Workshop on Bt Crop Resistance Management in Corn, Rosemont, IL, June 18, 1999. P.A. Stewart, ed. 88 p. American Farmland Trust, Center for Agriculture in the Environment. (Posted at http://www.epa.gov/pesticides/biopesticides).
U.S. Environmental Protection Agency and U.S. Department of Agriculture, 1999c. Report of EPA/USDA Workshop on Bt Crop Resistance Management in Cotton. Memphis, Tennessee. August 26, 1999. Esther Day, ed. 80 p. American Farmland Trust, Center for Agriculture in the Environment. (Posted at http://www.epa.gov/pesticides/biopesticides).
U. S. Environmental Protection Agency, 2000. Pesticide Fact Sheet for Bacillus thuringiensis subsp. tenebrionis CryIII(A) Delta-Endotoxin and the Genetic Material Necessary for Its production in Potato. (Posted at http://www.epa.gov/pesticides/biopesticides).
Van Duyn, J., 1998. Large scale replicated field trials of representative commercial Bt and non-Bt corn hybrids to establish relative insect resistance, yield performance, and commercial value. Unpublished study submitted to EPA (part of Mycogen’s 1998 IRM research report). MRID # 448545-01.
Van Duyn, J., 2000. Personal communication to Dr. S. Matten, EPA/BPPD. E-mail dated March 14, 2000.
Van Duyn, J., 1999. Personal communication to Dr. S. Matten, EPA/BPPD. E-mail dated May 7, 1999.
Van Duyn, J., W. Modlin, and N. Storer, 1997. Large scale replicated field trials for representative commercial Bt and non-Bt corn hybrids to establish insect resistance, yield performance, and commercial value. Unpublished study submitted to EPA by Novartis. MRID # 443474-01.
Van Duyn, J., W. Modlin, and A. Summerlin, 1998. Evaluations of Bt corn hybrids against selected corn pests: 1998. Unpublished study submitted to EPA (part of Novartis’ 1998 IRM research report). MRID # 447439-01.
Van Duyn, J., B. Layton, and R. Bagwell, 2000. March 22, 2000 Letter to Dr. Janet Andersen, Director/BPPD and attached position paper entitled “Resistance Management Options for Bollgard Cotton.”
IID149

Bt Plant-Incorporated Protectants October 15, 2001 Biopesticides Registration Action Document
Van Rie, J., S. Jansens, H. Hofte, D. Degheele, and H. Van Mellaert, 1990. Receptors on the brush border membrane of the insect midgut as determinants of the specificity of Bacillus thuringiensis delta-endotoxins. Applied Environmental Microbiology. 56: 1378-1385.
Venette, R.C., W.D. Hutchison, and D.A. Andow, 2000. An in-field screen for early detection and monitoring of insect resistance to Bacillus thuringiensis in transgenic crops. Journal of Economic Entomology. 94(4): 1055-1064.
Walker, K., R. Hellmich, and L. Lewis, 1999. Injury by late-instar European corn borer (Lepidoptera: Crambidae) on Bacillus thuringiensis (Bt) transgenic corn. Journal of Economic Entomology. Submitted.
Wang, Z., R.L. Hellmich, and L.C. Lewis, 2000. Effects of pollen, husks, silks, and kernels of transgenic corn hybrids on survival of European corn borer (Lepidoptera: Crambidae) larvae. Journal of Economic Entomology. In press.
Watson, T.F., 1995. Impact of transgenic cotton on pink bollworm and other lepidopteran insects. 1995 Proceedings Beltwide Cotton Conferences. National Cotton Council. Pp. 759-760.
Weber, D.C. and D. N. Ferro, 1993. Distribution of overwintering Colorado potato beetle in and near Massachusetts potato fields. Entomol. Exp. Appl. 66: 191-196.
Weisz, R., Z. Smilowitz, and S. Fleischer, 1996. Evaluating risk of Colorado potato beetle (Coleoptera: Chrysomelidae) infestation as a function of migratory distance. J. Econ. Entomol. 89: 435-441.
Whalen, J. and M. Spellman, 1999. Insect control in late planted Bt sweet corn - 1998. Unpublished study submitted to EPA (part of Novartis’ 1999 IRM research report). MRID # 450568-01.
Whalon, M.. and D. Ferro, 1998. Bt-potato resistance management. In: Now or never: Serious new plans to save a natural pest control. M. Mellon and J. Rissler [eds.]. Union of Concerned Scientists, Two Brattle Square, Cambridge, MA.
Whalon, M. E., D. L. Miller, R. M. Hollingworth, E. J. Grafius, and J. R. Miller, 1993. Selection of Colorado potato beetle (Coleoptera: Chrysomelidae) strain resistant to Bacillus thuringiensis. J. Econ. Entomol. 86: 226-233.
Wierenga, J. M., D. L. Norris, M. E. Whalon, 1996. Stage-specific mortality of Colorado potato beetle (Coleoptera: Chrysomelidae) feeding on transgenic potatoes. J. Econ. Entomol. 89: 1047-1052.
IID150

Bt Plant-Incorporated Protectants October 15, 2001 Biopesticides Registration Action Document
Williams, M. R., 1996. Cotton Insect Losses 1995. In. 1996 Proceedings of the Beltwide Cotton Conferences. National Cotton Council, Memphis, TN. Vol. 2: 670-689.
Williams, M. R., 1997. Cotton Insect Losses 1996. In. 1997 Proceedings of the Beltwide Cotton Conferences. National Cotton Council, Memphis, TN. Vol. 2: 834-853.
Williams, M. R., 1998. Cotton Insect Losses 1997. In. 1998 Proceedings of the Beltwide Cotton Conferences. National Cotton Council, Memphis, TN. Vol. 2: 904-925.
Williams, M. R., 1999. Cotton Insect Losses 1998. In. 1999 Proceedings of the Beltwide Cotton Conferences. National Cotton Council, Memphis, TN. Vol. 2: 785-808.
Williams, M. R., 2000. Cotton Insect Losses 1999. In. 2000 Proceedings of the Beltwide Cotton Conferences. National Cotton Council, Memphis, TN. Vol. 2: 887-913.
Zhao J-Z., Y-X. Li, H. L. Collins, and A. M. Shelton, 2001. Examination of the F2 screen for rare resistant alleles to Bacillus thuringiensis toxins in the diamondback moth (Lepidoptera: Plutellidae). Submitted to Journal of Economic Entomology.
Additional studies identified by MRID number:
44042501 Caprio, M.; Benedict, J. (1996) Biology of the Major Lepidopteran Pests on Cotton: (Bacillus thuringiensis var. kurstaki CryIA(c) Protein): Lab Project Number: 94-041E1. Unpublished study prepared by Monsanto Co. 82 p.
44258116 MacIntosh, S. (1997) Insect Resistance Management Plan: Bt Cry9C Corn. Unpublished study prepared by Plant Genetic Systems N.V. 454 p.
44347401 Stein, J. (1997) Research Reports Regarding the Interaction Between Corn Earworm (Helicoverpa zea) and Novartis Seeds' Insect Resistant Corn. Unpublished study prepared by Novartis Seeds, Inc. 151 p.
44475401 Stein, J. (1998) 1997 Growing Season Report for Event 176-Derived and BT11-Derived Corn. Unpublished study prepared by Novartis Seeds, Inc. 269 p.
44504201 MacIntosh, S. (1998) Updated Insect Resistance Management Plan: Bacillus thuringiensis Cry9C Corn. Unpublished study prepared by Plant Genetic Systems (America) Inc. 16 p.
44516601 Greenplate, J. (1998) Quantification of Bacillus thuringiensis Insect Control Protein (CryIA(c)) in Bollgard Cotton Fruit and Terminals as Affected by Plant Age: Lab
IID151

Bt Plant-Incorporated Protectants October 15, 2001 Biopesticides Registration Action Document
Project Number: 17400. Unpublished study prepared by Monsanto Co. 26 p.
44679601 MacIntosh, S.; Jansens, S.; Reed, J. et al. (1998) StarLink Corn: Insect Resistance Management Plan for a Bacillus thuringiensis Cry9C Corn Product. Unpublished study prepared by Plant Genetic Systems N.V. 16 p.
44743901 Stein, J. (1999) 1998 Growing Season Report for Event 176-Derived Field Corn, BT11-Derived Field Corn and BT11-Derived Sweet Corn. Unpublished study prepared by Novartis Seeds, Inc.-Field Crops-NAFTA. 202 p.
44744301 Newhouse, K. (1999) Yearly Reporting on the Acreage Planted to Starlink Corn. Unpublished study prepared by AgrEvo USA Company. 7 p.
44775301 Gustafson, K. (1999) MON 810 1998 Research Progress and Growing Season Sales Report: Lab Project Number: 99-088E. Unpublished study prepared by Monsanto Company. 405 p.
44543602 Bing, J. (1997) Establishment and Survival of Second Generation European Corn Borer on Event 176 Corn Hybrids: Lab Project Number: JB-97-02. Unpublished study prepared by Mycogen Seeds. 5 p.
44854501 Bystrak, P. (1999) 1998 Progress Report Activities Relating to Resistance Management in Event 176 Maize: Lab Project Number PB-98-01: PB-98-02: BS-98-01. Unpublished study prepared by Mycogen Seeds and University of Nebraska. 158 p.
44863301 Gustafson, K. (1999) Bollgard Cotton 1998 Research Progress and Growing Season Sales Report: Lab Project Number: 99-531E. Unpublished study prepared by Monsanto Company. 53 p.
45020101 Herman, R.A. and Korjagin, V.A. (1999) Microbial Bt Cry1F (truncated) Delta-Endotoxin: Maize Insect Pest Susceptibility Study. Unpublished study prepared by Dow and Pioneer.
45020114 Moellenbeck, D. and M. Peters (1999) Efficacy of Cry1F Events TC 1360 and TC 1507. Unpublished study prepared by Dow and Pioneer.
45020115 Masson, L., M. Adang, and G. Schwab (1999) Cry1F Binding Studies. Unpublished study prepared by Dow and Pioneer.
45029301 Greenplate, J. (2000) Impact of Bollgard Cotton on the Status of Secondary Lepidopteran Pests in Cotton: Lab Project Number: 94-041E/00-003E.
IID152

Bt Plant-Incorporated Protectants October 15, 2001 Biopesticides Registration Action Document
Unpublished study prepared by Monsanto Co. 15 p.
45029401 Reding, H. (2000) 1999 Bollgard Cotton Acreage Report: Lab Project Number: 94-041-E/00-004E. Unpublished study prepared by Monsanto Co. 31 p.
45036902 Stone, T. (2000) 1999 Research Progress and Growing Season Sales Report for MON 810 YieldGard Corn: Research Reports: Lab Project Number: 00-CR-001E. Unpublished study prepared by Monsanto Company. 76 p.
45056801 Stein, J. (2000) 1999 Growing Season Report for Event 176-Derived Field Corn, BT 11-Derived Field Corn and BT 11-Derived Sweet Corn: Lab Project Number. Unpublished study prepared by Novartis Seeds, Inc.-Field Crops-NAFTA. 138 p.
45131101 Bystrak, P., L. Higgins, D. Moellenbeck (2000) High Dose Demonstrations for Cry1F Events TC 1360 and TC 1507: European Corn Borer. Unpublished study prepared by Dow and Pioneer.
45149301 MacIntosh, S. (2000) Yearly Reporting (1999) On the Insect Resistance Management Plan of Starlink Corn. Unpublished study prepared by Aventis CropScience USA LP. 177 p.
45320503 Stone, T. (2001) Monsanto 2000 MON 810 Resistance Management Grower Education Program. Unpublished study prepared by Monsanto Co. 43 p.
IID153