d. fistula first (ff) initiative. - the renal network · d. fistula first (ff) initiative. the...
TRANSCRIPT
D. Fistula First (FF) Initiative.
The development of Quality Improvement Projects (QIP) is mandated in the ESRD Network
contracts with CMS. The QIPs are developed and directed by the MRB, then reviewed,
approved and monitored by the Board of Trustees. In 2011, the majority of quality
improvement efforts were focused on continuing and improving AV fistula rates through
the Fistula First Initiative.
Background: In 2003, all 18 of the ESRD Networks and CMS, along with clinicians,
dialysis providers, and patients, developed a three-year plan called the National
Vascular Access Improvement Initiative (renamed Fistula First in 2004). This plan
implements strategies for the improvement of patient vascular access outcomes to
reach the CMS goal and K/DOQI guidelines for AV fistula use of >65% prevalence.
Fistula First aims to build on established methods to increase fistula use, and to take
advantage of system-level diagnosis and strategies for improvement. Collaboration
between ESRD Networks, providers, physicians, vascular surgeons, and health
professionals is key to spreading the change ideas for improving AV fistulas.
2011 Primary objectives:
To increase the prevalence rate of AV fistula in Network 9 from 54.2 percent in
March 2011 to 56.6 percent in March 2012 (an increase of 2.4 percentage
points) and to increase Network 10 from 57.2 percent in March 2011 to 59.0
percent in March 2012 (an increase of 1.8 percentage points).
To increase the awareness of early referral for vascular access in the incident
CKD patient.
To educate providers, physicians, and vascular access surgeons on
documentation of AV fistula assessment pre-hemodialysis access placement.
To educate providers, physicians, and vascular access surgeons on the AV fistula
improvement strategy.
To provide resources and tools to providers to assist with developing initiatives
for placement and assessment of AV fistula and catheter reduction.
To educate medical directors, providers, and the facility interdisciplinary team on
the best practices of a Quality Assessment and Performance Improvement
(QAPI) program for vascular access management.

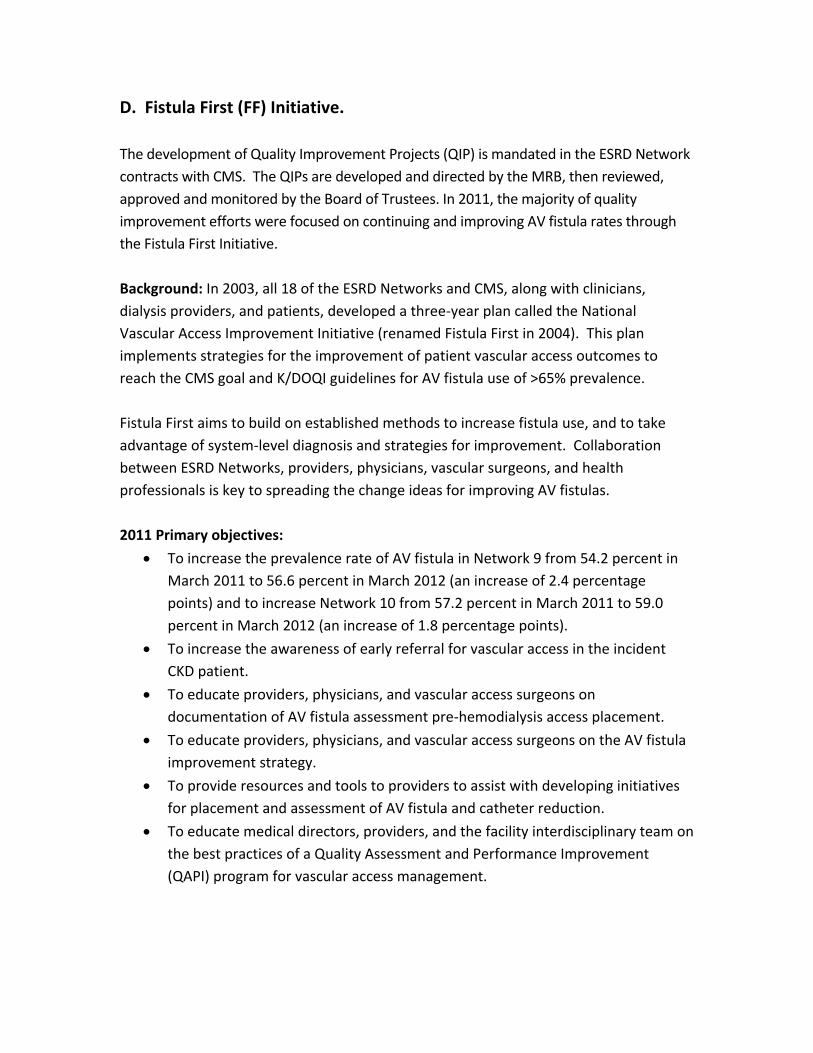
Progress toward these goals by December 2011 is detailed in Figure 44:
Figure 44.
Network 9/10
Fistula First Percentages
Fistula Prevalence as of December 2011
Network 9
Achieved Goal in Sep’11
Network 10
Achieved Goal in Jul’11 K/DOQI
Guidelines
CMS
‘Stretch’
Goal Mar’11 Dec’11 Mar’11 Dec’11
Fistula
Prevalence 54.2% 57.1% 57.2% 59.4% >65% 66%
Actions. The national Fistula First Breakthrough Initiative (FFBI) coalition conducted an
extensive root cause analysis in 2009. This root cause analysis was used to develop a
strategic plan that identified priority areas to be addressed.
The following seven strategies were developed into an operational plan to increase the
AV fistula utilization rate to 66% in prevalent hemodialysis patients for ESRD Networks
and to assist Quality Improvement Organizations (QIOs) in reducing the gap between
the statewide baseline AV fistula rate and 66% for incident hemodialysis patients:
Strategy 1: Nephrologist as Leader - Encourage and support nephrologists to take
a leadership role and be accountable for vascular access management in all
hemodialysis patients.
Strategy 2: Leveraging Partnerships - Partner to improve AV fistula placement
and utilization rates.
Strategy 3: Hospital Systems - Modify hospital systems to promote AV fistula
placement.
Strategy 4: Patient Self-Management - Promote patient self-management
throughout the stages of chronic kidney disease.
Strategy 5: Addressing Access Problems - Promote fast-track protocols for rapid
identification and referral of vascular access problems which include failure to
mature, revision of the failing AV fistula, and placement of an AV fistula.
Strategy 6: Practitioner Training and Credentialing - Promoting training,
experience, and credentialing of healthcare professionals in the area of
hemodialysis vascular access management.
Strategy 7: FFBI Change Concepts - Expand and endorse the current Change
Concepts for education and promotion throughout the renal, surgical, and
interventional communities.
The staff of Network 9/10 utilized tools and resources from www.fistulafirst.org for
education and technical support and marketed new tools that were developed through
FFBI to providers and professionals. The staff of Network 9/10 participated on FFBI
activities at the national, regional and local level.
The Quality Improvement Department continued to market the vascular access management resources handbook that was developed in 2010. The 3P’s (Prevention of Catheters, Placement and Use of AVF, Preservation of AVF) of Vascular Access Success Handbook was developed using best practice protocols, algorithms, and many of the tools provided on the FFBI Web site. The intent of the “3 P’s” handbook is to guide hemodialysis vascular access improvement efforts and change existing practices through Quality Assessment and Performance Improvement (QAPI) projects. This handbook brings together a number of best-practice concepts and suggested tools in support of those concepts. A 3Ps Toolkit was posted on The Renal Network, Inc. Web site, www.therenalnetwork.org, providing all available tools electronically that addresses Prevent Catheter, Place and Use Fistula, and Preserve Fistula.
Nationally, Network 9/10 participated on the FFBI conference calls for Network Quality
Improvement Directors (QIDs) on February 9, March 9, April 13, May 18, June 8, July 13,
August 10, October 12, November 9, and December 21, 2011.
Vascular Access Advisory Panel Coalition. A panel of experts oversees the Fistula First
Initiatives, under the direction of the MRB. This Vascular Access Advisory Panel Coalition
(VAAPC) was organized at the beginning of the Fistula First Initiative in 2004. The VAAPC
continued its activities during 2011.
Members of the panel include:
Tim Pflederer, M.D., Chair Renal Care Associates Peoria Illinois
Stephen Adley, R.N. FMC North
Olmstead
Ohio
Anil Agarwal, M.D. Ohio State University Columbus Ohio
George Aronoff, M.D. University of Louisville Louisville Kentucky
Stephen Ash, M.D. Wellbound Lafayette Indiana
Michael Brier, Ph.D. University of Louisville Louisville Kentucky
Deepa Chand, M.D. Akron Children’s Medical Akron Ohio
Center
Catherine Colombo, R.N. Chicago Illinois
Peter DeOreo, M.D. Centers for Dialysis Care Cleveland Ohio
Mary Hammes, D.O. Woodlawn Dialysis Chicago Illinois
Richard Hellman, M.D. DCI Indianapolis Indianapolis Indiana
Mike Kraus, M.D. IU Medical Center Indianapolis Indiana
Gordon McLennan, M.D. Cleveland Clinic Cleveland Ohio
Prabir Roy-Chaudhury, M.D. University of Cincinnati Cincinnati Ohio
Marcia Silver, M.D. Metro Health Medical
Center
Cleveland Ohio
Louis Thibodeaux, M.D. General & Vascular Surgical
Specialists
Cincinnati Ohio
Jay B. Wish, M.D. University Hospitals of
Cleveland
Cleveland Ohio
The VAAPC is charged with developing and implementing strategies to achieve Fistula
First goals, under the direction of the MRB. The VAAPC met twice during 2011, once in
May and once in October. Conference calls were scheduled during interim times to
continue the work of this advisory body. Reports of VAAPC activities were made
continuously to the MRB. Network staff participates on the national FFBI coalition, so
ideas between these two groups are shared routinely.
Data Distribution. Fistula First Facility Specific Reports were sent to all hemodialysis
programs in February 2011 to show fourth quarter 2010 data, June 2011 to show first
quarter 2011 data, September 2011 to show second quarter 2011 data, and December
2011 to show third quarter 2011 data. Fourth quarter 2011 data will be sent in February
2012.
This quarterly FF data report gives facilities the number of prevalent fistula needed to
meet fistula percentage goals based on the total number of patients and the number of
patients with a fistula in their facility. It displays graphs illustrating quarterly results, as
well as progress over time compared to the state, Network and United States where
applicable. It also graphs same population size facilities to each other in their Health
Service Area (HSA) so that facilities can use this report to compare themselves to other
facilities of like size regarding AV fistula rates in their area.
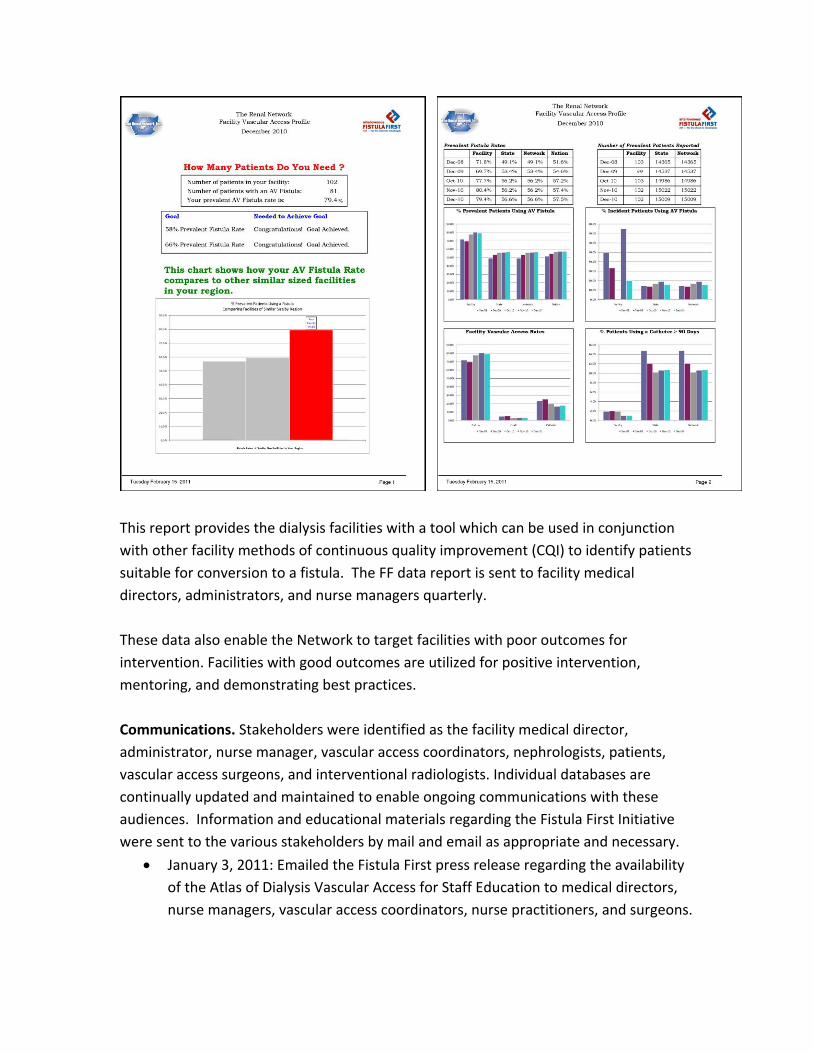
This report provides the dialysis facilities with a tool which can be used in conjunction
with other facility methods of continuous quality improvement (CQI) to identify patients
suitable for conversion to a fistula. The FF data report is sent to facility medical
directors, administrators, and nurse managers quarterly.
These data also enable the Network to target facilities with poor outcomes for
intervention. Facilities with good outcomes are utilized for positive intervention,
mentoring, and demonstrating best practices.
Communications. Stakeholders were identified as the facility medical director,
administrator, nurse manager, vascular access coordinators, nephrologists, patients,
vascular access surgeons, and interventional radiologists. Individual databases are
continually updated and maintained to enable ongoing communications with these
audiences. Information and educational materials regarding the Fistula First Initiative
were sent to the various stakeholders by mail and email as appropriate and necessary.
January 3, 2011: Emailed the Fistula First press release regarding the availability
of the Atlas of Dialysis Vascular Access for Staff Education to medical directors,
nurse managers, vascular access coordinators, nurse practitioners, and surgeons.
February 7, 2011: Emailed nurse managers, vascular access coordinators, and
medical directors marketing the Network’s AVF Assessment and Cannulation
Resources page on the Web site.
February 8 and 10, 2011: A Vascular Access Success Stories webinar was held;
547 participants attended.
March 2011: A poster was created, entitled “Are You Using the Gold Standard,”
with input from the PLC and MRB. This poster was sent to facilities, along with
patient stories about their fistula journeys to assist them when helping patients
identify the AVF as the best access.
March 3, 2011: Emailed announcement concerning 2010 Fistula First
Comprehensive Fistula Construction and Management Program for Surgeons:
“How to Make Fistulas that Work” that was held in Chicago, Illinois in November
2010 was available on HDCN website and linked to from the FFBI website to
medical directors, nurse managers, vascular access coordinators, nurse
practitioners, and surgeons.
May 23, 2011: A Cannulation Camp was held in northern Indiana/Chicago, Illinois
area. The agenda consisted of vascular access assessment, cannulation, and
QAPI principles. 168 participants attended this educational offering
June 7, 2011- A Cannulation Camp was held in Cincinnati, Ohio. The agenda
consisted of vascular access assessment, cannulation, and QAPI principles. 160
participants attended this educational offering.
August 9 and 11, 2011: An “Improving Incident Vascular Access Outcomes
Through Physician Group Practice QAPI” webinar was held. Discussion
surrounded areas to consider for improving vascular access outcomes regarding
AVF placement, maintenance, and monitoring. A total of 70 facility
representatives from Network 9 and 27 facility representatives from Network 10
attended the webinar over the two days. There were 27 physicians that
attended this webinar.
August 16, 2011: A save the date flyer regarding the Fistula First Comprehensive
Fistula Construction and Management Program for Surgeons was emailed to
surgeons and medical directors in the Network 9/10 area. This program was
presented by Network 5 and Network 6 on December 2, 2011 in Atlanta, GA.
September 13, 2011: A learning session entitled “Saving Lives-One Dialysis
Treatment at a Time” was held in Indianapolis, IN. One of the presentations
focused on AVF assessment and monitoring. There were a total of 230
attendees at the learning session; 170 participants represented Network 9 and
60 participants represented Network 10.

October 4 and 5, 2011: The “66% AVF rates-Attainable & Sustainable” webinar
was held. There were two presentations regarding best practices in the areas of
AVF placement, maintenance, and monitoring. There were 81 participants from
Network 9 and 39 participants from Network 10.
October 6, 2011: Emails were sent to nephrologists, administrators, nurse
managers, and vascular access coordinators in Networks 9 and 10. This email
announced changes to the FFBI Change Concept #7. There was a clarification to
the statement that nephrologists should not admit “catheter only” patients.
October 27, 2011: A Vascular Access Informational Webinar for non-
intervention small facilities was held. Discussion surrounded areas to consider
for small facilities to improve vascular access outcomes regarding AVF
placement, maintenance, and monitoring.
October 27, 2011: A Vascular Access Informational Webinar for non-
intervention facilities that have not made improvement was held. Discussion
surrounded areas to consider for facilities to improve vascular access outcomes
regarding AVF placement, maintenance, and monitoring.
November 30, 2011: Surgeon reports were sent to surgeons in Networks 9 and
10. These reports utilized 2007 and 2009 Medicare Part B claims data from CMS
and made available to Networks through FFBI.
December 2, 2011: An announcement was emailed regarding new videos on the
FFBI website illustrating AV Fistula physical exam. The announcement was sent
to nephrologists, administrators, nurse managers, and vascular access
coordinators in Networks 9 and 10.
Physician specific incident CKD patient vascular access data reports were sent to
nephrologists in July 2011 (January 2, 2011 – June 30, 2011 incident data) and
February 2012 (July 1, 2011 – December 31, 2011 incident data). The
information provided on this report is generated from the CMS 2728 Medical
Evidence and Medicare Entitlement form and displays the percent of accesses a
nephrologist’s patients were using when they began ESRD.
Facility Vascular Access Coordinators (VAC) were sent bi-monthly electronic
newsletters listing vascular access management and QAPI resources and tools.
Each newsletter had a different theme/topic presented.
Medical director letters were sent twice in 2011 providing information on
vascular access interim outcomes, reminding of the goal, and stressing the
importance of improving processes.
To promote Fistula First goals continuously, educational resources have been
developed which can be easily shared. The Fistula First page on the Network
Web site was updated regularly adding the above mentioned materials as they
were provided by mail or email. The materials provided to our stakeholders
were developed both from Networks 9/10 and the national Fistula First
Breakthrough Initiative.
The Network has acted as a community outreach partner by providing
information on Fistula First through conference calls quarterly to state surveyor
groups and the quality improvement organizations.
Conference Calls, Site Visits, and Presentations. Network staff conducted many
individual facility conference calls and also conducted some site visits in 2011. Staff also
partnered with LDOs to present at physician meetings and quality meetings.
March 17, 2011: A DaVita Medical Director Summit was held in Cincinnati, Ohio.
The Network Executive Director partnered with DaVita management to present
medical director responsibilities regarding vascular access management and AV
fistula improvement to DaVita facility medical directors.
March 22, 2011: The Executive Director presented to the Central Indiana
nephrology group practices as a follow-up from June 2010. The agenda focused
on barriers to fistula placement and use, and medical director responsibilities.
April 4, 2011: A DaVita Medical Director Summit was held in Indianapolis,
Indiana. The Network Executive Director partnered with DaVita management
and presented medical director responsibilities regarding vascular access
management and AV fistula improvement to DaVita facility medical directors.
July through September 2011: The quality improvement staff worked one-on-
one with 30 QIP facility nurse managers in Network 9, and 11 QIP facility nurse
managers in Network 10, providing technical assistance in QAPI processes and
requested materials to improve vascular access management outcomes.
August 11, 2011: The Executive Director, the Vascular Access Advisory Panel
Coalition Chair, and the Quality Improvement Director conducted a meeting with
two medical directors from FMC facilities in Indianapolis, IN with high catheter
and low fistula rates. Discussion surrounded physician office and dialysis facility
processes, barriers to improvement, and suggestions on how to improve vascular
access management outcomes.
August 25, 2011: The Executive Director, the Vascular Access Advisory Panel
Coalition Chair, and the Quality Improvement Director conducted a meeting with
two additional medical directors from FMC facilities in Indianapolis, IN with high
catheter and low fistula rates. Discussion surrounded physician office and
dialysis facility processes, vascular access center processes, barriers to
improvement, and suggestions on how to improve vascular access management
outcomes.

October through December 2011: The quality improvement staff worked, one-
on-one, via telephone with 45 QIP facility nurse managers in Network 9 and 43
QIP facility nurse managers in Network 10 providing technical assistance in QAPI
processes and requested materials to improve vascular access management
outcomes.
November 3, 2011: The Vascular Access Advisory Panel Coalition Chair presented
at a FMC Summit in Indianapolis, IN focused on nephrologists and medical
directors. Discussion surrounded areas to consider for improvement in vascular
access outcomes regarding AVF placement, maintenance, and monitoring.
2010-2011 Fistula First Completed Projects
The following activities were designed as components of the 2010-2011 Fistula First
quality improvement project and were completed in March 2011.
There were two intervention groups that were part of the 2010-2011 Fistula First quality
improvement project:
1. Placement and Assessment of Fistula Intervention - facilities with at least 30
patients and fistula rates below 55% (poor performing facilities) submitted to the
Network a facility-specific root cause analysis and an action plan that was
updated quarterly.
Network 9 had 63 facilities participating and Network 10 had 23 facilities
participating in this intervention group.
2. Promising Stars Focus Group - facilities with at least 30 patients and fistula rates
between 55-62% (early adopters) received the 3Ps Vascular Access Management
Handbook. These facilities were asked to utilize at least one new tool and/or
process from the handbook and report to the Network quarterly on the
improvements made through the use of the handbook.
Network 9 had 71 facilities participating and Network 10 had 46 facilities
participating in this intervention group.
There is a third group that is discussed in the Facility Specific Quality Assessment and
Improvement Project area (Catheter Reduction QIP). This project, Catheter Out/Fistula
In: Targeting Catheter Reduction to Increase AV Fistula Rate (Catheter Reduction QIP),
while not in the Fistula First QIP specifically, does contribute to the increase of Network-
wide AV fistula rates and is tracked for fistula improvement as well as catheter
reduction.
Network 9 had 132 facilities participating and Network 10 had 60 facilities participating
in this intervention group.
This AV fistula rate improvement project incorporated an eight-step project model in
the two interventions, Placement and Assessment of Fistula and Promising Stars Focus
Group. The eight steps include:
1. Statistical analysis to identify facilities in need of intervention (facilities with
outcomes that were below 55% prevalent fistulas) and facilities that need extra
attention to continue improving fistula rates (facilities with outcomes between
55-62% prevalent fistulas).
2. Conducting root cause analysis with targeted facilities to discover barriers to
improvement at the facility level.
3. Requiring action plans that align with facility QAPI projects addressing barriers
from each facility targeted for intervention.
4. Providing conference calls for QIP participants and learning sessions for targeted
facilities on topics identified through the RCA.
5. Collecting facility specific data through the fistula first dashboard and providing
participating facilities with data feedback reports monthly.
6. Identifying benchmark facilities (defined as those facilities with either a fistula
rate at goal or increasing by at least one percentage point per quarter) and
sharing tools and resources with participating facilities.
7. Increasing the number of facility site visits and individual facility conference calls
for poor performers.
8. Analysis of facility specific data monthly to determine which facilities are
successfully achieving QIP goals and which facilities are in need of additional
intervention.
These interventions combined with an aggressive approach to data feedback in the non-
intervention facilities was used as the project design for this QIP. The following
interventions conducted:
Placement and Assessment of Fistula Intervention (<55%):
Tasks that were conducted for the place and monitor fistula intervention:
Facility medical directors, nurse managers, and administrators received an
introductory letter outlining their poor performance and an overview of the
project.
Facility staff submitted to the Network a RCA to identify barriers to improving
fistula rates in their facility.

Facility staff submitted to the Network an action plan detailing the steps to be
taken to improve fistula rates in their facility.
Facility staff submitted to the Network updated action plans at least quarterly.
Network staff evaluated the RCA and action plan and provided technical support
as needed on an individual facility basis.
The project was conducted over a nine month period with activities that included:
Evaluation of facilities’ monthly prevalent fistula rate increase (goal 0.33
percentage point) and feedback reports to facilities.
Facility site visits or conference calls for participants that did not meet the
monthly/quarterly goals.
Evaluation of project progress through the assessment of the facility vascular
access management action plan.
Additionally, the intervention included the following educational activities:
Month 2 – Facilities attend a QAPI/Vascular Access Management Best Practice
WebEx.
Month 3/5 -Facilities attend Vascular Access Management Learning Session
based on preventing catheters, placing and using fistula, and preserving fistula.
Month 7 - Facilities attend Vascular Access Management WebEx describing best
practice.
Promising Stars Focus Group Intervention (55-62%):
Tasks that were conducted for the Promising Stars intervention:
Facility medical directors, nurse managers, and administrators received an
introductory letter outlining their participation in this project and an overview of
the project.
Facility staff attended a “kickoff” WebEx describing the intervention project.
Facility staff chose at least one new tool and/or process from the 3Ps Vascular
Access Management Handbook.
Facility staff reported to the Network which tool they were using and reported
quarterly on the improvements made through the use of the handbook.
Network staff evaluated the tools selected with improvements made and
provided technical support as needed.
The project was conducted over a nine month period with activities that include:
Evaluation of facilities’ monthly prevalent fistula rate increase (goal 0.33
percentage point) and feedback reports to facilities.
Facility conference calls for participants that did not meet the monthly/quarterly
goals.
Evaluation of project progress through the reporting of the use of the handbook.
Additionally, the intervention includes the following educational activities:
Month 2 – Facilities attend a QAPI/Vascular Access Management Best Practice
WebEx.
Month 3/5 -Facilities attend Vascular Access Management Learning Session
based on preventing catheters, placing and using fistula, and preserving fistula.
Month 7 - Facilities attend Vascular Access Management WebEx describing best
practice.
This group was started in September 2010 giving it six months to achieve goal after the
start of the interventions.
Catheter Out/Fistula In: Targeting Catheter Reduction to Increase AV Fistula Rate:
This project, Catheter Out/Fistula In: Targeting Catheter Reduction to Increase AV
Fistula Rate (Catheter Reduction QIP), while not in the Fistula First QIP specifically, does
increase the number of facilities that will be focusing on vascular access management
and, in turn, will assist in increasing the Network-wide AV fistula rates.
See specific interventions discussed in the Facility Specific Quality Assessment and
Improvement Project area (Catheter Reduction QIP).
Network Wide Intervention:
Network 9/10 provides education, tools, and resources to address the identified barriers
to facility systems improving prevalent fistula rates.
There are 206 facilities in Network 9 and 73 facilities in Network 10 that are not
participating in the previous described interventions. These facilities either have fistula
rates >62% and/or have patient populations of less than 30. These facilities received the
resources and tools listed below as part of the Network wide intervention.
Each facility medical director and vascular access coordinator in Networks 9 and 10
received during 2010-2011:
1. A monthly outcomes feedback report including:
Prevalent fistula rates compared to region, state, Network, and US
A facility fistula rate ranking
Graphs displaying one year’s worth of prevalent fistula in use, catheter with
fistula maturing, catheter <90 days, and catheter >90 days rates
2. Bi-monthly electronic newsletter including:
Information on tools for changing facility processes
Important aspects of a successful QAPI program
3. Notification/invitation to educational programs:
One QAPI/Vascular Access Management Best Practice WebEx
One Vascular Access Management Learning Session providing tools and
resources on
o preventing catheters,
o placing and using fistula,
o and preserving fistula
One Vascular Access Management WebEx describing best practice
4. The 3Ps Vascular Access Management Handbook housing resources, tools, and
best practices regarding:
preventing catheters
placing and using fistula
preserving fistula
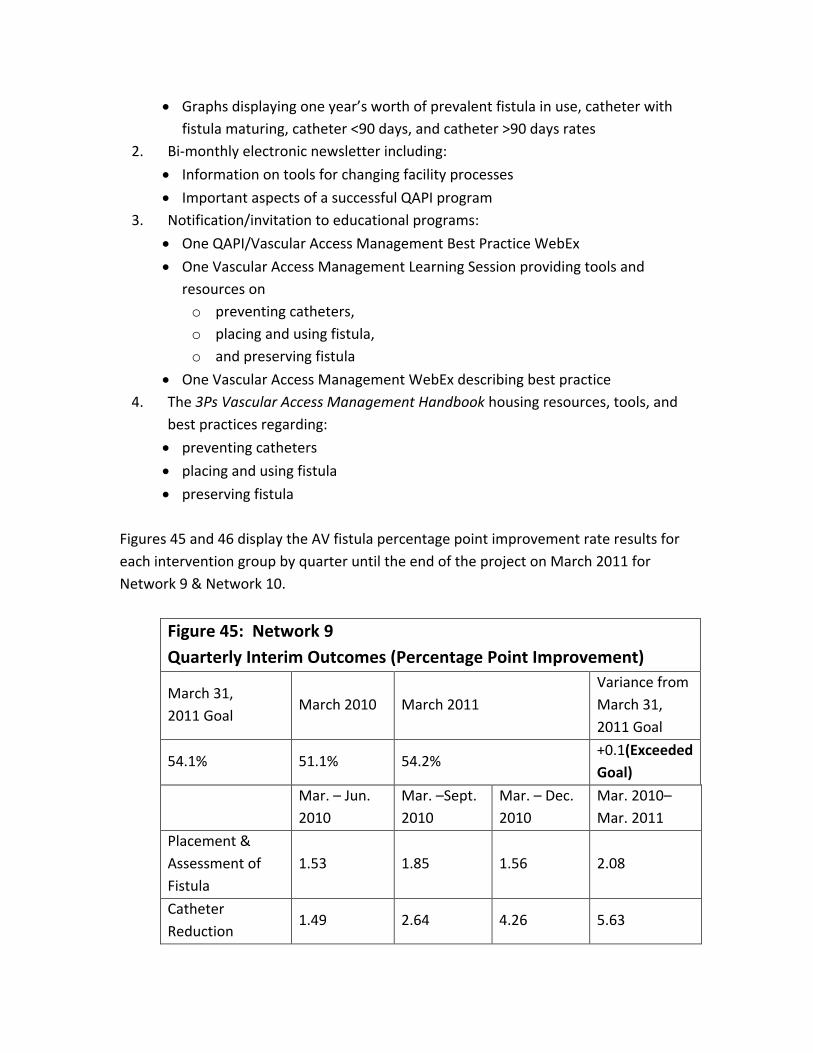
Figures 45 and 46 display the AV fistula percentage point improvement rate results for
each intervention group by quarter until the end of the project on March 2011 for
Network 9 & Network 10.
Figure 45: Network 9
Quarterly Interim Outcomes (Percentage Point Improvement)
March 31,
2011 Goal March 2010 March 2011
Variance from
March 31,
2011 Goal
54.1% 51.1% 54.2% +0.1(Exceeded
Goal)
Mar. – Jun.
2010
Mar. –Sept.
2010
Mar. – Dec.
2010
Mar. 2010–
Mar. 2011
Placement &
Assessment of
Fistula
1.53 1.85 1.56 2.08
Catheter
Reduction 1.49 2.64 4.26 5.63
Promising Stars
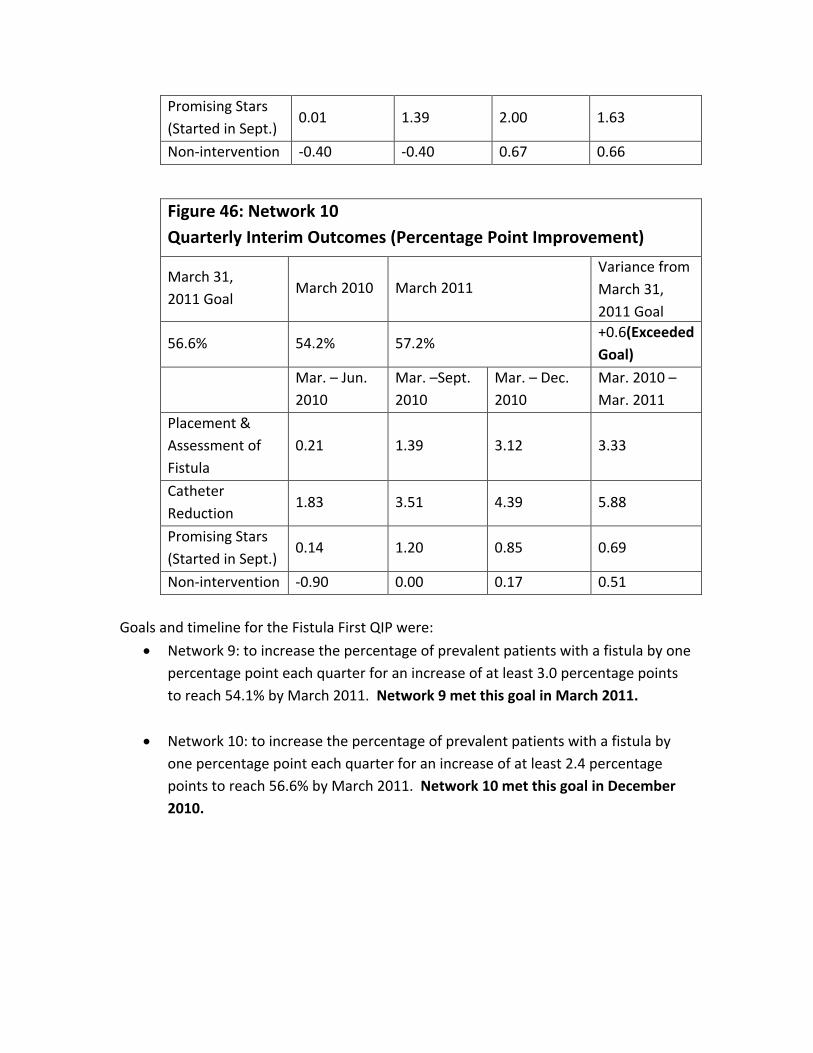
(Started in Sept.) 0.01 1.39 2.00 1.63
Non-intervention -0.40 -0.40 0.67 0.66
Figure 46: Network 10
Quarterly Interim Outcomes (Percentage Point Improvement) March 31,
2011 Goal March 2010 March 2011
Variance from
March 31,
2011 Goal
56.6% 54.2% 57.2% +0.6(Exceeded
Goal)
Mar. – Jun.
2010
Mar. –Sept.
2010
Mar. – Dec.
2010
Mar. 2010 –
Mar. 2011
Placement &
Assessment of
Fistula
0.21 1.39 3.12 3.33
Catheter
Reduction 1.83 3.51 4.39 5.88
Promising Stars
(Started in Sept.) 0.14 1.20 0.85 0.69
Non-intervention -0.90 0.00 0.17 0.51
Goals and timeline for the Fistula First QIP were:
Network 9: to increase the percentage of prevalent patients with a fistula by one
percentage point each quarter for an increase of at least 3.0 percentage points
to reach 54.1% by March 2011. Network 9 met this goal in March 2011.
Network 10: to increase the percentage of prevalent patients with a fistula by
one percentage point each quarter for an increase of at least 2.4 percentage
points to reach 56.6% by March 2011. Network 10 met this goal in December
2010.