cylos- final report · non-motorized transport (nmt) infrastructure, which attracts both choice and...
TRANSCRIPT

CyLOS- Final Report
SGArchitects Page 1 oni
Technical Advisor – TRIPP, IIT DELHI

CyLOS- Final Report
SGArchitects Page 2
LIST OF TABLES ...................................................................................................................................... 4
LIST OF FIGURES .................................................................................................................................... 4
PROJECT OVERVIEW: ........................................................................................................................... 6
1 BACKGROUND: ............................................................................................................................... 7
2 NEED OF THE STUDY ................................................................................................................... 8
3 GOAL AND OBJECTIVES ............................................................................................................... 9
3.1 Scope and Limitations ................................................................................................................................... 9
4 LITERATURE STUDY .................................................................................................................. 10
4.1 Evaluation Frame work ............................................................................................................................... 11
4.1.1 Evaluation Unit ......................................................................................................................................... 13
4.1.2 Context ..................................................................................................................................................... 13
4.1.3 User Type .................................................................................................................................................. 13
4.1.4 Infrastructure Settings - Mid block and Intersections .............................................................................. 14
4.1.5 Geometrics ............................................................................................................................................... 14
4.1.6 Environment and Enforcement ................................................................................................................ 14
4.1.7 Special Conditions .................................................................................................................................... 15
5 WORK PLAN AND METHODOLOGY ....................................................................................... 16
5.1 Work plan ................................................................................................................................................... 16
5.2 Methodology .............................................................................................................................................. 17
6 CYLOS TOOL – FRONT END INTERFACE .............................................................................. 18
6.1 Web Pages - Links ....................................................................................................................................... 18
6.1.1 Home: ....................................................................................................................................................... 18
6.1.2 Reports: .................................................................................................................................................... 19
6.1.3 User Manual: ............................................................................................................................................ 20
6.1.4 Getting Started: ........................................................................................................................................ 21
6.1.5 Contact us: ................................................................................................................................................ 22
6.2 Web Pages – Login and Registration ........................................................................................................... 23
6.3 Web Pages –Front end Forms ..................................................................................................................... 24

CyLOS- Final Report
SGArchitects Page 3
6.3.1 Selection of Evaluation type ..................................................................................................................... 24
6.3.2 Front-end Data input Methodology: ........................................................................................................ 25
6.4 Forms for Corridor/cycling route –Evaluation type ..................................................................................... 26
6.4.1 Corridor Segmentation: ............................................................................................................................ 29
6.4.2 Base -Data Form. ...................................................................................................................................... 29
6.4.3 Default Form. ............................................................................................................................................ 31
6.4.4 Segment Information Form. .................................................................................................................... 36
6.4.5 Design Data input Forms .......................................................................................................................... 37
6.4.6 Segment evaluation result Form – Segment Output Form....................................................................... 44
6.5 Forms for Transit access Influence area – Evaluation type .......................................................................... 47
6.6 Forms for City wide cycling Network – Evaluation type .............................................................................. 50
6.6.1 City Default data Form.............................................................................................................................. 51
6.6.2 City data input Forms ............................................................................................................................... 53
6.6.3 City Output Form ...................................................................................................................................... 57
7 BACK END COMPUTATION AND EVALUATION ................................................................. 59
7.1 Evaluation Methodology ............................................................................................................................ 59
7.2 Evaluation Framework: Cycling Corridor/Route .......................................................................................... 60
7.2.1 Indicators: Cycling Corridor/Route ........................................................................................................... 60
7.2.2 Indicators Formulation: Cycling Corridor/Route ...................................................................................... 68
7.2.3 Indicators: Transit access Influence area .................................................................................................. 69
7.2.4 Indicators Formulation: Transit access Influence area ............................................................................. 71
7.3 Evaluation Framework: City wide cycling network ...................................................................................... 71
7.3.1 Indicators: City wide cycling network ....................................................................................................... 72
7.3.2 Indicators Formulation: City wide cycling network .................................................................................. 75
8 CYLOS - EVALUATION WEIGHTAGES .................................................................................... 76
8.1.1 Need of weightages .................................................................................................................................. 76
8.1.2 Evaluation of weightages .......................................................................................................................... 76
8.1.3 Category and indicator weightages assigned in CyLOS tool – For Corridor and transit area evaluation . 81
8.1.4 Category and indicator weightages assigned in CyLOS tool – For City level evaluation ........................... 86
9 WAY FORWARD ........................................................................................................................... 89
10 ANNEXURE ................................................................................................................................ 90
10.1 Annexure 1 – Components used in derived indicators – Corridor/ route evaluation type. ..................... 90
10.2 Annexure 2 – Components used in derived indicators -Transit access area evaluation type................... 99

CyLOS- Final Report
SGArchitects Page 4
10.3 Annexure 3 – List of the participants (NMT workshop) .......................................................................... 99
10.4 Annexure 4 – Feed Back forms (NMT workshop) .................................................................................. 100
10.5 Annexure 5 – Survey Form for School Children – English Version ......................................................... 101
10.6 Annexure 6 – Survey Form For School Children – Hindi Version ........................................................... 106
10.7 Annexure 7 – Survey Audit Form. ......................................................................................................... 107
List of Tables Table 1: Literature studies ........................................................................................................... 11
Table 2: Literature study –Objective and Evaluation Frame work ............................................. 11
Table 3: Assumed weightages for each indicator and Category under Different conditions ... 77
List of Figures Figure 1: CyLOS development Stages .......................................................................................... 16
Figure 2: CyLOS Tool Main page or Home page .......................................................................... 18
Figure 3: About Us link in CyLOS Home Page ............................................................................. 19
Figure 4: ‘Reports’ Link Page ....................................................................................................... 20
Figure 5: ‘User Manual’ Link Page............................................................................................... 20
Figure 6: Getting Started page ..................................................................................................... 21
Figure 7: ‘Getting Started page’ with data requirement list and set of instructions for User .. 22
Figure 8: ‘Contact us’ Page ........................................................................................................... 22
Figure 9: User Login page ............................................................................................................. 23
Figure 10: Getting started Button ................................................................................................ 23
Figure 11: Registration details page ............................................................................................ 24
Figure 12: Evaluation Type Form ................................................................................................. 25
Figure 13: Error messages ............................................................................................................ 27
Figure 14: User Manual ................................................................................................................ 28
Figure 15: Base data form ............................................................................................................ 30
Figure 16: Default data form ........................................................................................................ 32
Figure 17: Standard Default data form ........................................................................................ 33
Figure 18: Scaling Default data form ........................................................................................... 34
Figure 19: Scoring Default data form........................................................................................... 35
Figure 20: Weightages Default data form ................................................................................... 35
Figure 21: Segment Information data form ................................................................................ 36

CyLOS- Final Report
SGArchitects Page 5
Figure 22: Design data Context form ........................................................................................... 38
Figure 23: Design data Midblock form ........................................................................................ 40
Figure 24: Design data Intersection and crossing form .............................................................. 42
Figure 25: Design data – Miscellaneous form ............................................................................. 43
Figure 26: Segment output form ................................................................................................. 44
Figure 27: Corridor output form .................................................................................................. 46
Figure 28: Links categorization .................................................................................................... 48
Figure 29: Base Data Form- Transit Access Influence area Evalaution ...................................... 49
Figure 30: Link Information Form- Transit Access Influence area Evaluation ........................... 49
Figure 31: Data input Form- Transit Access Influence area Evaluation ..................................... 50
Figure 32: City Default Data form ................................................................................................ 52
Figure 33: City Base Data form .................................................................................................... 54
Figure 34: City Evaluation Data form ........................................................................................... 55
Figure 35: City Check list .............................................................................................................. 57
Figure 36: City Output web form ................................................................................................. 58
Figure 37: Flow chart showing relationship between Categories, derived indicators and
Indicators ...................................................................................................................................... 61
Figure 38: Flow chart showing relationship between Categories, derived indicators and
Indicators ( transit access influence area .................................................................................... 70
Figure 39: Flow chart showing relationship between Categories, derived indicators and
Indicators ( City wide cycling Network) ....................................................................................... 73

CyLOS- Final Report
SGArchitects Page 6
Project Overview:
Project Title: Comprehensive Cycle Infrastructure Auditing and Design Tool (CyLOS)
Technical Advisor: Transport Research Injury Prevention Programme (TRIPP), IIT Delhi
Project Consultants: SGArchitects, New Delhi.
Project Web tool Developer:
Fazio Engineerware.
Project Sponsor: Shakti Sustainable Energy Foundation.
Project Duration: 360 days (1 Year).
Project Start Date: June-15th 2013.

CyLOS- Final Report
SGArchitects Page 7
1 Background: It can be expected that the government’s policies for boosting cycle use in the cities would
attract investments in street infrastructure improvement along with other measures, increasing
the potential of using cycling to combat GHGs in India. To realize the full potential of these
efforts, the infrastructure design would need to evolve around a detailed understanding of user
requirements as well knowledge to convert this understanding in to an effective design, which
would attract the desired use. To make this possible designers, planners, engineers etc., would
need to be equipped with relevant toolkits, guidelines and manuals. So far; in the absence of
any detailed regional design and evaluation tools, it is estimated that more than 75% of the
NMV infrastructure development under JnNURM (and other funded schemes) fails to meet user
requirements and expectations and thus attracts negligible or dismal use. Planning and
engineering solutions failed to integrate cycling in urban infrastructure; resulting in either over
segregation to block motorized two wheelers thus mostly excluding use; or reduced priority
resulting in bicycle network being compromised to motorized vehicular parking or lanes.
Recent efforts to produce such guidelines and toolkits include the NMT design guidelines being
developed by TRIPP, IIT Delhi. This effort furthers the work on ‘Manual for Cycling Inclusive
Urban Infrastructure Design’ initiated by I-Trans in association with SGArchitects. The manual is
being upgraded to a comprehensive NMT Planning and Design Guidelines, with inputs and
review from different experts.
This guideline provides an inventory of approaches and solutions for planning and designing of
NMT infrastructure in Indian cities. It is felt that this information along with NMT infrastructure
audit benchmarks (to be included in the guidelines) can be moulded in to a feature based, user
friendly interactive tool, which can accurately predict and/or evaluate the performance of a
proposed or existing infrastructure. The outputs from the tool would also include suggestions
on designs such as cross section arrangements, intersection details, etc., which will be useful for
planners and designers to make informed choices.

CyLOS- Final Report
SGArchitects Page 8
2 Need of the Study This project seeks to develop such a tool to help planners and designers develop an effective
Non-motorized transport (NMT) infrastructure, which attracts both choice and captive riders
and shall be called CyLOS or short for ‘Cycling Level of Service.’ The availability of such a tool
will direct attention and corrective action towards specific development, implementation and
operation issues, resulting in a user appropriate infrastructure. Such efforts in the long term,
when replicated across the city, would ensure better utility of investments made in non-
motorized transport, generating higher use and better public image. This data would also be
useful to CSO’s, NGOs, students, academicians and researchers, seeking to quantify the merits
and demerits of developed facilities; as well, effect policy level interventions to address
identified critical issues, which are beyond the limits of design solutions. These include, funding
of projects, capacity building, dis-incentivising private transport use, etc.

CyLOS- Final Report
SGArchitects Page 9
3 Goal and Objectives The final goal of the project is to develop a user friendly cycle infrastructure audit tool which
shall provide planners, designers and decision makers; information on infrastructure planning
and design shortcomings as well possible improvement strategies for both existing and
planned cycle infrastructure. However, this cannot be realized without exploring the tool to its
maximum potential. Hence to achieve the stated goal, the tool needs to be disseminated
amongst city officials, consultants, practitioners and the user groups, so the primary objectives
which can be drawn and needed to be fulfilled are:
1. Creating a comprehensive and user friendly web based tool which can evaluate detailed
Cycle infrastructure analysis for all the project cities. This tool would result in
development and creation of general set of context specific recommendations for Cycle
infrastructure development. Based on various alternative design scenario analyses of the
cities the report could be used in toolkits and manuals.
2. Training city officials and consultants to use CyLOS tool in order to develop cycle
infrastructure based on a comparative analysis of various alternative designs. The target
audience would include state and city level engineers, along with consultants involved in
the development of NMT corridors and plans in each city.
3. Enabling the cities to provide the project monitoring and sanctioning committees with a
detailed comparative analysis with respective outcomes to evaluate different alternative
design scenarios and their implications.
3.1 Scope and Limitations
As the idea of the project is to develop a user friendly tool for auditing cycle infrastructure and
design therefore the project is limited only to cycling infrastructure and users including bi and
tri cycle users.

CyLOS- Final Report
SGArchitects Page 10
4 Literature Study Evaluation of cycling infrastructure needs to be comprised of various elements and features in
terms of cycling requirements. These cycling requirements are categorized under five major
categories: Coherence, Directness, Safety, Comfort and Attractiveness.
Coherence – Coherence relates to the legibility and connectivity of the bicycle network. In
design, this implies that the segments in the network should look similar to improve the
legibility and usability of the bicycle infrastructure and there is provision of good connectivity
between all origins and destinations. Constant width ensured through design with adequate
widening at turns and rendering the same texture for typical scenarios across the network shall
help not only the cyclists to identify with it but also ensure motorists to be cautious at potential
locations .Elimination of any missing segments as well as standardization of intersections i.e.
the shape, size and form of each category of junction solution should be similar to help the
cyclist be aware of vehicular behaviour in the traffic mix. Also, use of various measures like
marking, signs and traffic calming measures across intersections improves coherence.
Safety – Relates to safety from accidents and security from crime. Prevention of collisions and
reducing the conflicts and their impact shall result in a safer travel. Provision of adequate and
uniform lighting ensures enhanced usability as well as safer streets. Integration of spaces for
hawkers and vendors, support facilities provides security and the necessary eyes on street.
Design of minimal conflicts (and sub-conflicts), introducing traffic calming and resolving
complexity by eliminating segregated left turning lanes, etc., makes safer intersection.
Directness – Directness of bicycle infrastructure has to do with the amount of time and effort
required by a cyclist to undertake a journey. Therefore, major detours from their natural path
should be avoided. As mentioned in ‘Design manual for bicycle traffic’ (CROW, June 2007),
directness has two components: in terms of distance and time. At intersections, directness in
time may be achieved by eliminating stopping/waiting for cyclists by introducing bicycle specific
grade separated infrastructure, defining the cyclists right of way and signals which eliminate or
reduce staged crossing and delays. Directness in distance for NMV users can be achieved by
eliminating any detours or long bends for cyclists at intersections, and by reducing or
eliminating stages in a crossing.
Comfort – Relates to physical comfort experience by cyclist, example shade and smooth ride.
Riding comfort is essential to bicycle infrastructure therefore the surface should be even and
free of cracks and potholes. Riding surface for cyclists at the intersection should be smooth to
reduce inconvenience. Water logging in the path of cyclist areas is uncomfortable and
therefore it is important that proper drainage should be provided with regular maintenance.
Also at intersections, traffic nuisances should be minimum. Segregation terminating up to the

CyLOS- Final Report
SGArchitects Page 11
stop line at high speed roads or high volume distributor and access roads will ensure cyclists
their Right Of Way (ROW) not obstructed by vehicular traffic.
Attractiveness – Relates to visual and physical attractiveness of the route environment. To
ensure attractiveness, it should be taken care that the path of the cyclist should be clean and
devoid of any material dumped that blocks movement. Else, it shall prevent the cyclist from
using the cycle infrastructure from the initial point and use the carriageway in unsafe
conditions. Location of spaces for hawkers and vendors, well integrated bus shelters, green
areas, resting spaces, etc. and shaded NMT infrastructure is definitely attractive
The understanding of such features and elements can be consolidated by combing the findings
and inferences from the various cycling infrastructure planning and design related guidelines,
manuals, thesis etc and for the purpose the following studies presented in the Table 1 have
been followed to develop the CyLOS tool.
Table 1: Literature studies
S.No Literature Study
1 Urban Road Safety audit (URSA)
2 Public Transport Accessibility Toolkit (PTA)
3 Parisar- Cycle track assessment report - Pune
4 H.C.M based tool developed by Dr. Joseph Fazio
5 Ph.D thesis by J.Himani
6 Bicycle Design Manual for Indian Subcontinent
The chapter focuses on the above mentioned literature reviews undertaken to extract the
significant indicators and parameters that can be used for evaluation of cycling infrastructure.
4.1 Evaluation Frame work
For the evaluation of any kind of infrastructure the foremost thing required is to develop an
evaluation frame work. This frame work is a methodology to approach the evaluation process.
As the prime objective is evaluation, it is observed that each study had a unique evaluation
frame work to rate the cycle infrastructure. Table 2 below presents the objective of the studies
and the evaluation frame work adopted for the same.
Table 2: Literature study –Objective and Evaluation Frame work
S.No Literature Study Objective Frame work
1 Urban Road Safety audit (URSA)
Identifying the indicators of safety in urban areas and provide comprehensive solution for urban road safety audit.
Frame work based on the street typology and the context.

CyLOS- Final Report
SGArchitects Page 12
2 Public Transport Accessibility Toolkit (PTA)
To define exact parameters, that can be used to describe Public Transport Accessibility.
Frame work based on the street typology and the context.
3 Parisar- Cycle track assessment report - Pune
Evaluation of cycle tracks based on the parameters- Continuality, safety and comfort.
Suggests a feature based evaluation frame work system.
4 H.C.M based tool developed by Dr. Joseph Fazio
To develop a tool for the purpose of evaluation of cycle infrastructure.
Reveals an evaluation network based on type of road and the infrastructure settings.
5 Ph.D thesis by J.Himani
To integrate critical parameters influencing cycling, including land use and street environment aspects.
Focuses on an evaluation frame work based on the user perception and context including road hierarchy and adjacent land use.
6 Bicycle Design Manual for Indian Subcontinent
To develop a cycling friendly manual in context to Indian subcontinent.
Suggests a context and user perception based evaluation frame work system including road hierarchy, adjacent land use and infrastructure settings.
It is observed from the literature reviews, that each frame work for evaluation is based on
components which influence cycling requirements. Reviews of above mentioned documents
and guidelines have been broken down in the following components which are found to be vital
for evaluating cycle infrastructure:
Evaluation unit - This refers to the unit of evaluation such as city, Station area network
route or corridor etc.
Context -This refers to the situation or the background of evaluation unit with respect to
the surroundings and the conditions on ground.
User type -Indicates type of commuters using the cycle infrastructure.
Infrastructure Settings– this deals with treatment to the NMV users in order to meet
cyclist requirements at intersections and mid blocks separately, based on planning and
design approaches (in different contexts)
Geometrics - The infrastructure requirements needed to suffice all the needs of NMV
users in terms of space and geometrics requirements.
Environment and Enforcement - A good Cycling Environment and Enforcement is
required not to force the cyclist with in a cycle infrastructure, but to prevent its misuse
by the other modes and functions.
Special conditions – this refers to the site limitations in the form of encroachment,
existing trees, culverts, and religious structures, location of bus shelters and insufficient
right of way etc. causing obstructions and hindrance in an infrastructure.

CyLOS- Final Report
SGArchitects Page 13
4.1.1 Evaluation Unit
For any evaluation to be undertaken, a unit or boundary conditions of the same is needed to be
fixed. This is termed as the evaluation unit. An evaluation unit may refer to city, station area
network, route or corridor etc as the cycle infrastructure cannot exist or planned in isolation.
When city is considered as an evaluation unit, macro level indicators such as accessibility to
safe cycling infrastructure, cycling trips as a proportion of total trips in the city, etc. are used.
For station area access evaluation, an evaluation of all corridors leading station area need to be
conducted. Such an evaluation is broader and may involve aggregation of evaluation for access
by all modes including cycling (Bicycle Design Manual for Indian Subcontinent). When a
corridor or route is desired to be evaluated the evaluation can be conducted for cycling
infrastructure independent of the context or in relation to the context. Where the evaluation is
independent of context it looks at infrastructure details such as curb heights, widths,
segregation type, number of constructions, etc. irrespective of the setting or the road category
along which the infrastructure is developed (Parisar- Cycle track assessment report). Where a
cycling infrastructure is appraised with reference to the context, each of the infrastructure
features and performance indicators are evaluated in relation to the context they are placed in.
For example the kind of pathway required by cyclist is specific to different road classifications
(Urban Road safety Audit (URSA) and Public Transport Accessibility toolkit (PTA)).
4.1.2 Context
Context forms the base for development of any kind of infrastructure whether it is public
transport pedestrian or cycle infrastructure. The design and development of a cycle
infrastructure begins by understanding the surrounding context (Bicycle Design Manual for
Indian Subcontinent). The relationship between the existing built environment and the cycling
infrastructure is important to achieve a comprehensive and cohesive cycling package of a city or
a street. Therefore, it is essential to identify indicators which can measure and evaluate the
context. The features of the surrounding context of an existing or proposed infrastructure are
street typology available right of way (ROW), road geometrics, abutting land use, traffic
composition on the streets, road cross sections etc(Urban Road safety Audit (URSA) and Public
Transport Accessibility toolkit (PTA)).Context can also vary differently on either side of the
road (Left hand side and Right hand side) customized to the street framework, strengthening
the need to evaluate the streets separately for both directions.
4.1.3 User Type
The evaluation of an infrastructure largely depends on the type of users using it. This requires
understanding the difference between the characteristics and requirements of different non-
motorized modes as well understanding the requirements of different types of NMV users. The
different NMV modes are further classified into Bicycles, cycle rickshaws for passengers and
goods. Cycle rickshaws have different requirements from cyclists as they are much heavier and

CyLOS- Final Report
SGArchitects Page 14
require higher effort to maintain a desirable speed and integrate with other modes of transport
(Bicycle Design Manual for Indian Subcontinent). Hence cycle rickshaws have completely
different requirements of access and travel. On the other hand the cyclist can also be further
divided into two categories; potential cyclist and captive cyclist. One who bicycles by choice is
termed as potential cyclist where as a ‘captive cyclist’ is bound by economic constraints and do
not have a choice. Surrounding land uses and destinations play an important role in
determining the type of users of the infrastructure (Ph. D thesis by J. Himani) . The proportion
of categories of anticipated end-users is important to consider while selecting appropriate
bicycle infrastructure and facilities (H.C.M based tool developed by Dr. Joseph Fazio).
4.1.4 Infrastructure Settings - Mid block and Intersections
NMV connections consist of a series of road cross sections and intersections. Intersections and
mid-blocks play an integral role in providing continuity to the NMV users (Parisar- Cycle track
assessment report – Pune). Since the issues associated with roads differ from those related to
intersections, Evaluation of infrastructure for cyclists require that intersections be evaluated
separately from mid blocks segments. This is because intersections require different planning
and design approaches (in different contexts) in order to meet cyclist requirements (Bicycle
Design Manual for Indian Subcontinent).
4.1.5 Geometrics
The infrastructure designed must be such that it suffices all the needs in terms of space and
geometry specific to land use and the user type. Different land use characteristics shall result in
different geometrics requirements on either side of the road such as width of the cycle tracks,
continuity of the tracks, curving radius, height, slope etc (H.C.M based tool developed by Dr.
Joseph Fazio). The needs of different user types will also result in different geometric design
requirements such as slopes and gradients to ease steering at low speeds, good surface type to
protect the rider from shocks of the road, segregation type etc. Therefore it is essential to
identify the percentage of users using the infrastructure and different components of land uses
(Ph. D thesis by J. Himani) along the streets and subsequently use the data to evaluate the
geometrics (Urban Road safety Audit (URSA) and Public Transport Accessibility toolkit (PTA)).
4.1.6 Environment and Enforcement
A good environment and strict enforcement strategies are required as motivations for cycling
and also ensure that NMV commuters do not switch to other modes of transport.
Incompatibility of motorized traffic with NMV commuters is responsible for a significant
proportion of the safety issues (Bicycle Design Manual for Indian Subcontinent). It is
recognized from the literature reviews that if goals to encourage cycling are to be met, then the
environment they occur in must be safe & comfortable (Parisar- Cycle track assessment report
– Pune). Therefore it is important to comprehensively evaluate the host of the cycling

CyLOS- Final Report
SGArchitects Page 15
environment such as shade during the day, light after dark, barrier free cycle tracks, traffic
calming measures, presence of buffer zone to physically segregate from the motorized traffic,
ensuring safety and security for cyclists etc (Urban Road safety Audit (URSA) and Public
Transport Accessibility toolkit (PTA)).
In addition to the environment, establishing effective regulatory and enforcement mechanisms
to assist various state and other government bodies to strengthen and improve the cycle riding
experience. There exists a vicious cycle between the enforcement issues and NMV commuters.
Generally the cycle infrastructure remains unutilized due to the issues like missing lengths, low
maintenance, and encroachment by hawkers, parking on cycle paths, etc (Parisar- Cycle track
assessment report – Pune).Hence for the purpose of evaluation of cycling facilities, the
enforcement strategies play a very critical part in the provided or proposed infrastructure.
These strategies shall include design and training applications of appropriate safety policies,
implement bicycle related laws, speed enforcement for all modes of traffic, prohibition of
others modes in NMV infrastructure, implementation of cycling oriented signage and markings
etc for enhanced safety of bicycle users (Bicycle Design Manual for Indian Subcontinent).
4.1.7 Special Conditions
Site limitations in the form of encroachment, existing trees, culverts, religious structures,
location of bus shelters, insufficient right of way etc presents bottleneck conditions in an
infrastructure. These can be termed as special conditions as these can vary according to the
route or corridor (evaluation unit), site conditions, relative context, street typology, adjacent
land use etc. For evaluation process to be undertaken, these constraints require special
attention and design judgment accordingly. However it can be observed that each of the study
has taken care of these special conditions according to the features of their respective
evaluation framework. Where the evaluation is independent of context, these above
mentioned obstructions or bottlenecks form a part of geometry (Parisar- Cycle track
assessment report).In case of context oriented evaluation the special conditions are been
distributed as part of street typology, land use etc (Urban Road safety Audit (URSA) and Public
Transport Accessibility toolkit (PTA)).Similarly if the evaluation network is based on
infrastructure settings the site specific constraints are being discussed in terms of intersections
and mid blocks located on the existing infrastructure(Bicycle Design Manual for Indian
Subcontinent).But to create a better cycling infrastructure the proposed evaluating tool must
pursue these special conditions separately as an essential part of input data to rate an
infrastructure.
The process for evaluation of cycling infrastructure, adopted in CyLOS tool includes evaluation
strategies based on the above findings from the literature studies.

CyLOS- Final Report
SGArchitects Page 16
5 Work plan and Methodology This cycling infrastructure audit and design tool is proposed to be an interactive and user
friendly tool with a web based architecture. The evaluation framework of the tool is
constructed based on comprehensive stakeholder based reviews gathered from different cities
such as Delhi, Ahmadabad, Rajkot, Pune, Nanded, etc, primary surveys and literature reviews.
5.1 Work plan
The CyLOS project is planned to be undertaken in 4 different parts under two stages or phases;
tool development and training respectively. As shown in Figure 1 first 3 parts of the project fall
under tool development stage where as the last part comprising of training of the tool and
feedback is incorporated in the stage2.
Figure 1: CyLOS development Stages
All the evaluation process and web forms for the CyLOS tool have been designed to be online,
to allow collection and inventory of large NMT related data and also to allow a wide spread and
easy accessibility of the tool. To achieve this, the tool shall be hosted on its own website,
namely www.cylos.in . This website has been activated and initial descriptive pages are
uploaded.

CyLOS- Final Report
SGArchitects Page 17
5.2 Methodology
CyLOS tool proposes a comprehensive evaluation of cycle infrastructure. The tool devises
evaluation of cycle facility in to two major parts, i.e. ‘front end’ and ‘back end’. The front end
part of the evaluation incorporates the entire data requirement process while in the back end
part, the tool computes and evaluates the cycle facility based on the information provided by
the user in the front end part. This methodology is applied throughout evaluation process
performed by the tool. Following sections below explain in detail the front-end forms and the
back-end evaluation methodology to be used in CyLOS tool.

CyLOS- Final Report
SGArchitects Page 18
6 CyLOS Tool – Front End Interface ‘Front end’ relates to the user interface includes all the control buttons and input forms on the
mentioned website. Data is collected through these series of input forms for the evaluation
process.
Figure 2 shows the first page, which will be appearing as the user initiates the tool in the web.
This page can be termed as the introductory page or the home page comprised of the various
link tabs provided at the header or navigation panel of the page. Each of this links provided in
the home page of CyLOS tool is being explained in the following sections.
6.1 Web Pages - Links
Before initiating or inserting information, by the user in the front end web forms, the user is
presented, a series of additional web pages termed as ‘links’, which provides description of the
tool, team and other information’s etc. Given below is a brief description of each of these link
web pages.
6.1.1 Home:
This page provides a brief information regarding concept behind creating CyLOS and need of
CyLOS tool. The page is comprised with various link buttons, provided at the header part of the
page. Through these provided links, the user can gather other important information regarding
CyLOS tool. Presently www.cylos.in has the shown Figure 2 as the main introductory page.
Figure 2: CyLOS Tool Main page or Home page

CyLOS- Final Report
SGArchitects Page 19
The home page is also comprised of sub – link ‘About us’. This link provide user with the
introduction to the agencies and firms, who are being involved in creation of the tool.
Figure 3 shows the description of the ‘About us’ link.
Figure 3: About Us link in CyLOS Home Page
At the right hand side top corner of the home page, options for user login and registration
buttons are provided, in case the user wants to switch on to the evaluation part directly
without visiting the links provided in the home page. However these option are provided in
each of the links pages giving user the flexibility to login or register from any of the links
provided in the home page. The details of the user login and registration process are explained
in detail later in this chapter.
6.1.2 Reports:
This link will provide user the detailed technical reports prepared for CyLOS tool and Non-
motorised transport and design guidelines. User can refer as well as download the reports
provided in the link according to his/her conveniences. Figure 4 shows the ‘Reports’ link page
which will appear as the user clicks on the reports link tab given on the home page.

CyLOS- Final Report
SGArchitects Page 20
Figure 4: ‘Reports’ Link Page
*Note: Presently www.cylos.in is not updated with any technical report but will be upgraded later with the finalization of tool.
6.1.3 User Manual:
As the user clicks the ‘User-manual’ link the page shown in Figure 5 will appear. This link will
have the detailed user manual of CyLOS tool, in case the user may seek any help in using the
CyLOS tool.
Figure 5: ‘User Manual’ Link Page

CyLOS- Final Report
SGArchitects Page 21
6.1.4 Getting Started:
This link when clicked, will take user to the page, to initiate the evaluation process. The page
comprises of a start button namely ‘Get started now’. By clicking this button the user can begin
the evaluation process. Figure 6 shows ‘Getting started’ link page.
Figure 6: Getting Started page
In addition to this, the page also provides the user set of instructions and things to do before
starting any kind of evaluation. As the CyLOS tool evaluates cycle facility under three broad
categories i.e. Corridor/route level, transit access influence area level and city wide level, the
user may need to collect data accordingly. Hence for the better understanding, user can click on
the sub links provided under the Data requirement mentioned in the page on the left hand side
and can get a brief primary data requirement list against in each mentioned category. Apart
from this, the user can also get information regarding the steps to be followed while
performing the evaluation by clicking on the links provided under the evaluation steps shown at
right hand side of the page. The links provide user with things to do at the each step while
performing the evaluation process. Figure 7 presents the appearance of the getting started
page showing the set of instruction and the primary list of data required by the user under the
respective heads, when being clicked on the given sub links explained above.

CyLOS- Final Report
SGArchitects Page 22
Figure 7: ‘Getting Started page’ with data requirement list and set of instructions for User
6.1.5 Contact us:
Through ‘Contact us’ link the user can get information regarding the contact details of the
developers (SGArchitects) of the CyLOS tool. The contact detail of the tool developer appears
on the left hand side top of the page. Figure 8 presents the Contact us link page
Figure 8: ‘Contact us’ Page
In case the user may need to clarify any query regarding usage of the tool, the user may insert
his/her query with name and web identification, in the input boxes provided the right hand side
of the page.

CyLOS- Final Report
SGArchitects Page 23
6.2 Web Pages – Login and Registration
As mentioned above sections, each of the link pages is provided with an option for user login
and registration buttons provided at the right hand side top corner. As the user clicks the login
button, a new web page will appear regarding data input, enquiring the name of the user and
the web contact details. This page is termed as ‘User Login Page’. Figure 9 shows the user login
page.
Figure 9: User Login page
The same will appear if the user clicks the getting started button provided in the ‘Getting
started’ link page. Figure 10 shows the getting started button provided in the ‘Getting started
‘link page
Figure 10: Getting started Button

CyLOS- Final Report
SGArchitects Page 24
As shown in Figure 9, to initiate the tool, it is required that the user should firstly register in
www.cylos.in providing his/ her web credentials and verifications. Figure 11 shows the
registration credentials page required to be filled by user. This page will appear as the user
clicks on the register button provided on the web page asking for the details such as name /
organization / telephone number etc. After inputting the required information the user should
click the submit button given below at the end of the page. This will save the data inserted by
the user and will help in creating a resultant registration file which will be used as a CyLOS
Contact list and can be used for future operation of the tool.
Figure 11: Registration details page
As the registration process is done the tool will give a message regarding successful creation of
user profile and the user will be provided with designated password for the tool. Hence with
the help of the generated password, user can login or sign in to CyLOS tool and begin evaluation
process.
*Note: For now no password is being designated for the tool as it is in development stage. As the tool gets finalized a password
will be fixed and circulated among the tool users based on their respective registration details.
6.3 Web Pages –Front end Forms
CyLOS tool uses a number of primary forms (generated based on context description) to collect
and collate cycling route information. The following sections presents the web-pages designed
for the data input in the CyLOS tool required for the evaluation.
6.3.1 Selection of Evaluation type
CyLOS tool proposes to evaluate cycling infrastructure under three broad levels i.e.
1. Cycling Route
2. Transit (or specific function) access network

CyLOS- Final Report
SGArchitects Page 25
3. City wide cycling infrastructure availability assessment
Hence after the user login a new web page appears asking user to select the type of evaluation
to be done based on the above three broad levels. Figure 12 presents the page for selection of
the evaluation type.
Figure 12: Evaluation Type Form
After selecting the evaluation type, the user has click one of the two buttons provided below in
the webpage such that if the user is starting or initiating a new analysis then ‘start new analysis
button’ has to be clicked whereas if the user has already evaluated any cycle facility prior in the
tool and wants to review it, then the second option i.e. open saved analysis is to be clicked. Also
if the user wants to quit the evaluation then logout option is provided at the right side top
corner of the web page. The tool provides the logout option in each of the web forms.
6.3.2 Front-end Data input Methodology:
The objective of the CyLOS tool is to evaluate the cycle infrastructure hence the methodology
for evaluation of cycling infrastructure, adopted includes questions integrated, in web based
forms (resembling cycling infrastructure audit form presented in Annexure 10.7).Further the
questions asked in the forms also depends according to the type of evaluation selected by the
user, as presented in Figure 12. Hence for different evaluation type a different set of front end
forms with related questions are being developed.
The user also needs to collate a different set of data for each evaluation type. For the better
understanding of user, a primary list of the data to be collected is being induced in the ‘Getting
started’ link against each evaluation type which has been explained in the previous section
6.1.4. However the user can click the same link provided at header or navigation panel of the
webpage and collect the information at any stage of the analysis.

CyLOS- Final Report
SGArchitects Page 26
The sections below present the front- end web forms developed according to the evaluation
type selected by the user.
6.4 Forms for Corridor/cycling route –Evaluation type
For corridor/cycling route evaluation the questions are being distributed in five broad parts or
type of forms. These forms are as follows:
1. Base data form
2. Default form
3. Segment Information form
4. Design and data input form- Distributed in 4 parts these are:
a) Segment Context form
b) Midblock form
c) Intersection and crossings form
d) Others form
5. Output form.
Each of these forms is related to each other and whole evaluation process in CyLOS tool is
based on the data inserted by the user against the questions asked in the forms. Therefore the
user has to input data asked in each of the web form accordingly and in case there is any
incorrect input or any of the questions remains unfilled by the user, while inputting data than
the tool will automatically generate ‘Error messages’ regarding the wrong input value or
missing value on the web form. Figure 13 shows the error messages in case if incorrect input

CyLOS- Final Report
SGArchitects Page 27
Figure 13: Error messages
These error messages are based on the checks applied to each of questions asked in the forms.
Without rectifying the inputs according to the shown error messages, user cannot move
forward to the next webpage.
For example: The route length of the corridor should be equivalent to the sum of length of each
segment, the corridor is distributed for evaluation. If it is not so in the user input data then the
tool will generate the error message for the same against the questions asked on the respective
web form.
For proper data input, the user can refer the ‘User manual’. To access the user manual the ‘User
manual link’ has to be clicked by the user, provided at the header of the each web page. Each of
the questions asked in the user interface forms are designated with coded numbers and detail
of each input is being explained according to the assigned number and is been assembled
together in the User Manual of the CyLOS tool. Figure 14 Presents a sample of the user manual.
*Note: The same process of coding is followed for each of the front end form

CyLOS- Final Report
SGArchitects Page 28
Figure 14: User Manual

CyLOS- Final Report
SGArchitects Page 29
6.4.1 Corridor Segmentation:
Before initiating the evaluation process and filling the data input forms, the foremost thing that
the user has to do is to distribute the selected route/corridor in to desired segments. As the
evaluation type selected by the user is corridor/route based, it is essential to consider each and
every design variations on the corridor for a proper evaluation. The cycling infrastructure design
changes along with various factors like street typology, number and type of junctions, available
of Right of way, abutting land use etc. These variations in design features lead to distribution of
the corridor/route into different segments. According to the literature studies, the special
conditions also influence the design of the cycle infrastructure. These special conditions can be
termed as any kind of site limitations in the form of encroachment, existing trees, culverts,
religious structures, location of bus shelters, etc hence also needed to be evaluated separately.
As every special condition is distinct from one other hence is to be treated as different
segment.
While distributing the corridor in to segments, the user has to confirm that the total length of
the segments should be equal to the total route length entered in previous input. The segments
having similar design features can be grouped together to form a single segment. The minimum
segment length can be 40 meters and less than 40 meters in length cannot be considered as
segment. Hence considering the above mentioned parameters, number of segments is to be
decided and has to be entered as input information wherever required.
6.4.2 Base -Data Form.
‘Base-data’ form appears as the first front-end form to be filled by the user. To start the
evaluation the user has to input basic information related to the corridor such as name of the
corridor/route to be evaluated, starting point and terminating point of the corridor, length of
the selected corridor/route and the number of segment the corridor is distributed.
Apart from the above mentioned information the user also has to insert an image of the cycle
route or corridor, which is to be analysed. This data input can be any image format( jpeg/ png/
gif / bmp or any other image format). Figure 15 presents the base data web page form.

CyLOS- Final Report
SGArchitects Page 30
Figure 15: Base data form

CyLOS- Final Report
SGArchitects Page 31
It can be observed in Figure 15, on the side panel three additional buttons are also provided on.
These buttons are:
1. Default Button: As the user clicks on the provided default button, an independent web
page form will appear. This form is named as ‘Default Form ‘and is composed of the
default values assumed by the tool which are used in evaluation process. The tool also
gives user, flexibility to alter the default values on the default WebPages. The default
form is explained in detail in the below section 6.4.3(Default form).
2. Starting new evaluation Button: In case the user wants to begin a new evaluation.
3. Open saved evaluation Button: In case user wants to review any evaluation done prior in
CyLOS.
*Note: These buttons are incorporated in each of front-end form.
The user can move forward to the next web page by clicking the ‘Next’ arrow button provided
at the right hand side bottom corner of the Base data web page. The tool auto saves the data
filled by the user as the user moves forward to next web form.
6.4.3 Default Form.
Prior evaluation of any cycle facility or infrastructure, predefined values are assigned in the tool
for evaluation. These values are termed as ‘Default values’ and a separate independent web
page form: Default form, is being developed listing all the default values needed in the process
of evaluation.
The assigned default values are based on certain standards, conditions and relations derived
from the various literature studies, tool kits and researches developed for cycle infrastructure
(Refer: Table 1) . Based on these values, the evaluation of the cycle infrastructure is worked out
in CyLOS tool. Figure 16 presents the default web page.

CyLOS- Final Report
SGArchitects Page 32
Figure 16: Default data form
The CyLOS tool provides user, the option of altering the Default values but changes to these
values are not recommended, unless required for research and academic applications. The new
values assigned by the user should be based on detail surveys and authentic sources. These
values can also be altered for different context and users as per the location of the route,
corridor or the city. It is strongly recommended that the user “Restore Defaults “before
proceeding with a new analysis, as values edited in a previous analysis may have been retained
by the tool.
As the default values assigned in the tools are of various types such as some are standard
values whereas some values are assigned in form of scores, based on the ranges given to the
parameters involved in evaluation, some values are multiple condition (matrix) based whereas
some default values are the weightages assigned to indicators and parameters. Hence for the
better understanding of the user the default form of CyLOS is further divided in four categories
which include Standard, Scaling, Scoring and Weightages. Each field according to the respective

CyLOS- Final Report
SGArchitects Page 33
category presents the default value of various parameters to be used in the tool for analysis.
The 4 different categories shown in Default form web pages are as follows:
a) Standards: As the user clicks the ‘Standard tab’, a webpage will appear showing all the
standard default values assigned by the tool. For example: Major junction width- 50
meters is considered as the default width for the major junction. The tool gives the
flexibility to the user to alter the given default value anywhere between 20meter to 120
meter. Figure 17 presents the Standard default page.
Figure 17: Standard Default data form
b) Scaling: As the user clicks the ‘Scaling tab’, a webpage will appear showing default scores
assigned against the ranges decided for parameters involved in evaluation process. The
scores are assigned in scale of 0 to 1 depending on the best and worst scenario for each
parameter such that the best condition is given the score of 1 and worst condition is
given score of 0.
For example: Frequency of punctures: This parameter defines the number of
punctures/openings existing along the cycling infrastructure. The lower the distance
between the existing punctures higher is negative impact on the cyclist in terms of
directness. Therefore, in case, distance between the punctures is less or the punctures
are more frequent, the assigned score is given relatively lower based on the range
decided for the parameter such as if a puncture exists in every (0 to 25) meters then the

CyLOS- Final Report
SGArchitects Page 34
score given is 0 considered as the worst scenario. If punctures exists anywhere from (25
to 75) m, then the score is 0.2. If punctures exists anywhere from (75 to 100) meters,
then the score is 0.4. If the punctures exists anywhere from (100 to 150) meters, then
the score is 0.6. and If punctures exist anywhere from (150 to 200) meters then the
score assigned is 0.8 and If punctures exist at an interval of more than 200m length,
which best of the above mentioned condition then the score is given 1 by the tool.
Figure 18 presents the Scaling default page.
Figure 18: Scaling Default data form
c) Scoring: As the user clicks the ‘Scoring tab’, a webpage will appear showing all the
scoring default values assigned by the tool. This particular category is nominated as
scoring because Default scores are assigned based on multiple conditions involved
hence leading to development of a score matrix.
For example: Based on the cyclist approach to the Intersection relations have been
developed and categorized according to the road typology and the cycle infrastructure
type. Default scores in a scale of 0 to 1 are assigned to each category and a score matrix
is developed based on these different relations such that if cyclist approaches the
intersection from segregated track to segregated track on a arterial road then the score
assigned is 1 whereas if cyclist approaches the intersection from cycle lane to segregated
track on a local road then in case again score given by the tool is 1 and likewise other
different relations are being formed and assigned scores.

CyLOS- Final Report
SGArchitects Page 35
All the relations are being presented in the default form with the respective scores
assigned under different road categories as shown in Figure 19
Figure 19: Scoring Default data form
d) Weightages: As the user clicks the ‘weightages tab’, a webpage will appear showing all
the default weightages assigned by the tool against the parameters and the identified
indicators presents the weightages default page.
Figure 20: Weightages Default data form

CyLOS- Final Report
SGArchitects Page 36
6.4.4 Segment Information Form.
The CyLOS tool proposes separate evaluation for each different segment, and later
performance score of each segment will be collated together to evaluate selected corridor. As
each of the segments has different design characteristics hence for evaluation process the
design detail of each segment needs to be provided by the user. For the purpose the segment
information form is developed. Figure 21 presents Segment Information Form.
Figure 21: Segment Information data form
Presently the tool permits segmentation of the corridor up to 40 segments but the segment
information web-page will display only number of segments inserted in the base data form.
For Example: if user has inserted 3 segments in the base data form then the segment
information form will ask to input data for 3 segments only as shown in Figure 21
In the segment information form shown in the above, the name of each segment with its length
is to be entered by the user. Along with this total number of junctions (major or minor) and
number of crossings (safe) are to be induced in this form as the design majorly varies between
the junctions and crossings.
Since the base data form and segment Information form, is filled by the user with respect to the
whole the corridor or route selected for evaluation, therefore at this stage the other forms also
appear on the web page as per the chronological order however these forms are in inactive
condition except the ‘Default’ value form which is an independent form. The same flow is being

CyLOS- Final Report
SGArchitects Page 37
incorporated in each of the web form giving user a flexibility to begin, review and exit from the
tool as per his/her convienence. As the user clicks the ‘next’ button provided at the bottom of
the webpage the tool auto saves the information inserted by the user and moves forward for
the next input web forms.
6.4.5 Design Data input Forms
After inserting the information regarding corridor and segment details in the prior forms, the
next step is to collate segment-wise infrastructure design details of the corridor selected for
evaluation. For the purpose, design data input form is developed .In this form, user has to input
information related to the infrastructure design of the selected corridor/root for the evaluation.
CyLOS tool aims for a comprehensive evaluation of cycle infrastructure, therefore all the design
parameters and factors influencing cycling are taken in to account, leading to an inventory of
input data, required to be filled by user. But as all input requirements cannot be amalgamated
in one single questioner and for the better understanding and ease of the user, the design data
input form is further distributed in to four broad categories. The categories are based on the
design components which impact cycling requirements i.e. context, midblock, intersections-
crossings and others (landscaping, parking, enforcement, maintenance etc).Hence the input
requirements with respect to each of the mentioned components are framed as a set of
questions in separate web forms. These web-forms are explained in the sections below:
6.4.5.1 Segment Context Form
This part under design input from mainly consists of data input in relation to the context.
Factors such as Road hierarchy, traffic volume, land use, foot paths and service lanes, parking
etc are to be entered as part of user input. Figure 22 shows the Segment Context form.

CyLOS- Final Report
SGArchitects Page 38
Figure 22: Design data Context form

CyLOS- Final Report
SGArchitects Page 39
The segment context form is designed basically under 9 design parameters. These are as
follows:
Evaluation type.
Street category and speeds.
Peak hour traffic data.
Breakup of bicycle user share.
Land use on the either side of the corridor.
Availability (foot path and service lane).
Quality (foot path and service lane).
Service zone availability.
Street parking.
Among the above mentioned parameters: street parking, availability and quality of footpath,
service lane, service zone which influences the design of cycle facility on the both side of the
carriage way are being separately asked for left hand side (LHS) and Right hand side (RHS).
The tools auto-saves the data inserted so far, as the user moves forward to the next web page.
The user can move forward for the next form through the ‘Next’ button provided at bottom
right side of the form..Since being the first segment selected for evaluation the button to go
back in previous segment is inactive at this stage but will be active for the next segments. The
user can move back to the prior web pages in case any alterations are to be done such as
changing any default value or updating any information regarding segment in the segment
information form by clicking the ‘Previous’ button provided at the left hand side bottom of the
web page. This facility is retained throughout the data input process.
6.4.5.2 Infrastructure Design at Midblock Form
A segment is comprised of two major components: Midblock and Intersections. As CyLOS tool
proposes assessment of cycle infrastructure segment-wise, the design details of both this
components are required to be provided at the user end for evaluation purpose. But as the
infrastructure design requirement for midblock is very different to that of design requirement
of intersections. Therefore a separate questioner/web-page form is developed for
Infrastructure design at Midblock. Figure 23 shows Infrastructure design at midblock form.

CyLOS- Final Report
SGArchitects Page 40
Figure 23: Design data Midblock form

CyLOS- Final Report
SGArchitects Page 41
The midblock web form will appear after user fills the previous segment context form. The user
needs to input data related to the infrastructure design at the midblock for the selected
corridor, according to the designed form format. As the design of the corridor may vary along
the either sides of the corridor hence user has to input information seperatly for left hand side
(LHS) and Right hand side (RHS) as mentioned in the midblock questioner.
6.4.5.3 Infrastructure Design at Intersection and Crossing Form
Intersections and crossings play a vital role in defining design of corridor/route hence require
different set of input data for evaluation. Therefore, separate questioner (Web-form) is
designed for the purpose. This form appears after user fills the previous midblock form. The
questions listed in the input web page form accounts for all the type of cyclist crossings and
intersections and the user needs to insert input data as per the designed form format. For
better understanding of the user, the form is distributed as per the intersection typology and
the questions related to each type of intersections are grouped under the below mentioned
sections:
Major intersections: Data input regarding major intersections is to be filled by the user.
Minor intersections: Data input regarding minor intersections is to be filled by the user.
Cyclist crossings other than intersections: Data input regarding provisions of cyclist
crossing (at grade/ signalized) existing at midblock is to be provided by the user.
Property entrances: User has to input information regarding the property entrances.
Grade separated cyclist crossings: Data input regarding provisions of cyclist crossing
(Grade separated) is to be provided by the user.
After filling up the form the user has to follow the same set of instructions followed in the
previous forms to move forward to the next web form. Figure 24 presents Infrastructure design
at Intersection and crossings form.

CyLOS- Final Report
SGArchitects Page 42
Figure 24: Design data Intersection and crossing form

CyLOS- Final Report
SGArchitects Page 43
6.4.5.4 Design Data Input Form - Miscellaneous
Along with context, midblock, intersections and crossings some other parameters such as
maintenance, enforcement, landscaping, parking etc also influences the design and play a
critical role in the assessment of the infrastructure. Hence in order to evaluate the
infrastructure based on these mentioned factors, a separate questioner (web form):
Miscellaneous is prepared. This form is proposed to be the last form under design data input
and front end forms. Hence the Front-end user input forms conclude as the user fills this web
form. Figure 25 presents the Design data Input form ‘Miscellaneous’.
Figure 25: Design data – Miscellaneous form

CyLOS- Final Report
SGArchitects Page 44
6.4.6 Segment evaluation result Form – Segment Output Form
After the data input process is complete and all the forms have been completed for a particular
segment, a Results page is generated by the tool, specific to the selected segment. This result
page can also be termed as ‘Segment Output sheet’. The Results page provides user, a
performance score of the selected segment. Further based on this performance score, the level
of service of the segment is determined which is provided at end of the segment output sheet.
Figure 26 presents the Segment Evaluation result form.
Figure 26: Segment output form
Performance Score – The performance score is the total score earned by the segment after
getting evaluated by the tool. This performance score is formulated in the back-end calculations
devised by the tool. The segment evaluation is judged or rated on the basis of this performance
score earned by the segment, on a scale of 0 to 100 such that the segment earning high score
depicts good performance and in case, low score is gained by the segment than the
performance is rated to be poor.
The output sheet presents the performance score of the segment in three broad levels. These
are:
1. Indicator level performance - The assessment of the cycle facility for the selected
segment is carried out on the basis of 26 selected indicators influencing cycling
requirements. These indicators are derived from the multiple sub-indicators developed

CyLOS- Final Report
SGArchitects Page 45
from the input data provided by the user in the input forms. Each of these indicators is
assigned with default weightages assigned by tool and as these weightages are being
applied to their respective indicators; the output sheet generates performance score for
the segment against each of these involved indicators. The user can go to the
weightages tab provided in the default form and can alter the assigned weightages as
per his/her needs.
2. Overall level performance CyLOS tool evaluates selected segment against each
indicators separately for both sides i.e. left hand side as well as on the right hand side.
The weighted average value based on the default weightages assigned to the each side,
produces an overall performance score for each indicator in the segment. Presently each
side is assigned with 50% weightages in the tool, the user can go to default weightages
tab and can edit the weightages assigned according to his/her convenience.
3. Category level performance - According to the literature studies and researches, the
cycling requirements are divided in to five major categories. These categories are:
Coherence, comfort, Safety, Directness and Attractiveness, also termed as the basic
principles of cycling. All the indicators involved in the process of evaluation is directly
related to one or other of these mentioned categories and hence the CyLOS tool collates
the indicators belonging to similar category and generates a category level performance
for the segment. Hence the user can judge the performance of the selected segment of
the corridor according to each category.
Segment: Level of Service – Each of the categories: Coherence, comfort, Safety, Directness and
Attractiveness are also assigned with individual default weightages in the tool, which can be
altered as per user requirement. Further in the back-end computation of the output form,
these category weightages, when applied to the corresponding category level performance
scores and combined together generates a level of service (LOS) for the selected segment. The
obtained level of service for the segment is rated on a scale of 0 to 100, such that higher the
score obtained signifies higher level of service and vice versa . The level of service is shown at
end of the segment evaluation result form/segment output sheet.
Thus the data input process and evaluation for a single segment concludes with this segment
evaluation result form. The user can take a print of the segment output sheet by clicking the
print button provided at right hand side bottom corner of the output web-form. The user can
also go back to the previous forms by clicking the previous button provided on the left hand
side bottom corner. The tool also gives flexibility to the user to move backward to any of the
previous forms as at this stage of the evaluation, all the previous forms are active and auto
saved by the tool.

CyLOS- Final Report
SGArchitects Page 46
Corridor: Level of Service – As soon as the evaluation of the selected segment is completed,
the tool will present, same set of data input web- forms for a new segment .The same process
of filling the input forms, has to be repeated by user (as explained in the above sections) for the
new segment to be evaluated. This cycle will continue till the last segment is evaluated, which is
based on the number of segments inserted by the user in the base data form.
After the user is done with evaluation of all the segments, the tool will generate an
output/resultant web form, presenting the level of service for the whole route/corridor. The
level of service for the whole route/ corridor is based on the individual level of service earned
for each segment, length of each individual segment and the total route length provided by the
user in the base data form, which is computed by the tool in the back end forms. Therefore the
evaluation process concludes with this corridor/route evaluation result form. Figure 27
presents the output resultant form for the corridor.
Figure 27: Corridor output form
After completing the evaluation user can perform any of the tasks mentioned below as per
his/her will or requirement. These are:
Can print the result form of the corridor by clicking on the print button.
Continue with a new evaluation by clicking the start new analysis button.

CyLOS- Final Report
SGArchitects Page 47
Can open the old web forms already filled during evaluation and correct any input value
for improvement of level of service of the corridor / route or segment.
User can Sign-out from the CyLOS tool by clicking the logout button provided on the web
page.
The scientific calculations incorporated by the tool for evaluating the segment output as well as
the corridor output are defined as formulas, which are developed and induced in the back end
part of the tool.
6.5 Forms for Transit access Influence area – Evaluation type
As the user clicks on the ‘Transit access influence area’ option provided in web form for
‘Selection of evaluation type’ (Refer 6.4) the data input forms for the selected evaluation type
appears. The data input forms formats developed for Transit access influence area, are similar
to the web -forms used for corridor/route evaluation type as the evaluation unit is same in both
the cases i.e. assessment of cycling infrastructure on a route. As the evaluation criteria’s are
identical hence evaluation process also follows the same procedure. Except for one
modification that is instead of segments, ‘Links’ are used to evaluate the cycle facility in transit
areas. Therefore, CyLOS tool proposes, transit access area evaluation based on the links.
The transit area is defined as vicinity influenced due to presence of any transit stations like Bus
stop; Metro station etc. and the periphery of transit areas is limited based on the catchment of
the existing transit stations.
Links are termed as approaches or access leading to the transit areas. As the evaluation of cycle
infrastructure in transit areas is based on the links, these linkages have to be limited according
to the defined catchment area of the transit stations, Hence in the CyLOS tool, all the access
and approaches falling within a radius of 2500 meters, from the transit stations are considered
as links.
It is not necessary, that all linkages in transit area directly lead to the transit station. These links
forms a network to access the transit stations. Hence these links can be further categorised as
Primary Links: The approaches/access directly leading to transit stations or in other
words the approaches on which the transit station is located. The length of the primary
links can vary from 5000m to 6250m based on the route alignment.
Secondary Links: The approaches leading to the primary links which further leads to the
transit stations.
The diagram presented in Figure 28 shows the primary links and the secondary link in the
transit area network.

CyLOS- Final Report
SGArchitects Page 48
Figure 28: Links categorization
Considering the above mentioned parameters and based on the design details of these
identified linkages leading to transit influence areas, the evaluation of the cycle facility is being
carried out by the CyLOS tool. So before initiating the evaluation process, the user has to
identify the number of the links to be evaluated, and also has to provide details of each link.
Regarding ‘Transit access influence area’ evaluation type, the user has to insert the number of
links to be evaluated in the base data web form and then after has to input the characteristic of
each link in the Link information web form which will be appearing after. As mentioned earlier
the forms used for transit area evaluation are similar to the corridor /route evaluation hence
number of segments is replaced by number of links in the base data form and instead of
segment information form, link information form is introduced in transit area evaluation, rest
all the other parameters considered are identical. Figure 29 and Figure 30 presents the base
data form and link information form respectively.

CyLOS- Final Report
SGArchitects Page 49
Figure 29: Base Data Form- Transit Access Influence area Evalaution
Figure 30: Link Information Form- Transit Access Influence area Evaluation
The other functions to be performed by the user are same as explained above under
corridor/route evaluation type including the design data input web forms (Refer: 6.4). A sample
of design data input web form used in transit access influence area evaluation is presented in
Figure 31 with the modifications done with respect to links instead of segments.

CyLOS- Final Report
SGArchitects Page 50
Figure 31: Data input Form- Transit Access Influence area Evaluation
After the data input process is complete and all the forms have been completed for a particular
link, a Results page is generated by the tool, specific to the selected link. The Results page gives
user, a performance score of the selected link and based on this performance score, the level of
service of the link is determined which is provided at end of the link output sheet.
After the user is done with evaluation of all the links, the tool will generate an output/resultant
web form, presenting the level of service for the transit access influence area. The scientific
calculations done for evaluating the link output as well as the route output are defined as
formulas, which are developed and induced in the back end part of the tool. Therefore the
evaluation process concludes with this evaluation result form.
6.6 Forms for City wide cycling Network – Evaluation type
As the user clicks on the ‘City wide cycling network’ option provided in web form for ‘Selection
of evaluation type’, the data input forms for the selected evaluation type appears. The data
input forms formats developed for city wide cycling network, is totally different from the web-
forms of previous mentioned evaluation types. Under ‘City wide cycling network’ evaluation
type, CyLOS tool proposes to evaluate cycle infrastructure of a city in two ways i.e.

CyLOS- Final Report
SGArchitects Page 51
Measuring cycling level of service, based on the present cycling condition in the city.
Estimating the cycling potential of city, to develop the city as cycle friendly city in near
future.
For the purpose, Front end forms are developed for the city evaluation type which includes set
of questions integrated, in web based forms. These web-forms are distributed in 3 broad parts
or type of forms. These are:
1. Default data form
2. City data input form
a) City base data form
b) City evaluation form
3. City output form.
Each of these forms is related to each other and whole evaluation process in CyLOS tool is
based on the data inserted by the user against the questions asked in the forms. Therefore the
user has to input data asked in each of the web form accordingly and in case there is any
incorrect input or any of the questions remains unfilled by the user, while inputting data than
the tool will automatically generate ‘Error messages’ regarding the wrong input value or
missing value on the web form. These error messages are based on the checks applied to each
of questions asked in the forms. Without rectifying the inputs according to the shown error
messages, user cannot move forward to the next webpage.
Throughout the evaluation process, while inserting data in the above mentioned web forms the
user can move forward to the next form through the ‘Next’ button provided at bottom right
side of the form. The user can move back to the prior web pages in case any alterations are to
be done such as changing any default value or updating any information by clicking the
‘Previous’ button provided at the left hand side bottom of the web page.
6.6.1 City Default data Form
Like previous evaluation types, Default values are assigned by the tool for evaluation of city
wide cycling network also and a separate independent web page form: City Default form, is
being developed listing all the default values needed in the process of evaluation.
The assigned default values are based on certain standards, conditions and relations derived
from the various literature studies, tool kits and researches developed for cycle infrastructure

CyLOS- Final Report
SGArchitects Page 52
(Refer: Table 1) . Based on these values, the city level evaluation is worked out in CyLOS tool.
Figure 32 presents the default form for city evaluation
Figure 32: City Default Data form
The CyLOS tool provides user, the option of altering the Default values but changes to these
values are not recommended, unless required for research and academic applications. The new
values assigned by the user should be based on detail surveys and authentic sources. These
values can also be altered for different context and users as per the location of the route,
corridor or the city. It is strongly recommended that the user “Restore Defaults “before
proceeding with a new analysis, as values edited in a previous analysis may have been retained
by the tool.
As the default values assigned by the CyLOS tool are of various types such as some are standard
values whereas some values are assigned in form of scores, based on the ranges given to the
parameters involved in evaluation. Hence for the better understanding of the user the default
form of CyLOS is further divided in three categories which include Standard, Scaling and
Weightages. Each field according to the respective category presents the default value of
various parameters to be used in the tool for analysis. The 3 different categories shown in
Default form web pages are as follows:
a) Standards: As the user clicks the ‘Standard tab’, a webpage will appear showing all the
standard default values assigned by the tool.
b) Scaling: As the user clicks the ‘Scaling tab’, a webpage will appear showing default scores
assigned against the ranges decided for parameters involved in evaluation process. The

CyLOS- Final Report
SGArchitects Page 53
scores are assigned in scale of 0 to 1 depending on the best and worst scenario for each
parameter such that the best condition is given the score of 1 and worst condition is
given score of 0.
c) Weightages: As the user clicks the ‘weightages tab’, a webpage will appear showing all
the default weightages assigned by the tool against the parameters and the identified
indicators. Presents the weightages default page.
6.6.2 City data input Forms
Under City wide cycling network, CyLOS tool proposes evaluation of present status of cycle
infrastructure and the cycling potential of a city, therefore all the parameters, based on the city
statistics and the factors revealing the present cycling level of service of the city are taken in to
account and framed as City data input web form. But as all input requirements cannot be
amalgamated in one single questioner and for the better understanding and ease of the user,
the data input form is further distributed in to two different web-forms. These web-forms are
explained in the sections below:
6.6.2.1 City Base data Form
‘City Base-data’ form appears as the first front-end data input form to be filled by the user. To
start the evaluation the user has to input basic information related to the city such as name of
the city, state, country, total area and demography. The data input also consist of the data
points regarding transportation profile of the city like total trips, per capita trip rate of the city,
Average trip length of the city and modal share. Apart from the above mentioned information
the user also has to insert an planor image of the city . This data input can be any image
format( jpeg/ png/ gif / bmp or any other image format).
Figure 33 presents the city base data input form.

CyLOS- Final Report
SGArchitects Page 54
Figure 33: City Base Data form
6.6.2.2 City Evaluation Form
This data input web form appears after the city data form is filled by the user. The form is
designed based on the framed set of questions related to context of existing cycling conditions
in a city. Figure 34 shows the City evaluation web form.

CyLOS- Final Report
SGArchitects Page 55
Figure 34: City Evaluation Data form
This web form can be considered as the main data input form for city assessment. The form is
designed based on 14 parameters. These are as follows:
Modal split
Bicycle fatalities
Trip length distribution
Percentage of road network in the city ( according to road typology)
Speed

CyLOS- Final Report
SGArchitects Page 56
Cycle infrastructure provision
Lighting
Safety ( in terms of street crime and accidents)
Trips by cycling to public transport
NMT land allocation
Availability of cycle parking
City Emissions
Noise levels
Revenue for NMT facilities
City Bicycle ownership
Each of the parameters is being explained and elaborated in the User manual provided for
CyLOS tool.
It can be well observed that the user needs to collate a different set of data for this evaluation
type. For better understanding of the user, an inventory (check list) of the data points to be
collected is being induced below data requirement against city level evaluation type in the
‘Getting started’ web page link .
Figure 35 presents the check list for the city level evaluation.

CyLOS- Final Report
SGArchitects Page 57
Figure 35: City Check list
The required information can be extracted from the secondary data and surveys available in the
prior researches and studies such as stated house hold surveys, city mobility plans etc done
before for the cities.
6.6.3 City Output Form
After the data input process is complete and all the forms have been completed, a Results page
is generated by the tool. This result page is termed as ‘City Output form’. The Results page gives
user, a performance score for the city. This performance score is formulated in the back-end
calculations devised by the tool. Based on this performance score, the cycling level of service
for the city is determined which is provided at end of the output sheet.
The assessment of city wide cycling network is carried out on the basis of selected indicators
influencing cycling in city. These indicators are derived from the various sub-indicators
developed from the input data provided by the user in the input forms. The output sheet
generates performance score against each of these involved indicators.

CyLOS- Final Report
SGArchitects Page 58
Each indicator involved in evaluation process is assigned with default weightages assigned by
tool and based on these weightages; the user can go to the weightages tab provided in the
default form and can alter the assigned weightages as per his/her needs. The performance
score earned by each indicator when applied to their respective weightages assigned by the
tool and aggregated in the back end computation by the tool produces the level of service.
As mentioned above, in case of ‘City wide cycling network’ evaluation, CyLOS tool proposes to
evaluate cycle infrastructure of a city under two different criteria’s i.e. Measuring cycling level
of service, based on the present cycling condition in the city and Estimating the cycling
potential of city hence the tool collates the indicators influencing the respective criteria and
generates two different level of services for each mentioned criteria in the CyLOS tool. The
obtained level of service for each criterion is rated on a scale of 0 to 100, such that higher the
score obtained signifies higher level of service and vice versa. Figure 36 presents the web page
of City output form.
Figure 36: City Output web form
The scientific calculations done for evaluation are defined as formulas, which are developed
and induced in the back end part of the tool. Therefore the evaluation process of city wide
cycling network concludes with this city out form.

CyLOS- Final Report
SGArchitects Page 59
7 Back End Computation and Evaluation ‘Back end’ refers to the estimation and computation of the data collected by the tool to
generate a complete picture of the cycling facility being evaluated and then to subsequently
evaluate the same. Back end evaluation combines and computes different data input in the
form, with a goal to provide an assessment of cycle infrastructure base on the type of
evaluation selected by the user.
7.1 Evaluation Methodology
CyLOS tool proposes to evaluate cycling infrastructure at three broad levels. These are:
1. Cycling Route.
2. Transit (or specific function) access network.
3. City wide cycling infrastructure availability assessment.
The proposed base for evaluation in case cycling route evaluation and transit access network is
cycling route, which is evaluated based on detailed design inputs. Therefore, multiple cycling
routes can be graded, and an overall grading of these routes is provided using weighted means
method. In case of cycling route evaluation, a individual cycling route is considered as a
segment whereas in case of transit access network evaluation a individual cycling route is
considered as link. The evaluation of each cycling route, (segment or link: based on the
evaluation type) has been broken down in to indicators influencing cycling requirements. These
indicators derived from the multiple sub indicators developed from the data inserted by the
user in the front end web pages.
Each of indicators involved in the evaluation process contributes to the five well known
categories affecting cycling requirements. These are:
1. Cohesion – relates to continuity and readability of infrastructure
2. Directness – relates to directness in space (no detours) and directness in time (reduced
travel time).
3. Safety – Relates to safety from accidents and security from crime.
4. Comfort – Relates to physical comfort experience by cyclist, example shade and smooth
ride.
5. Attractiveness – Relates to visual and physical attractiveness of the route environment.
The evaluation is proposed to be presented as disaggregated results under each indicator in
each of the above categories. To arrive at an aggregated result or score, these results are

CyLOS- Final Report
SGArchitects Page 60
needed to be aggregated, for which they are assigned with defined weightages. Current
evaluation method uses assumed weightages assigned as default in the tool. However the
default values form in the tool allows users to change these weightages. It is proposed that the
default value of each of these weightages be arrived at using inputs from experts and
stakeholders in bicycle infrastructure planning. The same is proposed to be undertaken using a
questionnaire based survey (to be analysed using AHP method).
While city wide cycling network assessment is undertaken by directly inducing indicators
impacting the cycling status and prospective of a city and inserting their assessment along with
inputs, an overall representation of the city is done.
7.2 Evaluation Framework: Cycling Corridor/Route
Assessment of cycling route is based on segment based evaluation. Each route can be broken in
to distinct segments (based on features as well planning and design conditions), and input
separately. The tool shall undertake individual assessment of each segment and then aggregate
the same in to an overall evaluation by giving weightages based on length and road/street
category under each segment. For example infrastructure could be an independent track, on a
highway, on an arterial road, on a sub arterial road, on a collector street or on an access road.
Each road type presents a different context and hence weightages of indicators between these
cannot be the same. The assessment is undertaken separate for each side of the road (left hand
side (L.H.S) and right hand side (R.H.S), separate for mid blocks (between intersections) and
intersections. These separate evaluations are then aggregated in to an overall segment
evaluation (or an evaluation score). This evaluation when aggregated with their individual
indicator provides and overall assessment of each segment. Further different segment
assessment then combines to provide a route assessment.
7.2.1 Indicators: Cycling Corridor/Route
To simplify the process, the data points mentioned in the web forms, have been assessed under
80 multiple derived indicators. These indicators then combine and generate evaluation under
different primary indicators. A total of 26 primary indicators are evaluated. These indicators
combine to evaluate the infrastructure under each of the mentioned five categories. Figure 37
presents the relationship between these derived indicators, indicators and their categories.
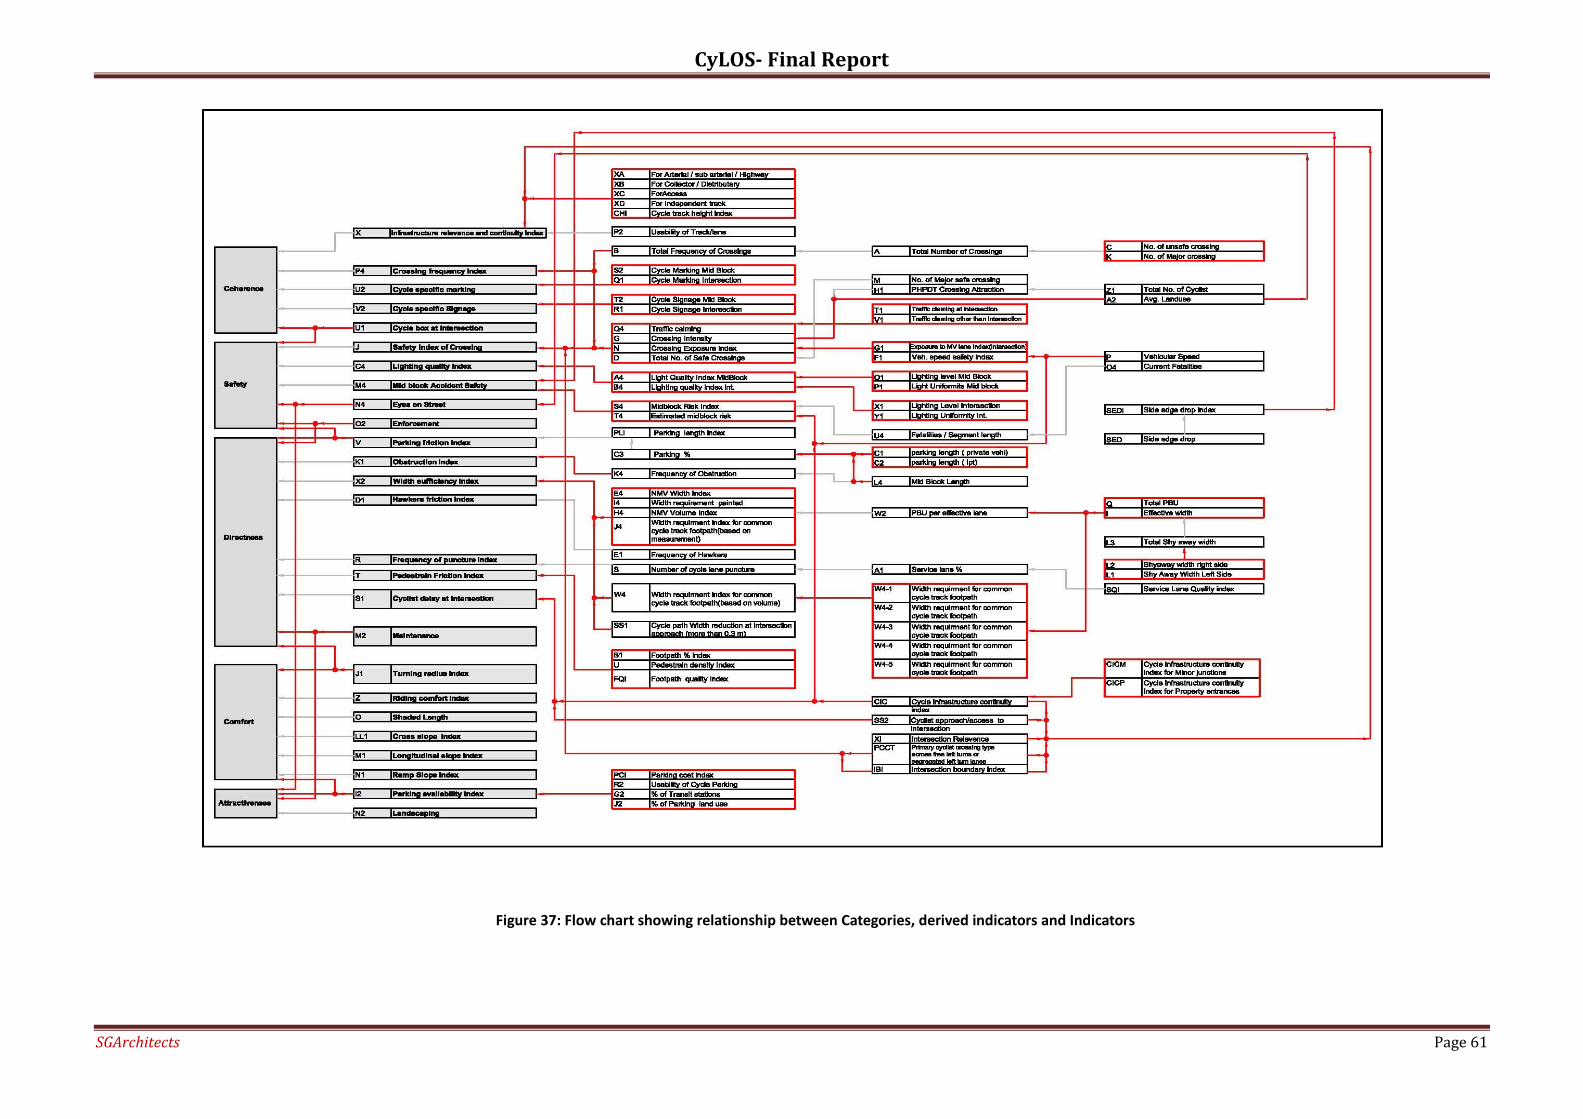
CyLOS- Final Report
SGArchitects Page 61
Figure 37: Flow chart showing relationship between Categories, derived indicators and Indicators

CyLOS- Final Report
SGArchitects Page 62
The 26 primary indicators used for the evaluation of cycling route/corridor are as follows:
1. Infrastructure Relevance and Continuity Index: This Indicator contributes to coherence
category and refers, how relevant is planned/constructed infrastructure to its context.
This indicator includes other sub indicators developed from the input inserted by the
user in front end web forms. These sub indicators are as follows:
Relevance of cycle infrastructure according to road typologies: Indicates the
relevance of the provided cycle infrastructure based on the type of road (Arterial,
Sub-arterial, Highway, collector, access and standalone track).
Usability of cycle tracks/ lane: Indicates the relevance of the provided cycle
infrastructure based on level of usability i.e. percentage of cyclist using the
facility along the segment.
Intersections Relevance: Indicates the relevance of the provided cycle
infrastructure based on the type of intersections (Signalized, un-signalized, one
lane roundabout, two lane round about, rotary and grade separated junction)
Primary cyclist crossing type at segregated left turns and on the intersection
boundary: Indicates the relevance of the provided cycle infrastructure based on
the cyclist crossing type provided on segregated left turns and on the boundaries
of the intersection.
Cycle infrastructure continuity at minor junctions and property entrances:
Indicates the relevance of the provided cycle infrastructure based on continuity
of cycle path at the minor junctions and the property entrances.
Cyclist approach to the intersections: Indicates the relevance of the provided
cycle infrastructure based on the type of infrastructure provided while
approaching an intersection.
Cycle track height index: Indicates the relevance of the provided cycle
infrastructure based on the height of the cycle facility on the segment.
2. Crossing frequency index: This Indicator contributes to coherence category and refers
to how frequent are available opportunities for cyclists to cross the road. Crossing
frequency index is based on the total frequency of the crossings existing on the cycle
path.
3. Cycle Specific Marking: This indicator contributes to coherence category and refers to
availability of adequate pavement marking to guide, warn and regulate cyclists. This
primary indicator is directly derived from the input inserted by the user in front end
web forms under the data points enquiring presence of cycle marking at midblock and
intersections.

CyLOS- Final Report
SGArchitects Page 63
4. Cycle specific Signage: This indicator contributes to coherence category and refers to
availability of adequate sign boards to guide, warn and regulate cyclists. This primary
indicator is directly derived from the input inserted by the user in front end web forms
under the data points enquiring presence of cycle signage at midblock and
intersections.
5. Cycle Box at Intersection: This indicator contributes to two categories- Safety and
Coherence. It indicates the availability of cycle box marking at intersection to hold
crossing cyclists. This indicator is directly derived from the input inserted by the user in
front end web forms under the data points enquiring presence of cycle box at
intersections.
6. Safety index of crossings: This indicator contributes to safety category and refers to the
level of safety in terms of crash risk and severity, at cyclist crossing facilities. This
Indicator aids to evaluates, how safe are the crossings for the cyclist. This primary
indicator includes other sub- indicators involved in evaluation process. These sub
indicators are as follows:
Traffic calming: Indicates the provision of traffic calming used at intersections and
other than intersections (midblock).
Intensity of crossings: Indicates crossing intensity of the cyclist based on the
weighted average land use along the segment and crossing attraction per hour
per direction.
Crossing exposure index: Based on cyclist exposure to MV lane and vehicular
speed safety index, indicates exposure of the cyclist while crossing at the
intersection.
Crossing attraction per hour per direction: Indicates crossing attraction of the
cyclist based on total number of cyclist.
Exposure to motor vehicle lane index: Depending on the number of lanes
provided in a segment helps in determining the exposure of cyclist at an
intersection while crossing.
Vehicle speed safety index: This index is developed based on the vehicular speed
and road type provided in the segment or the corridor indicating safety of the
cyclists.
Total number of safe crossings: Based on the number of major safe crossing
provided on the segment indicates safe crossings for the cyclists.
These sub- indicators are developed from the input inserted by the user in front end web forms
like presence of traffic calming, vehicular speed and number of lanes on the carriage way etc.
7. Lighting Quality Index: This indicator contributes to safety category and refers to the
quality of lighting in terms of level and uniformity at midblock and intersections. This

CyLOS- Final Report
SGArchitects Page 64
indicator includes the sub indicators - lighting quality index at midblock and
intersections. These sub- indicators are derived from the input inserted by the user in
front end web forms for lighting levels and uniformity at midblock and intersections.
8. Midblock accident Safety: This Indicator contributes to safety category and refers to the
assessment of accident risk for cyclist along the carriageway. This indicator is comprised
of many other sub indicators. These are:
Midblock risk index: The index, Indicates the amount of risk involved for the
cyclist at midblock based on the total number of fatalities per segment length.
Fatalities per segment length: Indicates the number of current fatalities on the
midblock.
Estimated midblock risk: This indicator estimates risk for the cyclist at midblock
based on the vehicular speed at the midblock section and the primary
segregation type of the cycle facility from the carriage way.
Side edge drop index: This index is developed on the basis of depth of the side
edge such that more the depth, high is the risk for the cyclist.
Cycle infrastructure continuity: Indicates level of risk of the cyclist involved based
on continuity of cycle path at the minor junctions and the property entrances .As
more the cycle facility is discontinuous at minor junctions and the property
entrances more it increases the chances for the cyclist to ply on the carriage way
rather than the provided cycle infrastructure causing accidents.
These sub- indicators are derived from the input inserted by the user in front end web forms
against the data points enquired side edge drop, current fatalities, cycle infrastructure
continuity at minor junctions and property entrances and vehicular speed.
9. Eyes on street: This Indicator contributes to two categories- Safety and Attractiveness.
It indicates assessment of level of activities along the segment ensuring security (safety)
as well as refers to attraction of cycling infrastructure in terms of life/ activity along
cycling path. Eyes on street are based on the percentage of the segment covered by
hawkers and the corresponding land use present on the either side of the
infrastructure.
10. Enforcement: This indicator contributes to two categories- Safety and Directness. It
indicates the assessment of level of enforcement to ensure safety on carriageway and
minimal loss of directness to cyclists. This primary indicator is directly derived from the
input inserted by the user in front end web forms under the data points enquiring level
of enforcement for the segment.
11. Friction from Car Parking: This indicator contributes to two different categories- Safety
and Directness. The indicator refers to the assessment of risk posed by street parking
and loss of directness from friction by street parking to commuting cyclists. This

CyLOS- Final Report
SGArchitects Page 65
indicator involves only one major sub indicator i.e. parking length index, which is based
on the percentage of parking availability depending upon the parking length inserted by
the user asked in the front end forms for the private vehicles and intermediate public
transport (IPT) separately.
12. Obstructions Index: This indicator refers to the assessment of loss of directness caused
by presence of obstruction in cycling path. Obstruction index is based on the frequency
of the obstruction existing on the cycle path. It contributes to directness category.
13. Width Sufficiency index: This indicator refers to the assessment of sufficiency of cycling
path width with respect to existing infrastructure typology. It contributes to directness
category. This primary indicator includes 6 major sub indicators. These are:
NMV width index: This index is created depending upon minimum width
provided and indicates the required width to be provided in case of segregated
cycle track
NMV volume index: This index is created depending upon PBU per effective lane
and indicates required volume in case of segregated cycle track. Passenger
bicycle unit or PBU is termed to be a unit equivalent of a single cycle in
comparison to other cycling modes discussed in the user input forms.
Width requirement for painted cycle track: Depending upon the minimum width
provided The indicator shows the width requirement, for a painted track or lane
Width requirement for common cycle track foot path (Measurement based): This
indicates requirement of width, needed for a common cycle track footpath based
on minimum width provided.
Width requirement for common cycle path (Volume based): This indicates
requirement of width needed for a common cycle track footpath based on the
combined volume of non motorized vehicles (NMV) and pedestrians.
Cycle track width reduction at intersection approach: While approaching any
intersection, this indicator shows the reduced width requirement such that if the
width of the cycle facility reduces by more than or equal to 0.3 meters will
reduce the directness of the cycle infrastructure.
These sub- indicators are developed from the input inserted by the user in front end web forms
like total shy-away width, total passenger bicycle unit (PBU), total number of pedestrians and
total number of cyclist.
14. Hawker friction index: The indicator contributes to directness and refers to the
assessment of loss of directness due to friction from hawkers on cycling path. Hawker
friction index is based on the frequency of the hawkers existing along the cycle path.
15. Frequency of punctures Index: This indicator contributes to directness and refers to
how often is cycling lane/path crossed by vehicular path to access service lane. This

CyLOS- Final Report
SGArchitects Page 66
indicator is derived, based on existing number of cycle lane punctures along the
corridor. The index signifies if the frequency of punctures is high then directness gets
reduced for the provided cycle facility. The numbers of cycle lane punctures varies
according percentage of service lane inserted by the user in the front end web forms.
Hence the quality of the service lane also affects the directness as if the service lane
provided is of poor quality will tend the cyclist to detour from the cycling path reducing
directness. The quality of service lane is determined by the service lane quality index.
16. Pedestrians Friction Index: This indicator contributes to directness and refers to the
assessment of loss of directness due to friction from pedestrians on cycle path. This
indicator is derived, based on pedestrian density index. The index signifies if the density
of the pedestrian is high i.e. space allocated to the pedestrians (sqm/person) is low, will
tend the pedestrians to move into the cycle path increasing friction between the
cyclists and pedestrian resulting in reduction of directness for the provided cycle
facility. The pedestrian friction varies according to on the percentage of footpath
provided along the cycle facility. Hence the quality of the footpath also affects the
directness as if the footpath provided is of poor quality will increase the cyclist
pedestrian friction on cycling path reducing directness. The quality of footpath is
determined by the footpath quality index.
17. Cyclist Delay at Intersection: This indicator contributes to directness and refers to the
assessment of loss of directness due to delay to cyclists at intersections. This indicator
includes 2 other aspects or sub indicators for evaluation. These are:
Cycle infrastructure continuity index: This index is created depending upon
continuity of cycle path at the minor junctions and the property entrances. It
indicates the loss of directness of the cyclist, in case cycle path is discontinuous
at the minor junctions and property entrances.
Cyclist approaches/ access to intersection index: This index is created depending
on the type of infrastructure provided while approaching an intersection. It
indicates the loss of directness of the cyclist, in case cycle path is discontinuous
while approaching an intersection.
18. Maintenance: This indicator contributes to two categories- Directness and
attractiveness. It indicates assessment of loss of directness due to friction cause by
poor maintenance/cleaning cycle infrastructure and attractiveness of cycling
infrastructure in terms of how well it is maintained. This indicator is directly derived
from the input inserted by the user in front end web forms under the data points
enquiring the maintenance level of the cycle infrastructure.
19. Turning Radius Index: The indicator contributes to two categories – Comfort and
Directness. This indicator refers to the assessment of loss of directness and comfort due
to tight turning radiuses on cycling path. This indicator is directly derived from the input

CyLOS- Final Report
SGArchitects Page 67
inserted by the user in front end web forms under the data points enquiring the turning
radius present on the cycle infrastructure.
20. Riding comfort Index: This indicator contributes to comfort category and refers to the
assessment of riding comfort with reference to surface type. This indicator is directly
derived from the input inserted by the user in front end web forms under the data
points enquiring the existing surface type on the cycle infrastructure.
21. Shaded Length: This indicator contributes to comfort category and refers to the
assessment of protection from weather in terms of shade/shelter over cycling path.
This indicator is directly derived from the input inserted by the user in front end web
forms under the data points enquiring the percentage of shaded length on the cycle
infrastructure.
22. Cross slope index: This indicator contributes to comfort category and refers to the
assessment of water runoff capability and comfortable riding cross slope. This indicator
is directly derived from the input inserted by the user in front end web forms under the
data points enquiring the cross slope given on the cycle infrastructure.
23. Longitudinal slope index: This indicator contributes to comfort category and refers to
the assessment of comfortable riding longitudinal slope. This indicator is directly
derived from the input inserted by the user in front end web forms under the data
points enquiring the cross slope given on the cycle infrastructure.
24. Ramp Slope Index: This indicator contributes to comfort category and refers to the
assessment of comfort of ramps provide to access egress from cycle path. This indicator
is directly derived from the input inserted by the user in front end web forms under the
data points enquiring the cross slope given on the cycle infrastructure.
25. Parking Availability: The indicator contributes to two categories – Comfort and
Attractiveness .The indicator refers to the assessment of cycling comfort and
attractiveness in terms of availability of safe and secure cycle parking. This indicator is
based on 4 other aspects or sub indicators for evaluation. These are:
Parking cost Index: The index reveals level of attractiveness, based on cost of
cycle parking per day along the segment.
Usability of cycle parking: This indicates percentage of cyclists using the parking
facility provided
Percentage of transit Stations: Indicates percentage of transit stations provided
with parking facility on the segment.
Percentage of parking land use: Indicates percentage of Land use served with
parking facility on the segment.
These sub- indicators are developed from the input inserted by the user in front end web forms
like total parking cost, percentage of parking covered by transit stations and land use.

CyLOS- Final Report
SGArchitects Page 68
26. Landscaping: This indicator contributes to attractiveness category and refers to
attractiveness of cycling infrastructure in terms of alongside landscaping/ plantation.
This indicator is directly derived from the input inserted by the user in front end web
forms under the data points enquiring the landscaping level on the cycle infrastructure.
7.2.2 Indicators Formulation: Cycling Corridor/Route
As mentioned earlier (Refer-6.4) in the front end user forms, each of the input in these forms
has been assigned a distinct number/code for evaluation and the same is used in the forms.
Detailed description of each input along with required information for users has already been
compiled in the user manual for the tool. Based on this numbering or coding, evaluation or
assessment for each of the derived indicators as well as the sub-indicators are defined as a
formula, linking inputs from the ‘front end’ forms (including user and default value forms).
For example: Formula for ‘Total number of crossing’ is represented as:
A= (3_3f+C+K+ ((4D_24a+4D_24b)*2_4
In the above formula, total number of crossings which is derived indicator is represented as ‘A’
Here ‘A’ refers to the derived indicator code. Similarly ’C’ refers to Number of Unsignalized
/Unsafe Crossing and ‘K’ refers to number of major crossings which are also derived indicators
but contribute in ‘A’, while code type {3_3f: Number of safe crossings (Segment information
form), 4D_24a and 4D_24b: number of grade separated cycle crossing fob and subways (Design
input data form for intersections and crossings) and 2_4: 50% of cyclist crossing considered in
case of grade separated crossing as default value( Default form)} all refers to inputs from the
user form.
Likewise formulas (relationships) are developed for each indicator and derived indicators
shown in Figure 37, which are involved in the evaluation process considering both sides i.e.
L.H.S and R.H.S using the assigned codes. Each component used in formulas, worked out for the
derived indicators are compiled and presented together in Annexure10.1
Assessment of transit access influence area is based on link based evaluation. Each route can be
broken in to distinct links (based on features as well planning and design conditions), and input
separately. The tool shall undertake individual assessment of each link and then aggregate the
same in to an overall evaluation by giving weightages based on length and road/street category
under each link. The assessment is undertaken separate for each side of the road (left hand side
(L.H.S) and right hand side (R.H.S), separate for mid blocks (between intersections) and
intersections. These separate evaluations are then aggregated in to an overall link evaluation
(or an evaluation score).This evaluation when aggregated with their individual indicator

CyLOS- Final Report
SGArchitects Page 69
provides and overall assessment of each link. Different link assessment then combines to
provide a route assessment.
7.2.3 Indicators: Transit access Influence area
As the data points and the input web forms, are similar to that of the cycle corridor/ route
evaluation type hence the indicators and the evaluation process is worked out on the similar
grounds. Therefore, alike derived indicators are being deployed for transit access influence area
evaluation type. Therefore web forms have been assessed based on 80 multiple derived
indicators. These indicators further combine and generate evaluation under different primary
indicators. Total 26 primary indicators are identified for evaluation. These indicators combine to
evaluate the infrastructure under each of the mentioned five categories. But as this transit area
evaluation type is based on links, in some of the derived indicators, new sub indicators are
induced based on the links.
For example: Crossing frequency index contributing to coherence category in corridor/ route
evaluation type is replaced by Accessibility index (coded as P4) in transit access influence area
evaluation. Although this derived indicator also contributes to coherence category but includes
a new sub indicator: Link density index. The ‘Link density index’ (coded as Y3) indicates average
distance between two distinct links. This sub-indicator is developed from the input inserted by
the user in front end web forms under the data points enquiring the total number of links
(primary + secondary) existing in the transit area, and the catchment of the transit station.
Figure 38 presents the relationship between these derived indicators, indicators and their
categories.

CyLOS- Final Report
SGArchitects Page 70
Figure 38: Flow chart showing relationship between Categories, derived indicators and Indicators ( transit access influence area

CyLOS- Final Report
SGArchitects Page 71
It can be observed from the above indicator relationship flowchart; only one derived indicator
i.e. Accessibility index (coded as P4), which has been explained in detail in above example,
differs from the indicators used for evaluating cycling route /corridor. Rest all the other 25
primary indicators are identical and are already explained in detail in the previous section
(7.2.1)
7.2.4 Indicators Formulation: Transit access Influence area
Since the indicators used in transit access influence area same as the indicators used in cycle
corridor/route evaluation type. Therefore the formulas developed are also identical except for
the formulas developed for Accessibility index (coded as P4), where the new sub indicators ‘Link
density index’ (coded as Y3) and Representation of Link density (coded as Y4) are induced.
These indicators formulas are developed, linking inputs from the ‘front end’ forms (including
user and default value forms). As mentioned earlier (Refer-6.4) in the front end user forms each
input in these forms has been assigned a distinct number/code for evaluation and the same is
used in the forms. Detailed description of each input along with required information for users
has already been compiled in the user manual for the tool. Based on this numbering or coding,
assessment for the derived indicators as well as the sub- indicators is worked out.
For example: Formula for ‘Representation of Link density’ is represented as:
Y4 = (2_151*4)/ (1_7-1)
In the above formula, Representation of Link density, which is an indicator is represented as
‘Y4’ Here ‘Y4’ refers to the indicator code. While code type {2_151: Accessibility influence zone
radius (Default form), 1_7: number of links to be evaluated (Base data form for transit access
influence area)} all refers to inputs from the user form.
Likewise formulas (relationships) are developed for each indicator and derived indicators
shown in Figure 38, which are involved in the evaluation process considering both sides i.e.
L.H.S and R.H.S using the assigned codes. Each component used in formulas, worked out for the
derived indicators are compiled and presented together in AnnexureError! Reference source
ot found. Rest all the formulas developed for each primary indicator are identical to the
formulas developed for corridor/ route evaluation.
7.3 Evaluation Framework: City wide cycling network
‘City wide cycling network’ evaluation, proposes to evaluate cycle infrastructure of a city under
two different categories:
1. Cycling Friendly City (Current Status): This refers to the present state of the city in
terms of its structure and compatibility of its cycling infrastructure.
CyLOS- Final Report
SGArchitects Page 72
2. Cycling Friendly City (Potential Status): This refers to the potential state of the city for it
to achieve a higher cycling friendly status.
Taking both this categories into consideration, certain indicators are identified contributing to
each category. These indicators are based on the input data provided by the user in the front
end input forms. These indicators further combine and generate primary indicators. The tool
undertakes the assessment of each primary indicator separately and then aggregates the same
in to an overall evaluation score to provide a city level assessment separately for the both
mentioned categories.
7.3.1 Indicators: City wide cycling network
The data points mentioned in the web forms, have been assessed under 11 multiple derived
indicators. These indicators then combine and generate evaluation under different primary
indicators. A total of 10 primary indicators are identified for evaluation of city wide cycling
network. These primary indicators are distributed in two parts to evaluate the city level of
service under each of the mentioned criteria’s. Figure 39 presents the relationship between
these derived indicators, indicators and their categories.

CyLOS- Final Report
SGArchitects Page 73
Figure 39: Flow chart showing relationship between Categories, derived indicators and Indicators ( City wide cycling Network)

CyLOS- Final Report
SGArchitects Page 74
The 10 primary indicators used for the evaluation of City wide cycling network are as follows:
Ratio of current choice cyclist: This indicator addresses which income group is cycling
(whether choice commuters are cycling) and how much is the average distance they are
travelling by cycle. This indicator includes other sub indicators developed from the input
inserted by the user in front end web forms. These sub indicators are as follows:
Cycling trip length: Indicates the trip length covered by the cyclist in the city.
Cumulative income index: Indicates the income level of cyclist in the city.
Safety: This indicator addresses how safe the city is in terms of accidents and provision of
lighting. This indicator includes other sub indicators developed from the input inserted by the
user in front end web forms. These sub indicators are as follows:
Lighting index: Indicates the level of lighting in the city
Risk exposure index: Indicates the level of risk posed by the cyclist in the city.
Speed limit restrictions: Indicates the speed limit of the motor vehicles in the city.
User perception index-1- Safety from accidents: Indicates the level of safety for the
cyclists from accidents in the city.
Security: This indicator addresses how secure the city from street crime. This indicator
includes other sub indicators developed from the input inserted by the user in front end web
forms. These sub indicators are as follows:
Lighting index: Indicates the level of lighting in the city in terms of security
User perception index-2- Safety from crime: Indicates the level of safety for the
cyclists from crime in the city.
Parking Availability: This indicator addresses the availability of parking across the city.
Road Network Compliance Index: This indicator addresses if the current road network
across all road types is cycling compatible.
Environment: This indicator addresses, how the current environment i.e. ambient air
quality and noise pollution of the city affecting the cycling environment. This indicator
includes other sub indicators developed from the input inserted by the user in front end web
forms. These sub indicators are as follows:
Ambient air quality: Indicates the air quality level of the city.
Noise pollution: Indicates the noise pollution level of the city.

CyLOS- Final Report
SGArchitects Page 75
Trip Length: This indicator addresses the average distance a cyclist travels across the city.
Ownership per 100000 population: This indicator addresses the bicycle ownership in the
city per 100000 population.
Investment: This indicator addresses the investment undertaken in the city for the NMT
facilities. This indicator includes other sub indicators developed from the input inserted by
the user in front end web forms. These sub indicators are as follows:
City Budget: Indicates the budget or revenue allotted to the city.
Land allocated for NMT facility: Addresses land availability designated for NMT
facilities in the city.
Proximity to Transit Stops: This indicator addresses the number of households which lie
within proximity of transit stops.
7.3.2 Indicators Formulation: City wide cycling network
Assessment for each of the primary indicators as well as the sub-indicators involved in the
evaluation process are defined as a formulas, linking inputs from the ‘front end’ forms
(including user and default value forms). These formulas (relationships) are developed for each
of the indicator and sub-indicators as shown in Figure 39 using the assigned codes. The coding
process is already been explained in the previous two previous evaluation types under sections
(7.2.2 and 7.2.4)

CyLOS- Final Report
SGArchitects Page 76
8 CyLOS - Evaluation weightages Weightages indicate relative importance of indicators and indicator categories. They are used
to consolidate scores under individual indicators into a single overall score for evaluation,
comparison and decision making. Weightages are given and used as percentage values.
8.1.1 Need of weightages
Weightages need to be allocated to each indicator in a category and to the category as a whole.
Indicator weightages: Some indicators are represented in more than one category; here
different weightages for the same indicator in different categories may be required.
Additionally weightages need to be defined specific to each context. For example,
infrastructure could be an independent track, on a highway, on an arterial road, on a sub
arterial road, on a collector street or on an access road. Each road type presents a different
context and hence weightages of indicators between these cannot be the same. All indicators
within a category are given percentage weights of the sum total of which is 100 percent. Higher
percentage is assigned to indicators with higher relative importance. In that sense percentage
weights are representation of an indicators importance in each category.
Category weightages: Similarly percentage weight of each category is representation of the
relative importance of that category in the overall cycling infrastructure assessment for a
particular road type. For example, safety may have a higher weightages for an arterial road,
and relatively lower on a collector or an access road.
Therefore, weightages have been assigned separately for indicators and indicator categories.
8.1.2 Evaluation of weightages
The evaluation of each individual indicator, when aggregated with their individual indicator
weights provides and overall assessment of each segment/link. Further different individual
assessment when aggregated with the assigned category weightages provides an overall
assessment of the route. In case of city level evaluation, indicators are directly aggregated with
their individual indicator weights to provide an overall assessment of the city.
Weightages for indicators and indicator categories needs to be estimated using expert
feedbacks. The weightages assigned in the CyLOS tool are been estimated on the basis of expert
reviews undertaken using a questionnaire based survey (to be analysed using AHP method).
For the purpose CyLOS team participated in the NMT workshop organised by TRIPP (IITD).Here
presentation on CyLOS tool was conducted for the invited experts. The experts were presented
with an AHP based form, to establish relative weightages for the five main indicator categories
(Coherence, Directness, Safety, Comfort and Attractiveness) based on the different road

CyLOS- Final Report
SGArchitects Page 77
typology ( i.e. Arterial road, collector road, local streets and stand alone cycle infrastructure)
separately. Based on the feedback collected from these experts on the survey feedback forms
relative scoring was fed in AHP matrix to evaluate relative weightages. Geometric mean of the
scores from each individual was fed in AHP matrix, to estimate the final weights presented in
Table 3. A sample of the AHP survey form is presented in Annexure 10.4. The same format and
the set of the questions were used for each of the road types.
Weightages for the individual indicators within each category has been finalised based on the
internal discussion with Dr. Geetam Tiwari from TRIPP, IIT Delhi. These indicator and category
weightages have also been included in the NMT Guideline prepared by TRIPP (IIT-Delhi).Current
evaluation method in the CyLOS tool uses these weightages assigned as default values.
Simultaneously survey forms for evaluation of individual indicators have been designed and
distributed to the school children in about 70 schools. Responses from these schools are
expected in May 2014, following which the set of the default values will be updated. The survey
forms both in English and Hindi versions are presented in (Annexure10.5 and 10.6)
Table 3 presents the assumed weightages for each indicator, and for each category under
different conditions.
Table 3: Assumed weightages for each indicator and Category under Different
conditions

CyLOS- Final Report
SGArchitects Page 78
Cat
ego
ry
Category Weight Indicators Description Category Specific Indicator
Weight Overall Indicator Weight%
Hig
hw
ay, A
rter
ial
or
Sub
art
eri
al
Co
llect
or/
Dis
trib
uto
ry
Acc
ess
Stan
dal
on
e/
Ind
epen
den
t
Indicators Description
Hig
hw
ay, A
rter
ial
or
Sub
art
eri
al
Co
llect
or/
Dis
trib
uto
ry
Acc
ess
Stan
dal
on
e/
Ind
epen
den
t
Hig
hw
ay, A
rter
ial
or
Sub
art
eri
al
Co
llect
or/
Dis
trib
uto
ry
Acc
ess
Stan
dal
on
e/
Ind
epen
den
t
Co
her
ence
20
%
20
%
25
%
25
%
Infrastructure Relevance
How relevant is planned/constructed infrastructure to its context 35% 45% 65% 50% 7.00% 9.00% 16.25% 12.50%
Frequency of cycle crossings
How frquent are available opportunities for cyclists to cross the road 35% 25% 5% 5% 7.00% 5.00% 1.25% 1.25%
Cycle Specific Marking
Availability of adequate pavement marking to guide, warn and regulate cyclists 10% 10% 10% 20% 2.00% 2.00% 2.50% 5.00%
Cycle Specific signage
Availability of adequate sign boards to guide, warn and regulate cyclists 10% 10% 10% 20% 2.00% 2.00% 2.50% 5.00%
Cycle Box at Intersection
Availability of cycle box marking at intersection to hold crossing cyclists 10% 10% 10% 5% 2.00% 2.00% 2.50% 1.25%
Total 100% 100% 100% 100%
Safe
ty
30
%
30
%
30
%
15
%
Cycle Box at Intersection
Availability of cycle box marking at intersection to hold crossing cyclists 5% 5% 5% 5% 1.50% 1.50% 1.50% 0.75%
Crossing Safety Index
What is the level of safety in terms of crash risk and severity, at cyclist crossing facilities 20% 20% 5% 5% 6.00% 6.00% 1.50% 0.75%
Lighting quality index
What is the quality of lighting in terms of level and uniformity 15% 10% 20% 20% 4.50% 3.00% 6.00% 3.00%
Mid block accident safety
Assesment of accident risk for cyclist along the carriageway 25% 20% 15% 5% 7.50% 6.00% 4.50% 0.75%
Eyes on street Assesment of level of activity along segment, to ensure security 20% 20% 25% 50% 6.00% 6.00% 7.50% 7.50%

CyLOS- Final Report
SGArchitects Page 79
Enforcement Assessment of level of enforcement to ensure safety on carriageway. 5% 10% 5% 10% 1.50% 3.00% 1.50% 1.50%
Parking Friction Index
Assessment of risk posed by street parking to commuting cyclists 10% 15% 25% 5% 3.00% 4.50% 7.50% 0.75%
Total 100% 100% 100% 100%
Dir
ectn
ess
30
%
30
%
25
%
25
%
Enforcement
Assessment of level of enforcement to ensure minimal loss of directness to cyclists. 5% 10% 5% 5% 1.50% 3.00% 1.25% 1.25%
Parking Friction Index
Assessment of loss of directness from friction by street parking to commuting cyclists 8% 25% 20% 5% 2.40% 7.50% 5.00% 1.25%
Obstruction Index
Assessment of loss of directness casued by presence of abstruction in cycling path 21% 20% 20% 20% 6.30% 6.00% 5.00% 5.00%
Width Sufficiency Index
Assesment of sufficiency of cycling path width with respect to vehicle size and cycle volume 21% 15% 5% 25% 6.30% 4.50% 1.25% 6.25%
Hawker Friction Index
Assesment of loss of directness due to friction from hawkers on cycling path 10% 5% 8% 8% 3.00% 1.50% 2.00% 2.00%
Frequency of punctures
How often is cycling lane/path crossed by vehicular path to access service lane/property entrance, etc. 8% 5% 2% 2% 2.40% 1.50% 0.50% 0.50%
Pedestrian Friction Index
Assessment of loss of directness due to friction from pedestrians on cycle path 15% 10% 20% 15% 4.50% 3.00% 5.00% 3.75%
Cyclist Delay at Intersection
Assesment of loss of directness due to delay to cyclists at intersections 4% 4% 6% 6% 1.20% 1.20% 1.50% 1.50%
Maintenance
Assesment of loss of directness due to friction cause by poor maintenance/ cleaning cycle infrastructure 4% 4% 10% 10% 1.20% 1.20% 2.50% 2.50%
Turning Radius Assessment of loss of directness due to tight turning radiuses on cycling path 4% 2% 4% 4% 1.20% 0.60% 1.00% 1.00%

CyLOS- Final Report
SGArchitects Page 80
Total 100% 100% 100% 100% C
om
fort
15
%
15
%
15
%
20
%
Turning Radius Assessment of loss of comfort due to tight turning radii on cycling path 8% 5% 5% 15% 1.20% 0.75% 0.75% 3.00%
Riding Comfort Index
Assement of riding comfort with reference to surface type 35% 35% 35% 35% 5.25% 5.25% 5.25% 7.00%
Shaded Length
Assessment of protection from wether in terms of shade/shelter over cycling path 20% 20% 25% 25% 3.00% 3.00% 3.75% 5.00%
Cross Slope Index
Assessment of water runoff capability and comfortable riding cross slope 7% 5% 3% 3% 1.05% 0.75% 0.45% 0.60%
Longitudenal Slope Index
Assessment of comfortable riding longitudenal slope 20% 25% 25% 15% 3.00% 3.75% 3.75% 3.00%
Ramp Slope Index
Assessment of comfort of ramps provide to access egress from cycle path. 5% 5% 2% 2% 0.75% 0.75% 0.30% 0.40%
Parking Availability Index
Assesment of cycling comfort in terms of availability of safe and secure cycle parking 5% 5% 5% 5% 0.75% 0.75% 0.75% 1.00%
Total 100% 100% 100% 100%
Att
ract
iven
ess
5%
5%
5%
15
%
Parking Availability Index
Assesment of cycling comfort in terms of availability of safe and secure cycle parking 25% 20% 10% 5% 1.25% 1.00% 0.50% 0.75%
Eyes on Street Attraction of cycling infrastructure in terms of life/ activity along cycling path 20% 20% 25% 40% 1.00% 1.00% 1.25% 6.00%
Maintenance Attractiveness of cycling infrastructure in terms of how well it is maintained 40% 40% 40% 30% 2.00% 2.00% 2.00% 4.50%
Landscaping
Attractiveness of cycling infrastructure in terms of along side landscaping/ plantation 15% 20% 25% 25% 0.75% 1.00% 1.25% 3.75%
Total 100% 100% 100% 100% 100% 100% 100% 100% 100% 100% 100% 100%

CyLOS- Final Report
SGArchitects Page 81
The weightages assigned for each indicator and indicator categories according to the evaluation
type are presented in the below sections:
8.1.3 Category and indicator weightages assigned in CyLOS tool – For Corridor and
transit area evaluation
A total 26 indicators were identified for the evaluation under 5 main categories for corridor and
transit area evaluation (Refer: 7.2.1and 7.2.3). Some of these indicators contribute to more
than one category hence based on the expert’s feedbacks the weightages are assigned by the
CyLOS tool accordingly for each category and individual indicators contributing to the
categories. These are as follows:
1. Coherence –Weightages specific to road category is provided such that weightages of all
the categories for each road type totals to 100 percent. The weightages assigned are as
follows:
Highway, Arterial, sub arterial – 20%
Collector , distributary – 20%
Access – 25%
Standalone or independent cycle track- 25%
Individual indicator weightages under Coherence Category:
a) Infrastructure Relevance: The weightages assigned by the tool for the infrastructure
relevance is 35% for Highway, 45% for Collector/Distributor, 65% for Access and 50% for
Standalone. The user can modify this. Weightages should be assigned as per the planned
or exiting infrastructure along the cycle path, in the overall evaluation.
b) Frequency of cycle crossings: The weightages assigned by the tool for the frequency of
cycle crossings is 35% for Highway, 25% for Collector/Distributor, 5% for access and 5%
for Standalone. The user can modify this. Weightages should be assigned as per the
context and available frequent opportunity for cyclist to cross the road, in the overall
evaluation.
c) Cycle specific marking: The weightages assigned by the tool for the cycle specific
marking is 10% for Highway, 10% for Collector/Distributor, 10% for Access and 20% for
Standalone. The user can modify this. Weightages should be assigned as per the
availability of the adequate pavement marking to guide, warn and regulate cyclists, in
the overall evaluation.
d) Cycle Specific signage: The weightages assigned by the tool for the frequency of cycle
crossings is 10% for Highway, 10% for Collector/Distributor, 10% for Access and 20% for

CyLOS- Final Report
SGArchitects Page 82
Standalone. The user can modify this. Weightages should be assigned as per the
availability of the adequate sign boards to guide, warn and regulate cyclists, in the
overall evaluation.
e) Cycle Box at intersection: The weightages assigned by the tool for the frequency of
cycle crossings is 10% for Highway, 10% for Collector/Distributor, 10% for Access and 5%
for Standalone. The user can modify this. Weightages should be assigned as per the
relative importance of the availability of cycle box marking at the intersections to hold
the cyclists crossing the road, in the overall evaluation.
2. Safety –Weightages specific to road category is provided such that weightages of all the
categories for each road totals to 100 percent. The weightages assigned are as follows:
Highway, Arterial, sub arterial – 30%
Collector , distributary – 30%
Access – 30%
Standalone or independent cycle track- 15%
Individual indicator weightages under Safety Category:
a) Crossing Safety Index: The weightages assigned by the tool for crossing safety index is
20% for Highway, 20% for Collector/Distributor, 5% for Access and 5% for Standalone.
The user can modify this. Weightages should be assigned as per the level of safety in
terms of crash risk and severity at cyclists crossing facilities, in the overall evaluation.
b) Lighting Quality Index: The weightages assigned by the tool for the lighting quality index
is 15% for Highway, 10% for Collector/Distributor, 20% for Access and 20% for
Standalone. The user can modify this. Weightages should be assigned as per the level of
lighting quality in terms of lux level and uniformity, in the overall evaluation.
c) Mid block accident safety: The weightages assigned by the tool for the mid block
accident safety is 25% for Highway, 20% for Collector/Distributor, 15% for Access and 5%
for Standalone. The user can modify this. Weightages should be assigned by assessment
of accident risk for cyclist along the carriageway, in the overall evaluation.
d) Eyes on street: The weightage assigned by the tool for eyes on street is 20% for Highway,
20% for Collector/Distributor, 25% for Access and 50% for Standalone. The user can
modify this. Weightage should be assigned by assessment of level of activity along the
segment to ensure safety, in the overall evaluation.
e) Enforcement: The weightage assigned by the tool for enforcement is 5% for Highway,
10% for Collector/Distributor, 5% for Access and 10% for Standalone. The user can

CyLOS- Final Report
SGArchitects Page 83
modify this. Weightage should be assigned by assessment of level of enforcement to
ensure safety on carriageway, in the overall evaluation.
f) Cycle Box at Intersection: The weightage assigned by the tool for the cycle box at
intersection is 5% for Highway, 5% for Collector/Distributor, 5% for Access and 5% for
Standalone. The user can modify this. Weightage should be assigned as per the
availability of cycle box marking at the intersection to hold crossing cyclist, in the overall
evaluation.
g) Parking friction Index: The weightage assigned by the tool for the parking friction index
is 10% for Highway, 15% for Collector/Distributor, 25% for Access and 5% for Standalone.
The user can modify this. Weightage should be assigned by assessment of risk posed by
street parking for commuting cyclist, in the overall evaluation.
3. Directness – Weightages specific to road category is provided such that weightages of all
the categories for each road totals to 100 percent. The weightages assigned are as
follows:
Highway, Arterial, sub arterial – 30%
Collector , distributary – 30%
Access – 25%
Standalone or independent cycle track- 25%
Individual indicator weightages under Directness Category:
a) Enforcement: The weightages assigned by the tool for enforcement is 5% for Highway,
10% for Collector/Distributor, 5% for Access and 5% for Standalone. The user can modify
this. Weightages should be assigned by assessment of level of enforcement to ensure
minimal loss of directness to cyclists, in the overall evaluation.
b) Parking Friction Index: The weightages assigned by the tool for the parking friction index
is 8% for Highway, 25% for Collector/Distributor, 20% for Access and 5% for Standalone.
The user can modify this. Weightage should be assigned by assessment of loss of
directness from friction by street parking to commuting cyclists, in the overall
evaluation.
c) Obstruction Index: The weightage assigned by the tool for the obstruction index is 21%
for Highway, 20% for Collector/Distributor, 20% for Access and 20% for Standalone. The
user can modify this. Weightage should be assigned by assessment of loss of directness
caused by presence of obstructions in the cycling path, in the overall evaluation.

CyLOS- Final Report
SGArchitects Page 84
d) Width Sufficient Index: The weightage assigned by the tool for width sufficient index is
21% for Highway, 15% for Collector/Distributor, 5% for Access and 25% for Standalone.
The user can modify this. Weightage should be assigned by assessment of sufficiency of
cycling path width with respect to vehicle size and cycle volume, in the overall
evaluation.
e) Hawker Sufficient Index: The weightage assigned by the tool for hawker sufficient index
is 10% for Highway, 5% for Collector/Distributor, 8% for Access and 8% for Standalone.
The user can modify this. Weightage should be assigned by assessment of loss of
directness due to friction from hawkers on cycling path, in the overall evaluation.
f) Frequency of Punctures: The weightage assigned by the tool for frequency of punctures
is 8% for Highway, 5% for Collector/Distributor, 2% for Access and 2% for Standalone.
The user can modify this. Weightage should be assigned by assessment of cycling path/
lane crossed by vehicle path to access service lane/ property entrance, in the overall
evaluation.
g) Pedestrian Friction Index: The weightage assigned by the tool for pedestrian friction
index is 15% for Highway, 10% for Collector/Distributor, 20% for Access and 15% for
Standalone. The user can modify this. Weightage should be assigned by assessment of
loss of directness due to friction from pedestrians on cycling path, in the overall
evaluation.
h) Cyclist delay at Intersection: The weightage assigned by the tool for cyclist delay at
intersection is 4% for Highway, 4% for Collector/Distributor, 6% for Access and 6% for
Standalone. The user can modify this. Weightage should be assigned by assessment
ofloss of directness due to delay to cyclists at intersections, in the overall evaluation.
i) Maintenance: The weightage assigned by the tool for maintenance is 4% for Highway,
4% for Collector/Distributor, 10% for Access and 10% for Standalone. The user can
modify this. Weightage should be assigned by assessment of loss of directness due to
friction caused by poor maintenance and cleaning of the cycle infrastructure, in the
overall evaluation.
j) Turning radius: The weightage assigned by the tool for turning radius is 4% for Highway,
2% for Collector/Distributor, 4% for Access and 4% for Standalone. The user can modify
this. Weightage should be assigned by assessment of loss of directness due to tight
turning radius on the cycling path/ lane, in the overall evaluation.
4. Comfort – Weightages specific to road category is provided such that weightages of all
the categories for each road totals to 100 percent. The weightages assigned are as
follows:
Highway, Arterial, sub arterial – 15%

CyLOS- Final Report
SGArchitects Page 85
Collector , distributary – 15%
Access – 15%
Standalone or independent cycle track- 20%
Individual indicator weightages under comfort Category:
a) Turning radius: The weightage assigned by the tool turning radius is 8% for Highway, 5%
for Collector/Distributor, 5% for Access and 15% for Standalone. The user can modify
this. Weightage should be assigned by assessment of loss of directness due to tight
turning radius on the cycling path/ lane, in the overall evaluation.
b) Riding Comfort Index: The weightage assigned by the tool for riding comfort index is
35% for Highway, 35% for Collector/Distributor, 35% for Access and 35% for Standalone.
The user can modify this. Weightage should be assigned by assessment of riding comfort
with reference to surface type, in the overall evaluation.
c) Shaded Length: The weightage assigned by the tool for the shaded length is 20% for
Highway, 20% for Collector/Distributor, 25% for Access and 25% for Standalone. The user
can modify this. Weightage should be assigned by assessment of protection from
weather in terms of shade over cycling path, in the overall evaluation.
d) Cross Slope Index: The weightage assigned by the tool for the cross slope index is 7% for
Highway, 5% for Collector/Distributor, 3% for Access and 3% for Standalone. The user
can modify this. Weightage should be assigned by assessment of water runoff capability
and comfortable riding cross slope, in the overall evaluation.
e) Longitudinal Slope Index: The weightage assigned by the tool for longitudinal slope
index is 20% for Highway, 25% for Collector/Distributor, 25% for Access and 15% for
Standalone. The user can modify this. Weightage should be assigned by assessment of
comfortable riding along the longitudinal slope, in the overall evaluation.
f) Ramp Slope Index: The weightage assigned by the tool for ramp slope index is 5% for
Highway, 5% for Collector/Distributor, 2% for Access and 2% for Standalone. The user
can modify this. Weightage should be assigned by assessment of comfort of ramp
provided to access the egress from the cycle path, in the overall evaluation.
g) Parking Availability Index: The weightage assigned by the tool for ramp slope index is
5% for Highway, 5% for Collector/Distributor, 5% for Access and 5% for Standalone. The
user can modify this. Weightage should be assigned by assessment of cycling comfort in
terms of availability of safe and secure cycle parking, in the overall evaluation.

CyLOS- Final Report
SGArchitects Page 86
5. Attractiveness – Weightages specific to road category is provided such that weightages
of all the categories for each road totals to 100 percent. The weightages assigned are as
follows:
Highway, Arterial, sub arterial – 5%
Collector , Distributary – 5%
Access – 5%
Standalone or independent cycle track- 15%
Individual indicator weightages under Attractiveness Category:
a) Parking Availability Index: The weightages assigned by the tool for parking availability
index is 25% for Highway, 20% for Collector/Distributor, 10% for Access and 5% for
Standalone. The user can modify this. Weightages should be assigned by assessment of
cycling comfort in terms of availability of safe and secure cycle parking, in the overall
evaluation.
b) Eyes on street: The weightages assigned by the tool for eyes on street is 20% for
Highway, 20% for Collector/Distributor, 25% for Access and 40% for Standalone. The user
can modify this. Weightages should be assigned by assessment of attraction of cycling
infrastructure in terms of level of activity along the cycle path, in the overall evaluation.
c) Maintenance: The weightages assigned by the tool for maintenance is 40% for Highway,
40% for Collector/Distributor, 40% for Access and 30% for Standalone. The user can
modify this. Weightages should be assigned by assessment of attractiveness of cycling
infrastructure in terms of its maintenance and cleanliness, in the overall evaluation.
d) Landscaping: The weightage assigned by the tool for landscaping is 15% for Highway,
20% for Collector/Distributor, 25% for Access and 25% for Standalone. The user can
modify this. Weightages should be assigned by assessment of attractiveness of cycling
infrastructure in terms of landscaping and plantation along the cycle path, in the overall
evaluation.
8.1.4 Category and indicator weightages assigned in CyLOS tool – For City level
evaluation
A total 10 indicators were identified for the evaluation under 2 categories for city level
evaluation (Refer: 7.3.1). Hence based on the expert’s feedbacks the weightages are assigned
by the CyLOS tool for each individual indicators contributing to the categories .These are as
follows:

CyLOS- Final Report
SGArchitects Page 87
1. Ratio of commuting choice cyclists: The weightage assigned by the tool is 15% for this
indicator,
Individual sub -indicator weightages under Ratio of commuting choice cyclists are as
follows:
a) Cycling Trip length: The default weightage provided in the tool is 40%. This indicator
has three input values and individual weightage for each is provided
For Trips less than 1 km: The default weightage provided in the tool is 10%.
For trips between 1 and 5 km: The default weightage provided in the tool is 60%.
For trips between 5km and 10 km: The default weightage provided in the tool is 30%.
b) Cumulative Income Index: The default weightage provided in the tool is 60%. This
indicator has three input values and individual weightage for each is provided
For <15000 per month: The default weightage provided in the tool is 10%.
More than 15000 per month and less than equal to 35000 per month: The default
weightage provided in the tool is 60%.
More than 35000 per month: The default weightage provided in the tool is 30%.
2. Safety: The weightage assigned by the tool is 15%.
Individual sub -indicator weightages under safety are as follows:
a) Lighting Index: The default weightage provided in the tool is 40%.
b) Risk Exposure Index: The default weightage provided in the tool is 30%.
c) Speed Limit Restrictions: The default weightage provided in the tool is 20%.
d) User Perception Index – Safety from accidents: The default weightage provided in the
tool is 10%.
3. Security: The weightage assigned by the tool is 15%.
Individual sub -indicator weightages under Security are as follows:
a) Lighting Index: The default weightage provided in the tool is 80%.
b) User Perception Index – Security from Crime: The default weightage provided in the
tool is 20%.
4. Parking availability: The weightage assigned by the tool is 15%.
5. Road network compatibility index: The weightage assigned by the tool is 15%.
6. Environment: The weightage assigned by the tool is 15%.
Individual sub -indicator weightages under environment are as follows:

CyLOS- Final Report
SGArchitects Page 88
a) Ambient Air Quality : The default weightage provided in the tool is 84%. This indicator
has four inputs values and individual weightage for each is provided.
NOx: The default weightage provided in the tool is 25%.
SO2: The default weightage provided in the tool is 25%.
PM10: The default weightage provided in the tool is 25%.
PM2.5: The default weightage provided in the tool is 25%.
b) Noise: The default weightage provided in the tool is 16%.
7. Trip Length: The weightage assigned by the tool is 50%.
8. Ownership: The weightage assigned by the tool is 20%.
9. Investment: The weightage assigned by the tool is 20%.
Individual sub -indicator weightages under investment are as follows:
a) City Budgets: The default weightage provided in the tool is 40%.
b) % of land allocated to NMT Facilities: The default weightage provided in the tool is 60%.
10. Proximity to Transit stops: The weightage assigned by the tool is 10%.

CyLOS- Final Report
SGArchitects Page 89
9 Way Forward The next step is to conduct workshops in the cities explaining the use of tool and its
implementation. This aim of the workshops will be to gather information and feedback from
different stakeholders on the indicators used in the tool. The idea is to spread awareness in
different cities about the tool and manual. The website developed for the tool, www.cylos.in
will also be introduced during the workshops along with the detail manual to the different
stakeholders. This will help in getting feedback on the user friendliness of the tool and manual.
The feedback received from different stakeholders and government officials will be further
analysed and modifications will be done in the tool based on that.

CyLOS- Final Report
SGArchitects Page 90
10 Annexure
10.1 Annexure 1 – Components used in derived indicators – Corridor/ route
evaluation type.
Codes Indicator Components used in the formulas
A Total Number of Crossings
Safe/Traffic calmed crossing no., number of unsignalized/unsafe crossing ,number of major crossing, additional grade separated cycle crossings in the segment- foot over bridges and subways, % of Cycle crossing to be considered at grade separated- indicators contributing to the estimated total number of crossings
B Total Frequency of Crossing length of segment, total number of crossings- indicators contributing to the estimated Total Frequency of Crossing
C Number of Unsignalized /Unsafe Crossing
% length divided, length of segment, Major Junction width, Number of major crossings, safe/Traffic calmed crossing no., Minor Crossing width- indicators contributing to the estimated Number of Unsignalized/Unsafe Crossing
D Total number of Safe Crossings
Number of major safe crossings, safe/Traffic calmed crossing no- indicators contributing to the estimated Total number of Safe Crossings
E Total Frequency of Safe Crossings
length of segment, total number of safe crossings- indicators contributing to the estimated Total Frequency of Safe Crossings
F Total Frequency of unsignalized Crossings
length of segment, number of unsignalised/unsafe crossings- indicators contributing to the estimated Total Frequency of unsignalized Crossings
G Crossing Intensity PHPDT Crossing Attraction, Weighted Average of Land use
I Effective Width Min.width, total shy away width, number of lanes, lane width of carriage way- indicators contributing to the estimated Effective Width
J Safety Index of Crossing
crossing exposure index, crossing intensity, total number of safe crossing, total number of crossing, total traffic calming index-intersections and crossings- indicators contributing to the estimated Safety Index of Crossing
K Number of Major Crossings no provision for crossing/ physically prevented from crossing, number of major junctions- indicators contributing to the estimated number of major crossings
L1 Shy away Width Left Side
peak hour traffic data in PHPD- bicycle, passenger rickshaw, goods rickshaw, primary adjacent vertical heights(left), shy away width- wall, vertical structures- indicators contributing to the estimated Shy away Width Left Side
L2 Shy away Width Right Side
peak hour traffic data in PHPD- bicycle, passenger rickshaw, goods rickshaw, primary adjacent vertical heights(right), shy away width- wall, vertical structures- indicators contributing to the estimated Shy away Width Right Side

CyLOS- Final Report
SGArchitects Page 91
L3 Total Shy away Width shy away width left side, shy away width right side- indicators contributing to the estimated Total Shy away Width
M Number of Major Safe Crossings
number of major junctions, traffic calming used at intersection, unsignalized junction, % of Cycle crossing to be considered at grade separated, primary cyclist crossing type across the road(overpass or underpass)- indicators contributing to the estimated Number of Major Safe Crossings
N Crossing Exposure Index vehicular speed safety index, exposure to MV lanes index, Weighted avg. exposure to MV lane- indicators contributing to the estimated Crossing Exposure Index
O Shaded Length Shading length Index, % length shaded- indicators contributing to the estimated Shaded Length
P Vehicular Speed posted speed limits, observed peak speeds- indicators contributing to the estimated Vehicular Speed
Q Total PBU
peak hour traffic data- bicycle, passenger rickshaw, goods rickshaw, Passenger Bicycle unit- bicycle, bicycle with goods, passenger rickshaw, goods rickshaw, breakup of captive bicycle user share(as % of total captive users)- indicators contributing to the estimated Total PBU
R Frequency of Puncture Index
Frequency of Punctures, length of midblock, number of cycle lane puncture- indicators contributing to the estimated Frequency of Puncture Index
S Number of Cycle Lane Puncture
service lane %, number of minor junctions, number of property entrances, length of midblock, Frequency of punctures on service lane- indicators contributing to the estimated Number of Cycle Lane Puncture
T Friction from Pedestrian Index
infrastructure design at mid block- segregated track, painted lanes, unsegregated, common with footpath- indicators contributing to the estimated Friction from Pedestrian Index
U Pedestrian Density Index
Space allocation per pedestrian, availability as percentage of total segment length- footpath %, length of segment, Footpath width, pedestrian speed- indicators contributing to the estimated Pedestrian Density Index
V Parking Friction Index
infrastructure design at mid block- segregated track, painted lanes, unsegregated, common with footpath, infrastructure location-cycle track or segregated, Between street parking and carriage way and angled parking, primary location of track/lane on cross section- between on street parking and carriage way, private vehicles on street parking numbers along the segment, parallel parking, Parking length- indicators contributing to the estimated Parking Friction Index
X Relivence Index
XA, XB, XC, XD, Cycle track height index, Intersection relevence, Intersection boundry, Primary cyclist crossing type across free left turns or segregated left turn lanes, Cycle track height index, Cyclist approach / access to intersection- - indicators contributing to the estimated relivence index

CyLOS- Final Report
SGArchitects Page 92
XA
Primary segregation type from carriageway-raised median, green belt, open drain, location of bus stop- no bus station on curbside, bus stop in between cycle track and carriageway, street category and speeds- highway, arterial, sub-arterial, primary location of track/lane on cross section-along carriageway, segregated tracks, segregation width- indicators contributing to the estimated XA
XB
street category and speeds- collector/distributory, location of bus stop- no bus station on curbside, bus stop in between cycle track and carriageway, carriageway traffic(along segment)-LHS and R.H.S, one way, primary segregation type from carriageway- not segregated, paint marking, raised median, green belt, open drain, segregation width, primary location of lane/track on cross section-along carriageway, segregated tracks, parallel parking, independent parking, no parking, carriageway traffic- one way- indicators contributing to the estimated XB
XC street category and speeds- access, painted lanes, primary location of track/lane on cross section- along carriageway, unsegregated- indicators contributing to the estimated XC
XD
street category and speeds- independent track/facility, primary segregation type from carriageway- not along carriageway, primary location of track/lane on cross section-independent or standalone, common with footpath- indicators contributing to the estimated XD
Z Riding Comfort Index riding comfort index, primary surface type- asphalt, concrete, smooth tiled, rough finish paver blocks, conc. Slabs- indicators contributing to the estimated Riding Comfort Index
A1 Service Lane % street category and speeds- highway, arterial, sub arterial, service lane, service quality index- indicators contributing to the estimated Service Lane %
B1 Footpath % Index % of footpath- indicators contributing to the estimated Footpath % Index
C1 Parking Length
angled parking, parallel parking, independent path, private vehicle on street parking numbers along segment(PCU), parallel parking length- indicators contributing to the estimated Parking Length
C2 Parking Length(IPT parking) IPT parking bays provided, IPT parking bays number, IPT standard width- indicators contributing to the estimated Parking Length(IPT parking)
C3 Percentage of parking over the segment
parking length(private vehicles), parking length(IPT), length of midblock- indicators contributing to the estimated Percentage of parking over the segment
D1 Hawking Friction Index Hawking Friction Index, frequency of hawkers- indicators contributing to the estimated Hawking Friction Index
E1 Frequency of Hawkers length of midblock, hawking zones provided, number of hawkers, Friction caused by hawkers- hawking zones provided,

CyLOS- Final Report
SGArchitects Page 93
hawking zones not provided- indicators contributing to the estimated Frequency of Hawkers
F1 Vehicular Speed Safety Index
Vehicular speed safety Index- indicators contributing to the estimated Vehicular Speed Safety Index
G1 Exposure to MV Lanes Index
Exposure to MV lane Index, primary cyclist crossing type across intersecting roads- crossing with or without marking, raised crossing, signalized with or without raised crossing, grade separated(overpass or underpass), no provision for crossing/physically prevented from crossing, carriageway traffic along segment- number of lanes per direction- indicators contributing to the estimated Exposure to MV Lanes Index
H1 PHPDT Crossing Attraction Index
total number of cyclist, total number of cyclist PHPD- indicators contributing to the estimated PHPDT Crossing Attraction Index
J1 Turning Radius Index (MIDBLOCK)
Turning Radius, minimum turning radius for cyclist- indicators contributing to the estimated Turning Radius Index (MIDBLOCK)
K1 Obstruction Index (MIDBLOCK)
Infrastructure type- Painted lanes, unsegregated, right angled parking, parallel parking, street parking, Frequency of Obstruction, Parallel parking over cycle lane/ unsegregated/bus stop on the cycle track, Angled parking over cycle lane/ unsegregated indicators contributing to the estimated Obstruction Index (MIDBLOCK)
LL1 Cross Slope Gradient Index (MIDBLOCK)
cross slope gradient index(Intersections / midblocks), slopes and gradients- minimum cross slope gradient- indicators contributing to the estimated Cross Slope Gradient Index (MIDBLOCK)
M1 Longitudinal Slope Index(MIDBLOCK)
Long. slope gradient index(Intersections / midblock), slopes and gradients- max. gradient or longitudinal slopes(>3m length)- indicators contributing to the estimated Longitudinal Slope Index(MIDBLOCK)
N1 Ramp Slope Gradient(MIDBLOCK)
average ramp slopes used for level changes, Ramp. slope gradient index(Intersections / midblock)- indicators contributing to the estimated Ramp Slope Gradient(MIDBLOCK)
O1 Lighting Levels
lighting levels measured on cyclist path-designed/observed average lighting levels, street category and speeds- independent track/facility, highway, arterial, sub arterial collector/distribuitory, access, Light levels at intersections and midblock- indicators contributing to the estimated Lighting Levels
P1 Lighting Uniformity
lighting levels measured on cyclist path-designed/observed average lighting uniformity, street category and speeds- independent track/facility, highway, arterial, sub arterial collector/distribuitory, access, Light Uniformity at Intersections and midblock- indicators contributing to the estimated Lighting Uniformity
Q1 Cycle Specific Marking- Major junctions
presence of cycle specific signage and markings- indicators contributing to the estimated Cycle Specific Marking- Major junctions

CyLOS- Final Report
SGArchitects Page 94
R1 Cycle Specific Signage- Major Junctions
presence of cycle specific signage and markings- indicators contributing to the estimated Cycle Specific Signage- Major Junctions
S1 Cyclist Delay At Intersection
Intersection delay, average cyclist delay, Cyclist delay at intersections, Infrastructure relevance and continuity index, Cycle infrastructure continuity, Cyclist approach / access to intersection - indicators contributing to the estimated Cyclist Delay At Intersection
T1 Traffic Calming at Intersection Index
traffic calming used at intersection- indicators contributing to the estimated Traffic Calming at Intersection Index
U1 Cycle Box at Intersection Index
demarcated cycle stacking spaces such as bike boxes provided- indicators contributing to the estimated Cycle Box at Intersection Index
V1 Traffic Calming other than intersection
primary cyclist crossing type across intersecting roads- traffic calmed- indicators contributing to the estimated Traffic Calming other than intersection
X1 Lighting Levels at Intersection
average lighting levels, street category and speeds- independent track/facility, highway, arterial, sub arterial, collector/distributory, access, Light levels at intersections and midblock- indicators contributing to the estimated Lighting Levels at Intersection
Y1 Lighting Uniformity at Intersection
average lighting uniformity, street category and speeds- independent track/facility, highway, arterial, sub arterial, collector/distributory, access, lighting levels measured on cyclist path-designed/observed average lighting uniformity, Light Uniformity at Intersections and midblock- indicators contributing to the estimated Lighting Uniformity at Intersection
A4 Lighting Quality Index Midblock
lighting levels(midblock) + lighting uniformity(midblock)- indicators contributing to the estimated Lighting Quality Index Midblock
B4 Lighting Quality Index Intersection
lighting levels(intersection) + lighting uniformity(intersection)- indicators contributing to the estimated Lighting Quality Index Intersection
C4 Overall Lighting Quality Index
lighting quality index(midblock), length of midblock, length of segment, lighting quality index(intersection)- indicators contributing to the estimated Overall Lighting Quality Index
Z1 Total No. of Cyclists peak hour traffic data in PHPD- bicycle, passenger rickshaw, goods rickshaw- indicators contributing to the estimated Total No. of Cyclists
A2 Weigted Average of Landuse
Land use(both sides)- Com. Ret Facing Com.Ret, Com.Ret Facing Resi/ Office, Com.Ret facing others, Resi/ off facing Resi /off, Resi/ off facing Others, Others facing others- indicators contributing to the estimated Weighted Average of Landuse
G2 Trasit Station NMV PARKING
% of transit stations covered with parking(within 100 m), Parking at transit stations - indicators contributing to the estimated Trasit Station NMV PARKING

CyLOS- Final Report
SGArchitects Page 95
J2 Cycle Parking % of commercial/inst. Landuse served by parking(within 100m), % of Cycle parking- indicators contributing to the estimated Cycle Parking
I2 Over all parking availability index
transit station NMV parking, % of transit stations covered with parking(within 100 m), % of commercial/inst. Land use served by parking(within 100m), parking land use, usability of cycle parking- indicators contributing to the estimated Over all parking availability index
M2 Maintenance
Maintenance- entirely clean, well maintained and free from debris, partly clean but mostly free from debris and/or with minor maintenance requirement, mostly covered with debris and/or in need of urgent repairs along majority length- indicators contributing to Maintenance
N2 Landscaping
landscaping- periphery/edges include designed green cover, street furniture and varied façade, periphery/edges partly or fully include green cover but lacks interesting façade and/or street furniture along majority length, lack of designed green cover and other landscaping elements and/or has long monotonous facades along majority length- indicators contributing to the estimated Landscaping
O2 Enforcement
Enforcement, well enforced-no encroachment by motorists and parking along the entire segment length, partly enforced-light motor vehicles encroach designated cycle infrastructure near intersections but no parking and no encroachment at mid block, lack enforcement- motor vehicles routinely encroach and park on designated infrastructure- indicators contributing to enforcement
P2 Usability of cycle track facility
evaluation type- evaluation of existing infrastructure or facility, additional information for existing segment/route- in case designated cycle track or lane indicate average % of cyclists using facility along segment- indicators contributing to the estimated Usability of cycle track facility
R2 Usability of cycle parking
evaluation type- evaluation of existing infrastructure or facility, in case of designated cycle or rickshaw parking indicate average % of cyclists using facility along segment- indicators contributing to the estimated Usability of cycle parking
S2 Cycle marking - midblock marking and signage- presence of cycle specific marking (excluding lanes)- indicators contributing to the estimated Cycle marking - midblock
T2 Cycle signage - midblock marking and signage- presence of cycle specific sign boards- indicators contributing to the estimated Cycle signage - midblock
U2 Overall cycle marking cycle specific marking(major junctions), cycle marking(midblock)- indicators contributing to the estimated Overall cycle marking
V2 Overall cycle signage cycle signage(midblock), cycle specific signage(major junctions)- indicators contributing to the estimated Overall cycle signage

CyLOS- Final Report
SGArchitects Page 96
W2 PBU per effective lane cycle signage(midblock), cycle specific signage(major junctions)- indicators contributing to the estimated Overall cycle signage
X2 Width sufficiency Index
infrastructure type-segregated tracks, painted lanes, unsegregated, NMV width requirement, NMV width requirement(segregated tracks), NMV volume requirement per lane, NMV width requirement(painted lanes), NMV width requirement index(common), width requirement index for common cycle track and footpath(based on volume)- indicators contributing to the estimated Width sufficiency Index
E4 NMV width requirement (segregated tracks)
infrastructure design at midblock-minimum width, NMV track width segregated- indicators contributing to the estimated NMV width requirement (segregated tracks)
H4 NMV volume requirement PBU per effective lane, NMV Volume/lane- indicators contributing to the estimated NMV volume requirement
I4 NMV width requirement (painted lane )
infrastructure design at mid block-minimum width, NMV lane width (painted)- indicators contributing to the estimated NMV width requirement (painted lane )
J4
Width requirement index for common cycle track footpath(based on measurement)
infrastructure design at mid block-minimum width, NMV track width requirement index(common)(based on measurement)- indicators contributing to the estimated Width requirement index for common cycle track footpath(based on measurement)
K4 Frequency of obstructions midblock
length of midblock, number of obstruction on bicycle path- indicators contributing to the estimated Frequency of obstructions midblock
L4 Length of Midblock Infrastructure Type, length of segment, number of major intersections, Major Junction width- indicators contributing to the estimated Length of Midblock
M4 Midblock Accident safety Index
evaluation type- evaluation of existing infrastructure, midblock risk index, estimated midblock risk, Midblock accident safety index, Side edge drop index- indicators contributing to the estimated Midblock Accident safety Index
N4 Eyes on street (% of Segment which has activity(Hawkers))
frequency of hawkers, % of Segment which has activity(Hawkers)- indicators contributing to the estimated Eyes on street (% of Segment which has activity(Hawkers))
O4 Current Fatalities indicate the average annual number of cyclist fatalities along the segment, Fatalities- indicators contributing to the estimated Current Fatalities
P4 Frequency of crossing index
street category and speeds-independent track/facility, highway, arterial, sub-arterial, collector/distributory, access, Crossing frequency- indicators contributing to the estimated Frequency of crossing index
Q4 Total traffic calming index - Intersections & Crossings
primary intersection type- unsignalized junction, signalized junction, one lane roundabout, two lane roundabout, rotary, grade separated(for vehicles), traffic calming at intersection index, traffic calming at midblock index, % of Cycle crossing to be considered at grade separated- indicators contributing to the estimated Total traffic calming index - Intersections &

CyLOS- Final Report
SGArchitects Page 97
Crossings
S4 Midblock risk index fatalities/segment length, Midblock Risk Index- indicators contributing to the estimated Midblock risk index
T4 Estimated midblock risk
vehicular speed, primary segregation type from carriageway- paint marking, reflector studs, Estimated Midblock Risk, Cycle infrastructure continuity- indicators contributing to the estimated midblock risk
U4 Fatalities/ segment length current fatalities, length of segment- indicators contributing to the estimated Fatalities/ segment length
W4 Width requirement index for common cycle track and footpath(based on volume)
infrastructure type- minimum width, width requirement for common cycle track footpath- indicators contributing to the estimated Width requirement index for common cycle track and footpath(based on volume)
PLI Parking Length Index percentage of parking over the segment, parking length- indicators contributing to the estimated Parking Length Index
W4-1 Width requirement for common cycle track footpath
peak hour traffic data in PHPD- pedestrians, number of bicycle, pedestrian speed, Effective Lane width- indicators contributing to the estimated Width requirement for common cycle track footpath
W4-2 Width requirement for common cycle track footpath
peak hour traffic data in PHPD- pedestrians, number of bicycle, pedestrian speed, Effective Lane width- indicators contributing to the estimated Width requirement for common cycle track footpath
W4-3 Width requirement for common cycle track footpath
peak hour traffic data in PHPD- pedestrians, number of bicycle, pedestrian speed, Effective Lane width- indicators contributing to the estimated Width requirement for common cycle track footpath
W4-4 Width requirement for common cycle track footpath
peak hour traffic data in PHPD- pedestrians, number of bicycle, pedestrian speed, Effective Lane width- indicators contributing to the estimated Width requirement for common cycle track footpath
W4-5 Width requirement for common cycle track footpath
peak hour traffic data in PHPD- pedestrians, number of bicycle, pedestrian speed, Effective Lane width- indicators contributing to the estimated Width requirement for common cycle track footpath
SQI service lane quality index
availability as percentage of total segment length- service lane %, quality in terms of percentage of service lane and footpath meeting different grades-Service lane- % of A, % of B- indicators contributing to the estimated service lane quality index
FQI footpath quality index
availability as percentage of total segment length- footpath %, quality in terms of percentage of service lane and footpath meeting different grades-Service lane-footpath- % of A, % of B- indicators contributing to the estimated footpath quality index

CyLOS- Final Report
SGArchitects Page 98
CIC Cycle infrastructure continuity index
Cycle infrastructure continuity at minor junctions, Cycle infrastructure continuity at property entrances
B5 Blinkers and signages at Minor junction Provision of warning such as blinkers and signboards
SS1 Cycle path width reduction at intersection approach(more than 0.3 m)
Width of cycle track / lane reduction (by more than 0.3m) on approaching to the junction
SS2 Cyclist approach / access to intersection
Cyclist Approach/access at the Intersection- segregated, cycle lane, unsegregated, common, stand alone, Street Category and Speeds- collector road, access road, Infrastructure Type- segregated tracks, painted lanes, unsegregated ,common with footpath
XI Intersection relevance
Street Category and Speeds- independent track, highway, arterial, sub arterial, collector, access, Primary intersection type- signalized junction, unsignalized junction, one lane round about, two lane round about, rotary, grade separated(for vehicles)
IBI Intersection boundary
Street category and speeds- highway, arterial, sub-arterial, collector, primary cycle infrastructure along intersection boundary- painted marking on the periphery along circular road, no segregation/demarcation- common with carriageway
PCCT Primary cyclist crossing type across free left turns or segregated left turn lanes
street categories and speeds- independent track, arterial, collector, distributory, Primary cyclist crossing type across free left turns or segregated left turn lanes- crossing marked across carriageway, raised crossing, grade separated(underpass or overpass), signalized crossing
PCI Parking cost index Parking cost rupees per day
CHI Cycle track height index street category and speeds- independent track, Average height above/below road surface (main carriageway)
SED Side edge drop Primary adjacent vertical edge heights
SEDI Side edge drop index Side edge drop
CICM Cycle infrastructure continuity at minor junctions
Infrastructure Type-segregated tracks, painted lanes,unsegregated, common with footpath, Primary type of crossing for cyclists across vehicular path- at carriageway level,

CyLOS- Final Report
SGArchitects Page 99
level of cycle track remains same(above carriageway), at footpath level
CICP Cycle infrastructure continuity at property entrances
Infrastructure design at mid block- Segregated tracks, painted lanes, unsegregated, common with footpath, Primary type of crossing for cyclists across vehicular path- at carriageway level, level of cycle track remains same(above carriageway), at footpath level
10.2 Annexure 2 – Components used in derived indicators -Transit access area
evaluation type.
Codes Indicator Components used in formula
P4 Accessibility index
Street category and speeds-independent track/facility, highway, arterial, sub-arterial, collector/distributory, access, Crossing frequency- indicators contributing to the estimated Frequency of crossing index
Y4 Link density Number of links, Accessibility influence zone radius
Y3 Link density index
Link density
10.3 Annexure 3 – List of the participants (NMT workshop)
Participants Name From
Dr. Geetam Tiwari IIT - DELHI Miss Aloke Parna IIT - DELHI
Miss Leeza Malik IIT - DELHI
Mr.Ravi Gadepalli Shakti Foundation Mr.Ranjit Gadgil Parisar
Dr. Joseph Fazio Fazio Engineerware Prof.Girish aggarwal IIT - DELHI
Miss Ruchi Varma SGArchitects Mr. Nilesh Bansal SGArchitects
Mr. Parvesh sherawat I-Trans
Mr.Sandeep Gandhi SGArchitects

CyLOS- Final Report
SGArchitects Page 100
10.4 Annexure 4 – Feed Back forms (NMT workshop) AHP forms for road infrastructure type are as follows:
S. No. 1 Surveyor: Sandeep Respondent: Leeza Malik Date: 17/12/13
S. No. Which one of the two is preferred? By how much? Score
1
Coherence, or the degree to which the cycling infrastructure is legible to cyclist, is continuous, integrated and networked
Directness, or the measure impacting the the travel time and speed of cyclist
2
Coherence, or the degree to which the cycling infrastructure is legible to cyclist, is continuous, integrated and networked
Safety, or the measure of infrastructures ability to protect the cyclist from crashes/accidents and crime
3
Coherence, or the degree to which the cycling infrastructure is legible to cyclist, is continuous, integrated and networked
Comfort, or the ability of the infrastructure to ensure a comfortable ride for cyclists in terms of surface quality and protection from environment
4
Coherence, or the degree to which the cycling infrastructure is legible to cyclist, is continuous, integrated and networked
Attractiveness, or the the property of the infrastructure to provide a visually and physically pleasing environment for cycling
5
Directness, or the measure impacting the the travel time and speed of cyclist Safety, or the measure of infrastructures ability to protect the cyclist from
crashes/accidents and crime
6
Directness, or the measure impacting the the travel time and speed of cyclist
Comfort, or the ability of the infrastructure to ensure a comfortable ride for cyclists in terms of surface quality and protection from environment
7
Directness, or the measure impacting the the travel time and speed of cyclist Attractiveness, or the the property of the infrastructure to provide a visually and
physically pleasing environment for cycling
8
Safety, or the measure of infrastructures ability to protect the cyclist from crashes/accidents and crime
Comfort, or the ability of the infrastructure to ensure a comfortable ride for cyclists in terms of surface quality and protection from environment
9
Safety, or the measure of infrastructures ability to protect the cyclist from crashes/accidents and crime
Attractiveness, or the the property of the infrastructure to provide a visually and physically pleasing environment for cycling
10
Comfort, or the ability of the infrastructure to ensure a comfortable ride for cyclists in terms of surface quality and protection from environment
Attractiveness, or the the property of the infrastructure to provide a visually and physically pleasing environment for cycling

CyLOS- Final Report
SGArchitects Page 101
10.5 Annexure 5 – Survey Form for School Children – English Version

CyLOS- Final Report
SGArchitects Page 102

CyLOS- Final Report
SGArchitects Page 103

CyLOS- Final Report
SGArchitects Page 104

CyLOS- Final Report
SGArchitects Page 105

CyLOS- Final Report
SGArchitects Page 106
10.6 Annexure 6 – Survey Form For School Children – Hindi Version
The same form was being translated in Hindi version for better understanding. The sample of
Hindi version survey form is as follows:

CyLOS- Final Report
SGArchitects Page 107
10.7 Annexure 7 – Survey Audit Form.
The form below should be used by the surveyor to collect data from site and fill the forms. The
data collection form for Corridor/Route and Transit access influence area is same.
DATA COLLECTION FORM
Name of road: ___________________________ Date: _____________
Name of surveyor: ________________________ Time: ____________
Total number of segments: _________________
Segment Number: _________________________
Instructions to fill the forms:
1. There are six sections in the entire form which includes:
a) Common form for the entire segment
b) Observation sheet (Day time) – LHS
c) Observation sheet (Day time) – RHS
d) Observation sheet (Night time) – LHS & RHS
e) Description sheet (Day and Night time)
2. * - This symbol indicates to refer description sheet. The category to be filled is explained
in the description sheet for the respective item.
3. For proper information data should be collected in peak hour time. Also complete form
should be filled in one time slot.
4. Each segment should be divided in a range of 200 m up to 800 m. If the segment is
more than 800m long a separate form can be used.
a. Common Survey for Entire Segment
S.No.
1 Type of Road (Tick any one)
Highway
Arterial/ Sub Arterial (30 - 80 m)
Collector/Distributor (12-30 m)

CyLOS- Final Report
SGArchitects Page 108
Local - (6 -15 m)
Independent track/facility -(upto 6m)
2 Carriageway traffic along segment (Tick any one)
LHS & RHS (2 way)
One Way (LHS)
One Way (RHS)
Independent path
3 Right of way (ROW)
4 No. of lane
5 Segment Length (km)
6 Posted speed limit
7 Peak hour Traffic data
No. of motor vehicles (PCU)
No. of Bicycle
No. of auto rickshaw
No. of goods rickshaw
No. of Pedestrians
8 Bicycle user share
Passenger only (no.)
Passenger with goods (no.)
9 Type of Cycle track/lane (Tick any one)
Segregated track
Painted track
Unsegregated (common with carriageway)
Common with footpath
10 Location of cycle track/lane (Tick any one)
Along carriage way
Along footpath
Along property edge
On the median
Between on street parking & carriageway
Between service lane & property edge
Independent Standalone
11 Surface Type (Tick any one)
Asphalt
Concrete
Smooth tiled
Paver blocks
Concrete slabs
Others
12 Cycle parking cost (rupees per day)

CyLOS- Final Report
SGArchitects Page 109
13 Primary Intersection type (Tick any one)
Signalized junction
Unsignalized junction
One lane roundabout
Two lane roundabout
Rotary
Grade separated
Not applicable
If Intersection type is not applicable then 11 - 23 are not to be filled.
14 No. of major junctions
15 Observed wait time at the junction
16 Traffic calming at intersections (Yes/No)
17 Demarcated cycle stacking spaces at intersection (Yes/No)
18 Primary cyclist crossing type across intersecting roads (Tick any one)
Crossing with or without marking
Raised crossing
Grade separated (underpass or overpass)
Signalized with or without raised crossing
No provision for crossing/ physically prevented from crossing
19 Primary cyclist crossing type across free left turns or segregated left turn lanes (Tick any one)
Crossing marked across carriageway
Raised crossing
Grade separated (underpass or overpass)
Segregated left turning lanes exists
20 Primary cycle infrastructure along intersection boundary (Tick any one)
Segregated from carriageway and footpath
Common with footpath but segregated from carriage way
Painted marking on the periphery along circular roadway
No Segregation/demarcation - common with carriage way
21 Width of cycle track/lane at the junction (m)
22 Cyclist approach to the Intersection (Tick any one)
Segregated track
Cycle lane (painted)
Unsegregated
Common cycle track and footpath
As part of or along service lane
Stand alone
23 Additional grade separated cycle crossings in the segment
Foot over bridges (no.)
Subways (no.)
24 Primary speed/conflict control measure used at mid block cyclist or pedestrian crossing (Tick one)

CyLOS- Final Report
SGArchitects Page 110
b. Observation Sheet (Day) - LHS
S.No. Chainage 0-200
m 201-400
m 401-600
m 601-800
m Average/Min.
1 Shaded length % on Cycle track/lane Average
2 % length of divided carriageway in the segment
Average
3 Observed peak speed Average
4 Land use* Average
5 Length with service lane Total
6 Quality of service lane(Good, Bad, poor)* Average
7 Length of Footpath Total
8 Quality of footpath (Good, Bad, Poor)* Average
9 No. of hawkers present Total
10 No. of parked IPT Total
11 No. of parked private vehicles on carriageway Total
12 Height of cycle track/lane w.r.t. to carriageway Average
13 Minimum width of cycle track/lane Min.
14 Segregation width between cycle track/lane/path & carriageway
Average
15 Edge height Left Side Average
Right Side Average
16 Minimum Turning Radius Min.
17 No. of obstructions Total
18 Slope of Ramp* Average
19 Presence of cycle specific signage & marking Total
20 Location of bus stop*
21 No. of property entrances Total
22 No. of secondary lane entrances / minor junctions
Total
23 No. of signalised or traffic calm pedestrian/cycling crossings at carriageway
Total
24 Level of cycle track/lane crossing at minor junction/collector road entrance*
Average
25 Level of cycle track/lane crossing at property entrance*
Average
26 No. of cycle/NMV parking Total
27 Quality & maintenance of Cycle track/ lane Average
Traffic calmed
Pedestrian signal with or without traffic signal

CyLOS- Final Report
SGArchitects Page 111
28 Quality of landscaping & environment Average
29 Encroachment on cycle track/lane by private vehicles*(refer description sheet)
Average
30 Approx. % of total cyclist using bicycle infrastructure
Average
31 Approx. % of total NMV parking using designated parking NMV bays
Average
c. Observation Sheet (Day) - RHS
S.No. Chainage 0-200
m 201-400
m 401-600
m 601-800
m Average/Min.
1 Shaded length % on Cycle track/lane Average
2 % length of divided carriageway in the segment
Average
3 Observed peak speed Average
4 Land use* Average
5 Length with service lane Total
6 Quality of service lane(Good, Bad, poor)* Average
7 Length of Footpath Total
8 Quality of footpath (Good, Bad, Poor)* Average
9 No. of hawkers present Total
10 No. of parked IPT Total
11 No. of parked private vehicles on carriageway Total
12 Height of cycle track/lane w.r.t to carriageway Average
13 Minimum width of cycle track/lane Min.
14 Segregation width between cycle track/lane/path & carriageway
Average
15 Edge height Left Side Average
Right Side Average
16 Minimum Turning Radius Min.
17 No. of obstructions Total
18 Slope of Ramp* Average
19 Presence of cycle specific signage & marking Total
20 Location of bus stop*
21 No. of property entrances Total
22 No. of secondary lane entrances / minor junctions
Total
23 No. of signalised or traffic calm pedestrian/cycling crossings at carriageway
Total
24 Level of cycle track/lane crossing at minor junction/collector road entrance*
Average

CyLOS- Final Report
SGArchitects Page 112
25 Level of cycle track/lane crossing at property entrance*
Average
26 No. of cycle/NMV parking Total
27 Quality & maintenance of Cycle track/ lane Average
28 Quality of landscaping & environment Average
29 Encroachment on cycle track/lane by private vehicles*(refer description sheet)
Average
30 Approx. % of total cyclist using bicycle infrastructure
Average
31 Approx. % of total NMV parking using designated parking NMV bays
Average
d. Observation Sheet (Night) - LHS and RHS
OBSERVATION SHEET (NIGHT) -LHS
S.No. Chainage 0-200 m
201-400 m
401-600 m
601-800 m
Average/Min.
1 Lighting on cycle track - lux level (40 lux, 20 lux, >10 lux)*
2 Lighting uniformity on cycle track/lane/path (Good, Bad, Poor)*
3 No of hawkers
OBSERVATION SHEET (NIGHT) -RHS
S.No. Chainage 0-200 m
201-400 m
401-600 m
601-800 m
Average/Min.
1 Lighting on cycle track - lux level (40 lux, 20 lux, >10 lux)*
2 Lighting uniformity on cycle track/lane/path (Good, Bad, Poor)*
3 No of hawkers

CyLOS- Final Report
SGArchitects Page 113
e. Description Sheet (Day and Night) – LHS & RHS
DESCRIPTION SHEET (DAY)
S.NO. SURVEY FORM - LHS & RHS
4 Land Use
A Commercial /Retail
B Residential
C Others - Institutional, Recreational, Green, etc.
D Commercial + Residential
E Residential + Others
F Commercial + Others
6
Quality of service lane
Good (Grade A)
Width >= 6m, Lighting level=18 lux, Uniformity =40 %, No Obstructions, Footpath - 1.8m, segregated
Bad (Grade B)
Width 4.5m to 6m, Lighting level=15 lux, Uniformity =33 %, No Obstructions, Footpath - 1.2 to 1.8m, segregated
Poor (Grade C)
Width >=4.5m, Lighting level>15 lux, Uniformity =33 %, Obstructions present, Footpath - 1.2, unsegregated
8 Quality of footpath
Good (Grade A) Width 1.8m, Height-18 cm, No Obstruction, Excellent surface quality, Proper cross slope, barrier free
Bad (Grade B) Width 1.8 to 1.5m , Height-20 cm, Obstructions present but clear width 1.2m achieved, Excellent surface quality, Proper cross slope, barrier free, Pavement may not include tactile
Poor (Grade C)
Width = 1.5m , Height-20 cm, Obstructions present but clear width 1.2m achieved, Poor surface quality, Improper cross slope, Not disabled friendly, Poor surface quality of pavement.
16
Calculate turning radius R = Y/2 + X
2/8 x Y

CyLOS- Final Report
SGArchitects Page 114
18
Calculate slope S
2 = H
2 + L
2
19 Location of Bus stop
A No bus shelter on kerbside
B Cycle track between bus shelter & carriageway
C Bus stop between cycle track and carriageway
D Bus stop on cycle track
24 Level of cycle track/lane crossing at minor junction/collector road entrance
A At carriageway level
B Level of cycle track remains same (above carriageway)
C At footpath level
25 Level of cycle track/lane crossing at property entrance
A At carriageway level
B Level of cycle track remains same (above carriageway)
C At footpath level
29 Encroachment on cycle track/lane by private vehicles*(refer description sheet)
Well enforced No encroachment by motorist & no parking
Partly enforced Encroachment by motorist near intersections & no parking
Lack enforcement Motor vehicles routinely encroach & park on cycle track
DESCRIPTION SHEET (NIGHT)
S.NO. SURVEY FORM - AT NIGHT
1
Lighting on cycle track - lux level
40 lux Distinguishable till 200 m
20 lux Distinguishable till 100 m
> 10 lux Distinguishable till 50 m
2
Lighting uniformity level
Good No dark patches throughout the track/lane
Bad Clearly visible dark areas between light poles
Poor No lighting at all in the entire track/lane

CyLOS- Final Report
SGArchitects Page 115
References
2009, Work zone Safety Manual, Transportation Reserch and Injury Prevention Programme.
2013a, Non Motorized Transport Planning and Guideline, Transportation Reserch and Injury Prevention Programme.
2013b, Public Transport Accessibility Toolkit, Transportation Reserch and Injury Prevention Programme (TRIPP).
2013c, Urban Road Safety Audit Toolkit, Transportation Reserch and Injury Prvention Programme.
Jain, H. 2012. Devalopment of a bicycle demand estimation model incorporating land use sensitive parameters:Case study of Pune city, India.
Ploeger, J., Kroeze, P.A., Ditewig, R., Dijkstra, A., Godefrooij, T.P.F., Immerzeel, J.W., Salomons, W., Vink, E.D., & Zeegers, Th. 2007. Design manual for bicycle traffic, Edition ed. CROW.
(Anon 2009;Anon 2013a;Anon 2013b;Anon 2013c;Jain 2012;Ploeger et al. 2007)