cycling demonstration towns report
DESCRIPTION
From Cycling England, November 2009TRANSCRIPT

Analysis and synthesis of evidence on the effects of investment in six Cycling Demonstration Towns November 2009

2Sloman L, Cavill N, Cope A, Muller L and Kennedy A (2009) Analysis and synthesis of evidence on the effects of investment in six Cycling Demonstration Towns
The preferred citation for this paper is:
Sloman L, Cavill N, Cope A, Muller L and Kennedy A (2009) Analysis and synthesis of evidence on the effects of investment in six Cycling Demonstration Towns Report for Department for Transport and Cycling England
Disclaimer: Although this report is published by the Department for Transport (DfT), on behalf of DfT and Cycling England, the findings and recommendations are those of the authors and do not necessarily represent the views of the DfT. While these parties have made every effort to ensure the information in this document is accurate, DfT do not guarantee the accuracy, completeness or usefulness of that information; and cannot accept liability for any loss or damages of any kind resulting from reliance on the information or guidance this document contains

3Sloman L, Cavill N, Cope A, Muller L and Kennedy A (2009) Analysis and synthesis of evidence on the effects of investment in six Cycling Demonstration Towns
1. IntroductionThis paper provides a summary of evidence on changes in cycling and physical activity in six towns following the first phase of the Cycling England / Department for Transport Cycling Demonstration Town investment programme between October 2005 and March 2009. It draws on two separately published volumes of evidence: Cycling Demonstration Towns: Monitoring project report 2006 to 20091 and Cycling Demonstration Towns: Surveys of cycling and physical activity 2006 to 20092.
The towns involved in the first phase of the Cycling Demonstration Towns programme were Aylesbury, Brighton & Hove, Darlington, Derby, Exeter and Lancaster with Morecambe. One of the towns, Darlington, was also part of the Government’s Sustainable Travel Town programme between 2004 and 2009, and received additional funding for implementation of a large scale Smarter Choices Programme.
More generally, all of the towns implemented a range of wider initiatives with the potential to increase cycling levels, beyond those that were directly funded by the Cycling Demonstration Towns programme – for example, through school travel planning supported by the Travelling to School Initiative; through investment in cycle facilities at new schools built as a result of the reorganisation of delivery of secondary education in Exeter; and through capital investment from the Community Infrastructure Fund for a cycle / pedestrian bridge in Aylesbury (although this was not open to the public until after the period examined in this report).
1 Cope A, Muller L, Kennedy A, Parkin J and Page M (forthcoming) Cycling Demonstration Towns: Monitoring project report 2006 to 2009 Report for Cycling England.2 Cavill N, Muller L, Mulhall C, Bauman A and Hillsdon M (forthcoming) Cycling Demonstration Towns: Surveys of cycling and physical activity 2006 to 2009 Report for Cycling England
The initial competition for funding invited bids from towns with a population of approximately 100,000. The towns selected for funding were chosen from applications by 31 local authorities, on the basis of three principal characteristics: the ambition of their programme to increase short urban trips by bike; the commitment and involvement of senior members and officers; and the commitment by the local authority to match-fund the CE central grant.
The towns received funding of £500,000 per year (approximately £5 per head of population per year), starting in October 2005, and matched by the respective local authorities so that the total level of investment in cycling was at least £10 per head per year. This represented a substantially higher level of investment than the English local authority average, which, at the beginning of the programme, was closer to roughly £1 per head per year. One of the towns, Aylesbury, had a smaller population (65,000 people), and hence received a lower absolute level of funding (approximately £300,000 per year). Two of the towns, Derby and Brighton & Hove, had larger populations of approximately 250,000 people. These towns did not receive higher levels of funding, but instead targeted their efforts on a portion of their population. In Derby this was achieved by focussing on children and young people; while in Brighton & Hove the effort was focussed on the western half of the city.
.

4Sloman L, Cavill N, Cope A, Muller L and Kennedy A (2009) Analysis and synthesis of evidence on the effects of investment in six Cycling Demonstration Towns
The approach to monitoring and data collection in the six towns involved three principal strands.
First, Sustrans Research and Monitoring Unit, in association with the University of Bolton and Leeds Institute for Transport Studies, was commissioned to develop and manage a programme of cycle activity measurement in the six towns. This required agreement with each town of a detailed monitoring plan, specifying the number and locations of automatic cycle counters so as to give an overview of cycle activity across the whole town; locations and frequencies of manual counts; use of secondary data sources, in particular from school and workplace travel surveys; and use of additional monitoring mechanisms such as cycle parking counts. Data collected by the six towns were collated and checked by Sustrans Research and Monitoring Unit, and subsequently analysed. In addition to analysis of core data, case studies addressed specific aspects of the Cycling Demonstration Town programme, drawing on the various strands of data collected and reflecting the nature of the programme as implemented in each town. Readers should refer to Cope et al. (forthcoming) for a more detailed explanation of data collection protocols and analytical methodologies.
Second, Cavill Associates managed on behalf of Cycling England two surveys of cycling activity and physical activity, carried out by ICM in all six towns in March 2006 and again in March 2009. These surveys were designed to address two main questions: did the population prevalence of cycling change between 2006 and 2009 in the Cycling Demonstration Towns; and, if there was an increase in cycling, was this associated with an increase in physical activity and therefore benefits to health? The surveys used quota (not random) samples and comprised of telephone interviews
with 1,500 individuals aged over 16 in each town. In addition, in association with the National Obesity Observatory, Cavill Associates carried out an analysis of data from the Sport England Active People survey3, which enabled a comparison of cycling activity and physical activity in local authorities which contained Cycling Demonstration Towns and in local authorities which did not contain a Cycling Demonstration Town.
Finally, in parallel with the analysis carried out by Cope et al. and Cavill et al., Cycling England commissioned Beth Hiblin of Buchanans, via its Professional Support Team, to carry out a series of in-depth interviews with local authority officers and stakeholders in the six towns during the summer of 2009. When complete, this will bring together reflections from key participants on the lessons from the previous three years.
In this synthesis, we bring together the key findings from the first two elements of the research, and attempt to place the results from the Cycling Demonstration Towns in context, drawing on data from the National Travel Survey and figures from London and other European towns and cities.
It should be noted that only a small budget was available for monitoring and evaluation in the six towns. The design of the monitoring programme pre-dated the development by the Department for Transport of draft guidance on evaluation of small-scale schemes (or so-called ‘Better Use’ interventions), and there was hence no formal programme evaluation using the ‘Theory of Change’ approach which is being applied in the evaluation of the 12 towns and cities in the second-phase Cycling City and Towns
3 The Active People Survey is a telephone survey of a random probability sample of individuals aged over 16. Data are reported at the level of the district / unitary authority, which is not always co-terminous with the urban area of each Cycling Demonstration Town. Each rolling survey spans two calendar years and lasts almost one year. The survey was conducted with 1,000 individuals per local authority in 2005/06 and 500 individuals per local authority in 2007/08
2. Approach to monitoring, data collection and analysis

5Sloman L, Cavill N, Cope A, Muller L and Kennedy A (2009) Analysis and synthesis of evidence on the effects of investment in six Cycling Demonstration Towns
programme4. This limits the extent to which it is possible to attribute outcomes (i.e. to say that the Cycling Demonstration Town programme was the cause of any increase in cycling), and also limits the extent to which we may draw certain conclusions, for example in relation to the contribution of the different interventions to observed increases in cycling, and in relation to household-level changes in travel behaviour. It should also be noted that the findings presented here are interim results, as funding in the six towns continues until March 2011 and further results will be reported after that time.
4 From October 2008, in parallel with the start of the second phase of investment in the original six towns, another 12 towns and cities were awarded funding for a further ‘CCT’ (Cycling City and Towns) programme.

6Sloman L, Cavill N, Cope A, Muller L and Kennedy A (2009) Analysis and synthesis of evidence on the effects of investment in six Cycling Demonstration Towns
conjecture that growth in cycling in the towns may have been ‘patchy’, with quite rapid growth on some routes, and little or no growth on others.
3.2 Changes in behaviour amongst adultsThe cycle count data show changes in the flow of cyclists passing designated points, but this does not enable us to distinguish between a situation in which existing cyclists have started to cycle more often, and one in which new people have begun cycling. This is where survey data are useful, as they report respondents’ own assessment of their cycling, enabling us to tell whether more people have started to cycle. Using figures from the Active People Survey, the proportion of adult residents of the local authorities with Cycling Demonstration Towns cycling for at least 30 minutes once or more per month increased from 11.8% in 2006 to 15.1% in 2008, an increase of 3.3%-points or 28%. Meanwhile, the proportion of adult residents of the six towns who cycled regularly (that is, for at least 30 minutes 12 times or more per month) increased from 2.6% in 2006 to 3.5% in 2008, an increase of 0.9%-points or 37%.
The Active People Survey is useful because it enables comparison with other local authorities without a Cycling Demonstration Town, discussed in section 4, below. However, its definition of cycling activity – a trip lasting at least 30 minutes – is problematic because it fails to capture a significant proportion of (shorter) cycling trips. Data from the ICM survey show that around two-thirds of those who cycled in the past week said that they did so for less than 30 minutes per day. It thus seems likely that the Active People Survey underestimates levels of change.
We look first at the changes in levels of cycling, and levels of physical activity, across the six towns taken together. The results, using a variety of measures, are summarised in Table 1 and explained in the following sections.
3.1 Overall change in cycling levelsUsing data from automatic cycle counters, the interim result for the mean increase in cycling levels across all six towns was 27%, relative to a 2005 baseline (before the beginning of the investment programme) and including data up until March 20095.
Each town also carried out quarterly manual counts of cyclists, for a partial cordon around the town centre (in the case of Lancaster with Morecambe, partial cordons around both town centres, and in the case of Exeter, additionally for a partial screenline using the River Exe). The average annual percentage change calculated using data from all the towns is 4%6.
In general, manual counts included both ‘on-carriageway’ cyclists and those cycling on cycle paths or tracks, while most, but not all, automatic counters were sited in traffic-free locations. In some towns, the automatic count data and the manual count data showed a consistent pattern (i.e. annual rates of change were similar), but this was not always the case. Specifically, two towns, Exeter and Lancaster with Morecambe, showed quite large increases in automatic cycle counts but a small decline in manual counts. This raises the
5 The ‘baseline’ in Brighton is 2006, as no counter data are available in 2005. No weighting adjustment was made for the different populations of the towns. Counters covered a range of sites; while these were principally on traffic-free routes, some counters were on-road and some were on cycle paths adjacent to roads. The reported change refers to the four year period between January 2006 and December 2009, calculated using data collected between January 2006 and the end of March 2009 and relative to baseline data collected in 2005 (2006 in the case of Brighton and Hove).6 This was calculated by taking the mean percentage change across the two partial cordons / screenlines in Lancaster with Morecambe and Exeter. An overall mean was then calculated using these values and the percentage changes calculated for the other towns. The manual count results are reported as annual figures (rather than for the three year period as with the automatic counts) because the manual counts began at variable dates, mostly nine to twelve months after the start of the programme.
3. Overview of results for the whole programme

7Sloman L, Cavill N, Cope A, Muller L and Kennedy A (2009) Analysis and synthesis of evidence on the effects of investment in six Cycling Demonstration Towns
The cycling and physical activity survey carried out for Cycling England by ICM7 therefore asked about cycle trips of any length. This survey found that the proportion of adult residents of the Cycling Demonstration Towns doing any cycling in a typical week in the previous year8 had risen from 24.3% in 2006 to 27.7% in 2009, an increase of approximately 3.4%-points or 14%.
A common concern in relation to physical activity is that any increase in one mode of activity (in this case, cycling) may be offset by a corresponding decline in other forms of activity, so that there is no overall physical activity benefit and hence no benefit to health. However, this does not seem to have been the case in the Cycling Demonstration Towns. Using a validated measure of physical activity, EPIC (taking together cycling, other physical exercise, and activity at work)9, the proportion of adult respondents classed as inactive fell from 26.2% in 2006 to 23.6% in 2009, a fall of 2.6%-points or 10%.
This change is likely to be associated with health benefits, as the validation study for EPIC showed that people classed as ‘moderately inactive’ have a significantly reduced risk of all-cause mortality compared to those classed as ‘inactive’.
As we do not have panel data (i.e. the before and after surveys used independent samples), it is not possible to say that the fall in the proportion of inactive respondents is a direct result of inactive
7 The ICM Survey was a telephone survey of a representative sample of approximately 1500 people in each Cycling Demonstration Town, carried out in March 2006 and repeated in March 2009. ICM imposed quotas to ensure that the profile of the interviewed sample exactly matched that of the known population profile within each town (as per Census 2001). These same quota targets were also used to post-weight the data. This yields a representative sample by a host of demographic variables, including sex, age, work status, tenure and social class.8 The survey question was ‘In a typical week during the past 12 months, how many hours did you spend on each of the following activities?’9 The European Prospective Investigation into Cancer and Nutrition (EPIC) short physical activity questionnaire produces a simple 4-level index of self-reported physical activity based on time spent in a typical week in occupational physical activity, cycling, sport and active recreation. This index has been found to be associated with risk of all-cause mortality. For full details see Cavill et al. (forthcoming).
individuals taking up cycling. However, we are able to say that the increase in the proportion of adult respondents cycling across the six towns has been accompanied by a reduction in the proportion of respondents classed as inactive.
3.3 Changes in behaviour amongst childrenThe Active People Survey and ICM Survey included only residents aged 16 or over, and therefore tell us nothing about the extent to which cycling may have increased amongst children, who were a major focus of the interventions in the Cycling Demonstration Towns. However, we do have some information about cycling amongst children and young people from two sources: the Pupil Level Annual School Census, and ‘hands up’ surveys at Bike It schools (described below).
From the Pupil Level Annual School Census, data on pupils’ usual mode of travel to school are available for the academic years 2006/07 and 2007/0810 for the majority of schools in the towns. Looking across all schools for which data are available in the six towns (both those with travel plans and those without travel plans), the proportion of children who usually cycled to school increased by 16% or 0.3%-points (from 1.9% to 2.2%) over this 12-month period.
10 ‘Usual mode of travel to school’ data are collected by local authorities for all schools with a school travel plan. Local authorities are also obliged to provide this information for a sample of schools without a travel plan.
Case Study

8Sloman L, Cavill N, Cope A, Muller L and Kennedy A (2009) Analysis and synthesis of evidence on the effects of investment in six Cycling Demonstration Towns
Data source Data that are included Short description of metric
Change
WHOLE TOWN ACTIVITYAutomatic cycle counts
Unweighted mean percentage change relative to 2005 baseline (2006 for Brighton) calculated using data collected between January 2006 and March 2009
Cycle levels +27% relative to baseline
Manual cycle counts
Unweighted mean percentage change per year in quarterly manual counts
Cycle levels +4% per year
ADULT POPULATIONSport England Active People Survey
Data for the group of six district / unitary local authorities corresponding to the Cycling Demonstration Towns, from surveys in 2006 and 2008: proportion of adult residents cycling for at least 30 minutes, once or more per month
Number of occasional cyclists (APS)
+28% or +3.3%-points (from 11.8% to 15.1%)
Sport England Active People Survey
Data for the group of six district / unitary local authorities corresponding to the Cycling Demonstration Towns, from surveys in 2006 and 2008: proportion of adult residents cycling for at least 30 minutes, 12 times or more per month
Number of regular cyclists (APS)
+37% or +0.9%-point (from 2.6% to 3.5%)
ICM Survey for Cycling England
Surveys carried out in the six Cycling Demonstration Towns in 2006 and 2009: proportion of adult residents doing any cycling in a typical week in the previous year
Number of occasional cyclists (ICM)
+14% or +3.4%-points (from 24.3% to 27.7%)
ICM Survey for Cycling England
Surveys carried out in the six Cycling Demonstration Towns in 2006 and 2009: proportion of residents classed as ‘inactive’ (taking account of cycling activity, other physical exercise and activity at work) NB: this is a negative indicator: a reduction in inactivity is an improvement
Number of inactive people (ICM)
-10% or -2.6%-points (from 26.2% to 23.6%)
CHILD POPULATION (<16)School Census (PLASC) data
Annual pupil-level survey, all schools, pooled data for 2006/07 and 2007/08 academic years: proportion of pupils for which cycling is the usual mode of travel to school
Cycling mode share for trips to school (SC)
+16% or +0.3%-points (from 1.9% to 2.2%)
‘Hands up’ surveys of Bike It schools
Surveys of Bike It schools, pooled data from ‘baseline’ surveys (in September 2006/2007) and ‘ex-post’ surveys (in July 2007/2008): proportion of pupils cycling to school either ‘every day’ or ‘once or twice a week’
Number of children cycling regularly to school (HU)
+126% or +14.6%-points (from 11.6% to 26.2%)
‘Hands up’ surveys of Bike It schools
Surveys of Bike It schools, pooled data, change in cycling mode share between ‘baseline’ surveys (in September 2006/2007) and ‘ex-post’ surveys (in July 2007/2008): proportion of pupils for which cycling is the mode of travel to school on day of survey
Cycling mode share for trips to school (HU)
+174% or +7.3%-points (from 4.2% to 11.5%)
Table 1: Overview of programme-wide changes in cycling and physical activity in the six Cycling Demonstration Towns
Note: some figures may not add due to rounding. See section 3 for discussion of these results.

9Sloman L, Cavill N, Cope A, Muller L and Kennedy A (2009) Analysis and synthesis of evidence on the effects of investment in six Cycling Demonstration Towns
2006), 55.3% in the ex-post survey 10 months later (July 2007), and 54.9% after a further 12 months (July 2008).
Meanwhile, the proportion of pupils who cycled to school on a regular basis – either ‘every day’ or ‘once or twice a week’ – increased by 126% or 14.6%-points (from 11.6% to 26.2%) between the baseline survey at each school (in either September 2006 or September 2007) and the ex-post survey 10 months later. Looking just at the 22 schools where a further survey had taken place 12 months after the end of intensive support, the data confirm that the prevalence of cycling amongst children for the journey to school was maintained: the proportion of pupils cycling to school either ‘every day’ or ‘once or twice a week’ was 8.7% at baseline (September 2006); 26.0% in the survey 10 months later (July 2007) and 25.1% after a further 12 months (July 2008).
The ‘hands up’ surveys in Bike It schools also asked how pupils had travelled to school on the day of the survey, and this enables us to examine mode share for the journey to school and, in particular, to understand the extent to which increased cycling was accompanied by reduced car use. Pooling the data from baseline surveys for all schools (in September 2006 or September 2007), and comparing it to the pooled data for the ex-post surveys 10 months later (July 2007 or July 2008)12, we find that the proportion of trips to school by cycle increased by 174% or 7.3%-points (from 4.2% to 11.5%). The proportion of trips to school by car fell by 4% or 1.4%-points (from 38.9% to 37.5%). Roundly speaking, about half of the increase in cycling appears to have been the result of a reduction in bus and car mode share (hence offering physical activity benefits), with the rest of the increase being the result of modal shift from walking (Figure 1).
12 The number of pupils surveyed in September 2006 and September 2007 were summed to give the total participating in a baseline survey. The number of pupils surveyed in July 2007 and July 2008 were summed to give the total participating in an ex-post survey. The totals responding in each category were summed across the two instances of either the baseline or ex-post survey and expressed as a percentage of these totals.
Across the six towns, a total of 129 schools (approximately 46% of all schools) were offered the intensive support of a ‘Bike It’ officer. Most of the schools receiving Bike It were primary schools. For 60 of these schools, in five of the towns, data are available from ‘hands up’ surveys carried out before the start of the Bike It support (in September 2006 or September 2007) and at the end of the academic year in which the school had received this support (in July 2007 or July 2008)11. Twenty-two of the first cohort of schools also took part in a further follow-up survey in July 2008. ‘Bike It’ schools typically received a comprehensive package of support to encourage cycling, including secure cycle storage and Bikeability cycle training as well as a wide range of activities to promote cycling and engage school pupils and their parents. Any change in prevalence of cycling, and of cycling mode share (and any corresponding change in car passenger mode share) at these schools is therefore of particular interest.
Looking first at prevalence of cycling amongst pupils at these schools, the proportion of pupils surveyed who ‘never’ cycled to school fell by 29% or 22.6%-points (from 78.5% to 55.9%) between the baseline survey at each school (in either September 2006 or September 2007) and the ex-post survey approximately 10 months later (in either July 2007 or July 2008). For 22 schools with a further survey 12 months later (that is, 12 months after the most intensive support had ceased), it appeared that the prevalence of cycling to school had, broadly speaking, been maintained. That is, looking just at this group of schools, the proportion of pupils who ‘never’ cycled to school was 81.0% in the baseline survey (September
11 In one town, Darlington, the data collection process was such that consistent baseline and ex-post survey data were not available. Evidence regarding changes in cycling to school in Darlington is reported later, and in Table A.3. For the five towns for which data are reported here, the baseline and ex-post surveys were carried out at the beginning and end of the academic year, so that both surveys captured the same cohort of children. However, this means that the ex-post survey took place at a different time of year to the baseline (July versus September), with the potential to affect results. A total of 60 consistent baseline and ex-post surveys were available for analysis (12 schools in Aylesbury; 12 schools in Brighton; 8 schools in Derby; 14 schools in Exeter and 14 schools in Lancaster).

10Sloman L, Cavill N, Cope A, Muller L and Kennedy A (2009) Analysis and synthesis of evidence on the effects of investment in six Cycling Demonstration Towns
Figure 1: Percentage point change in mode share between surveys performed at the beginning of the Bike It programme and ten months later at end of the first year of engagement (five towns, excluding Darlington)
Sloman L, Cavill N, Cope A, Muller L and Kennedy A (2009) Analysis and synthesis of evidence on the effects of investment in six Cycling Demonstration Towns
9
later (July 2007 or July 2008)12
, we find that the proportion of trips to school by cycle increased by 174% or 7.3%-points (from 4.2% to 11.5%). The proportion of trips to school by car fell by 4% or 1.4%-points (from 38.9% to 37.5%). Roundly speaking, about half of the increase in cycling appears to have been the result of a reduction in bus and car mode share (hence offering physical activity benefits), with the rest of the increase being the result of modal shift from walking (Figure 1).
Figure 1: Percentage point change in mode share between surveys performed at the beginning of the Bike It programme and ten months later at the end of the first year of engagement (five towns, excluding Darlington)
-6
-4
-2
0
2
4
6
8
Total car Total walk Total bus Total cycle Totaltrain/other
perc
enta
ge p
oint
cha
nge
Baseline survey: n = 14,896; ex-post survey: n = 13,200 (pooled data from 60 schools surveyed in September 2006 and July 2007, or September 2007 and July 2008) 3.4 Demographic differences in behaviour change The ICM survey enables us to draw some inferences about the extent to which there was a change in behaviour across different demographic and socioeconomic groups, or whether change was concentrated within particular groups of people13
.
12 The number of pupils surveyed in September 2006 and September 2007 were summed to give the total participating in a baseline survey. The number of pupils surveyed in July 2007 and July 2008 were summed to give the total participating in an ex-post survey. The totals responding in each category were summed across the two instances of either the baseline or ex-post survey and expressed as a percentage of these totals. 13 Analysis of the ICM data used traditional significance testing, which may not be directly applicable to the quota sampling method used in this survey. Reported significance tests (su ch as p values) should therefore be treated as indicative of a difference between reported data.
Baseline survey: n= 14,896: ex post survey: n=13,200 (pooled data from 60 schools surveyed in September 2006 and July 2007, or September 2007 and July 2008)
11Sloman L, Cavill N, Cope A, Muller L and Kennedy A (2009) Analysis and synthesis of evidence on the effects of investment in six Cycling Demonstration Towns
3.4 Demographic differences in behaviour changeThe ICM survey enables us to draw some inferences about the extent to which there was a change in behaviour across different demographic and socioeconomic groups, or whether change was concentrated within particular groups of people13.
Looking at the number of adult occasional cyclists (that is, those who had done any cycling at all in a typical week in the last year), we find the following:
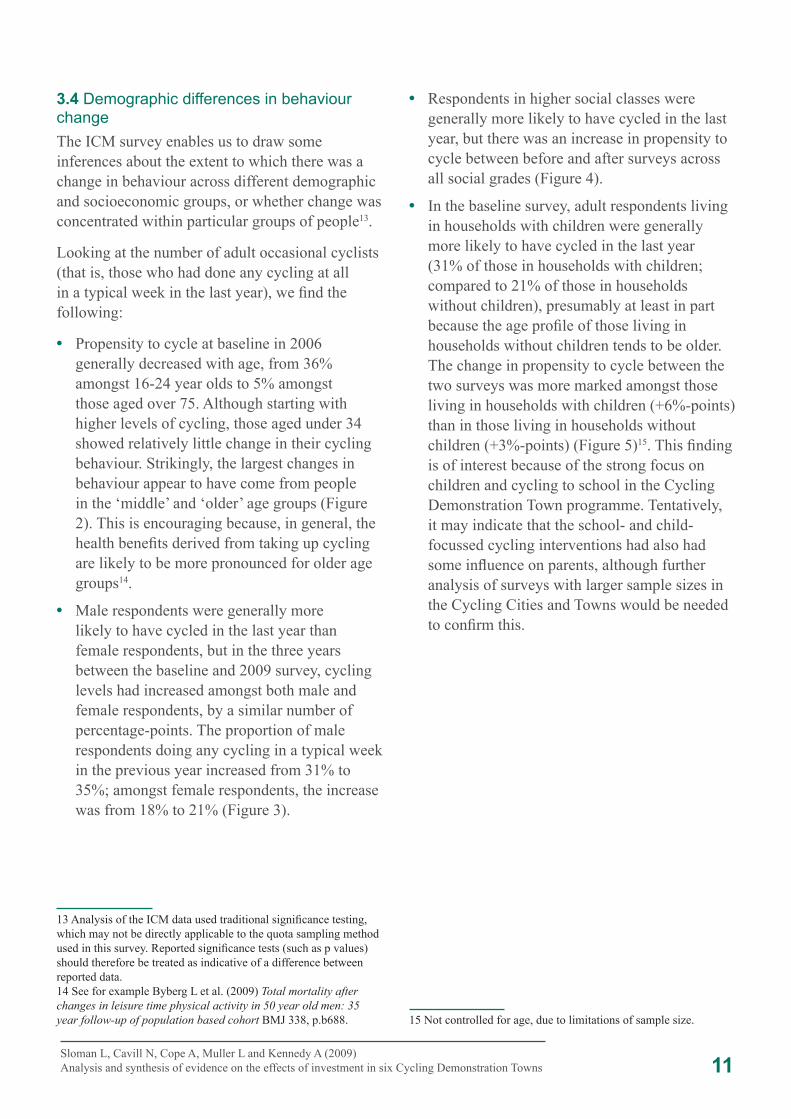
• Propensity to cycle at baseline in 2006 generally decreased with age, from 36% amongst 16-24 year olds to 5% amongst those aged over 75. Although starting with higher levels of cycling, those aged under 34 showed relatively little change in their cycling behaviour. Strikingly, the largest changes in behaviour appear to have come from people in the ‘middle’ and ‘older’ age groups (Figure 2). This is encouraging because, in general, the health benefits derived from taking up cycling are likely to be more pronounced for older age groups14.
• Male respondents were generally more likely to have cycled in the last year than female respondents, but in the three years between the baseline and 2009 survey, cycling levels had increased amongst both male and female respondents, by a similar number of percentage-points. The proportion of male respondents doing any cycling in a typical week in the previous year increased from 31% to 35%; amongst female respondents, the increase was from 18% to 21% (Figure 3).
13 Analysis of the ICM data used traditional significance testing, which may not be directly applicable to the quota sampling method used in this survey. Reported significance tests (such as p values) should therefore be treated as indicative of a difference between reported data.14 See for example Byberg L et al. (2009) Total mortality after changes in leisure time physical activity in 50 year old men: 35 year follow-up of population based cohort BMJ 338, p.b688.
• Respondents in higher social classes were generally more likely to have cycled in the last year, but there was an increase in propensity to cycle between before and after surveys across all social grades (Figure 4).
• In the baseline survey, adult respondents living in households with children were generally more likely to have cycled in the last year (31% of those in households with children; compared to 21% of those in households without children), presumably at least in part because the age profile of those living in households without children tends to be older. The change in propensity to cycle between the two surveys was more marked amongst those living in households with children (+6%-points) than in those living in households without children (+3%-points) (Figure 5)15. This finding is of interest because of the strong focus on children and cycling to school in the Cycling Demonstration Town programme. Tentatively, it may indicate that the school- and child-focussed cycling interventions had also had some influence on parents, although further analysis of surveys with larger sample sizes in the Cycling Cities and Towns would be needed to confirm this.
15 Not controlled for age, due to limitations of sample size.

12Sloman L, Cavill N, Cope A, Muller L and Kennedy A (2009) Analysis and synthesis of evidence on the effects of investment in six Cycling Demonstration Towns
Figure 2: Proportion reporting any cycling in a typical week in the previous year, by age
Sloman L, Cavill N, Cope A, Muller L and Kennedy A (2009) Analysis and synthesis of evidence on the effects of investment in six Cycling Demonstration Towns
11
Figure 2: Proportion reporting any cycling in a typical week in the previous year, by age
05
10
15202530
354045
16-24 25-34 35-44 45-54 55-64 65-74 75+
age
perc
enta
ge
20062009
Source: ICM Survey. 2006: n=2,222; 2009: n=2,486. Figure 3: Proportion reporting any cycling in a typical week in the previous year, by gender
05
10152025303540
male female
perc
enta
ge
20062009
Source: ICM Survey. 2006: n=2,222; 2009: n=2,486.
Source: ICM Survey, 2006: n=2,222; 2009: n=2,486
Source: ICM Survey, 2006: n=2,222; 2009: n=2,486
Figure 3: Proportion reporting any cycling in a typical week in the previous year, by gender
Sloman L, Cavill N, Cope A, Muller L and Kennedy A (2009) Analysis and synthesis of evidence on the effects of investment in six Cycling Demonstration Towns
11
Figure 2: Proportion reporting any cycling in a typical week in the previous year, by age
05
10
15202530
354045
16-24 25-34 35-44 45-54 55-64 65-74 75+
age
perc
enta
ge
20062009
Source: ICM Survey. 2006: n=2,222; 2009: n=2,486. Figure 3: Proportion reporting any cycling in a typical week in the previous year, by gender
05
10152025303540
male female
perc
enta
ge
20062009
Source: ICM Survey. 2006: n=2,222; 2009: n=2,486.

13Sloman L, Cavill N, Cope A, Muller L and Kennedy A (2009) Analysis and synthesis of evidence on the effects of investment in six Cycling Demonstration Towns
Figure 4: Proportion reporting any cycling in a typical week in the previous year, by social grade
Sloman L, Cavill N, Cope A, Muller L and Kennedy A (2009) Analysis and synthesis of evidence on the effects of investment in six Cycling Demonstration Towns
12
Figure 4: Proportion reporting any cycling in a typical week in the previous year, by social grade
0
10
20
30
40
50
A B C D E
social grade
perc
enta
ge
20062009
Source: ICM Survey. 2006: n=2,222; 2009: n=2,486. Figure 5: Proportion reporting any cycling in a typical week in the previous year, by household type
05
10152025303540
children in household no children
perc
enta
ge
20062009
Source: ICM Survey. 2006: n=2,222; 2009: n=2,486.
Source: ICM Survey, 2006: n=2,222; 2009: n=2,486
Source: ICM Survey, 2006: n=2,222; 2009: n=2,486
Figure 3: Proportion reporting any cycling in a typical week in the previous year, by household type
Sloman L, Cavill N, Cope A, Muller L and Kennedy A (2009) Analysis and synthesis of evidence on the effects of investment in six Cycling Demonstration Towns
12
Figure 4: Proportion reporting any cycling in a typical week in the previous year, by social grade
0
10
20
30
40
50
A B C D E
social grade
perc
enta
ge
20062009
Source: ICM Survey. 2006: n=2,222; 2009: n=2,486. Figure 5: Proportion reporting any cycling in a typical week in the previous year, by household type
05
10152025303540
children in household no children
perc
enta
ge
20062009
Source: ICM Survey. 2006: n=2,222; 2009: n=2,486.

14Sloman L, Cavill N, Cope A, Muller L and Kennedy A (2009) Analysis and synthesis of evidence on the effects of investment in six Cycling Demonstration Towns
Although the results summarised in section 3 above appear broadly positive, it is of course possible that they are simply a reflection of some wider (national) trend and unrelated to the investment and interventions in the six towns.
In order to assess whether it is likely that this is the case, we examined two sources of information: first, the Sport England Active People Survey, which enabled comparison of numbers of occasional and regular cyclists between local authorities with Cycling Demonstration Towns and other local authority areas; and second, data on cycle trip stages and trip distances in medium-sized towns, from the National Travel Survey.
4.1 Comparative data from the Active People SurveyIn section 3 above, we reported changes in the proportion of the adult population who were occasional cyclists and regular cyclists, in 2007/08 compared to 2005/06, based on data from Sport England’s Active People Survey.
Using data from the same survey, it is possible to compare changes in cycling behaviour in the local authorities with Cycling Demonstration Towns with those in other local authorities. We did this in two ways. First, we compared the cycling behaviour change in the Cycling Demonstration Town local authorities with that in all other local authority areas (Figures 6 and 7)16. Looking at both sets of figures for occasional and regular cyclists, it appears that the increase in prevalence of cycling seen in the Cycling Demonstration Town local authorities is absent in the non-CDT local authorities.
16 Comparisons were made between data for the whole local authority area, not just the urban part of the local authority
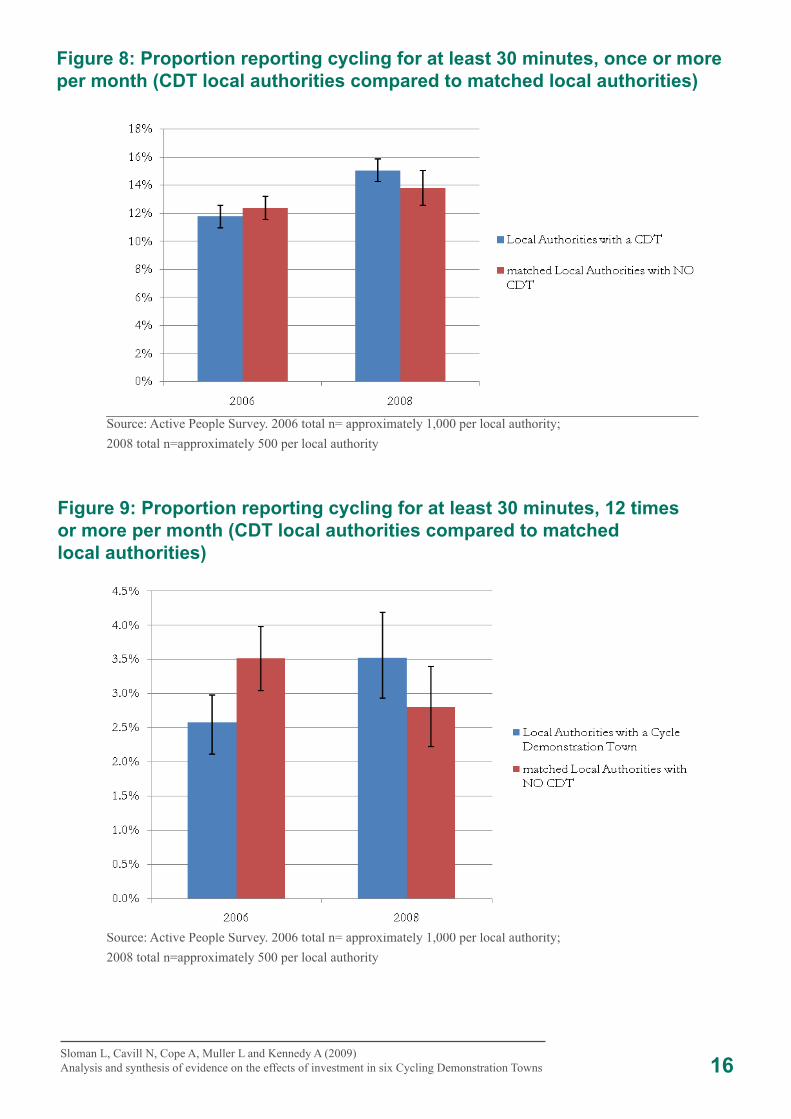
Then, we matched each of the Cycling Demonstration Town local authorities with the local authority that is considered most similar, using the National Statistics 2001 Area Classification (Figures 8 and 9). The increase in cycling behaviour for either occasional or regular cyclists in the Cycling Demonstration Town local authorities is not observed in the matched local authorities17.
These data should be treated with caution because they are, as yet, only available from two consecutive year-long surveys. Nevertheless, they appear to indicate that the changes in the prevalence of cycling amongst adults in the Cycling Demonstration Towns are not simply a result of some wider trend in cycling. This gives us greater confidence that the observed changes may be directly related to the interventions in the towns.
17 There is a small increase in the proportion of people cycling for 30 minutes once or more per month in the matched towns (from 12.4% to 13.8%) but this is not significant at the 95% level (p-value 0.49).
4. Comparison with changes in cycling outside the Cycling Demonstration Towns

15Sloman L, Cavill N, Cope A, Muller L and Kennedy A (2009) Analysis and synthesis of evidence on the effects of investment in six Cycling Demonstration Towns
Figure 6: Proportion reporting cycling for at least 30 minutes, once or more per month (CDT local authorities compared to all other local authority areas)
Sloman L, Cavill N, Cope A, Muller L and Kennedy A (2009) Analysis and synthesis of evidence on the effects of investment in six Cycling Demonstration Towns
14
Figure 6: Proportion reporting cycling for at least 30 minutes, once or more per month (CDT local authorities compared to all other local authority areas)
Source: Active People Survey. 2006 total n= approximately 1,000 per local authority; 2008 total n=approximately 500 per local authority Figure 7: Proportion reporting cycling for at least 30 minutes, 12 times or more per month (CDT local authorities compared to all other local authority areas)
Source: Active People Survey. 2006 total n= approximately 1,000 per local authority; 2008 total n=approximately 500 per local authority
Source: Active People Survey. 2006 total n= approximately 1,000 per local authority; 2008 total n=approximately 500 per local authority
Source: Active People Survey. 2006 total n= approximately 1,000 per local authority; 2008 total n=approximately 500 per local authority
Figure 7: Proportion reporting cycling for at least 30 minutes, 12 times or more per month (CDT local authorities compared to all other local authority areas)
Sloman L, Cavill N, Cope A, Muller L and Kennedy A (2009) Analysis and synthesis of evidence on the effects of investment in six Cycling Demonstration Towns
14
Figure 6: Proportion reporting cycling for at least 30 minutes, once or more per month (CDT local authorities compared to all other local authority areas)
Source: Active People Survey. 2006 total n= approximately 1,000 per local authority; 2008 total n=approximately 500 per local authority Figure 7: Proportion reporting cycling for at least 30 minutes, 12 times or more per month (CDT local authorities compared to all other local authority areas)
Source: Active People Survey. 2006 total n= approximately 1,000 per local authority; 2008 total n=approximately 500 per local authority
16Sloman L, Cavill N, Cope A, Muller L and Kennedy A (2009) Analysis and synthesis of evidence on the effects of investment in six Cycling Demonstration Towns
Figure 8: Proportion reporting cycling for at least 30 minutes, once or more per month (CDT local authorities compared to matched local authorities)
Sloman L, Cavill N, Cope A, Muller L and Kennedy A (2009) Analysis and synthesis of evidence on the effects of investment in six Cycling Demonstration Towns
15
Figure 8: Proportion reporting cycling for at least 30 minutes, once or more per month (CDT local authorities compared to matched local authorities)
Source: Active People Survey. 2006 total n= approximately 1,000 per local authority; 2008 total n=approximately 500 per local authority Figure 9: Proportion reporting cycling at least 30 minutes, 12 times or more per month (CDT local authorities compared to matched local authorities)
Source: Active People Survey. 2006 total n= approximately 1,000 per local authority; 2008 total n=approximately 500 per local authority
Source: Active People Survey. 2006 total n= approximately 1,000 per local authority; 2008 total n=approximately 500 per local authority
Source: Active People Survey. 2006 total n= approximately 1,000 per local authority; 2008 total n=approximately 500 per local authority
Figure 9: Proportion reporting cycling for at least 30 minutes, 12 times or more per month (CDT local authorities compared to matched local authorities)
Sloman L, Cavill N, Cope A, Muller L and Kennedy A (2009) Analysis and synthesis of evidence on the effects of investment in six Cycling Demonstration Towns
15
Figure 8: Proportion reporting cycling for at least 30 minutes, once or more per month (CDT local authorities compared to matched local authorities)
Source: Active People Survey. 2006 total n= approximately 1,000 per local authority; 2008 total n=approximately 500 per local authority Figure 9: Proportion reporting cycling at least 30 minutes, 12 times or more per month (CDT local authorities compared to matched local authorities)
Source: Active People Survey. 2006 total n= approximately 1,000 per local authority; 2008 total n=approximately 500 per local authority

17Sloman L, Cavill N, Cope A, Muller L and Kennedy A (2009) Analysis and synthesis of evidence on the effects of investment in six Cycling Demonstration Towns
Nevertheless, it appears that the general trend in medium urban areas over the period since 2005 (and indeed since 2002) was either for cycling levels (in terms of average distance cycled per person) to have been broadly stable, or perhaps, if average number of cycle trip stages are examined, to have slightly declined.
We also examined special tabulations of frequency of bicycle use by area of residence for medium-sized urban areas. These data showed very little change nationally between 2005 and 2008. The proportion of people of all ages in medium urban areas who cycled ‘less than once a year’ or ‘never’ was stable at 68 or 67% in each year between 2005 and 2008.
Thus, the increase in cycling in the Cycling Demonstration Towns (+27%, as measured by automatic counts, or +14% as measured by proportion of adults doing any cycling in a typical week) cannot be explained by reference to a general trend of growth in cycling in medium-sized urban areas.
4.2 Comparison with national cycling trendsA further check on whether the changes in cycling levels in the Cycling Demonstration Towns might be related to more general (national) changes in travel behaviour may be made by examining National Travel Survey data. For this, we looked at special tabulations of the NTS data for medium-sized urban areas (those with populations of between 25,000 and 250,000 people, corresponding with the range in population of the CDTs)18.
The NTS data (based on travel diaries) are shown in Figure 10, indexed to the level for 2005, which is also the baseline year for reporting of the automatic cycle count data in the Cycling Demonstration Towns. The data show quite erratic apparent variations from one year to the next, highlighting the need to examine data over several years in order to gain a reliable picture of cycling trends.
18 Special tabulations were initially prepared by DfT statisticians for the Smarter Choices Follow On Study (an evaluation of the investment in the three Sustainable Travel Towns).
Sloman L, Cavill N, Cope A, Muller L and Kennedy A (2009) Analysis and synthesis of evidence on the effects of investment in six Cycling Demonstration Towns
17
Figure 10: Cycling trip stages per person and distance per person, indexed to 2005 levels, for medium urban areas (25,000 – 250,000 population)
020406080
100120140160
2002 2003 2004 2005 2006 2007 2008
stagesstage distance
Note: data are for journey stages, not trips, and thus include cycling as part of a trip (e.g. from home to the station) as well as trips made entirely by bicycle. Relevant period for comparison with Cycling Demonstration Towns is from 2005 onwards, but earlier data are included to illustrate erratic flu ctuations from year to year in this dataset. 5. Rate of growth in cycling Having established that the growth in cycling in the Cycling Demonstration Towns differs from the underlying trends, we now address the question of how the rate of growth across the six towns compares with other towns and cities which have been successful in increasing cycling. First, we compare the growth rate in the Cycling Demonstration Towns with the growth rate in London. Investment and strategic planning for cycling in London received a substantial boost from 2000 onwards, following the creation of Transport for London. Cycling levels, as measured by cycle counts on the strategic road network (the Transport for London Road Network, or TLRN), grew by 107% in the eight years between 2000/01 and 2008/09. Growth was initially slow, accelerated slightly between 2003 and 2005, and thereafter continued but at a slightly lower rate. In Figure 11, the growth trend in London is re-based to the start date for the Cycling Demonstration Town programme, so that cycling levels in 2005/06 equal 100%. This enables us to compare the growth in the Cycling Demonstration Towns since 2005 with the growth in London. From inspection of Figure 11, it appears that the growth rate in the Cycling Demonstration Towns is in line with that which was achieved in London over the period since 2005 (although not as much as the rate in London between 2003 and 2005, which, speculatively, may perhaps be related to the introduction of the congestion charge in February 2003).
Note: data are for journey stages, not trips, and thus include cycling as part of a trip (e.g. from home to the station) as well as trips made entirely by bicycle. Relevant period for comparison with Cycling Demonstration Towns is from 2005 onwards, but earlier data are included to illustrate erratic fluctuations from year to year in this dataset.
Figure 10: Cycling trip stages per person and distance per person, indexed to 2005 levels, for medium urban areas (25,000 - 250,000 population)

18Sloman L, Cavill N, Cope A, Muller L and Kennedy A (2009) Analysis and synthesis of evidence on the effects of investment in six Cycling Demonstration Towns
Having established that the growth in cycling in the Cycling Demonstration Towns differs from the underlying trends, we now address the question of how the rate of growth across the six towns compares with other towns and cities which have been successful in increasing cycling.
First, we compare the growth rate in the Cycling Demonstration Towns with the growth rate in London. Investment and strategic planning for cycling in London received a substantial boost from 2000 onwards, following the creation of Transport for London. Cycling levels, as measured by cycle counts on the strategic road network (the Transport for London Road Network, or TLRN), grew by 107% in the eight years between 2000/01 and 2008/09. Growth was initially slow, accelerated slightly between 2003 and 2005, and thereafter continued but at a slightly lower rate.
In Figure 11, the growth trend in London is re-based to the start date for the Cycling Demonstration Town programme, so that cycling levels in 2005/06 equal 100%. This enables us to compare the growth in the Cycling Demonstration Towns since 2005 with the growth in London.
From inspection of Figure 11, it appears that the growth rate in the Cycling Demonstration Towns is in line with that which was achieved in London over the period since 2005 (although not as much as the rate in London between 2003 and 2005, which, speculatively, may perhaps be related to the introduction of the congestion charge in February 2003).
5. Rate of growth in cycling
Figure 11: Growth in cycling in the Cycling Demonstration Towns compared to London
Sloman L, Cavill N, Cope A, Muller L and Kennedy A (2009) Analysis and synthesis of evidence on the effects of investment in six Cycling Demonstration Towns
18
Figure 11: Growth in cycling in the Cycling Demonstration Towns compared to London
0%
20%40%
60%
80%
100%120%
140%
2000
2001
2002
2003
2004
2005
2006
2007
2008
2009
CDTsLondon
Note: data for London are reported for the period 1 April to 31 March each year, whereas data for Cycling Demonstration Towns are for the period 1 January to 31 December. The line for London is an index of cycling levels on the TLRN (Transport for London Road Network), re-based with 2005/06=100%. Next, we look at how the annual growth rate in the Cycling Demonstration Towns compares with the growth rate in European towns and cities which have been successful in promoting cycling. For this, we would ideally use figures for changes in cycling levels over time, since these would provide the closest match to the metrics we have in the Cycling Demonstration Towns. However, case study reviews of cycling in European cities rarely report these data, and it is more common to report changes in cycling mode share. We therefore examine both the small number of examples of towns with data on change in cycling levels over time (in Table 2) and, separately, the data on change in cycling mode share (Table 3). The figures for changes in cycling levels are derived from a forthcoming review by Pucher et al. (2010) and from information published by the City of Copenhagen. Pucher et al. also report figures for one American city, Portland, and we include that here. For the five cities for which we have data, the periods over which the recorded growth was achieved range from 12 to 31 years, with different start and end dates. The figures for changes in cycling mode share are from a literature review by Transport for London. The periods over which the recorded growth was achieved range from six to 22 years, again with different start and end dates. The mode share data have been used by TfL to estimate the ‘average annual increase in cycling flows’ that would be expected, under conditions of stable population, trip rate and trip distance.
Note: data for London are reported for the period 1 April to 31 March each year, whereas data for Cycling Demonstration Towns are for the period 1 January to 31 December. The line for London is an index of cycling levels on the TLRN (Transport for London Road Network), re-based with 2005/06=100%.

19Sloman L, Cavill N, Cope A, Muller L and Kennedy A (2009) Analysis and synthesis of evidence on the effects of investment in six Cycling Demonstration Towns
City From To No. of years
Change in cycling levels Average annual increase in cycling levels
Portland 1992 2008 16 +369% (number of bicycles crossing four bridges into city centre)
+10.1%
Berlin 1975 2001 26 +275% (number of bicycle trips) +5.2%
Freiburg 1976 2007 31 +204% (number of bicycle trips) +3.7%
Odense 1984 2002 18 +80% (number of bicycle trips) +3.3%
Copenhagen 1996 2008 12 +26% (distance cycled per weekday: from 0.93 to 1.17 million km)
+1.9%
Next, we look at how the annual growth rate in the Cycling Demonstration Towns compares with the growth rate in European towns and cities which have been successful in promoting cycling.
For this, we would ideally use figures for changes in cycling levels over time, since these would provide the closest match to the metrics we have in the Cycling Demonstration Towns. However, case study reviews of cycling in European cities rarely report these data, and it is more common to report changes in cycling mode share. We therefore examine both the small number of examples of towns with data on change in cycling levels over time (in Table 2) and, separately, the data on change in cycling mode share (Table 3).
The figures for changes in cycling levels are derived from a forthcoming review by Pucher et al. (2010) and from information published by the City of Copenhagen. Pucher et al. also report figures for one American city, Portland, and we include that here. For the five cities for which we have data, the periods over which the recorded growth was achieved range from 12 to 31 years, with different start and end dates.
The figures for changes in cycling mode share are from a literature review by Transport for London. The periods over which the recorded growth was achieved range from six to 22 years, again with different start and end dates. The mode share data have been used by TfL to estimate the ‘average annual increase in cycling flows’ that would be expected, under conditions of stable population, trip rate and trip distance.
Table 2: Change in cycling levels in European (and one American) cities
Figures for change in cycling levels in Copenhagen from City of Copenhagen (2009) Copenhagen City of Cyclists: Bicycle Account 2008
Figures for change in cycling levels in Berlin, Freiburg, Odense and Portland from Pucher J, Dill J and Handy S (forthcoming) Infrastructure, programs and policies to increase bicycling: an international review prepared for the Active Living Research Program of the Robert Wood Johnson Foundation, and tentatively scheduled for publication in Preventive Medicine, Vol 48, No 2, February 2010.
Note: Pucher et al. also quote the example of Paris, where bicycle trips increased by 46% between June and October 2007, after introduction of the Velib’ bicycle hire scheme
Method used to calculate ‘average annual increase in cycling levels’ is consistent with that used by TfL in Table 3.

20Sloman L, Cavill N, Cope A, Muller L and Kennedy A (2009) Analysis and synthesis of evidence on the effects of investment in six Cycling Demonstration Towns
Broadly speaking, the figures for changes in cycling levels (Table 2) suggest actual annual growth rates of between about 2% and 10%. The figures for the change in cycling mode share (Table 3) imply similar (but theoretical) annual growth rates of between about 1% and 7%19. As would be expected, cities with very high levels of cycling (Copenhagen, Delft) show figures nearer the bottom of the range, while cities with lower levels of cycling (Portland, Vienna) show figures nearer the top of the range.
For the Cycling Demonstration Towns, the estimated change in cycling levels between January 2006 and December 2009 is +27%,
19 Under conditions of constant population, trip rates and trip distance.
calculated on the basis of automatic count data collected between January 2006 and March 2009, relative to baseline data collected during 2005 (2006 for Brighton and Hove). Using an equivalent method to that adopted by TfL for calculating annual change, this is equivalent to an average annual growth rate of 6.2%, which lies near to the top of the range for the European cities, but somewhat lower than the figure for the one American city, Portland.
In broad terms, it therefore appears that the growth rate in cycling levels for the Cycling Demonstration Town programme is in line with growth rates in cities which have demonstrated sustained long-term commitment to cycling.
City From To No. of years
Baseline mode share
End mode share
Average annual increase in cycling flows
Strasbourg 1996 2002 6 8% 12% +7.0%
Vienna 1986 1999 13 2% 4.5% +6.4%
Graz 1979 1991 12 7% 14% +5.9%
Munich 1980 2002 22 4% 13% +5.5%
Hanover 1979 1990 11 9% 16% +5.4%
Freiburg 1976 1992 16 10% 20% +4.4%
Munster 1981 1992 11 29% 43% +3.6%
Zurich 1981 2001 20 7% 11% +2.3%
Delft 1979 1985 6 40% 43% +1.2%
Table 3: Change in cycling mode share in European cities
Extract from Transport for London (2004) Creating a Chain Reaction: the London Cycling Action Plan
‘Average annual increase in cycling flows’ has been derived from the change in mode share by TfL and gives compound percentage growth rate required to achieve the reported change in mode share between baseline and end date.

21Sloman L, Cavill N, Cope A, Muller L and Kennedy A (2009) Analysis and synthesis of evidence on the effects of investment in six Cycling Demonstration Towns
Results for the individual towns are summarised in Annex 1. In addition to the metrics used for the overall programme (as listed in Table 1), we are able here to include data from several further sources, as follows:
• Four towns carried out counts of parked bikes either at the railway station (Aylesbury) or on a ‘beat’ covering various locations around the town (Brighton, Derby, Lancaster with Morecambe);
• One town (Darlington) carried out annual ‘hands up’ surveys of mode of travel to school covering most pupils, over the whole period of the Cycling Demonstration Town work20;
• One town (Exeter) carried out an annual survey of usual mode of travel to work;
• Two towns (Darlington and Lancaster with Morecambe) had household travel surveys, carried out to provide a baseline and ex-post survey of personal travel planning interventions in the towns during the period of the Cycling Demonstration Town work.
Several of the metrics reported in the summary tables for each town suffer from limitations, which mean that the results should be treated with caution. In particular, manual counts do not always represent a complete cordon around town centres; counts of parked bikes were at a limited number of sites and only carried out on one day of the year, so that apparently large changes (upwards or downwards) may not reflect real trends; and PLASC (School Census) data are only available for two consecutive years. For the ICM survey, statistical tests to assess the significance of any apparent change may only be treated as indicative, because quota samples (rather than random samples) were used.
Nevertheless, it is clear from Annex 1 that most changes in most of the towns are in a ‘positive’ direction – that is, towards increased cycling
20 This provides a longer time series of data (from 2004/05 to 2008/09) than PLASC. It is organised and reported separately by Darlington BC. Data from the ‘hands up’ survey are felt by Darlington officers to be more robust than the PLASC returns.
(however measured), and towards less sedentary behaviour. The consistency of this pattern may give us some confidence that the recorded results in the individual towns represent real changes in travel patterns, even while we may not be certain that each individual result for each individual town is of sufficient magnitude or reliability to be considered to be statistically significant. It should also be remembered that these are interim findings, halfway through the period of investment.
Thus, we may tentatively draw the following conclusions from the data summarised in Annex 1:
• All six towns showed an increase in cycling levels as measured by automatic counts, ranging from +2.4% to +57% (with year-on-year growth shown in Figure 12, below);
• Three towns showed an increase in cycling levels as measured by manual counts (between +6% and +13% per year); while one town showed a mixed picture (Lancaster with Morecambe, with +3% per year in Lancaster and -5% per year in Morecambe21); and two towns showed a decline in cycle activity (between -2% and -5% per year);
• A different set of three towns showed an increase in cycle activity as measured by parked bikes (between +8% and +32%), while one town (Lancaster with Morecambe) showed a decline (-9%)22;
• All six towns showed an increase in the proportion of adults doing any cycling in a typical week, ranging from +6% to +29%, between 2006 and 2009, according to the ICM survey;
• Five towns showed a decrease in the proportion of adults who were inactive, ranging from -8% to -13%, while one town (Brighton) showed no change (ICM survey);
21 The figure for Morecambe includes data from automatic counts on Morecambe Promenade.22 Brighton and Hove: 29 locations, +8% change between 2007 and 2009; Derby: 11 sites, +32% change between 2006 and 2007; Lancaster with Morecambe: 29 sites, -9% change between 2006 and 2009.
6. Summary of results for each town

22Sloman L, Cavill N, Cope A, Muller L and Kennedy A (2009) Analysis and synthesis of evidence on the effects of investment in six Cycling Demonstration Towns
• Five towns showed an increase in the proportion of children for whom cycling was the usual mode of travel to school, for all schools, over a one year period from 2006/07 to 2007/08, ranging from +7% to +50%, while one town (Lancaster with Morecambe) showed a small decrease (-10%) (PLASC);
• All five of the towns for which data are available (excluding Darlington) showed an increase in the proportion of children surveyed cycling at least once a week to those schools which had received a comprehensive package of support to encourage cycling (a Bike It officer plus cycle parking, training etc). This ranged from +57% to +234%;
• All five of the towns for which data are available (excluding Darlington) showed an increase in cycling mode share amongst children surveyed in schools which had received a comprehensive package of support to encourage cycling. This ranged from +91% to +386%;
• In Darlington, cycling mode share for travel to school increased by 408% (from 1.2% to 6.1%) between 2004/05 and 2008/09;
• Data on workplace travel in Exeter, and household travel surveys in Darlington and Lancaster with Morecambe, also point towards increases in cycling levels.
The growth in cycling in the six towns, as shown by automatic cycle count data, may also be examined year-on-year. This is shown in Figure 12. While most of the towns show a progressive increase in cycling, it is worth noting that this is not the case in Derby or Aylesbury. In Derby, growth did not get under way until slightly later than in the other towns (although once it began, the rate of increase appears similar). The pattern for Aylesbury is of growth followed by a decline in 2009. It is hypothesised that this is due to counts being suppressed during works to build a cycle bridge in 2008 and 2009 and the associated disruption (so that the figure for 2008 may be a fairer representation of the increase in cycling levels than the 2009 figure).
Figure 12: Change in cycling levels over time in each town, relative to 2005 baseline (automatic cycle count data)
Sloman L, Cavill N, Cope A, Muller L and Kennedy A (2009) Analysis and synthesis of evidence on the effects of investment in six Cycling Demonstration Towns
22
a comprehensive package of support to encourage cycling. This ranged from +91% to +386%;
• in Darlington, cycling mode share for travel to school increased by 408% (from 1.2% to
6.1%) between 2004/05 and 2008/09; • data on workplace travel in Exeter, and household travel surveys in Darlington and
Lancaster with Morecambe, also point towards increases in cycling levels. The growth in cycling in the six towns, as shown by automatic cycle count data, may also be examined year-on-year. This is shown in Figure 12. While most of the towns show a progressive increase in cycling, it is worth noting that this is not the case in Derby or Aylesbury. In Derby, growth did not get under way until slightly later than in the other towns (although once it began, the rate of increase appears similar). The pattern for Aylesbury is of growth followed by a decline in 2009. It is hypothesised that this is due to counts being suppressed during works to build a cycle bridge in 2008 and 2009 and the associated disruption (so that the figure for 2008 may be a fairer representation of the increase in cycling levels than the 2009 figure).
Figure 12: Change in cycling levels over time in each town, relative to 2005 baseline(automatic cycle count data)
80
90
100
110
120
130
140
150
160
2005 2006 2007 2008 2009
DarlingtonExeterBrighton and HoveLancaster w MorecambeDerbyAylesburyAll
In addition, we have some limited data on cycling casualties in four of the towns, extracted from STATS1923
23 STATS19 is the national system of collection of police information on road crashes involving human injury. Data were requested from all towns, but it was only possible to obtain figures from four.
. This is relevant because there is a potential concern that increasing levels

23Sloman L, Cavill N, Cope A, Muller L and Kennedy A (2009) Analysis and synthesis of evidence on the effects of investment in six Cycling Demonstration Towns
In addition, we have some limited data on cycling casualties in four of the towns, extracted from STATS1923. This is relevant because there is a potential concern that increasing levels of cycling may have resulted in more deaths and injuries. Table 4 summarises the total number of incidents involving injury in each town for the three-year periods 2003-2005 and 2006-2008. The totals for 2003-2005 and 2006-2008 were compared and assessed for any significant change24. This indicated that the changes in the number of cycling incidents were not statistically significant in three of the towns (Aylesbury, Darlington and Derby). There was a statistically significant reduction in cycling incidents in one town (Lancaster).
23 STATS19 is the national system of collection of police information on road crashes involving human injury. Data were requested from all towns, but it was only possible to obtain figures from four.24 Assessed using the Chi square test. Readers are referred to Cope A, Muller L, Kennedy A, Parkin J and Page M (forthcoming) Cycling Demonstration Towns: Monitoring project report 2006 to 2009 Report for Cycling England for details.
2003-2005 2006-2008Aylesbury 49 56Darlington 87 96Derby 282 306Lancaster 173 129
Source: STATS19
Table 4: Personal injury incidents: totals for 2003-2005 and 2006-2008

24Sloman L, Cavill N, Cope A, Muller L and Kennedy A (2009) Analysis and synthesis of evidence on the effects of investment in six Cycling Demonstration Towns
A full appraisal of the benefits of the additional cycling observed in the Cycling Demonstration Towns would entail calculation of a wide range of benefits, including:
• mortality;
• morbidity;
• absenteeism;
• air quality;
• congestion;
• journey ambience.
Data from the monitoring and evaluation programme does not currently allow us to estimate many of these benefits, especially as we have little indication of the proportion of journeys made by bike that might previously have been made by car. However, a full economic appraisal of the changes in the Cycling Demonstration Towns will be conducted by DfT in late 2009, using WebTag. In advance of this, we focussed on estimating the value of the reduction in adult mortality, using the WHO’s HEAT tool, for the following reasons:
• the data are available from the ICM survey;
• adult mortality accounts for a large proportion of the likely benefits in previous WebTag- based assessments of pro-cycling interventions;
• impact on mortality can be assessed using fewer assumptions than many of the other impacts;
• the HEAT tool has been reviewed thoroughly, has the endorsement of the World Health Organization, and is used as part of WebTag.
This approach therefore provides only a partial assessment of the impacts of the programme, but it should nevertheless be a useful indication of likely benefit in advance of the full WebTag appraisal25.
The HEAT tool was modified to allow us to enter the number of new cyclists, and time spent cycling, as input values (based on data
25 For full explanation see Cavill N, Cope A and Kennedy A (forthcoming) Valuing increased cycling in the Cycling Demonstration Towns Report for Cycling England.
from the ICM survey). This gave a more accurate representation than relying on standard assumptions. A number of assumptions were made, and in all cases these tended towards conservative values.
The HEAT analysis found a maximum annual benefit (once the maximum health benefit had been reached after an estimated five years) of £8.9 million per annum. Taking into account the build up of health benefits in the HEAT tool, the present value of the mean annual benefit of this additional level of cycling is in the region of £4.5 million per year. Over ten years, assuming the new cyclists remained cycling at the current level, this would result in a saving of £45 million.
The CDT programme cost £2.8 million per year of direct Cycling England / Department for Transport grant, matched by funding from the local authorities which averaged £3.4 million per year, for three years. This is a total of £18.7 million, which equates to a net present value of £17.45 million at the start of the project.
Thus, for each £1 invested, the value of decreased mortality is £2.59. This figure is for decreased mortality only. Including other benefits would be likely to increase the ratio considerably.
This calculation is based on a number of assumptions:
• All respondents in the town who have taken up cycling since 2006 are experiencing health benefits, in proportion to the time they spend cycling. This can be justified as the Copenhagen Heart Study26 (on which the HEAT is based) found a relative risk of death among regular cyclists of 0.72 compared to non-cyclists controlled for other types of physical activity. This means that the study found that it was the level of cycling alone that reduced the risk of death. In addition, the data from the EPIC questions in the ICM survey found a significant reduction in the proportion of people
26 Andersen L et al. (2000) All-cause mortality associated with physical activity during leisure time, work, sports, and cycling to work Arch. Intern. Med. 160 (11) pp1621-1628.
7. Estimation of value for money
25Sloman L, Cavill N, Cope A, Muller L and Kennedy A (2009) Analysis and synthesis of evidence on the effects of investment in six Cycling Demonstration Towns
in the towns classed as sedentary between 2006 and 2009 (implying that at least some of the new cyclists were previously sedentary).
• All the increase in cycling observed in the Cycling Demonstration Towns can be attributed to the CDT programme. This contrasts with the WHO approach which assumes that 50% of new users of infrastructure are cycling directly as a result of the infrastructure. However, our approach is different in that we are attempting to value all the new cyclists observed in the Cycling Demonstration Towns, so there is no need to reduce this by half. This is supported by the analysis of data from Sport England’s Active People Survey, which showed that cycling levels increased in the Cycling Demonstration Towns but there was not a corresponding increase in local authorities without Cycling Demonstration Towns.
• People who took up cycling between 2006 and 2009 did so at a similar level to the mean value for people who cycled in the week before the survey: 20 minutes, three times a week.
• Cycling levels did not rise immediately but took three years to reach the level measured in 2009. Health benefits do not occur immediately but take five years to reach the maximum level. People who have taken up cycling will continue cycling at the present rate for the remainder of the 10 years. Benefits (and costs) are averaged over 10 years and discounted at 3.5%.
• The death rate used in the HEAT is the crude death rate for 200727 for people aged 16-64. This is applied to population figures for people aged 16+. The death rate for 16+ is not used as it would inflate the figures, and the prevalence of cycling among people aged 65+ is low.
27 http://www.nchod.nhs.uk/
The limitations of the approach used are:
• No value is calculated for those people who cycled in 2006 and may have increased (or decreased) their cycling in 2009 i.e. value is only ascribed to new cyclists.
• No value is attached to any health benefits gained by children and young people. This is important in some Cycling Demonstration Towns, such as Derby, where a large part of the CDT programme was aimed at young people.
• No value is attributed to other improvements to health; reduced absenteeism; reduced congestion; improved air quality; improved journey ambience; journey time; or any other benefits.
Thus, we have tried to be as conservative as possible in order to produce realistic figures and provide an authoritative assessment of the emerging value of the CDT programme. The resulting BCR is positive, and is in the range that justifies fully the level of public expenditure on the programme.

26Sloman L, Cavill N, Cope A, Muller L and Kennedy A (2009) Analysis and synthesis of evidence on the effects of investment in six Cycling Demonstration Towns
Taken together, the automatic and manual cycle count data, results from the Active People Survey, results from the Cycling England ICM cycling and physical activity survey, data on travel to school, and other data reported here appear to show a consistent picture of an increase in cycling for the Cycling Demonstration Town programme as a whole, and for the towns individually, as summarised in Table 1 and Annex 1.
The potential benefits to health arising from the increase in the prevalence of cycling amongst adults do not appear to have been offset by a reduction in other forms of physical activity. Encouragingly, greatest levels of change in physical activity levels appear to have occurred amongst middle and older age groups, who are the most likely to derive health benefits from physical activity.
Meanwhile, comparator data suggests that the increase in cycling in the Cycling Demonstration Towns is unlikely to be simply a reflection of some wider national trend.
From the information we have, it is not possible to draw conclusions about which interventions, in which towns, were more successful, and which ones were less successful. Thus we emphatically cannot say ‘Town X was more successful than Town Y because its programme focussed on schools / workplaces / infrastructure / smart measures etc.’
What we are able to conclude is that a sustained and well-designed programme of investment in cycling at about the level of £10 per head of population was sufficient, in every one of the Cycling Demonstration Towns, to achieve an increase in cycling.
It is worth emphasising that this is in some ways a surprising conclusion. It is commonly supposed that past failure to increase cycling levels is proof that it is not possible to increase cycling in Britain. In fact, the Cycling Demonstration Towns have demonstrated, in every case, that it is possible to increase cycling, even in towns which almost completely lack a ‘cycling culture’. Several of the
towns might have been considered challenging places to encourage cycling because they are hilly. High car ownership levels in Aylesbury might similarly have been thought likely to make it difficult to increase cycling28. But neither of these disadvantages seems to have prevented these towns from increasing cycling levels.
The figures reported here are interim results, and further results will be reported during the current (second) phase of investment in the six Cycling Demonstration Towns.
Nevertheless, the evidence we have already firmly suggests that a determination to increase cycling levels, coupled with a carefully considered strategy and modest investment, may be expected to increase cycling levels by between 10% and 50% within a short period of just a few years, in towns that start with ‘typical’ (relatively low) initial cycling levels.
At the programme level, the analysis carried out to date suggests that the investment in the Cycling Demonstration Towns provided good value for money. For each £1 invested, the value of decreased mortality is £2.59. The overall benefit-cost ratio is likely to be greater than this when a full WebTAG appraisal is completed. However, the decreased mortality benefits alone put the CDT programme in the ‘high’ category in terms of value for money.
The programmes carried out between 2005 and 2008 in the six Cycling Demonstration Towns can in no way be considered to have transformed conditions for cycling to the point where they are as good as in the most ‘cycle friendly’ European towns and cities. There is a great deal more work still to do. But the evidence from the results of the first three years suggests that a start has been made – in brief, that the six towns have achieved ‘lift-off’ for cycling.
28 Proportion of households with two or more cars available = 47% in Aylesbury Vale, as compared to between 20% and 26% in all other district / unitary authorities covered by the Cycling Demonstration Towns, from 2001 Census.
8. Conclusion

Annex 1: Changes in cycling and physical activity for individual Cycling Demonstration Towns

28Sloman L, Cavill N, Cope A, Muller L and Kennedy A (2009) Analysis and synthesis of evidence on the effects of investment in six Cycling Demonstration Towns
Data source Data that is included Change Positive/ negative trend
WHOLE TOWN ACTIVITYAutomatic cycle counts
Figures relative to 2005 baseline +2.4%~/ +11%$ relative to baseline (see note below #)
Positive
Manual counts Quarterly counts on cordon around town centre, starting in Q3 2006: estimated annual rate of change
-4% per year Negative
Counts of parked bikes
Annual counts of parked bikes at railway station (carried out in June, 2003 to 2009; reported relative to 2005 baseline; total spaces available =96)
+25% (from 51 to 64)
Positive
ADULT POPULATIONICM Survey for Cycling England
Surveys in 2006 and 2009: proportion of adult residents doing any cycling in a typical week in the previous year
+10% or +2.6%-points (from 26.8% to 29.3%)
Positive
ICM Survey for Cycling England
Surveys in 2006 and 2009: proportion of residents classed as ‘inactive’ (taking account of cycling activity, other physical exercise and activity at work)
-8% or -1.6%-points (from 21.1% to 19.5%)
Positive*
CHILD POPULATION (<16)School Census (PLASC) data
Annual pupil-level survey, all schools, pooled data for 2006/07 and 2007/08 academic years: proportion of pupils for which cycling is the usual mode of travel to school
+7% or +0.1%-points (from 1.5% to 1.6%)
Positive
‘Hands up’ surveys of Bike It schools
Surveys of Bike It schools, pooled data from ‘baseline’ surveys (in September 2006/2007) and ‘ex-post’ surveys (in July 2007/2008): proportion of pupils cycling to school either ‘every day’ or ‘once or twice a week’
+234% or +20.4%-points (from 8.7% to 29.1%)
Positive
‘Hands up’ surveys of Bike It schools
Surveys of Bike It schools, pooled data, change in cycling mode share between ‘baseline’ surveys (in September 2006/2007) and ‘ex-post’ surveys (in July 2007/2008): proportion of pupils for which cycling is the mode of travel to school on day of survey
+266% or +8.5%-points (from 3.2% to 11.7%)
Positive
Table A.1: Changes in cycling and physical activity in Aylesbury
# Lower figure is for period to March 2009; higher figure excludes data from December 2008 to March 2009, as figures distorted by closure of key cycle path during works to build cycle bridge.
* In this and subsequent tables, a ‘positive’ trend is one towards higher levels of cycling and/or physical activity. Hence, a reduction in the proportion of residents classed as ‘inactive’ is classed as ‘positive’.
~ Not significant (p = 0.055) $ Significant (p=<0.001).

29Sloman L, Cavill N, Cope A, Muller L and Kennedy A (2009) Analysis and synthesis of evidence on the effects of investment in six Cycling Demonstration Towns
Data source Data that is included Change Positive/ negative trend
WHOLE TOWN ACTIVITYAutomatic cycle counts
Figures relative to 2006 baseline +27%+ relative to baseline
Positive
Manual counts Quarterly counts on cordon around town centre, starting in Q3 2006 estimated annual rate of change
+6% per year Positive
Counts of parked bikes
Annual counts of parked bikes at 29 locations (carried out in January, 2007 to 2009)
+8% (from 1559 to 1690)
Positive
ADULT POPULATIONICM Survey for Cycling England
Surveys in 2006 and 2009: proportion of adult residents doing any cycling in a typical week in the previous year
+7% or +1.7%-points (from 24.7% to 26.4%)
Positive
ICM Survey for Cycling England
Surveys in 2006 and 2009: proportion of residents classed as ‘inactive’ (taking account of cycling activity, other physical exercise and activity at work)
0% or -0.1%-points (from 24.7% to 24.8%)
No change
CHILD POPULATION (<16)School Census (PLASC) data
Annual pupil-level survey, all schools, pooled data for 2006/07 and 2007/08 academic years: proportion of pupils for which cycling is the usual mode of travel to school
+20% or +0.3%-points (from 1.5% to 1.8%)
Positive
‘Hands up’ surveys of Bike It schools
Surveys of Bike It schools, pooled data from ‘baseline’ surveys (in September 2006/2007) and ‘ex-post’ surveys (in July 2007/2008): proportion of pupils cycling to school either ‘every day’ or ‘once or twice a week’
+153% or +15%-points (from 9.8% to 24.8%)
Positive
‘Hands up’ surveys of Bike It schools
Surveys of Bike It schools, pooled data, change in cycling mode share between ‘baseline’ surveys (in September 2006/2007) and ‘ex-post’ surveys (in July 2007/2008): proportion of pupils for which cycling is the mode of travel to school on day of survey
+386% or +8.5%-points (from 2.2% to 10.7%)
Positive
Table A.2: Changes in cycling and physical activity in Brighton
+ Significant (p=<0.001).

30Sloman L, Cavill N, Cope A, Muller L and Kennedy A (2009) Analysis and synthesis of evidence on the effects of investment in six Cycling Demonstration Towns
Data source Data that is included Change Positive/ negative trend
WHOLE TOWN ACTIVITYAutomatic cycle counts
Figures relative to 2005 baseline +57%+ relative to baseline
Positive
Manual counts Quarterly counts on cordon around town centre, starting in Q2 2006: estimated annual rate of change
+13% per year Positive
Socialdata household travel survey
Household surveys in 2004 and 2008: cycling trips per person per year
+120% (from 15 to 33)
Positive
ADULT POPULATIONICM Survey for Cycling England
Surveys in 2006 and 2009: proportion of adult residents doing any cycling in a typical week in the previous year
+6% or +1.2%-points (from 21.3% to 22.5%)
Positive
ICM Survey for Cycling England
Surveys in 2006 and 2009: proportion of residents classed as ‘inactive’ (taking account of cycling activity, other physical exercise and activity at work)
-13% or -3.9%-points (from 30.8% to 26.9%)
Positive
CHILD POPULATION (<16)School Census (PLASC) data
Annual pupil-level survey, all schools, pooled data for 2006/07 and 2007/08 academic year: proportion of pupils for which cycling is the usual mode of travel to school
+12% or +0.3%-points (from 2.6% to 2.9%)
Positive
‘Hands up’ surveys of schools
Surveys of schools, pooled data, change in cycling mode share in 2008/09 (when surveys covered 11,548 pupils or 95% of school population) compared to 2004/05 (when surveys covered 6,304 pupils): proportion of pupils for which cycling is the mode of travel to school on day of survey
+408% or +4.9%-points (from 1.2% to 6.1%)
Positive
Table A.3: Changes in cycling and physical activity in Darlington
+ Significant (p=<0.001).

31Sloman L, Cavill N, Cope A, Muller L and Kennedy A (2009) Analysis and synthesis of evidence on the effects of investment in six Cycling Demonstration Towns
Data source Data that is included Change Positive/ negative trend
WHOLE TOWN ACTIVITYAutomatic cycle counts
Figures relative to 2005 baseline +10%+
relative to baselinePositive
Manual counts Quarterly counts at seven locations, starting in Q4 2006: estimated annual rate of change
+12% per year Positive
Counts of parked bikes
Annual counts of parked bikes at 8 locations in 2006 and 2007
+32% (from 84 to 111)
Positive
ADULT POPULATIONICM Survey for Cycling England
Surveys in 2006 and 2009: proportion of adult residents doing any cycling in a typical week in the previous year
+29% or +5.6%-points (from 19.5% to 25.1%)
Positive
ICM Survey for Cycling England
Surveys in 2006 and 2009: proportion of residents classed as ‘inactive’ (taking account of cycling activity, other physical exercise and activity at work)
-11% or -3.3%-points (from 29.9% to 26.6%)
Positive
CHILD POPULATION (<16)School Census (PLASC) data
Annual pupil-level survey, all schools, pooled data for 2006/07 and 2007/08 academic years: proportion of pupils for which cycling is the usual mode of travel to school
+50% or +0.8%-points (from 1.6% to 2.4%)
Positive
‘Hands up’ surveys of Bike It schools
Surveys of Bike It schools, pooled data from ‘baseline’ surveys (in September 2006/2007) and ‘ex-post’ surveys (in July 2007/2008): proportion of pupils cycling to school either ‘every day’ or ‘once or twice a week’
+167% or +24.5%-points (from 14.7% to 39.2%)
Positive
‘Hands up’ surveys of Bike It schools
Surveys of Bike It schools, pooled data, change in cycling mode share between ‘baseline’ surveys (in September 2006/2007) and ‘ex-post’ surveys (in July 2007/2008): proportion of pupils for which cycling is the mode of travel to school on day of survey
+260% or +14.3%-points (from 5.5% to 19.8%)
Positive
Table A.4: Changes in cycling and physical activity in Derby
+ Significant (p=<0.001).

32Sloman L, Cavill N, Cope A, Muller L and Kennedy A (2009) Analysis and synthesis of evidence on the effects of investment in six Cycling Demonstration Towns
Data source Data that is included Change Positive/ negative trend
WHOLE TOWN ACTIVITYAutomatic cycle counts
Figures relative to 2005 baseline +40%+ relative to baseline
Positive
Manual counts Quarterly counts at six locations around city centre, starting in Q4 2006, and at six locations on River Exe screenline, starting in Q3 2006: estimated annual rate of change
-2% (city centre) and -5% (screenline) per year
Negative
ADULT POPULATIONICM Survey for Cycling England
Surveys in 2006 and 2009: proportion of adult residents doing any cycling in a typical week in the previous year
+21% or +5.6%-points (from 27.3% to 32.9%)
Positive
ICM Survey for Cycling England
Surveys in 2006 and 2009: proportion of residents classed as ‘inactive’ (taking account of cycling activity, other physical exercise and activity at work)
-10% or -2.2%-points (from 22.8% to 20.6%)
Positive
Workplace travel survey
Annual surveys since 2006, covering over 200 businesses; ~6,400 responses in 2006 and 2008: proportion of respondents for which cycling is the usual mode of travel to work
+5% or +0.4%-point (from 8.5% to 8.9%)
Positive
CHILD POPULATION (<16)School Census (PLASC) data
Annual pupil-level survey, all schools, pooled data for 2006/07 and 2007/08 academic years: proportion of pupils for which cycling is the usual mode of travel to school
+19% or +0.5%-points (from 2.7% to 3.2%)
Positive
‘Hands up’ surveys of Bike It schools
Surveys of Bike It schools, pooled data from ‘baseline’ surveys (in September 2006/2007) and ‘ex-post’ surveys (in July 2007/2008): proportion of pupils cycling to school either ‘every day’ or ‘once or twice a week’
+57% or +7.8%-points (from 13.8% to 21.6%)
Positive
‘Hands up’ surveys of Bike It schools
Surveys of Bike It schools, pooled data, change in cycling mode share between ‘baseline’ surveys (in September 2006/2007) and ‘ex-post’ surveys (in July 2007/2008): proportion of pupils for which cycling is the mode of travel to school on day of survey
+91% or +5.2%-points (from 5.7% to 10.9%)
Positive
Table A.5: Changes in cycling and physical activity in Exeter
+ Significant (p=<0.001).
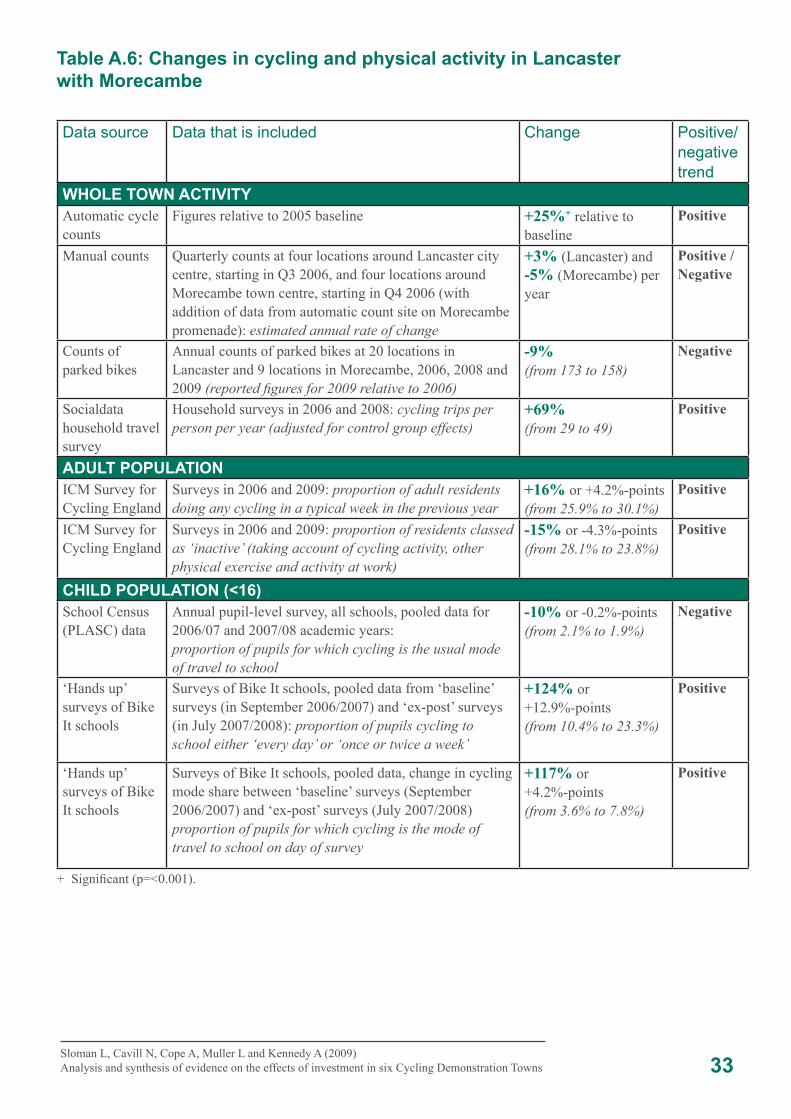
33Sloman L, Cavill N, Cope A, Muller L and Kennedy A (2009) Analysis and synthesis of evidence on the effects of investment in six Cycling Demonstration Towns
Data source Data that is included Change Positive/ negative trend
WHOLE TOWN ACTIVITYAutomatic cycle counts
Figures relative to 2005 baseline +25%+ relative to baseline
Positive
Manual counts Quarterly counts at four locations around Lancaster city centre, starting in Q3 2006, and four locations around Morecambe town centre, starting in Q4 2006 (with addition of data from automatic count site on Morecambe promenade): estimated annual rate of change
+3% (Lancaster) and -5% (Morecambe) per year
Positive /Negative
Counts of parked bikes
Annual counts of parked bikes at 20 locations in Lancaster and 9 locations in Morecambe, 2006, 2008 and 2009 (reported figures for 2009 relative to 2006)
-9% (from 173 to 158)
Negative
Socialdata household travel survey
Household surveys in 2006 and 2008: cycling trips per person per year (adjusted for control group effects)
+69%(from 29 to 49)
Positive
ADULT POPULATIONICM Survey for Cycling England
Surveys in 2006 and 2009: proportion of adult residents doing any cycling in a typical week in the previous year
+16% or +4.2%-points (from 25.9% to 30.1%)
Positive
ICM Survey for Cycling England
Surveys in 2006 and 2009: proportion of residents classed as ‘inactive’ (taking account of cycling activity, other physical exercise and activity at work)
-15% or -4.3%-points (from 28.1% to 23.8%)
Positive
CHILD POPULATION (<16)School Census (PLASC) data
Annual pupil-level survey, all schools, pooled data for 2006/07 and 2007/08 academic years: proportion of pupils for which cycling is the usual mode of travel to school
-10% or -0.2%-points (from 2.1% to 1.9%)
Negative
‘Hands up’ surveys of Bike It schools
Surveys of Bike It schools, pooled data from ‘baseline’ surveys (in September 2006/2007) and ‘ex-post’ surveys (in July 2007/2008): proportion of pupils cycling to school either ‘every day’ or ‘once or twice a week’
+124% or +12.9%-points (from 10.4% to 23.3%)
Positive
‘Hands up’ surveys of Bike It schools
Surveys of Bike It schools, pooled data, change in cycling mode share between ‘baseline’ surveys (September 2006/2007) and ‘ex-post’ surveys (July 2007/2008) proportion of pupils for which cycling is the mode of travel to school on day of survey
+117% or +4.2%-points (from 3.6% to 7.8%)
Positive
Table A.6: Changes in cycling and physical activity in Lancaster with Morecambe
+ Significant (p=<0.001).