cyclic loading, seismic resistance, ductility, reinforced ... · beam-column joint sub-assemblages...
TRANSCRIPT

Draft
INFLUENCE OF GEOMETRIC AND MATERIAL
CHARACTERISTICS ON THE BEHAVIOR OF REINFORCED-
CONCRETE BEAM-COLUMN CONNECTIONS
Journal: Canadian Journal of Civil Engineering
Manuscript ID cjce-2016-0247.R2
Manuscript Type: Article
Date Submitted by the Author: 25-Jan-2017
Complete List of Authors: VANDANA, R; COLLEGE OF ENGINEERING, DEPARTMENT OF CIVIL
ENGINEERING Bindhu, K.R; College of Engineering,Trivandrum
Keyword: Cyclic loading, Seismic resistance, Ductility, Reinforced concrete moment resisting frames, Beam column connection
https://mc06.manuscriptcentral.com/cjce-pubs
Canadian Journal of Civil Engineering
Draft
1
INFLUENCE OF GEOMETRIC AND MATERIAL CHARACTERISTICS ON THE BEHAVIOR OF
REINFORCED-CONCRETE BEAM-COLUMN CONNECTIONS
VANDANA R. K.1,
*, BINDHU K. R.2
1Research Scholar, Department of Civil Engineering, College of Engineering, Trivandrum, India
2Associate Professor, Department of Civil Engineering, College of Engineering, Trivandrum, India
*Department of Civil Engineering, College of Engineering, Trivandrum 695 016, India
Tel: (+91) 940 060 6576; email: [email protected]; [email protected]
Page 1 of 32
https://mc06.manuscriptcentral.com/cjce-pubs
Canadian Journal of Civil Engineering

Draft
2
ABSTRACT
The design of reinforced-concrete moment-resisting frames and hence beam-column connections is of
great importance in earthquake-prone areas. Beam-column joints, which should be sufficiently strong to resist
and sustain lateral loads, are designed on the basis of the strong-column weak-beam concept so that they undergo
ductile failure. The present study describes the cyclic loading performance of six interior beam-column
connection specimens designed to be seismic-resistant with varying aspect ratios, concrete compressive
strengths, and beam bar yield strengths. Results indicate that joint ductility and energy dissipation capacity can
be enhanced by maintaining a unit aspect ratio. Moreover, joint shear strength can be improved significantly by
increasing concrete compressive strength. Beam bar yield strength is observed to influence joint ductility
considerably.
Key words: cyclic loading, seismic analysis, beam-column connection, ductility, reinforced-concrete structures.
Page 2 of 32
https://mc06.manuscriptcentral.com/cjce-pubs
Canadian Journal of Civil Engineering
Draft
3
1. INTRODUCTION
Special moment-resisting frames are predominant in regions susceptible to moderate to high seismicity. Post-
earthquake investigations have indicated that beam-column connection failure in seismically detailed frames is
caused by shear strength degradation and insufficient energy dissipation capacity, leading to brittle shear failure
of the joints and ultimately resulting in structural collapse. Of particular concern is the inadequate strength,
ductility, and energy dissipation capacity of these structures for meeting the demands of seismically induced
lateral loads.
Beam-column joints have become a focus of attention since 1967, when Hansen and Conner (1967)
conducted the first seismic loading test on them. Beam-column joint sub-assemblages play a crucial role in the
design of moment-resisting frames as they are the weakest links in the structure. Joints with sufficient shear
strength dissipate energy safely without causing any serious structural damage. Such joints fail by developing a
ductile beam hinge mechanism. Relevant earthquake-resistant design codes promote joint ductility by
incorporating the strong-column weak-beam mechanism. This is expected to ensure the development of plastic
hinges in beams at the beam-column interface while all vertical members, including walls and columns, remain
elastic in order to provide maximum energy dissipation during an earthquake (Paulay and Priestley 1992; Penelis
and Kappos 2010). Although earthquake-resistant structural design codes specify ductile detailing of beam-
column connections to ensure this behavior, many cases of joint shear failure have been reported globally.
Therefore, parameters influencing joint shear behavior clearly require further evaluation.
Joints fail under seismic loading in three possible ways. In the first category, shear failure occurs in
joints without affecting the strength of beams framing the columns. This type of failure is brittle and sudden; it
must be avoided at any cost. In the second category, beams yield and fail without affecting column or joint
safety. This perfect ductile failure is preferred in moment-resisting frames under seismic loading. In the third
category, joint failure occurs as a combination of beam yielding followed by joint shear failure. Studies
conducted by Goto and Joh (1996), Shiohara and Kusuhara (2009), and Xing et al. (2013) support widely
reported cases of joint failures.
A seminal shear transfer mechanism study by Paulay et al. (1978) found that shear force resistance in a
joint core arises from two postulated mechanisms: the strut and truss mechanisms. In the strut mechanism, joint
shear is transferred via a diagonal concrete strut that sustains only compression. The truss mechanism considers
Page 3 of 32
https://mc06.manuscriptcentral.com/cjce-pubs
Canadian Journal of Civil Engineering

Draft
4
the shear resistance contribution of vertical and horizontal reinforcement inside the joint core. The two
mechanisms are superimposed to resist the total joint shear force in the horizontal and vertical directions.
Leon (1989; 1990) reported that beam bar anchorage length considerably affects joint energy
dissipation capacity. An anchorage length of 28 times the bar diameter was necessary to ensure a weak-girder
strong-column mechanism through a severe load history. Studies on the effect of column axial loads on the
general behavior of joints have produced contradictory results. Some studies have shown that while increased
axial loads are favorable to the energy dissipation capacity of joints with small shear, it results in unfavorable
effects such as crushing of concrete in joints with high shear (Pantazopoulou and Bonacci 1992; Fu et al. 2000).
In a study conducted by Bakir and Boduroglu (2006), the column axial load was reported to be one of the most
influential factors on the bond performance of joints.
The study conducted by Pantazopoulou and Bonacci (1994) explored the mechanics of beam-column
joints under lateral loads with the aim of assessing the parametric dependence of joint behavior for the benefit of
design. The study considered published experimental information from around the world and results from a
number of analytical studies collectively, and a finite element model was developed that reproduced joint
behavior in agreement with the above results. It was reported that joint hoops serve to confine joint cores while
simultaneously participating in the shear-resisting mechanism of the joint panel. It was also observed that
participation of the joint core concrete in the mechanism of shear resistance decreases as the number of joint
hoops is increased.
Kitayama et al. (2004) highlighted a joint shear transfer mechanism change caused by bond
deterioration along the beam reinforcement. It was observed that the ratio of the column width to the beam bar
diameter must be limited as a function of the beam bar strength and concrete strength.
Scaling-related effects have raised concerns over the reliability of testing on reduced-scale model
structures. It is recommended that the minimum usable scale factor for testing isolated RC components should be
one quarter (Abrams 1987; Lu et al. 1999). Investigations conducted by Abrams (1987) focused exclusively on
scale relations for RC beam column joints. The study summarized tests of small-, medium-, and large-scale
joints. It was reported that, although there were quantitative differences in behavior for specimens of different
scales, the same resistance mechanisms were observed for all specimens. Even at one-twelfth scale, the physical
models reflected hysteretic characteristics more similarly than most numerical models used in research and in
practice. Since force-deflection behavior was simulated well using specimens constructed at one-quarter or
larger scales, the study recommended that the minimum usable scale factor for testing isolated reinforced
Page 4 of 32
https://mc06.manuscriptcentral.com/cjce-pubs
Canadian Journal of Civil Engineering
Draft
5
concrete components in flexure be one quarter. This conclusion was supported in another study conducted by Lu
et al. (1999) in which the effect of using reinforced concrete scale columns under cyclic action was investigated.
The test column specimens were constructed on three scales: 1:2, 1:3, and 1:5.5. All the specimens were reported
to behave in a similar manner independent of their scale. In the present study, the specimens were constructed at
one-third scale, making them more resistant to scaling-related effects.
The primary obstacle in evaluating joint shear strength is the lack of basic data for appraising
the contributions of various factors. It has been reported that concrete compressive strength, transverse
reinforcement, and presence of transverse beams or slabs contribute significantly toward improving joint shear
strength (Meinheit and Jirsa 1977; Bonacci and Pantazopoulou 1993; Kim and La Fave 2008). The study by
Bonacci and Pantazopoulou (1993) reported that transverse beams confine joints by means of their longitudinal
reinforcement, which are anchored inside the joints in the transverse direction, as well as by effectively
increasing the volume of joint concrete that actively participates in the joint’s shear-resisting mechanism.
Studies by Durrani and Wight (1985), Alva et al. (2007), and Kim (2008) found that high concrete
strength reduces joint stiffness degradation under lateral loading and is the most significant parameter
influencing joint shear strength. However, Meinheit and Jirsa (1977) also showed that joint shear strength
degradation occurs regardless of concrete strength.
In contrast, Shiohara (2004) reported that concrete compressive strength is not proportional to joint
shear strength. Concrete strength has been widely reported to increase shear strength because of the influence of
the bond capacity of longitudinal reinforcement, which in turn is assumed to be proportional to the square root of
concrete compressive strength. Shiohara identified the following as major parameters influencing bond capacity:
the axial force level of the column due to the confining effect or transverse beams covering a joint, concrete
cover thickness, diameter and number of bars, reinforcement yielding, and cyclic loading.
Shiohara (2004) and Mitra and Lowes (2011) reported that aspect ratio, defined as the ratio of beam
depth to column depth, has significant influence on joint shear strength. Higher aspect ratios result in lower shear
strengths of interior and exterior beam-column joints. Shiohara stressed the need to consider aspect ratio as a
critical factor in future code revision.
Reviewing the above-mentioned studies from the viewpoint of interior beam-column joints subjected to
cyclic loading reveals several problems. There remain discrepancies in identifying variables that control the joint
shear behavior. Systematic variation of every parameter affecting shear strength is beyond the scope of any
realistic experimental study. However, selecting certain parameters and systematically varying them can provide
Page 5 of 32
https://mc06.manuscriptcentral.com/cjce-pubs
Canadian Journal of Civil Engineering

Draft
6
important insights into joint shear behavior. In the case of interior joints confined in both directions by
orthogonal beams, it was reported that the concrete compressive strength was significant only if the joint
developed a diagonal strut before failure. It was also reported that it was considerably easier to deteriorate the
bonds of longitudinal bars, thereby controlling the response (Pantazopoulou and Bonacci 1994). In interior joints
without transverse beams, these effects were not explicitly observed, making this an interesting observation to
explore further.
The effect of aspect ratio on joint shear strength has not yet been explored in detail. Shiohara’s (2004)
suggestion that aspect ratio influences joint shear strength requires experimental investigation, as predicting this
effect is critical compared to the other selected parameters. Various tests have provided contradictory views on
the effect of concrete compressive strength on joint shear behavior; however, its effect on the ductile behavior of
joints has not been investigated thoroughly. Few studies have examined beam bar yield strength effects on joint
shear behavior. Therefore, this influence on general joint seismic behavior must be assessed quantitatively.
Accordingly, the present experimental study is undertaken to investigate joint aspect ratio, concrete compressive
strength, and beam bar yield strength effects on the behavior of seismically detailed interior beam-column joints.
The present study is devoted to experimentally investigating the influence of various parameters on the
behavior of joints under cyclic lateral loading. In this study, interior beam-column joints are investigated through
test results with the intention of addressing conflicting views of the role of parameters, concrete compressive
strength, joint aspect ratio, and beam bar yield strength.
2. EXPERIMENTAL
As per IS 13920 (1993), six seismically detailed interior beam-column joint specimens with a height of
1.3 m and width of 1.5 m were cast and tested. The mix design was conducted as per IS 10262 (2009). Figure 1
shows the detailing pattern and dimensions of the specimens, which were classified into three groups according
to the variables. The same specimen X1 (control specimen) was included as a standard specimen in all the
groups to facilitate comparison with other specimens. It was cast using concrete grade M30 with an aspect ratio
of 1. High-yield-strength deformed (HYSD) bars with yield strengths of 500 MPa were used as longitudinal bars
in columns and beams. The aspect ratio was selected as the variable in group 1; subsequently, specimens X2 and
X3 were designed with aspect ratios of 0.67 and 1.33, respectively. The concrete grade and beam bar yield
strength of the specimens were M30 and 500 MPa, respectively. The group 2 specimens, i.e., X4 and X5, were
designed with variable compressive strengths of M25 and M35, respectively; these specimens had an aspect ratio
of unity and beam bar yield strength of 500 MPa. The beam bar yield strength was selected as the variable in
Page 6 of 32
https://mc06.manuscriptcentral.com/cjce-pubs
Canadian Journal of Civil Engineering

Draft
7
group 3. Thus, specimen X6 consisted of HYSD bars having yield strength of 415 MPa as the beam longitudinal
bars. The concrete grade and aspect ratio of specimen X6 were M30 and unity, respectively. Columns in all
specimens were reinforced with eight HYSD bars with diameters of 6 mm and yield strengths of 500 MPa
equally distributed along the two longer sides as shown in Fig. 1. The beams were provided with five bars with
diameters of 6 mm, i.e., three at the top and two at the bottom. Further, 6-mm hoops were used as transverse
reinforcements in both beams and columns. Specimen dimensions and reinforcement details are summarized in
Table 1.
2.1. Materials used
Ordinary Portland cement (53 grade), M-sand passing through a 4.75-mm IS sieve (fineness modulus,
2.5; specific gravity, 2.5), and crushed stone of maximum size 12 mm (specific gravity, 2.76) and size 6 mm
(specific gravity, 2.74) were used for this investigation. Electrical resistance strain gauges were fixed on the
beam longitudinal bars at the beam-column interface to measure the reinforcement strain during testing.
2.2 Test procedure and instrumentation
Specimens were tested upright in a steel loading frame (capacity, 200 t). An axial compressive load of
10 % of the axial capacity of the column was applied to the column by means of a hydraulic jack (capacity, 30 t).
The bottom of the column of the beam-column connection was pinned to a strong floor. Beam ends were
subjected to quasi-static cyclic loading performed in the displacement control mode. The test setup is shown in
Fig. 2. The beams in the beam-column connections were loaded up to a certain magnitude of displacement and
then unloaded in the opposite direction and reloaded in order to obtain a full cycle of reverse loading. Each
loading cycle was repeated twice; after each cycle, the displacement magnitude was increased. The process was
continued until the specimen reached its maximum capacity. Thereafter, loading was applied without repeating
the loading cycle until failure. Figure 3 shows the cyclic loading history. In each loading stage, deflections at the
beam tips were measured using two linear variable differential transformers (LVDTs) with a precision of 0.01
mm and gauge length of 200 mm. Beam reinforcement strain was measured using strain gauges installed in each
beam-column connection. Strain, deflection, and load cell readings were recorded using a data acquisition
system (National Instruments, DAQ SCXI series).
3. TEST BEHAVIOR
Specimens’ general behavior was identified on the basis of their hysteresis responses, visible crack
patterns, failure modes, stiffness behavior, and reinforcement strains.
3.1. Crack patterns
Page 7 of 32
https://mc06.manuscriptcentral.com/cjce-pubs
Canadian Journal of Civil Engineering

Draft
8
Observed crack patterns are shown in Fig. 4. In specimen X1, the first crack was observed at the beam-
column junction. As the rate of loading increased, initial cracks widened and additional cracks were formed in
the beam and joint panel. Specimen X1 exhibited a beam-joint failure mode, i.e., the specimen underwent beam
yielding followed by joint shear failure. In specimen X2, the first crack was observed in the beam at the beam-
column interface. As the loading rate increased, more cracks developed in the beam than in the joint region.
Cracks at the beam-column interface widened; finally, the specimen underwent beam failure rather quickly.
Cracks observed for specimens X3 and X4 were initially similar. Initial cracks developed in the joint panel in
both specimens. In X4, most cracks were spread across the joint region, with some in column members and a
few in beam members; a joint shear failure mode was observed. In X3, there were more cracks in the beam than
in the joint region. Cracks spread across the joint and beam regions, indicating shear stress distributions over
joint and frame members; finally, the specimen underwent joint shear failure. In specimens X5 and X6, the first
crack was observed in the beam-column interface. Further increased loading resulted not only in additional crack
development in beams and joint panels, but also in propagation of initial cracks. Cracks widened faster in X5
than in X6 as the rate of loading increased. Most cracks were observed in beam portions near the joint; no
column cracks were visible. Finally, the two specimens failed in the preferred ductile beam failure mode as a
result of beam flexural yielding.
3.2. Mode of failure
Specimen X1 was selected to compare the three specimen groups with varying parameters. In the first
group, where the aspect ratio was varied, three different failure modes were observed. The failure mode of
specimen X1 with a unit aspect ratio was a combination of beam flexural failure and joint shear failure (BJF).
The preferred case of beam flexural failure (BF) was observed in specimen X2 with an aspect ratio of 0.67.
Although the specimen exhibited beam failure, it was rapid. Specimen X3 with an aspect ratio of 1.33 underwent
joint shear failure (JF). In the second group of specimens (X1, X4, and X5), where concrete compressive
strength was varied, different failure modes were observed. Specimen X4, with the lowest compressive strength,
underwent joint shear failure, whereas specimen X5, with the highest compressive strength, underwent beam
flexural yielding. This proves the advantage of variable concrete strength in altering the failure mode from shear
failure to beam failure. In the third group of specimens (X1 and X6), where beam bar yield strength was varied,
two failure modes were observed. Specimen X6 failed in the beam failure mode, whereas specimen X1 failed in
the beam-joint failure mode.
3.3. Hysteresis behavior
Page 8 of 32
https://mc06.manuscriptcentral.com/cjce-pubs
Canadian Journal of Civil Engineering

Draft
9
Hysteresis responses of joint specimens were recorded throughout the loading cycle, as shown in Fig. 5(a)-
(f). The thick line at the center of the graph represents the initial cycles of loading until the specimens started to
yield. The wider loops were obtained after reaching the elastic stage and are shown in double lines for each
displacement increment. Each loading cycle was repeated twice; curves may be coincident or separated. Gaps
between curves signify sufficient strength after crack occurrence. A single loading cycle was applied when the
specimens reached the ultimate strength. Gaps between hysteretic curves, which were obtained after reaching the
ultimate load, were found to be wider, indicating strength degradation or specimen failure at higher displacement
loading. Hysteresis loop areas represent the energy dissipation capacity of each specimen. For clearer
comparison, Fig. 6 shows the hysteresis loop envelopes for all specimens plotted in a single graph.
Group 1 specimens The hysteresis loops of specimen X1 followed a gradual and steady reduction in
strength. The specimen carried the load gradually through deformation until failure, as indicated by the wider
gaps between the loops. The hysteretic curves indicate that, even after reaching its ultimate strength, the
specimen provided sufficient strength for the next loading cycle. Specimen X2 exhibited smaller loops despite
the BF failure mode. The closer loops indicate steady but rapid reduction in strength until failure. The beam
failure and rapid strength reduction indicate good specimen shear strength but poor ductility and low energy
dissipation capacity. This may be attributed to the aspect ratio’s influence on joint behavior. A lower value of the
aspect ratio (0.67 in X2) promoted a safe shear strength value, but failed to promote ductile beam behavior. As a
result, beam failure occurred at the beam-column interface with the joint panel remaining intact as if the beam
underwent shear failure. For specimen X3, the curves are not close together for each displacement over two
loading cycles, indicating joint shear failure under increasing load.
Group 2 specimens The hysteresis curves of specimen X4 were very similar to those of specimen X3. A
wider vertical gap between adjacent loops indicated faster reduction in strength with increasing load. The loops
indicated that, after reaching the ultimate load, the frame lost strength very rapidly. The hysteretic loops of
specimen X5 showed a steady and gradual increase in strength until attaining the ultimate load followed by a
gradual reduction in strength until failure. The ability of specimen X5 to carry the load through deformation was
evident from its hysteretic loops. The specimen exhibited good strength during loading even after exceeding the
ultimate load.
Group 3 specimens The curves of specimen X6 are similar to those of specimens X1 and X5 but with
wider gaps between loops. The ability of these specimens in carrying the load through deformation was most
evident. The strength exhibited by specimen X6 at failure was lower than that exhibited by specimen X1, but X6
Page 9 of 32
https://mc06.manuscriptcentral.com/cjce-pubs
Canadian Journal of Civil Engineering

Draft
10
sustained the load through a greater displacement than X1, indicating high ductility and energy dissipation
capacity.
The present study summarized tests of six one-third-scale joints. It may be concluded that quantitative
differences in behavior for full-size specimens can occur but resistance mechanisms remain the same. There may
be differences in the stiffness degradation and bond strength of joints owing to the difference in geometric
scales. However, these effects are not sufficiently significant to influence the failure mechanisms or shear
resistance of joints (Abrams 1987; Lu et al. 1999).
4. DISCUSSION OF TEST RESULTS
4.1. Ultimate strength behavior of test specimens
Group 1 specimens Aspect ratio exerted strong influence on specimen strength. Specimen X1 with a unit
aspect ratio reached an ultimate load of 12.75 kN during loading (Table 2). Specimen X2 provided better
resistance when the ultimate load was increased by 8%. This difference became more obvious compared with the
10% reduction in ultimate strength exhibited by specimen X3. The behavior of group 1 specimens highlighted
the negative influence of aspect ratio on the specimens’ ultimate loads.
Group 2 specimens The ultimate strengths of specimens X4 and X5 were compared with that of specimen
X1. When specimen X1 with concrete grade M30 exhibited an ultimate load of 12.75 kN, specimen X4 with
concrete grade M25 could sustain only 11.06 kN— a 13% deficit in capacity. Specimen X5 with concrete grade
M35 exhibited a 12% increase with an ultimate load of 14.27 kN. The contribution of concrete compressive
strength to ultimate strength is evident from the behavior of the group 2 specimens.
Group 3 specimens In the third group, the ultimate load of specimen X6 was observed to be 13.06 kN—
an increase of only 2% compared to the ultimate strength of specimen X1. The ultimate load values are
unreliable in terms of verifying the effects of the beam bar yield strength on joint behavior.
4.2. Joint shear behavior
Actual joint shear strengths of the test specimens are listed in Table 2. Aspect ratio and concrete
compressive strength exerted a strong influence on joint shear behavior. Since the column is assumed to be
strong and the design of the frame concentrates on the beam-hinging mechanism, it is generally sufficient to
estimate using only the horizontal joint shear. Joint shear force � and joint shear stress τ were calculated as
follows:
� = �����
�+ ��
���
�− �� (1)
Page 10 of 32
https://mc06.manuscriptcentral.com/cjce-pubs
Canadian Journal of Civil Engineering

Draft
11
τ =��
�� (2)
where ��and �� are beam shear, �� is column shear, ��� and ��� are distances from the column face to the beam’s
loading point (650 mm), ��and �� are the distances from tensile reinforcement to compressive resultants
(assumed to be 127.5 mm), and � is the effective area of the joint.
Group 1 specimens Aspect ratio exerts an important negative effect on joint shear strength. When
specimen X1 with a unit aspect ratio exhibited a joint shear strength of 7.23 MPa, specimen X2 with an aspect
ratio of 0.67 exhibited the highest shear strength of 8.01 MPa and specimen X3 with an aspect ratio of 1.33
exhibited the lowest shear strength of 6.59 MPa. Compared to the shear strength of X1, that of X2 increased by
around 11% whereas that of X3 decreased by 9%. Therefore, limiting the aspect ratio to desirable values is of
primary importance to the shear strength of a joint.
Group 2 specimens Concrete compressive strength was the key factor in promoting joint shear strength.
Specimen X4 (concrete grade M25) exhibited a shear strength of 6.13 MPa— a clear 15% decrease compared to
that of specimen X1 (concrete grade M30). When the compressive strength was increased from M30 to M35,
specimen X5 exhibited a 12% increase in shear strength. Thus, the shear behavior of the group 2 specimens was
clarified; moreover, the positive influence of concrete strength on joint shear strength was confirmed.
Group 3 specimens As with ultimate strength, specimen shear strength was not influenced by beam bar
yield strength. The observed 2% increase in the shear strength of specimen X6 was insufficient to verify the
effect of the beam bar yield strength on joint shear behavior.
4.3. Displacement ductility
Ductile failure is the preferred failure mode of joints subjected to seismic lateral loads. A structure’s
ductility is defined as its ability to undergo a large amount of deformation beyond the initial yield deformation
while maintaining its strength (Penelis and Kappos 2010; Paulay and Priestley 1992; ACI 352 R02 2002).
Ductility is measured in terms of the displacement ductility factor, which is the ratio of the maximum
deformation (δu) to the deformation at yield (δy) (Shannag et al. 2005; Bindhu and Jaya 2010; Ganesan et al.
2014). Load displacement envelopes are plotted (Fig. 6) and ductility factors calculated accordingly are listed in
Table 2.
Group 1 specimens In this group, specimen X1 exhibited the highest ductility factor of 2.61. Specimen
X3 was the least ductile, with a ductility factor of 1.28. Although specimen X2 followed a beam failure pattern,
its ductile behavior was not evident (i.e., it had a low ductility factor of 1.88) because of the brittleness effect on
Page 11 of 32
https://mc06.manuscriptcentral.com/cjce-pubs
Canadian Journal of Civil Engineering

Draft
12
beam behavior at the beam-column interface due to its aspect ratio of 0.67. The ductility factor of specimen X1
with a unit aspect ratio was 1.4 and 2.04 times greater than those of X2 and X3, respectively. Therefore, it can be
theorized that a unit aspect ratio plays a significant role in providing sufficient joint ductility. In seismic zones
where ductile behavior is necessary, utmost care should be taken to limit the aspect ratio of joints to unity.
Group 2 specimens Among specimens X1, X4, and X5 with varying concrete compressive strength,
maximum and minimum ductility were observed for specimens with the highest and lowest strengths,
respectively. A gradual increase in ductility ratios (1.96, 2.61, and 4.17) was observed for specimens X4, X1,
and X5, respectively, indicating positive influence of concrete compressive strength on ductile joint behavior.
The ductility factor of specimen X5 (concrete grade M35) was 1.6 and 2.1 times greater than those of X1
(concrete grade M30) and X4 (concrete grade M25), respectively.
Group 3 specimens In the third group of specimens (X1 and X6), X6 achieved a maximum ductility factor
of 4.77 compared to 2.61 for specimen X1. Thus, the ductility factor of X4 was 1.8 times greater than that of X1.
Hence, among the three variables considered, beam bar yield strength has the greatest influence on ductile joint
behavior. Thus, using beam bars with lower yield strengths can be regarded as a feasible design approach that
should be carefully considered in seismic design.
4.4. Energy dissipation capacity
Energy dissipation capacity is important in assessing the seismic resistance of a structure. A structure
can withstand strong ground waves due to earthquakes only if it possesses sufficient ability to dissipate seismic
energy. The area under the load-displacement hysteresis loop represents the dissipated energy during every load
cycle (Leon 1989; Shiohara 2004; Mitra and Lowes 2011).
Group 1 specimens Specimen X1 (unit aspect ratio) exhibited the highest energy dissipation capacity of
2.48 kNm among group 1 specimens. Capacity decreased by 36% in the case of specimen X2 (with an aspect
ratio of 0.67). Although a higher aspect ratio implies higher joint shear strength, it does not enhance joint energy
dissipation capacity, as is evident from the 41% reduction in the energy dissipation of specimen X3 (with an
aspect ratio of 1.33). The results demonstrate the significance of maintaining a unit aspect ratio for connections
to provide sufficient energy dissipation capacity during load reversals.
Group 2 specimens A consistent increase in energy dissipation was observed with increasing concrete
compressive strength. Specimen X5 (concrete grade M35) exhibited an increase of around 25% while specimen
X4 (concrete grade M25) exhibited a decrease of 27% compared to the energy dissipation capacity of specimen
X1 (concrete grade M30).
Page 12 of 32
https://mc06.manuscriptcentral.com/cjce-pubs
Canadian Journal of Civil Engineering

Draft
13
Group 3 specimens Specimen X6 exhibited the highest energy dissipation capacity because of its
enhanced ductile behavior due to reduced beam bar yield strength (415 MPa). Its energy dissipation capacity was
40% greater than that of specimen X1, where 500-MPa HYSD bars were used as beam bars.
In general, three variables were observed to have a significant influence on the energy dissipation
capacity of joint specimens (Figure 7) and should be considered in the seismic design of frames: unit aspect
ratio, high compressive strength, and relatively low beam bar yield strength should be prioritized. It has been
reported that reducing the aspect ratio by lowering the beam depth and increasing the column depth improves the
function of a strong column/weak girder design. However, test results proved that lowering the aspect ratio to
below unity is not favorable as it deteriorates the energy dissipation capacity considerably.
4.5. Stiffness degradation
The slope of the straight line joining each hysteresis loop peak (load vs. displacement) represents the
secant stiffness for that half cycle. The average stiffness obtained for the two half cycles in a hysteretic loop
gives the approximate stiffness for that particular cycle (Lu et al. 2012). Fig. 8 shows the stiffness degradation
curves of the six specimens.
Group 1 specimens Among specimens X1, X2, and X3, X3 exhibited the lowest initial stiffness and the
fastest stiffness degradation. Specimens X1 and X2 exhibited relatively higher stiffnesses and lower strength
degradation rates. Shear strength reduction and crack propagation decreased stiffness with increasing
displacement.
Group 2 specimens Among group 2 specimens, X5 and X4 exhibited the highest and lowest initial
stiffnesses, respectively. Specimen X5 (concrete grade M35) exhibited the lowest rate of stiffness degradation
compared to specimen X1. Hence, stiffness degradation and initial strength are significantly influenced by
concrete strength.
Group 3 specimens Comparing specimens X1 and X6 shows that beam bar yield strength does not
contribute significantly to stiffness enhancement. The two specimens exhibited approximately equal initial
stiffnesses, but stiffness degradation occurred somewhat more rapidly for specimen X6.
Among the three variables considered, concrete strength significantly enhanced specimen stiffness
capacity.
4.6. Reinforcement strain of beam bars
Beam longitudinal bar strains were measured at the beam-column interface using strain gauges and are
plotted against deformation in Fig. 9. The maximum strain readings signify the stage of failure for each
Page 13 of 32
https://mc06.manuscriptcentral.com/cjce-pubs
Canadian Journal of Civil Engineering

Draft
14
specimen. As shown by the graph, the higher the strain, the higher the reinforcement yielding throughout the
loading history.
Group 1 specimens Specimen X2, which failed in the beam flexure mode, exhibited the highest
reinforcement strain compared to specimens X1 and X3. The strain increased sharply and abruptly when the
specimen approached its ultimate displacement. The lowest strain was observed for specimen X3, which
underwent shear failure.
Group 2 specimens Consistent strain patterns were observed for specimens X1, X4, and X5 with varying
concrete compressive strength. Specimen X5 (a case of BF) exhibited the highest strain, whereas specimen X4 (a
case of JF) exhibited the lowest strain. For X1 and X5, strain increased gradually and steadily through a large
amount of displacement.
Group 3 specimens Specimen X6, which had beam bars of low yield strength and experienced beam
failure, exhibited the highest strain. The attainment of maximum strain was steady and gradual, indicating beam
bar yielding via displacement. Among the three variables considered, reinforcement strain was the most
significant factor affecting beam bar yield strength.
4.7. Observations on specimen failure modes
Specimen X1 had a design concrete strength of M30 and a unit aspect ratio. These together constitute
comparatively good but insufficient joint shear strength for resisting shear failure. As a result, the specimen
failed in a combined mode of beam joint failure. Specimen X2 had a design concrete strength of M30, but its
aspect ratio was 0.67. Even though it improved the joint’s shear resistance, the strength of the beam was reduced
considerably. This led to the sudden failure of beams as if in shear. The failure of specimen X3 was mainly
influenced by the high aspect ratio value. This weakened the strong column/weak girder design, and
subsequently, the specimen failed in joint shear. The design concrete strength of specimen X4 was M25, and this
proved to be the controlling factor in the shear failure mode observed. Specimen X5 was designed for the highest
design strength of M35 and had a unit aspect ratio. These together maximized the joint shear strength, and the
specimen failed in a ductile beam failure mode. In the case of specimen X6, the favorable factors were the unit
aspect ratio, design strength of M30, and longitudinal beam bars with relatively low yield strengths. These three
factors together were responsible for the perfect ductile beam failure of the specimen.
5. CONCLUSIONS
Results indicate that the aspect ratio of joints has a negative influence on joint shear strength. Ultimate
strength, joint shear strength, stiffness, and energy dissipation capacity are greatly influenced by concrete
Page 14 of 32
https://mc06.manuscriptcentral.com/cjce-pubs
Canadian Journal of Civil Engineering

Draft
15
compressive strength. The use of steel bars with relatively low yield strengths as beam longitudinal bars could
enhance ductility behavior and energy dissipation capacity significantly. The conclusions of this study are listed
below:
1) Changing the aspect ratio of joints results in a remarkable response in the behavior of beam-column
joint specimens. The specimen with the smallest aspect ratio exhibited the largest joint shear strength
and ultimate strength. Further, the aspect ratio could alter the mode of failure of joints from beam-joint
failure to beam failure.
2) The specimen with the highest aspect ratio exhibited the lowest shear strength, ultimate strength,
ductility, and energy dissipation capacity. Moreover, its mode of failure was not desirable.
3) Specimens with a unit aspect ratio exhibited better ductility and higher energy dissipation capacity than
those with the minimum aspect ratio.
4) Energy dissipation capacities degraded considerably when aspect ratios were 0.67 or 1.33. Hence, in
seismic zones, aspect ratios for beam-column joints of unity are preferable to higher or lower values.
5) Reducing concrete compressive strength below the grade of M30 should be avoided, as it severely
degrades joint shear strength, ultimate strength, and stiffness. Moreover, it could result in joints with a
brittle shear failure mode.
6) Increasing concrete compressive strength above grade (M35) is highly recommended, as this can result
in a perfect ductile beam-joint failure mode.
7) The most favorable responses in terms of joint shear strength, ultimate strength, energy dissipation, and
ductility corresponded to the highest concrete compressive strengths.
8) The use of Fe 415 steel for beam longitudinal reinforcement does not enhance ultimate strength or joint
shear strength significantly.
9) Beam bar yield strength showed a greater influence on ductility and energy dissipation capacity of
beam-column joints than concrete compressive strength.
10) The use of Fe 415 steel bars rather than other high-yield-strength bars is highly recommended for
longitudinal reinforcement of beams in frames in seismically vulnerable zones.
6. LIMITATIONS AND FUTURE RESEARCH
In the present study, the behavior of beam-column joints without transverse beams or slabs under cyclic
lateral loading was investigated. Eccentricity of beams is another aspect that was ignored in the present study.
Most joints are vulnerable to eccentric effects in beams in practical situations. The insights gained from the
Page 15 of 32
https://mc06.manuscriptcentral.com/cjce-pubs
Canadian Journal of Civil Engineering

Draft
16
present investigation can form a good foundation for future research considering aspects such as the effects of
eccentric beams and the presence of transverse beams/slabs on the seismic resistance of joints.
Acknowledgements
The authors wish to gratefully acknowledge the Government of Kerala (Quality Improvement
Programme) for financially supporting this study and Editage (www.editage.com) for providing language editing
services.
Page 16 of 32
https://mc06.manuscriptcentral.com/cjce-pubs
Canadian Journal of Civil Engineering

Draft
17
References
Abrams, D.P. 1987. Scale relations for reinforced concrete beam-column joints. ACI Structural Journal, 84(6):
502-512.
ACI 352-R02, Recommendations for design of beam column connections in monolithic reinforced concrete
structures. Farmington Hills, American Concrete Institute, 2002.
Alva, G.M.S., De Cresce El Debs, A.L.H., and El Debs, M.K. 2007. An experimental study on cyclic behaviour
of reinforced concrete connections. Canadian Journal of Civil Engineering, 34(4): 565-575.doi: 10.1139/l06-164.
Bakir, P.G., and Boduroglu, H.M. 2006. Nonlinear analysis of beam column joints using softened truss model.
Mechanics Research Communications, 33:134-147.
Bindhu, K.R., Jaya, K.P., and Manicka Selvam, V. 2008. Behaviour of exterior beam column joints with non-
conventional reinforcement detailing. Journal of Structural Engineering and Mechanics, 30(6): 733-76. doi:
10.12989/sem.2008.30.6.733
Bonacci, J., and Pantazopoulou, S. 1993. Parametric investigation of joint mechanics. ACI Structural Journal,
90(1): 61-71.
Durrani, A.J., and Wight, J.K. 1985. Behaviour of interior beam to column connections under earthquake type
loading. ACI Journal, 82: 343-349.
Fu, J., Chen, T., Wang, Z., and Bai, S. 2000. Effect of axial load ratio on seismic behaviour of interior beam
column joints. Proceedings of the 12th World Conference on Earthquake Engineering, New Zealand, 30th
January-4 February 2000. p.2707.
Ganesan, N., Indira, P.V., and Sabeena, M.V. 2014. Behaviour of hybrid fibre reinforced concrete beam column
joints under reverse cyclic loads. Materials and Design, 54: 686-693. doi:10.1016/j.matdes.2013.08.076.
Goto, Y., and Joh, O. 1996. An experimental study on shear failure mechanism of reinforced concrete interior
beam column joints. Proceedings of the 11th World Conference on Earthquake Engineering, Mexico, 23-28 June
1996. Paper 1194.
Hanson, N.W., and Conner, H.W. 1967. Seismic resistance of reinforced concrete beam column joints. ASCE
Journal of Structural Division, 93(5): 533-560.
IS 13920: 1993(reaffirmed 2002). Ductile Detailing of reinforced Concrete Structures subjected to Seismic
Forces. Bureau of Indian Standards, New Delhi, India, 2002.
Page 17 of 32
https://mc06.manuscriptcentral.com/cjce-pubs
Canadian Journal of Civil Engineering

Draft
18
IS 10262: 2009. Guidelines for concrete mix design proportioning. Bureau of Indian Standards, New Delhi,
India, 2009.
IS 1786: 2008. High strength deformed steel bars and wires for concrete reinforcement-Specification. Bureau of
Indian Standards, New Delhi, India, 2008.
IS 1599: 1985(reaffirmed 2012). Method for bend test. Bureau of Indian Standards, New Delhi, India, 2012.
Kim, J., and LaFave, J.M. 2008. Probabilistic joint shear strength models for design of RC beam column
connections. ACI Structural Journal, 105(6): 770-780.
Kitayama, K., Otani, S., and Aoyama, H. 1987. Earthquake resistant design criteria for reinforced concrete
interior beam column joints. Proceedings of the Pacific Conference on Earthquake Engineering, New Zealand, 5-
8 August 1987. Vol.1. pp.315-326.
Leon, R.T. 1989. Interior joints with variable anchorage lengths. Journal of Structural Engineering, 115(9):
2261-2275.
Leon, R.T. 1990. Shear strength and hysteresis behaviour of interior beam column joints. ACI Structural Journal,
87(1): 3-11.
Lu, X., Urukap, T.H., Li, S., and Lin, F. 2012. Seismic behaviour of interior RC beam column joints with
additional bars under cyclic loading. Earthquake and Structures, 3(1): 37-57.
Lu, Y., Vintzileou, E., Zhang, G.F., and Tassios, T.P. 1999. Reinforced concrete scaled columns under cyclic
actions. Soil Dynamics and Earthquake Engineering, 18: 151-167.
Meinheit, D.F., and Jirsa, J.O. 1977. The shear strength of reinforced concrete beam column joints. CESRL
Report 77-1, The University of Texas, Austin.
Mitra, N.S., and Lowes, L.N. 2011. Probabilistic model for failure initiation of reinforced concrete interior beam
column connections subjected to seismic loading. Engineering Structures, 33: 154-162.
doi:10.1016/j.engstruct.2010.09.029.
Pantazopoulou, S., and Bonacci, J. 1992. Consideration of questions about beam column joints. ACI Structural
Journal, 89(1): 27-36.
Pantazopoulou, S., and Bonacci, J. 1994. On earthquake-resistant reinforced concrete frame connections.
Canadian Journal of Civil Engineering, 21(2): 307-328, doi: 10.1139/l94-032
Paulay, T., and Priestley, M.J.N. 1992. Seismic Design of Reinforced Concrete and Masonry Buildings. John
Wiley & Sons, New York.
Page 18 of 32
https://mc06.manuscriptcentral.com/cjce-pubs
Canadian Journal of Civil Engineering

Draft
19
Paulay, T., Park, R., and Priestley, M.J.N. 1978. Reinforced concrete beam column joints under seismic action.
Journal of American Concrete Institute, 75(11): 585-593.
Penelis, G.G., and Kappos, A.J. 2010. Earthquake Resistant Concrete Structures. Taylor & Francis Group, Oxon.
Shannag, M.J., Abu-Dyya, N., and Abu-Farsakh, G. 2005. Lateral load response of high performance fibre
reinforced concrete beam column joints. Construction and Building Materials, 19: 500-508.
Shiohara, H. 2004. Quadruple flexural resistance in RC beam column joints. Proceedings of the 13th World
Conference on Earthquake Engineering, Canada, 1-6 August 2004. Paper 491.
Shiohara, H., and Kusuhara, F. 2009. Comprehensive series of tests on seismic performance of reinforced
concrete beam column joints. Proceedings of the 3rd International Conference on Advances in Experimental
Structural engineering, San-Francisco, 15-16 October 2009.
Xing, G.H., Wu, T., Niu, D.T., and Liu, X. 2013. Seismic behaviour of reinforced concrete interior beam column
joints with beams of different depths. Earthquakes and Structures, 4(4): 1-000.
FIGURE CAPTIONS
Fig. 1. Detailing and dimensions of specimens
Fig. 2. Test setup
Fig. 3. Cyclic loading history
Fig. 4. Crack patterns of test specimens
Fig. 5 Hysteresis loops of test specimens
Fig. 6. Load vs. displacement envelopes of test specimens
Fig. 7. Cumulative energy dissipation
Fig. 8. Stiffness degradation curves of test specimens
Fig. 9. Beam reinforcement strain curves of test specimens
Page 19 of 32
https://mc06.manuscriptcentral.com/cjce-pubs
Canadian Journal of Civil Engineering

Draft
20
Page 20 of 32
https://mc06.manuscriptcentral.com/cjce-pubs
Canadian Journal of Civil Engineering
Draft
21
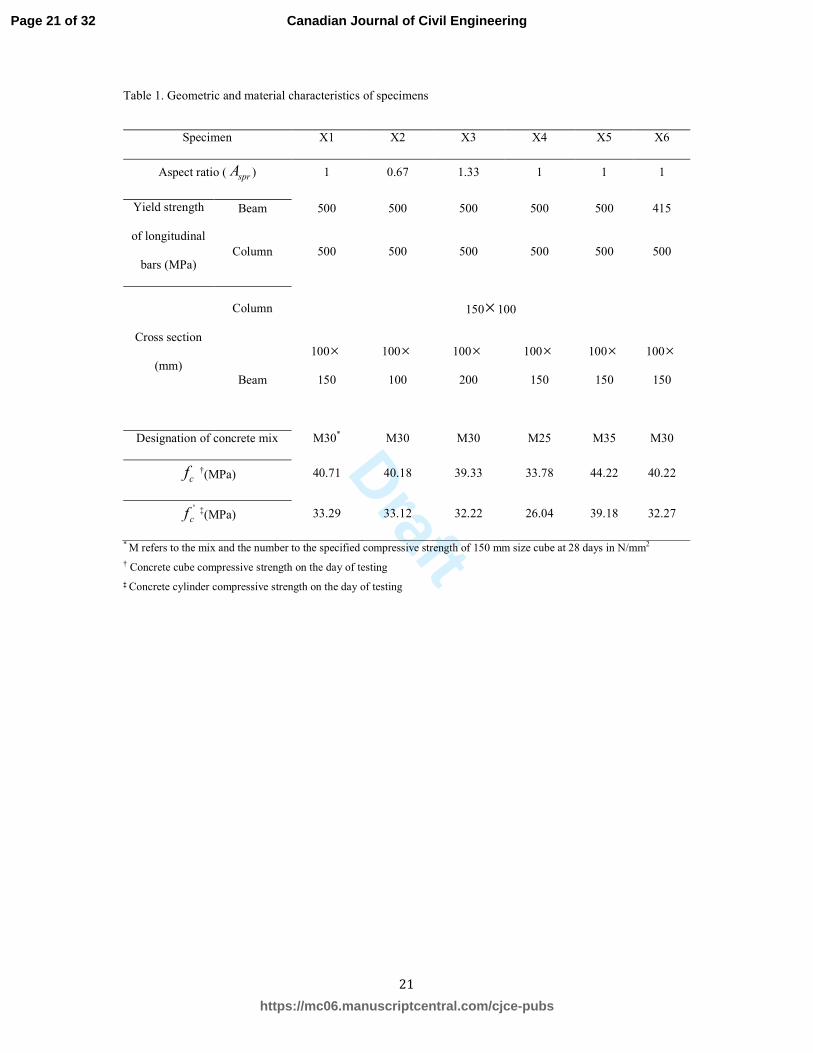
Table 1. Geometric and material characteristics of specimens
Specimen X1 X2 X3 X4 X5 X6
Aspect ratio ( sprA ) 1 0.67 1.33 1 1 1
Yield strength
of longitudinal
bars (MPa)
Beam 500 500 500 500 500 415
Column 500 500 500 500 500 500
Cross section
(mm)
Column 150×100
Beam
100×
150
100×
100
100×
200
100×
150
100×
150
100×
150
Designation of concrete mix M30* M30 M30 M25 M35 M30
cf †(MPa) 40.71 40.18 39.33 33.78 44.22 40.22
'
cf ‡(MPa) 33.29 33.12 32.22 26.04 39.18 32.27
* M refers to the mix and the number to the specified compressive strength of 150 mm size cube at 28 days in N/mm2
† Concrete cube compressive strength on the day of testing
‡ Concrete cylinder compressive strength on the day of testing
Page 21 of 32
https://mc06.manuscriptcentral.com/cjce-pubs
Canadian Journal of Civil Engineering

Draft
22
Table 2. Test results
Specimen X1 X2 X3 X4 X5 X6
Yield load
(kN)
Forward
cycle
10.20 11.00 09.17 08.85 11.42 10.45
Reverse
cycle
9.53 10.86 08.81 07.87 10.66 09.62
Ultimate load
(kN)
Forward
cycle
12.75 13.75 11.46 11.06 14.27 13.06
Reverse
cycle
11.91 13.57 11.01 09.84 13.32 12.03
Maximum
deflection*
(mm)
Forward
cycle
45.50 40.75 41.35 40.90 45.01 40.12
Reverse
cycle
43.87 38.06 35.63 38.87 44.13 39.60
Observed shear strength
(MPa)
7.23 8.01 6.59 6.13 8.09 7.37
δy
(mm)
20.01 23.40 32.12 23.00 12.00 13.00
δu
(mm)
52.31 43.99 52.03 45.00 50.00 62.00
Displacement ductility
factor
2.61 1.88 1.28 1.96 4.17 4.77
Cumulative energy
dissipation (kNm)
2.48 1.57 1.47 1.8 3.09 3.47
Observed mode of
failure
BJF BF JF JF BF BF
*Deflection corresponding to the ultimate load
Page 22 of 32
https://mc06.manuscriptcentral.com/cjce-pubs
Canadian Journal of Civil Engineering

Draft
Appendix 1. Longitudinal reinforcement strength
Table A1 summarizes the tested strength of bars used as longitudinal reinforcements in the test
specimens. Three bars from each sample of 10 bars were tested, and the average values are included in the table.
The bending test was performed in accordance with the requirements of IS 1599 (2012) and IS 1786 (2008). The
reinforcing steel bar, when cold, was doubled over the mandrel by continuous pressure until the sides were
parallel. The specimen was considered to have passed the test if there were no ruptures or cracks visible to a
person with normal vision along the bent portion.
Table A1. Summary of reinforcing steel bar strengths
High-yield-
strength
deformed bars
Specified
yield
strength
(MPa)
Actual yield
strength (YS)
(MPa)
Ultimate tensile
strength (UTS)
(MPa)
UTS/YS Modulus of
elasticity
(MPa)
Bending
Strength
(MPa)
6 mm 500 514.6 617.4 1.20 1.998× 10⁵ 620
415 421.8 515.7 1.22 1.89× 10⁵ 520
Page 23 of 32
https://mc06.manuscriptcentral.com/cjce-pubs
Canadian Journal of Civil Engineering

Draft
135x108mm (300 x 300 DPI)
Page 24 of 32
https://mc06.manuscriptcentral.com/cjce-pubs
Canadian Journal of Civil Engineering

Draft
284x124mm (300 x 300 DPI)
Page 25 of 32
https://mc06.manuscriptcentral.com/cjce-pubs
Canadian Journal of Civil Engineering

Draft
21x10mm (300 x 300 DPI)
Page 26 of 32
https://mc06.manuscriptcentral.com/cjce-pubs
Canadian Journal of Civil Engineering

Draft
149x170mm (300 x 300 DPI)
Page 27 of 32
https://mc06.manuscriptcentral.com/cjce-pubs
Canadian Journal of Civil Engineering

Draft
221x311mm (96 x 96 DPI)
Page 28 of 32
https://mc06.manuscriptcentral.com/cjce-pubs
Canadian Journal of Civil Engineering

Draft
40x24mm (300 x 300 DPI)
Page 29 of 32
https://mc06.manuscriptcentral.com/cjce-pubs
Canadian Journal of Civil Engineering

Draft
45x23mm (300 x 300 DPI)
Page 30 of 32
https://mc06.manuscriptcentral.com/cjce-pubs
Canadian Journal of Civil Engineering

Draft
40x24mm (300 x 300 DPI)
Page 31 of 32
https://mc06.manuscriptcentral.com/cjce-pubs
Canadian Journal of Civil Engineering

Draft
40x24mm (300 x 300 DPI)
Page 32 of 32
https://mc06.manuscriptcentral.com/cjce-pubs
Canadian Journal of Civil Engineering