cyclic behaviour of buckling-restrained braces … behaviour of buckling-restrained braces using...
TRANSCRIPT

Cyclic Behaviour of Buckling-restrained Braces Using Steel Mortar Planks ; Buckling Mode Number and Strength Ratio M. Midorikawa & T. Asari Hokkaido University, Sapporo, Japan M. Iwata & M. Murai Kanagawa University, Yokohama, Japan Y. Tanaka Nihon Sekkei Inc., Tokyo, Japan SUMMARY: The authors have contrived the buckling-restrained braces (BRBs) providing stable hysteretic behavior under the high-strain conditions. The compressive strength of BRBs is generally higher than the tensile strength. The authors assumed that it was because of friction forces between the surface of a core plate and a restraining member, and that the magnitude of friction forces was related to the buckling mode number resulting in the increase of contact points. A set of prediction formulas for the buckling mode number has been proposed in the authors’ previous study. In this paper, the validity of the proposed formulas for the buckling mode number is examined by the strain gauge measurement on the core plate from the cyclic axial-loading tests. Furthermore, the relationship between the ratio of the compressive to tensile strength and the slenderness ratio of the core-plate plastic region is derived. Keywords: buckling-restrained brace, cyclic behaviour, buckling mode, compression-to-tension strength ratio 1. INTRODUCTION A buckling-restrained brace (BRB) has a steel core plate resisting axial force, whose outer surface is covered with a restraining member to prevent flexural buckling. A clearance or unbonded material is left between the core plate and the restraining member to avoid excessive friction forces from the former to the latter. Consequently, the BRB is able to provide the nearly equal yield axial-force in tension and compression, and the stable hysteresis characteristics. A variety of systems are currently being proposed for the BRB, and numerous test and analytical results have also been reported (Fujimoto et al. 1988, Nagao and Takahashi 1990, Saeki et al. 1995, Tenbata et al. 2004, Usami et al. 2005, Takeuchi et al. 2008, Uang and Nakashima 2004). BRBs are installed in a frame structure to serve as energy dissipation members, in other words, seismic response-controlled members. They are designed to exhibit inelastic behaviour, thus becoming hysteretic dampers subjected to a strong earthquake ground motion. As a result, the plastic deformation in beams and columns is significantly reduced and they are protected from the seismic damage as compared to a conventional structure during a strong earthquake ground motion. In such a damage-controlled structure, the continuous use of an entire building without the need for demolition is enabled through the post earthquake inspection/replacement of only the energy dissipation members. It is resulted in the significant economic and global environmental benefits including a reduction of industrial waste. The authors have proposed and developed the BRBs, using steel mortar planks (a pair of mortar-filled channel steels forming a tube by welding each other) and providing the stable hysteresis behaviour under the high-strain conditions (Murai et al. 2003, Kobayashi et al. 2004, Iwata & Murai 2006, Iwata et al. 2007, Murase et al. 2007, Nakamura et al. 2008, Tadokoro et al. 2009, Tanaka et al. 2009, Midorikawa et al. 2010). In the past studies by cyclically static loading tests, the performance evaluation formula of the BRBs has been proposed with the scope of practical application (Iwata &

Murai 2006). However, the progress of the higher buckling-mode shape of the core plate has not been examined yet through the tests, which has a close relation to the friction forces from the core plate to the restraining member. In this paper, the progress of the higher buckling-mode shape of the core plate, and the strength increase rate and the compression-to-tension strength ratio of the BRBs are examined by cyclically static loading tests on the comparative performance of the three different values of slenderness ratio of the core-plate plastic region; 450, 650 and 850 among six test specimens. 2. TEST PROGRAM 2.1. Test Specimens Figure 1 illustrates the dimensions of the individual specimens. As shown in Figure 1, a thin unbonded material is applied over the entire outer surface of the core plate to create clearance between the core plate and the mortar over the width of the core plate. At both sides of the core plate, a gap is left between the core plate and the channel steel. This gap is filled with a round steel bar to prevent deformation of the core plate in this direction. To prevent local buckling at the ends of the specimens, strengthening ribs with cross-shaped cross-sections are provided. The urethane cushion is provided at both ends of the steel mortar plank so as to prevent the strengthening ribs from coming into direct contact with the restraining mortar when subjected to compressive deformation. Four small voids are provided in the mortar part to accommodate the strain-gauge wires for the strain measurement. A set of data obtained from the core-plate and mortar material testing is listed in Tables 1 and 2. Table 3 lists the test specimens. The material grade of the core plate is SN400B, and that of the restraining part is SS400. Six specimens were used in the tests. The core-plate yield load, Py, is calculated by multiplying the yield stress obtained from material testing by the cross-sectional area, A, and the buckling load of the restraining part, PE, from Euler’s buckling load formula as shown Eqn. (1). The value of PE/Py listed in Table 3 is considered to be an indicator of the restraining force required to ensure the stable energy dissipation of the BRBs. (1) Where Es, Em: Young’s moduli of steel and mortar respectively, and Is, Im: geometrical moment of inertia of steel and mortar respectively. 2.2. Test Parameters Three different slenderness ratio settings of about 450, 650 and 850 were adopted for the core-plate plastic region. ‘S’ in the specimen name designates a specimen that strain gauges were densely attached on the core plate as depicted in Figure 2. The width-to-thickness ratio of the core-plate plastic region was 11. The steel mortar plank dimensions were set in accordance with the PE/Py value of 3.1 for each specimen. The unbonded material of 1.0-mm thick butyl rubber was applied along the entire outer surface of the core plate to create clearance between the core plate and the mortar over the width
mmssE IEIEL
P 21
2
L1: Length of core plate
L3: Length of plastic region
L2: Length of restraining part
Plastic region
Figure 1. Test specimens
LR: Length of rib
H
b
h
T
t
B
A
A’
Core plate (PL-B×T)
Welding
Mortar
Round barφ11
Cushion material
Unbonded material (1.0mm) Channel steel (C-b×h×H×t)
Void for strain gauges

of the core plate. In this test, the thickness of the steel mortar plank was set at a fixed value of 3.2 mm, and the length of rib at a fixed value of 420 mm. The sectional size of the void in the mortar part for strain gauge wires was 15 mm by 15 mm for Specimen L450S, and 15 mm deep by 20 mm wide for Specimens L650S and L850S. 2.3. Test Setup, Loading Protocol and Measurement Figure 3(a) illustrates the test setup. A 1000 kN actuator was used to apply the load. The lower part of the column was pin-supported. The test specimen was placed at an inclination of 45◦ so that the strong axis of the core plate was within the plane of the loading axis. Static loading was adopted in which increasing loads were alternately applied in tension and compression as shown in Figure 3(b). Loading was controlled by changing the axial deformation of the core plate, as shown in Figure 3(a). Loads equivalent to 1/3 and 2/3 of the yield strain of the core plate, y, were each applied once. Loading was continued with the amplitude of 0.25 % strain (once), 0.5 and 0.75 % strains (twice each), 1.0 % strain (five times), 1.5, 2.0 and 2.5 % strains (twice each), and finally with the amplitude of 3.0 % strain until the load-bearing capacity of the core plate declined.
1 2 3 4 5 ・・・・・・・・・・・・・・・ n
n+1 ・・・・・・・・・・・・・・・・・ 2n
LS
Figure 2. Location of strain gauges
Table 1. Mechanical properties of core plate Core platethickness
Yield stressTensilestrength
Yieldratio
Yieldstrain
(mm) (N/mm2) (N/mm2) (%) (%)12 281 415 67.8 0.160
Table 2. Mechanical properties of mortar
Specimen nameL450
L450SL650 L650S L850 L850S
Compressive strength (N/mm2) 55.1 59.8 65.2 58.2 70.1
Young's modulus (N/mm2) 8071 10028 8346 10317 8622
Slendernessratio aboutweak-axis
Cross-sectional
areaL 1 L 2 L 3 P y
I
×104 P E
Number ofstrain gauges
in 1 lineL S
λ (mm2) (mm) (mm) (mm) (kN) (mm4) (kN) n (mm)L450 -- --L450S 25 63.0L650 -- --L650S 33 69.3L850 -- --L850S 49 60.9
844
PL-132×12 11.01584
Strain gaugesCore plate
436
640 446
1511
2218
Size of crosssection
Size ofcross section
Restraining part
P E /P y
Width-to-thickness
ratio
3.1
3.13058 2490
17832351
3.1
379
634
9763765 3197
Specimen
1388
1371
1393
C-159.2×45×90×3.2
C-159.2×57×114×3.2
C-159.2×69×138×3.22925
Table 3. List of test specimens
Figure 3. Test setup and loading protocol
(a) Test setup
ローラー支持
200
650
282.8582
L1
582.6
10
δ
ピン支持
1000kNアクチュエーター
10
A
A-B:変位測定間δ:計測変位
B
単位:mm
δ: Measuring axial deformation
A-B: Measuring range Unit: mm
Pin support
1000 kN actuator
Foundation beam
L1
Roller support
(b) Loading protocol
3.0
2.0
1.0
0.5
2εy/3
0
-2.0
-1.0
-0.5
-2εy/3
-3.0
Axi
al S
trai
n A
mpl
itud
e, ε
(%
)
Loading Cycle
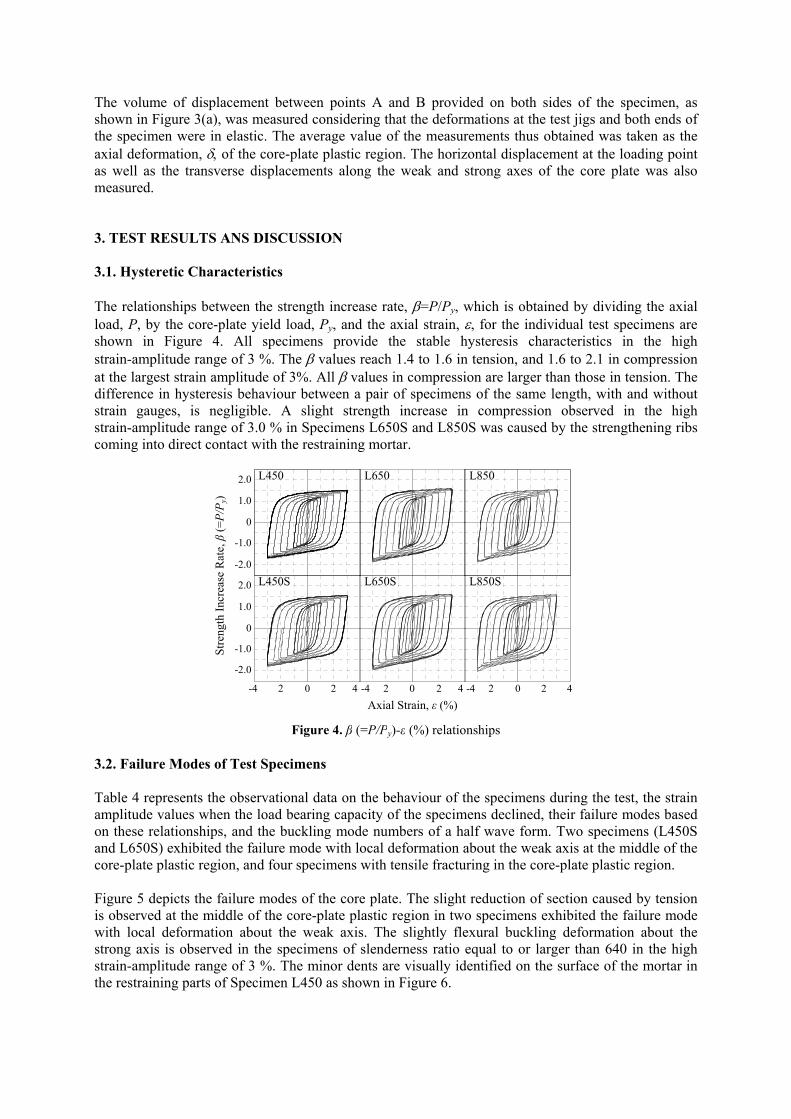
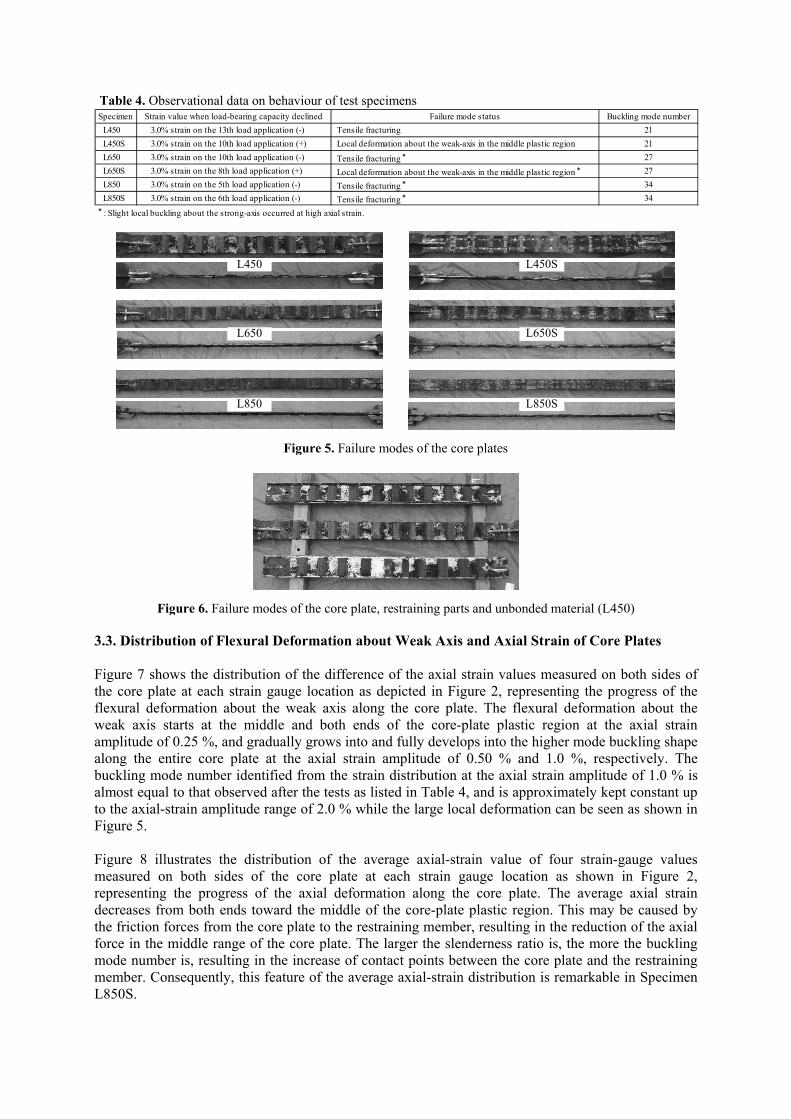
The volume of displacement between points A and B provided on both sides of the specimen, as shown in Figure 3(a), was measured considering that the deformations at the test jigs and both ends of the specimen were in elastic. The average value of the measurements thus obtained was taken as the axial deformation, of the core-plate plastic region. The horizontal displacement at the loading point as well as the transverse displacements along the weak and strong axes of the core plate was also measured. 3. TEST RESULTS ANS DISCUSSION 3.1. Hysteretic Characteristics The relationships between the strength increase rate, =P/Py, which is obtained by dividing the axial load, P, by the core-plate yield load, Py, and the axial strain, , for the individual test specimens are shown in Figure 4. All specimens provide the stable hysteresis characteristics in the high strain-amplitude range of 3 %. The values reach 1.4 to 1.6 in tension, and 1.6 to 2.1 in compression at the largest strain amplitude of 3%. All values in compression are larger than those in tension. The difference in hysteresis behaviour between a pair of specimens of the same length, with and without strain gauges, is negligible. A slight strength increase in compression observed in the high strain-amplitude range of 3.0 % in Specimens L650S and L850S was caused by the strengthening ribs coming into direct contact with the restraining mortar. 3.2. Failure Modes of Test Specimens Table 4 represents the observational data on the behaviour of the specimens during the test, the strain amplitude values when the load bearing capacity of the specimens declined, their failure modes based on these relationships, and the buckling mode numbers of a half wave form. Two specimens (L450S and L650S) exhibited the failure mode with local deformation about the weak axis at the middle of the core-plate plastic region, and four specimens with tensile fracturing in the core-plate plastic region. Figure 5 depicts the failure modes of the core plate. The slight reduction of section caused by tension is observed at the middle of the core-plate plastic region in two specimens exhibited the failure mode with local deformation about the weak axis. The slightly flexural buckling deformation about the strong axis is observed in the specimens of slenderness ratio equal to or larger than 640 in the high strain-amplitude range of 3 %. The minor dents are visually identified on the surface of the mortar in the restraining parts of Specimen L450 as shown in Figure 6.
Figure 4. β (=P/Py)-ε (%) relationships
Str
engt
h In
crea
se R
ate,
β (
=P
/Py)
Axial Strain, ε (%)
0
1.0
-1.0
2.0
-2.0
0
1.0
-1.0
2.0
-2.0
-4-4 22 0 22 0-44 22 0 4 4
L450
L450S
L650
L650S
L850
L850S
3.3. Distribution of Flexural Deformation about Weak Axis and Axial Strain of Core Plates Figure 7 shows the distribution of the difference of the axial strain values measured on both sides of the core plate at each strain gauge location as depicted in Figure 2, representing the progress of the flexural deformation about the weak axis along the core plate. The flexural deformation about the weak axis starts at the middle and both ends of the core-plate plastic region at the axial strain amplitude of 0.25 %, and gradually grows into and fully develops into the higher mode buckling shape along the entire core plate at the axial strain amplitude of 0.50 % and 1.0 %, respectively. The buckling mode number identified from the strain distribution at the axial strain amplitude of 1.0 % is almost equal to that observed after the tests as listed in Table 4, and is approximately kept constant up to the axial-strain amplitude range of 2.0 % while the large local deformation can be seen as shown in Figure 5. Figure 8 illustrates the distribution of the average axial-strain value of four strain-gauge values measured on both sides of the core plate at each strain gauge location as shown in Figure 2, representing the progress of the axial deformation along the core plate. The average axial strain decreases from both ends toward the middle of the core-plate plastic region. This may be caused by the friction forces from the core plate to the restraining member, resulting in the reduction of the axial force in the middle range of the core plate. The larger the slenderness ratio is, the more the buckling mode number is, resulting in the increase of contact points between the core plate and the restraining member. Consequently, this feature of the average axial-strain distribution is remarkable in Specimen L850S.
Table 4. Observational data on behaviour of test specimensSpecimen Strain value when load-bearing capacity declined Failure mode status Buckling mode number
L450 3.0% strain on the 13th load application (-) Tensile fracturing 21
L450S 3.0% strain on the 10th load application (+) Local deformation about the weak-axis in the middle plastic region 21
L650 3.0% strain on the 10th load application (-) Tensile fracturing* 27
L650S 3.0% strain on the 8th load application (+) Local deformation about the weak-axis in the middle plastic region* 27
L850 3.0% strain on the 5th load application (-) Tensile fracturing* 34
L850S 3.0% strain on the 6th load application (-) Tensile fracturing* 34*: Slight local buckling about the strong-axis occurred at high axial strain.
Figure 5. Failure modes of the core plates
L450 L450S
L650 L650S
L850 L850S
Figure 6. Failure modes of the core plate, restraining parts and unbonded material (L450)

3.4. Buckling Mode Number In the past study by the authors (Midorikawa at al. 2010), the evaluation formula for the buckling mode number, M, of the BRBs has been proposed in Eqns. (2) and (3), where Er denotes the reduced modulus defined in Eqn. (4). The value of tangent modulus, Et, in Eqn. (4) of 0.03E was adopted for the core plate from the test results. (2) (3) (4) Where : slenderness ratio of the core-plate plastic region, y: yield stress of the core plate, and E: Young’s modulus of the core plate. Figure 9 shows the comparison between the estimated values in Eqns. (2) and (3) and the observed values from the test results. In the figure, denotes Pc/Py where Pc is the compression strength in a certain axial-strain amplitude. The observed values harmonize quite well with the estimated values in Eqn. (3) in the vicinity of =1. Then, the observed values sharply increase at about =1.2 approaching to the estimated values in Eqn. (2), and are finally kept roughly constant coming close to the estimated values in Eqn. (3). It should be noted that the estimated value in Eqn. (2) is an upper limit to the observed buckling-mode number from the test results. On the other hand, the estimated value in Eqn. (3) is a lower limit to the observed one when is less than 1.5. 3.5. Strength Increase Rate Figure 10 illustrates the relationships between the strength increase rate, (=Pc/Py and Pt/Py, where Pc, Pt: strength in compression and tension in a certain axial-strain amplitude), and the axial strain amplitude in the core-plate plastic region. The difference in strength increase rate between a pair of specimens of the same length, with and without strain gauges, is insignificant.
0.0
-2.0
2.0
0.0
-2.0
2.0
0.0
-2.0
2.0
10 20 30 40 491
5 10 15 20 251
5 10 15 20 25 30 331
L450S
L650S
L850S
Measuring point
Dif
fere
nce
of A
xial
Str
ain
on B
oth
Sid
es (
%)
0.25% 0.50% 1st 1.0% 1st 2.0% 1st
Figure 7. Difference of axial strain on both sides of the core plate
Figure 8. Average axial-strain on both sides of the core plate
10 20 30 40 491
5 10 15 20 25 30 331
L450S
L650S
L850S
Measuring point
Ave
rage
d A
xial
Str
ain
on B
oth
Sid
es (
%)
0.25% 0.50% 1st 1.0% 1st 2.0% 1st
5 10 15 20 251
-1.0
-2.0
0.0
-1.0
-2.0
0.0
-1.0
-2.0
0.0
r
y
EM
1
1
EEEM
r
y
24
EE
EEE
t
tr

The values reach the close range of 1.4 to 1.6 in tension at the largest strain amplitude of 3% for all specimens. On the other hand, those values in compression attain 1.6 to 1.8 for =450; 1.7 to 2.0 for =650; and 1.8 to 2.1 for =850. Consequently, the larger the slenderness ratio is, the more the strength increase rate is in compression. A slight increase in the values observed in the high strain amplitude of 3.0 % in Specimens L650S and L850S was caused by the strengthening ribs coming into direct contact with the restraining mortar as mentioned in Section 3.1. 3.6. Compression-to-tension Strength Ratio It is observed that the compression-to-tension strength ratio (compression strength/tension strength) is larger than one in the past studies. It is pointed out that this is caused by not only the friction forces between the core plate and the restraining member resulted from the higher mode buckling, but also the expansion of sectional area of the core plate due to the effect of Poisson’s ratio (Midorikawa et al. 2010). In this section, the relationship of the slenderness ratio and the compression-to-tension ratio is further examined considering Eqns. (2) and (3). The strains, x, y and z in axial, width and thickness deformation respectively, are produced in the core plate under compression as illustrated in Figure 11 (Midorikawa et al. 2010). Assuming no
Figure 12. Deformation of higher mode buckling of the core plate
B B
S P P
LμB μB
B
Figure 11. Expansion of the cross-section of the core plate under compression
P
P
Core plate
Close-up ofplastic region
Isometric view
Z
YX
Y
Z εx
εz/2
PSide view of plastic region
Cross-sectional view ofplastic region
εy/2
X
Z
Figure 9. Relationships between buckling mode number, M and strength increase rate, β
0
10
20
30
40
50
0 0.5 1 1.5 2 2.5
Eq.(2)Eq.(3)λ=450
λ=650 Strain gaugesλ=850λ=450λ=650 Visualλ=850
50
40
30
20
10
0 0 0.5 1.0 1.5 2.0 2.5
Buc
klin
g M
ode
Num
ber,
M
Strength Increase Rate, β (=Pc/Py)
λ=450
λ=650
λ=850(2)
(3)
r
y
EM
E
My
E
1
1
EEEM
r
y
(文献15)
Figure 10. Relationships between strength increase rate, β (=P/Py) and axial strain amplitude
0 0.5 1 1.5 2 2.5 3 3.5
Pc/Py L450
Pc/Py L450S
Pt/Py L450
Pt/Py L450S
0 0.5 1 1.5 2 2.5 3 3.5
Pc/Py L650
Pc/Py L650S
Pt/Py L650
Pt/Py L650S
0 0.5 1 1.5 2 2.5 3 3.5
Pc/Py L850
Pc/Py L850S
Pt/Py L850
Pt/Py L850S
Axial Strain Amplitude (%)
Str
engt
h In
crea
se R
ate,
β (
=P
/Py)
λ=450 λ=650 λ=850
2.0 0 1.0 3.0 2.00 1.0 3.0 2.0 0 1.0 3.0
1.0
1.2
1.4
1.6
1.8
2.2
0.8
2.0

volume change in the core-plate plastic region, we have the Poisson’s ratio =0.5, x+y+z=0 and y=z, then get the ratio of sectional area in compression, Ac, and in tension, At, as expressed in Eqn. (5). Supposing no friction between the core plate and the restraining mortar, and the equal axial stress in compression and tension, we get Equation (6). (5) (6) Where Pc0, Pt0: compression and tension strength of the core plate without friction, respectively. Referring to the past study (Byakuno et al. 2005) and considering the friction forces between the core plate and the restraining mortar as shown in Figure 12, the restraining force, B, in the core-plate deformation under the higher mode buckling are expressed in Eqn. (7). The total friction force, F, along the core plate can be derived in Eqn. (8). In Eqns. (7) and (8), the compressive axial force, P, is assumed to be uniform and nearly equal to the compressive strength, Pc, along the core plate, and the restraining force, B, to be constant at every contact point. Finally, the compression-to-tension strength ratio, Pc/Pt, is expressed in Eqn. (9) following the past study (Midorikawa et al. 2010), and can be obtained in Eqn. (10) substituting Eqns. (7) and (8) for Eqn. (9). (7) Where P: compressive axial force, S: buckling mode amplitude, : friction coefficient and Lm: a half wave length of the buckling mode shape. (8) (9) (10) Figure 13 shows the relationships between the compression-to-tension strength ratio, Pc/Pt, and the axial strain amplitude in the core-plate plastic region, comparing the estimated values in Eqn. (10) with the test values and assuming the friction coefficient, , of 0.05 and 0.10. In the estimation of the total friction force, F, the strength increase rate, , is adopted from the test results. The buckling mode number, M, is estimated from Eqns. (2) and (3). The buckling mode amplitude, S, is assumed to be a constant value of 2 mm summing up the thickness of unbounded material on both sides of the core plate. The difference in compression-to-tension strength ratio between a pair of specimens of the same length, with and without strain gauges, is negligible. The value of Pc/Pt increases in proportion to the slenderness ratio. It should be noted that the value of Ac/At in Eqn. (5), depicted in a dotted line in
2
2
5.01
5.01
x
x
t
c
A
A
t
c
t
c
A
A
P
P
0
0
MBF
tt
c
t
c
P
F
A
A
P
P
)/)(21(1
)/(1
m
m
t
c
t
c
LSM
LS
A
A
P
P
Figure 13. Relationships between strength ratio, Pc/Pt and axial strain amplitude
0 0.5 1 1.5 2 2.5 3 3.5
L450L450SEq.(2) (μ=0.05)Eq.(2) (μ=0.10)Eq.(3) (μ=0.05)Eq.(3) (μ=0.10)Ac/At
0 0.5 1 1.5 2 2.5 3 3.5
L650L650SEq.(2) (μ=0.05)Eq.(2) (μ=0.10)Eq.(3) (μ=0.05)Eq.(3) (μ=0.10)Ac/At
0 0.5 1 1.5 2 2.5 3 3.5
L850L850SEq.(2) (μ=0.05)Eq.(2) (μ=0.10)Eq.(3) (μ=0.05)Eq.(3) (μ=0.10)Ac/At
Str
engt
h R
atio
, Pc/
Pt
Axial Strain Amplitude (%)
λ=450 λ=650 λ=850
1.0
1.1
1.2
1.3
1.4
1.5
0.9 2.0 0 1.0 3.0 2.00 1.0 3.0 2.0 0 1.0 3.0
SL
PSB
m
2

Figure 13, is the lower limit through all specimens. A slight increase in the values of Pc/Pt observed in the high strain amplitude of 3.0 % in Specimens L650S and L850S was caused by the strengthening ribs coming into direct contact with the restraining mortar as mentioned in Section 3.1. It is pointed out that the estimated value in Eqn. (3) with =0.05, depicted in a solid line in Figure 13, is a close approximation to the observed value obtained from the test results. While the estimated value in Eqn. (3) with =0.10, depicted in a grey line in Figure 13, corresponds approximately with the observed value within the axial strain amplitude of 1.0 %, it is overestimated in the higher axial-strain range over 1.0 %. Although the estimated value in Eqn. (2) with =0.05, depicted in a broken line in Figure 13, is overestimated compared with the observed value, it approaches the observed value at the axial-strain amplitude range of 3.0 %. On the other hand, the estimated value in Eqn. (2) with =0.10, depicted in a chain line in Figure 13, is extremely overestimated. 4. CONCLUSIONS The main findings obtained from the BRBs testing are as follows: (1) The difference in hysteresis behaviour, strength increase rate and buckling mode number between a pair of specimens of the same length, with and without strain gauges, is insignificant. (2) The progress of the flexural deformation about the weak axis of the core plate in the higher buckling mode shape of the BRBs is successfully observed through the measurement by strain gauges densely attached on the core plate in the tests. Specifically, the flexural deformation about the weak axis starts at the middle and both ends of the core-plate plastic region at the axial strain amplitude of 0.25 %, and gradually grows into and fully develops into the higher mode buckling along the entire core plate at the axial strain amplitude of 0.50 % and 1.0 %, respectively. The buckling mode number identified from the strain distribution at the axial strain amplitude of 1.0 % is almost equal to that observed after the tests, and is kept roughly constant over the axial strain amplitude of 2.0 % while the large local deformation can be seen. (3) The average axial strain decreases from both ends toward the middle of the core-plate plastic region particularly in the high-strain amplitude range. This may be caused by the friction forces from the core plate to the restraining member, resulting in the reduction of the axial force in the middle range of the core plate. This feature is remarkable in the specimen of larger slenderness ratio, because the larger the slenderness ratio is, the more the buckling mode number is, resulting in the increase of contact points between the core plate and the restraining mortar. (4) The estimated value in Eqn. (2) is an upper limit to the observed buckling mode number from the test results, whereas its value in Eqn. (3) is a lower limit to the observed one when the strength increase rate, is less than 1.5. (5) The compressive strength ratio, , and the compression-to-tension strength ratio, Pc/Pt, increase in proportion to the slenderness ratio of the core-plate plastic region. The proposed formula for the compression-to-tension strength ratio, Pc/Pt, considering the friction forces between the core plate and restraining mortar, and the change of sectional area due to the effect of Poisson’s ratio, is in good agreement with the observed values from the test results. ACKNOWLEDGEMENTS The authors would like to acknowledge Mr. M. Otake, graduate student of Kanagawa Univ., Mr. K. Ogawa, former graduate student of Kanagawa Univ., and Mr. T. Wakayama, graduate student of Hokkaido Univ. for their excellent assistance. Part of this work is supported by the Japan Iron and Steel Federation under Research Grant of Steel Structures and Construction in 2010. REFERENCES

Byakuno, Y., Koetaka, Y., Inoue, K. and Morooka, S. (2005). Design and experimental verification on the performance of the buckling-restrained knee brace. Steel Construction Engineering, JSSC 12:45, 233-241 (in Japanese).
Fujimoto, M., Wada, A., Saeki, E., Watanabe, A. and Hitomi, Y. (1988). A study on the unbonded brace encased in buckling-restraining concrete and steel tube. Journal of Structural Engineering, AIJ 34B, 249-258 (in Japanese).
Iwata, M. and Murai, M. (2006). Buckling-restrained brace using steel mortar planks; performance evaluation as a hysteretic damper. Earthquake Engineering and Structural Dynamics 35:14, 1807-1826.
Iwata, M., Murase, R., Izumita, Y. and Murai, M. (2007). Experimental study on buckling-restrained braces using steel mortar planks-Part 3 Buckling behaviour of the core plate-. Journal of Structural and Construction Engineering, AIJ 611, 133-139 (in Japanese).
Kobayashi, F., Murai, M., Izumita, Y. and Iwata, M. (2004). Experimental study on buckling-restrained braces using steel mortar planks-Part 2 Simplified fabrication and core plate width-thickness ratio-. Journal of Structural and Construction Engineering, AIJ 586, 187-193 (in Japanese).
Midorikawa, M., Sasaki, D., ASARI, T., Murai, M. and Iwata, M. (2010). Experimental study on buckiling- restrained baces using steel mortar planks-Effects of the clearance between core plate and restraining member on compressive strength and estimation of the number of buckling mode related to compressive strength-. Journal of Structural and Construction Engineering, AIJ 75:653, 1361-1368 (in Japanese).
Murai, M., Kobayashi, F., Noda, T. and Iwata, M. (2003). Experimental study on buckling-restrained braces using steel mortar planks. Journal of Structural and Construction Engineering, AIJ 569, 105-110 (in Japanese).
Murase, R., Murai, M. and Iwata, M. (2007). Experimental study on buckling-restrained braces using steel mortar planks-Part 4 Effects on core plate width-thickness ratio, restraining force and core section details-. Journal of Structural and Construction Engineering, AIJ 620, 117-124 (in Japanese).
Nagao, T. and Takahashi, S. (1990). A Study on the elasto-plastic behavior of unbonded composite bracing-Part 1: Experiments on isolated members under cyclic loading-. Journal of Structural and Construction Engineering, AIJ 415, 105-115 (in Japanese).
Nakamura, M., Yamashita, T., Murai, M. and Iwata M. (2008). Experimental study on buckling-restrained braces using steel mortar planks-Adjusting the yield strength and axial stiffness of buckling-restrained braces by decreasing the core plate cross-sectional area and increasing end thickness. Journal of Structural and Construction Engineering, AIJ 73:629, 1143-1150 (in Japanese).
Saeki, E., Maeda, Y., Nakamura, H., Midorikawa, M. and Wada, A. (1995). Experimental study on practical-scale unbonded braces. Journal of Structural and Construction Engineering, AIJ 476, 149-158 (in Japanese).
Tadokora, A., Midorikawa, M., Murai, M. and Iwata, M. (2009). Experimental study on buckling-restrained braces using steel mortar planks-Effects of core plate length, plastic length ratio and rib plate length-. Journal of Structural and Construction Engineering, AIJ, 74:641, 1363-1369 (in Japanese).
Takeuchi, T., Matsui, R., Hajjar, J. F., Nishimoto, K. and Aiken, I. D. (2008). Local buckling restraint conditions for core plate in buckling restrained braces. Journal of Structural and Construction Engineering, AIJ 73:634, 2231-2238 (in Japanese).
Tanaka, Y., Midorikawa, M., Iwata, M. and Asari, T. (2009). Inelastic behavior of buckling-restrained braces using steel mortar planks by finite element analysis-Comparison of cyclic loading test results with numerical analysis for different core plate lengths-. Summaries of Technical Papers of Annual Meeting, AIJ Structures III, 817-818 (in Japanese).
Tenbata, H., Koetaka, Y. and Inoue, I. (2004). Out-of-plane buckling load of buckling-restrained braces including brace joints. Journal of Structural and Construction Engineering, AIJ 581, 127-134 (in Japanese).
Uang, C. M. and Nakashima, M. (2004). Steel buckling-restrained braced frames, Earthquake Engineering from Engineering Seismology to Performance-Based Engineering (Chapter 16). Bozorgnia Y. and Bertero V. V. (eds.), CRC Press L. L. C., Boca Raton, FL, 16-1-37.
Usami, T., Kaneko, H. and Ono, T. (2005). Strength of H-shaped brace constrained flexural buckling in consideration of boundary condition at both ends. Journal of Structural and Construction Engineering, AIJ 590, 121-128 (in Japanese).