cycle life prediction for ncm- composite/graphite · pdf filecycle life prediction for...
TRANSCRIPT
© 2013 HRL Laboratories, LLC. All Rights Reserved
1
Cycle Life Prediction for NCM-Composite/Graphite Lithium Ion Battery Cells
Justin Purewal,1 John Wang,1 Jason Graetz1 1HRL Laboratories, LLC, Malibu, CA 90265 Mark Verbrugge2, and Harshad Tataria3
2General Motors R&D Center, Warren, MI 3General Motors Vehicle Engineering, Warren, MI

© 2013 HRL Laboratories, LLC. All Rights Reserved
2
18650 cylindrical Sanyo/Panasonic cell Cathode (Positive) Chemistry : LiMn1/3Ni1/3Co1/3 (L333) + LiMn2O4
Anode (Negative) Chemistry : graphite
Outline:
1. Overview of matrix testing
2. Develop of model 1. Chemical degradation (temperature and time) 2. Mechanical fatigue (rate and # of cycles)
3. Summary
Life Modeling of NCM Composite/Graphite Cell: Mechanical & Chemical Degradation

© 2013 HRL Laboratories, LLC. All Rights Reserved
3
Cycling Test Matrix
•Two cells are tested at each condition
•Temperature: 10oC to 46oC
•Discharge rates: C/2 to 6.5C
•Depth of Discharge, DOD 10% to 90%
•For modeling work, only consider the 50% DOD results
60 Test Conditions (120 cells) DoD 10 oC 22 oC 34 oC 46 oC Rate
90
0.5C50
1090
2C
7050301090
3.5C
70
50
301090
50
301090
6.5C50
10
5C
70
Temperature
DOD
C-rate
© 2013 HRL Laboratories, LLC. All Rights Reserved
4
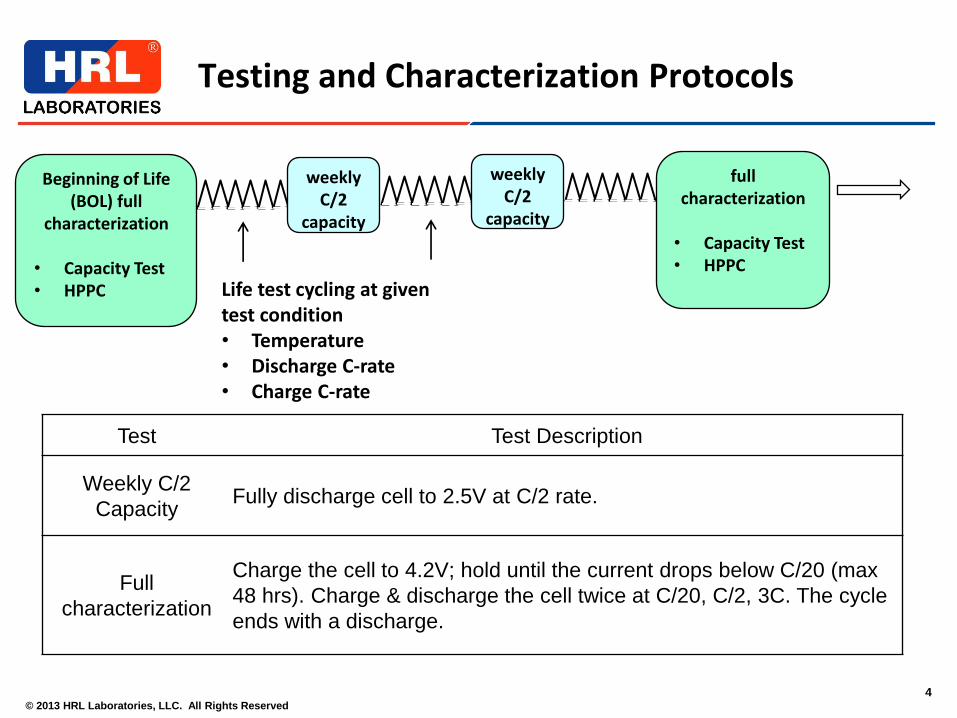
Testing and Characterization Protocols
Beginning of Life (BOL) full
characterization
• Capacity Test • HPPC
weekly C/2
capacity
full characterization
• Capacity Test • HPPC
weekly C/2
capacity
Life test cycling at given test condition • Temperature • Discharge C-rate • Charge C-rate
Test Test Description
Weekly C/2
Capacity Fully discharge cell to 2.5V at C/2 rate.
Full
characterization
Charge the cell to 4.2V; hold until the current drops below C/20 (max
48 hrs). Charge & discharge the cell twice at C/20, C/2, 3C. The cycle
ends with a discharge.
© 2013 HRL Laboratories, LLC. All Rights Reserved
5
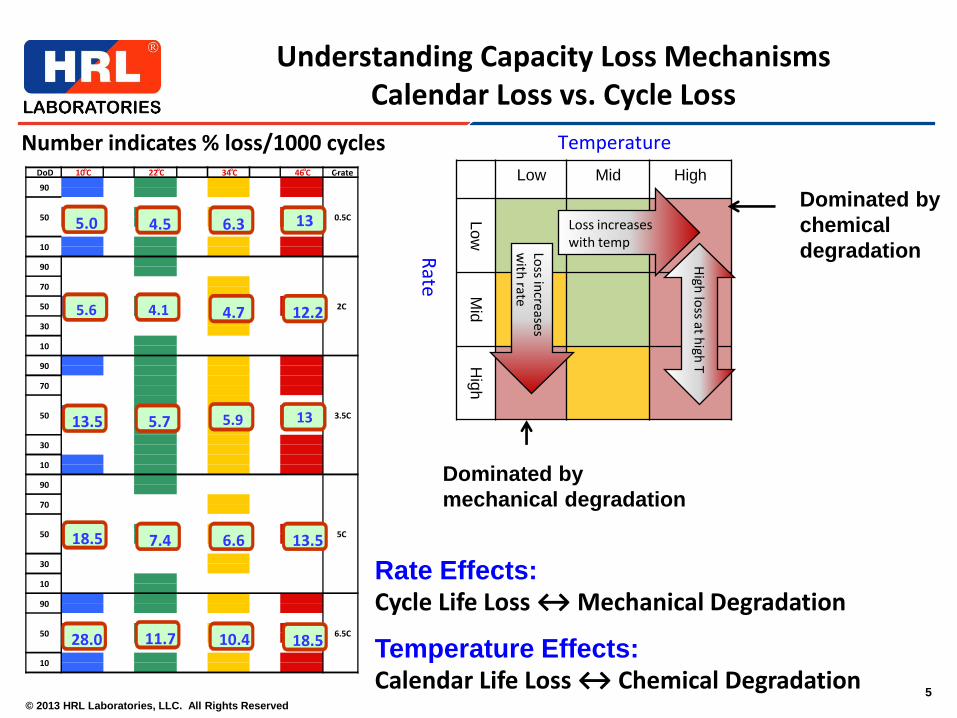
Understanding Capacity Loss Mechanisms Calendar Loss vs. Cycle Loss
Number indicates % loss/1000 cycles DoD 10 o C 22 o C 34 o C 46 o C C - rate
90
0.5C 50
10
90
2C
70
50
30
10
90
3.5C
70
50
30
10
90
5C
70
50
30
10
90
6.5C 50
10
5.0 4.5 6.3 13
5.6 4.1 4.7 12.2
13.5 5.7 5.9 13
18.5 7.4 6.6 13.5
28.0 11.7 10.4 18.5
Low Mid High
Lo
w
Mid
H
igh
Temperature
Rate
Loss increases with temp Lo
ss increase
s w
ith rate
High
loss at h
igh T
Rate Effects: Cycle Life Loss ↔ Mechanical Degradation
Temperature Effects: Calendar Life Loss ↔ Chemical Degradation
Dominated by
mechanical degradation
Dominated by
chemical
degradation

© 2013 HRL Laboratories, LLC. All Rights Reserved
6
Chemical Degradation – SEI Formation
Li+ e-
EC
SEI
Graphite
SEI thickness 𝐿𝑆𝐸𝐼 ≈ 𝐾𝑡ℎ 𝑡
Assume diffusion through SEI is rate-determining process
Continuous SEI Growth
Initial SEI layer New SEI layer
Importance of Coulombic efficiency (ηI)
Cycle Capacity
1 Ah0×ηI
2 (Ah0×ηI)×ηI
↓
N Ah0×(ηI)N
For N=5000 cycles, and ηI=0.99994, capacity retention is (ηI)
5000 = 0.75
This is why very low rates of lithium-consuming reactions can lead to premature cell failure
Parabolic film growth (~ 𝒕)

© 2013 HRL Laboratories, LLC. All Rights Reserved
7
Mechanical Degradation in Li-ion Batteries
Analogy to fatigue in materials
SEI layer Graphite
Li+
Mechanical fatigue of an electrode particle
Discharge (contraction)
• Rapid Li+ discharge generates tensile stress at surface
• Repeated charge/discharge cycles fatigue stress
crack growth
tensile stress
© 2013 HRL Laboratories, LLC. All Rights Reserved
8
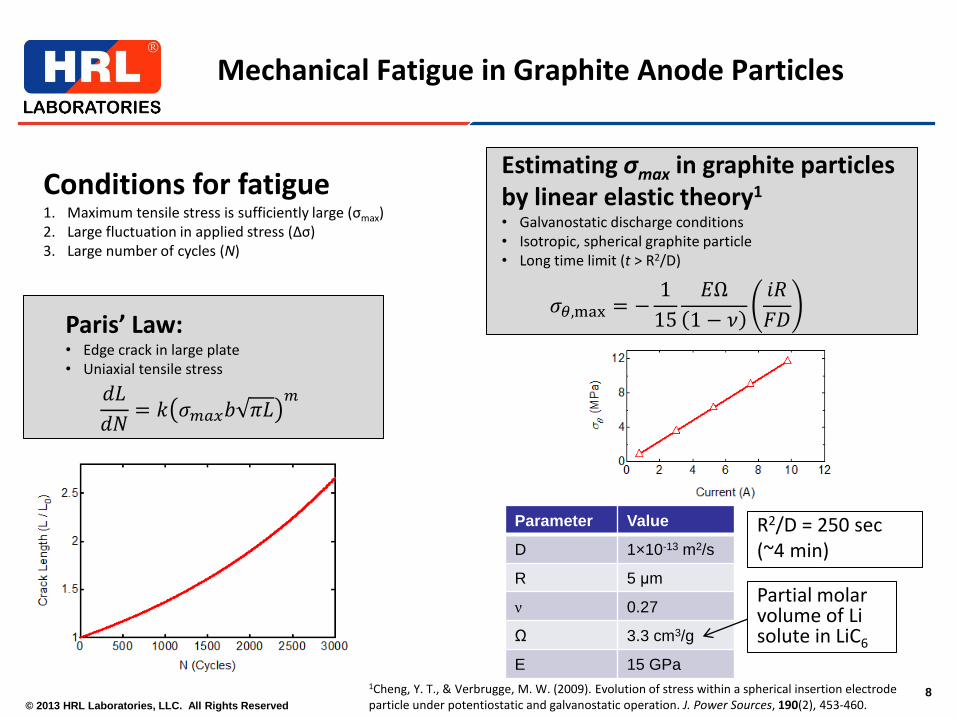
Mechanical Fatigue in Graphite Anode Particles
Paris’ Law: • Edge crack in large plate • Uniaxial tensile stress
𝑑𝐿
𝑑𝑁= 𝑘 𝜎𝑚𝑎𝑥𝑏 𝜋𝐿
𝑚
Conditions for fatigue 1. Maximum tensile stress is sufficiently large (σmax) 2. Large fluctuation in applied stress (Δσ) 3. Large number of cycles (N)
Estimating σmax in graphite particles by linear elastic theory1
• Galvanostatic discharge conditions • Isotropic, spherical graphite particle • Long time limit (t > R2/D)
𝜎𝜃,max = −1
15
𝐸Ω
1 − 𝜈
𝑖𝑅
𝐹𝐷
Parameter Value
D 1×10-13 m2/s
R 5 μm
ν 0.27
Ω 3.3 cm3/g
E 15 GPa
Partial molar volume of Li solute in LiC6
R2/D = 250 sec (~4 min)
1Cheng, Y. T., & Verbrugge, M. W. (2009). Evolution of stress within a spherical insertion electrode particle under potentiostatic and galvanostatic operation. J. Power Sources, 190(2), 453-460.
© 2013 HRL Laboratories, LLC. All Rights Reserved
9
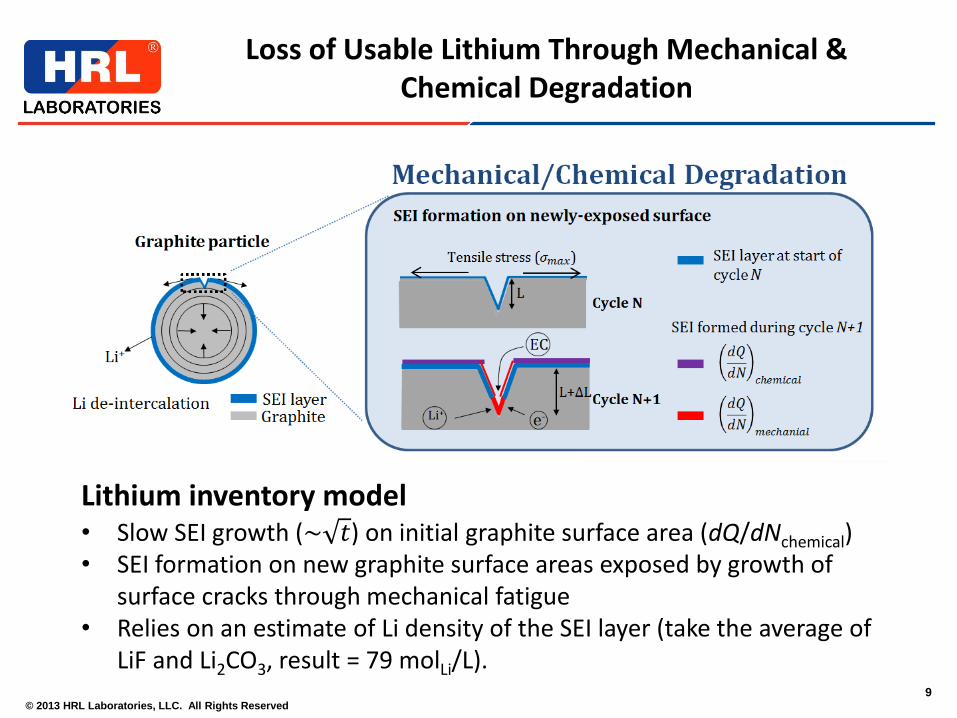
Loss of Usable Lithium Through Mechanical & Chemical Degradation
Lithium inventory model • Slow SEI growth (~ 𝑡) on initial graphite surface area (dQ/dNchemical) • SEI formation on new graphite surface areas exposed by growth of
surface cracks through mechanical fatigue • Relies on an estimate of Li density of the SEI layer (take the average of
LiF and Li2CO3, result = 79 molLi/L).

© 2013 HRL Laboratories, LLC. All Rights Reserved
10
Summary of Model
Mechanism Formula
Adjustable
Parameters Notes
Crack growth 𝒅𝑳𝒄𝒓𝒅𝑵
= 𝒌 𝝈𝜽,𝒎𝒂𝒙𝒃 𝝅𝑳𝒄𝒓𝒎
𝒌,𝒎 Edge crack in large
plate (𝒃 = 𝟏. 𝟏𝟐)
SEI growth 𝑳𝑺𝑬𝑰 = 𝑲𝒕𝒉 𝒕 𝑲𝒕𝒉
Consistent with both
empirical and
simulated results
Two parameters (𝑘, 𝐾𝑡ℎ) are temperature-dependent, but rate-independent.
A single value of m = 2.2 works for all temperatures
We only consider life testing data at a single depth of discharge (DOD=50%) when fitting the model
© 2013 HRL Laboratories, LLC. All Rights Reserved
11
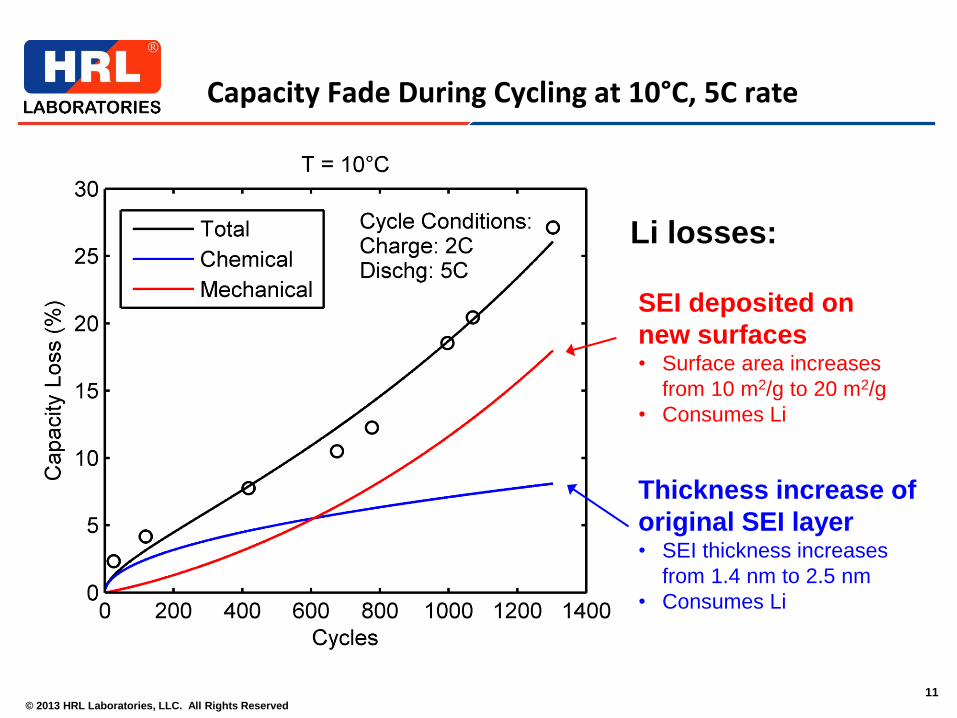
Capacity Fade During Cycling at 10°C, 5C rate
Li losses:
SEI deposited on
new surfaces • Surface area increases
from 10 m2/g to 20 m2/g
• Consumes Li
Thickness increase of
original SEI layer • SEI thickness increases
from 1.4 nm to 2.5 nm
• Consumes Li
© 2013 HRL Laboratories, LLC. All Rights Reserved
12
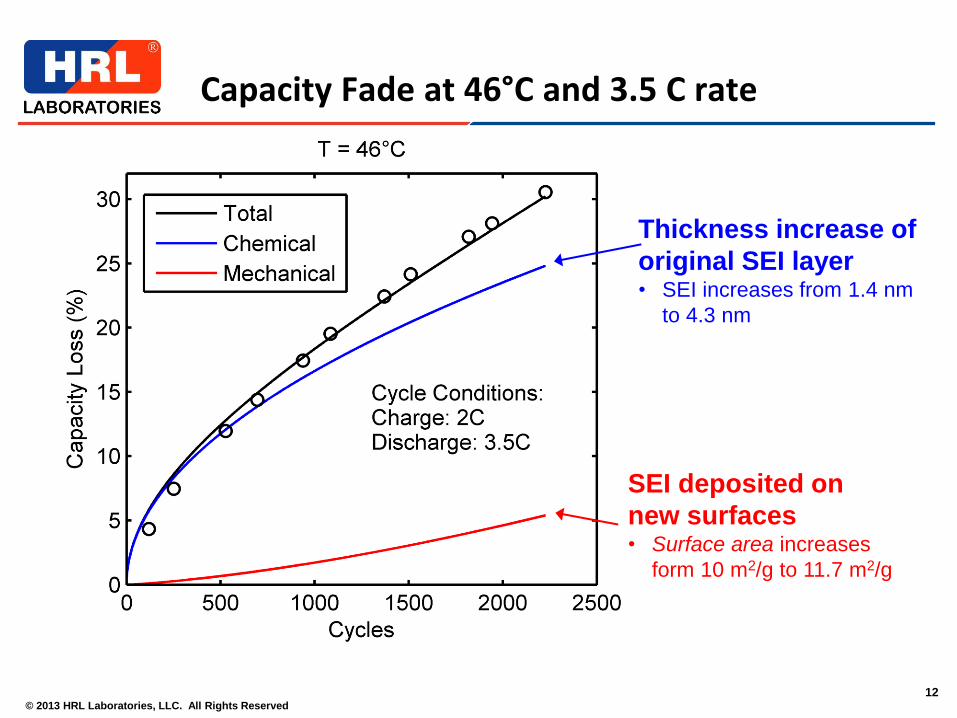
Capacity Fade at 46°C and 3.5 C rate
SEI deposited on
new surfaces • Surface area increases
form 10 m2/g to 11.7 m2/g
Thickness increase of
original SEI layer • SEI increases from 1.4 nm
to 4.3 nm

© 2013 HRL Laboratories, LLC. All Rights Reserved
13
Comparison of model to measured capacity fade
Model is consistent with extreme cycling conditions:
1. low temperature & high rate
2. high temperature & low rate

© 2013 HRL Laboratories, LLC. All Rights Reserved
14
Fitted Values of Adjustable Parameters
4.5
4
3.5
3
2.5
2
1.5
1
0.5
k /
10
-19
5040302010
Temperature (°C)
5
6
78
10-10
2
3
4
5
6
78
10-9
Kth
3.53.43.33.23.1
(1000 K) / T
10°C22°C34°C46°C
Fit to Arrhenius equation with Ea = 21 kJ/mol
k increases sharply at 10°C More susceptible to fatigue crack growth at low T
Large increase in k at low temperature may indicate :
1. Ductile-to-brittle transition of polymeric component of (composite)
SEI layer
2. Slower solid-state Li diffusion in graphite increases strain/stress
SEI growth rate constant (Kth)
© 2013 HRL Laboratories, LLC. All Rights Reserved
15
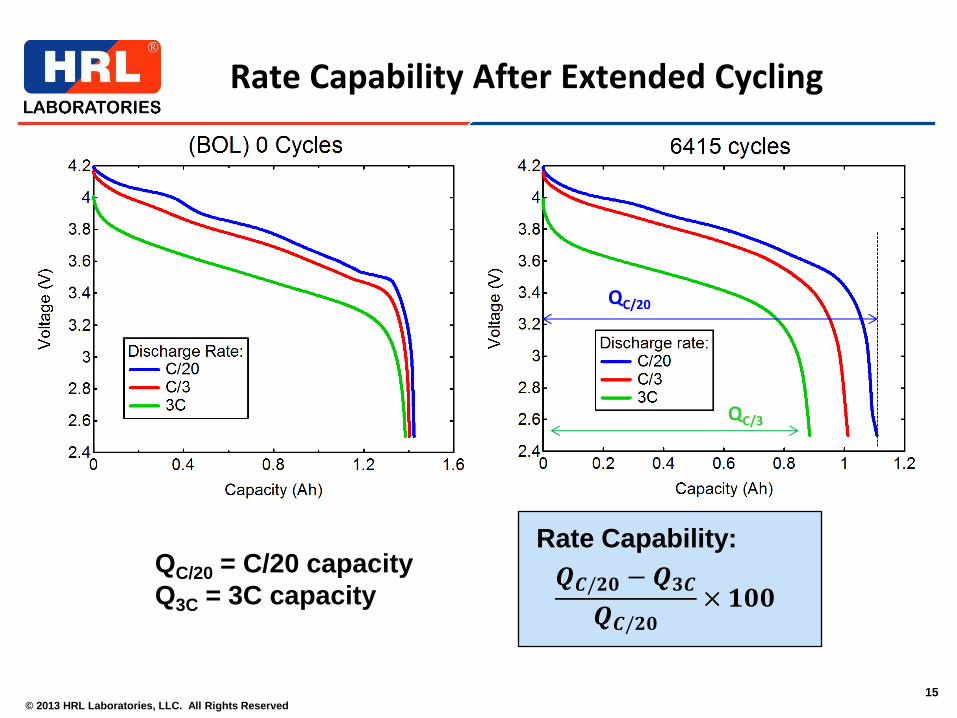
Rate Capability After Extended Cycling
QC/20 = C/20 capacity
Q3C = 3C capacity
Rate Capability:
𝑸𝑪/𝟐𝟎 − 𝑸𝟑𝑪
𝑸𝑪/𝟐𝟎× 𝟏𝟎𝟎
QC/3
QC/20

© 2013 HRL Laboratories, LLC. All Rights Reserved
16
Rate Capability After Cycling L333 Cells At Different Rates/Temperatures
When cells are cycled at 10°C, the C-rate has a large impact on the evolution of rate capability.

© 2013 HRL Laboratories, LLC. All Rights Reserved
17
Summary
• Accelerated capacity fade is observed for cells cycled at low temperature (10°C) and fast discharge (5C,6.5C)
• Apparently caused by mechanical degradation of electrode material, coupled with loss of usable Li.
• Model for Li loss (inventory)
1) Original SEI layer slowly increases according to 𝒕 parabolic film growth
2) Cracks in graphite particle grow due to mechanical fatigue (repeated Li intercalation/de-intercalation)
3) New surface area consumes usable Li • With this approach, we predict capacity fade during
cycling over wide operating ranges from 10°C/6.5C to 46°C/0.5C

© 2013 HRL Laboratories, LLC. All Rights Reserved
18
Acknowledgements
Rutooj Deshpande (Univ. of Kentucky) Souren Soukiazian (HRL) Lowell Shaffner, Mori Borumand (Boeing)