cyber power index - saïd business school · pdf fileunit has developed the cyber power...
TRANSCRIPT

Findings and Methodology
Cyber Power Index
An Economist Intelligence Unit research program sponsored by Booz Allen Hamilton


Contents
Executive Summary .................................................................................................................. 2
Introduction ................................................................................................................................ 7
Legal and Regulatory Framework ....................................................................................... 8
Case Study 1—Towards an International Framework: The UK andthe US Leading the Way ........................................................................................................11
Economic and Social Context .............................................................................................12
Technology Infrastructure ....................................................................................................14
Industry Application...............................................................................................................17
Case Study 2—South Korea’s Cyber Development—A Studyin Contradictions .....................................................................................................................18
Conclusion .................................................................................................................................20
Appendix I: Methodology ....................................................................................................21
Scoring Criteria and Categories .................................................................................21
Data Sources .....................................................................................................................22
Country Selection ...........................................................................................................23
Model Functionality .......................................................................................................23
Weighting ...........................................................................................................................24
Data Modelling ................................................................................................................25
Appendix II: Sources and Definitions ...............................................................................26
About Booz Allen ....................................................................................................................33
About EIU ...................................................................................................................................33
Cyber Power Index: Findings and Methodology 1

Executive SummaryWhile strong digital development increases cyber poWer potential, a rise in dependency also results in greater security risks. As illustrated by the Cyber Power Index, many countries struggle with this inherent contradiction, while leading countries meet these new challenges. Cyber power is defined here as the ability to withstand cyber attacks and to deploy the digital infrastructure necessary for a productive and secure economy. The concept of cyber power, therefore, encompasses the benefits and the potential challenges of reliance on digital resources.
The global rise in the importance of information and communication technology (ICT) to economic development is well documented; however, relatively little attention has been paid to the potential negative consequences of our rising cyber reliance. Moreover, understanding the factors behind cyber power and the ways in which they affect organizations at all levels is increasingly important as countries become more interconnected and emerging markets play a bigger role in cyberspace. According to the International Telecommunications Union (ITU), a specialized agency of the UN, the proportion of households with Internet access in the developing world has risen tremendously, from 4.6 percent in 2002 to 15.8 percent in 2010.
To gain a better understanding of factors influencing cyber power globally, the Economist Intelligence Unit has developed the Cyber Power Index, sponsored by Booz Allen Hamilton. The index is a dynamic quantitative and qualitative model, constructed from 39 indicators and sub-indicators that measure specific attributes of the cyber environment across four drivers of cyber power: legal and regulatory framework; economic and social context; technology infrastructure; and industry application, which examines digital progress across key industries.
This benchmarking exercise covers 19 countries of the Group of 20 (G20), excluding its last member, the EU. Each country was evaluated relative to others by an Economist Intelligence Unit analyst; categories and individual indicators are weighted according to assumptions of their relative importance. Details on the methodology, including weighting, can be found in the appendix of this paper.
Overall, the top five countries exhibiting cyber power, as measured by the index—the UK, the US, Australia, Germany, and Canada—illustrate that developed Western countries are leading the way into the digital era (see Tables 1 and 2). One reason for this is the depth of Internet penetration in these countries. In 2010, the percentage of households with access to the Internet in the developed world stood at 65.6 percent, over four times the penetration in the developing world. The top five performers also rate highly across the board, ranking in the top seven in all four categories.
The leading emerging market countries—Brazil, Russia, India and China (the BRICs)—have some room for improvement; out of the 19 economies, they rank 10th, 14th, 17th, and 13th, respectively. There is also a wide discrepancy between the top and the bottom of the index. The UK, the top performer, scores around three times the amount of points on a scale of 0 to 100 as the worst performer, Saudi Arabia. • •
2 Cyber Power Index: Findings and Methodology

Other key findings from the index include:
• germany’s comprehensive cyber policies are a key to its success. Germany leads the legal and regulatory framework category with a near perfect score (99.3 out of 100), followed by other Western countries that also performed well in the overall index. Germany is one of only five countries (the others being the UK, the US, France, and Japan) to have a comprehensive national cyber plan and a comprehensive cybersecurity plan.
• clear cybersecurity plans are absent in even some of the major economies. Several major economies have no cybersecurity plan at all. In fact, four major countries in the index do not have a cybersecurity plan and do not appear to be developing one (Argentina, Indonesia, Russia, and Saudi Arabia), while another seven are only now in the process of doing so. Yet a core component of a country’s cyber protection policy is a national cybersecurity plan.
• cyber poWer relies on a solid foundation that includes technical skills, high
educational attainment levels, open trade policies, and an innovative business
environment. The US has the most supportive economic and social context for fostering cyber power according to the index. This is driven by high tertiary educational enrollment, research and development (R&D) investment, and an open trade environment. Asia’s rising influence is also apparent in this category, as China leads the trade indicator, while Japan and South Korea fill the number one and two positions, respectively, in technical skills.
• prioritiZation of ict access is higher in the developed World. There is a clear divide between developed countries and emerging markets as measured by access to ICT. The UK, US, and Germany top the indicator, while Mexico, Indonesia, India, China, and South Africa have the lowest access scores. An exception is South Korea, which is fifth, despite having strong government policy towards improving access.
• the g20 countries exhibit limited technological progress Within key industries. Australia is the top performer within the industry application category, which measures the ability of different industries (energy, health, transportation, government, and e-commerce) to leverage ICT developments. As an indication of uneven technological development across industries, Australia ranks first in the category overall, but only leads within the e-health indicator.
Overall, the top five countries exhibiting cyber power, as measured
Cyber Power Index: Findings and Methodology 3

Rank CountRy SCoRe
1 United Kingdom 76.8
2 United States 75.4
3 Australia 71.0
4 Germany 68.2
5 Canada 66.6
6 France 61.8
7 South Korea 59.7
8 Japan 59.3
9 Italy 49.5
10 Brazil 38.6
11 Mexico 36.3
12 Argentina 35.4
13 China 34.6
14 Russia 31.7
15 Turkey 30.4
16 South Africa 30.2
17 India 28.3
18 Saudi Arabia 25.7
19 Indonesia 23.5
taBLe 1 overall Cyber Power Rankings Weighted sum of category scores (0-100 where 100=most favorable)
Source: Economist Intelligence Unit
According to the index, the UK, the US, Australia, Germany, and Canada illustrate that developed Western countries are leading the way into the digital era.
4 Cyber Power Index: Findings and Methodology

Rank CountRy SCoRe
1 United States 64.2
2 Japan 61.2
3 Australia 60.2
4 Canada 58.8
5 United Kingdom 56.0
6 South Korea 54.1
7 Germany 52.9
8 China 50.9
9 France 48.2
10 Russia 39.3
11 Mexico 35.5
12 Italy 34.3
13 Argentina 33.8
14 Brazil 31.1
15 Saudi Arabia 25.8
16 South Africa 24.5
17 Turkey 24.0
18 Indonesia 23.8
19 India 20.4
Rank CountRy SCoRe
1 Germany 99.3
2 United States 97.3
=2 United Kingdom 97.3
4 France 90.6
5 Japan 90.5
6 Australia 89.4
7 Canada 83.9
8 Italy 73.8
9 South Korea 63.8
10 South Africa 58.6
11 Brazil 57.5
12 Mexico 55.6
13 Argentina 52.7
14 India 49.8
15 Turkey 49.2
16 Russia 36.4
17 Indonesia 32.6
18 China 27.4
19 Saudi Arabia 27.2
taBLe 2 Rankings by Category
Source: Economist Intelligence Unit
“=” indicates a tie in rank
Cyber Power Index: Findings and Methodology 5
legal and regulatory frameworkWeighted 26.3% in the overall index
Germany leads the legal and regulatory framework category with a near perfect score (99.3 out of 100).
99.3%near perfect score
out of 100
economic and social contextWeighted 25.0% in the overall index

Rank CountRy SCoRe
1 Australia 66.5
2 South Korea 63.5
3 United States 62.3
4 Canada 61.5
5 United Kingdom 61.4
6 Germany 58.0
7 France 55.0
8 Italy 47.9
9 Japan 45.7
10 Brazil 35.9
11 China 33.3
12 Argentina 28.5
13 Russia 25.0
14 Mexico 24.1
15 Saudi Arabia 20.6
16 India 19.0
17 Turkey 15.9
18 Indonesia 9.3
19 South Africa 7.5
Rank CountRy SCoRe
1 United Kingdom 89.1
2 United States 75.3
3 Australia 66.6
4 Canada 61.1
5 Germany 60.6
6 South Korea 57.7
7 France 52.0
8 Italy 41.0
9 Japan 38.0
10 Turkey 29.9
11 Brazil 29.3
12 Saudi Arabia 28.5
13 Mexico 28.1
14 China 27.3
15 South Africa 26.9
16 Indonesia 26.3
17 Russia 25.5
=17 Argentina 25.5
19 India 22.2
6 Cyber Power Index: Findings and Methodology
taBLe 2 Rankings by Category (continued)
technology infrastructureWeighted 26.3% in the overall index
industry applicationWeighted 22.5% in the overall index
Source: Economist Intelligence Unit
“=” indicates a tie in rank

in policy circles, cyberspace is knoWn as the “fifth domain” (after land, sea, air, and space) and
is a topic of interest to organiZations and countries alike. For the purposes of this report, cyber power is defined as the ability to withstand cyber attacks and to deploy the digital infrastructure needed for a productive and secure economy. As such, governments around the world are increasingly interested in how to maximize cyber power. In the US, for example, president Obama, has declared the country’s digital infrastructure a “strategic national asset,” while the US Department of Defense has created the United States Cyber Command (USCYBERCOM), an agency tasked with defending the domain.
Introduction
As countries expand their cyber infrastructure, cybersecurity is becoming an increasing concern. In 2008, a secret spy network called GhostNet was discovered, which infiltrated high-value computers belonging to various governments in over 100 countries. More recently, in 2010, the Stuxnet virus purportedly became the first cyber attack with physical consequences to critical infrastructure, as it destroyed hundreds of Iranian nuclear centrifuges.
As global connectivity and cyber dependency are increasing, the index measures cyber power across the 19 countries of the G20 (the EU, which has been excluded from the index, being the 20th member). Combined, these countries contribute more than four-fifths of global GDP and contain two-thirds of the world’s population.
As Table 1 shows (see Executive Summary), developed markets are leading the way into the cyber age. The UK and the US are the clear winners in the Cyber Power Index, while other Western countries are not far behind, with Australia (3rd), Germany (4th), Canada (5th), and France (6th).
Most Asian countries find themselves in the middle band of the index, which include South Korea (7th); Japan (8th); and China (13th). Emerging markets’ cyber power lags their economic performance.
Brazil (10th), Russia (14th), India (17th), and China (13th), collectively known as the BRICs, and countries such as Indonesia (19th), South Africa (16th), and Turkey (15th), all part of the CIVETS (our acronym for Colombia, Indonesia, Vietnam, Egypt, Turkey, and South Africa), occupy the bottom half of the rankings. Saudi Arabia (18th) is also near the bottom.
This index is an attempt to gauge which countries within the G20 are doing well and which have yet to capitalize on cyber power in the digital age. Sound cyber policy, practice, and implementation are all required to score well across the four categories that compose this index: legal and regulatory framework; economic and social context; technology infrastructure; and industry application, each of which will be reviewed in turn.
The next section presents the cyber power rankings—overall and by category in a series of tables. The report then examines performance within these four categories of cyber power:
• Legal and Regulatory Framework• Economic and Social Context• Technology Infrastructure• Industry Application
Cyber Power Index: Findings and Methodology 7

Rank CountRy SCoRe
1 Germany 99.3
2 United States 97.3
=2 United Kingdom 97.3
4 France 90.6
5 Japan 90.5
6 Australia 89.4
7 Canada 83.9
8 Italy 73.8
9 South Korea 63.8
10 South Africa 58.6
Rank CountRy SCoRe
11 Brazil 57.5
12 Mexico 55.6
13 Argentina 52.7
14 India 49.8
15 Turkey 49.2
16 Russia 36.4
17 Indonesia 32.6
18 China 27.4
19 Saudi Arabia 27.2
this category is measured across five indicators:
• Government commitment to cyber development
• Cyber protection policies
• Cyber censorship (or lack thereof )
• Political efficacy
• Intellectual property protection
Legal and Regulatory Framework
taBLe 3 Legal and Regulatory Framework Rankings
Source: Economist Intelligence Unit, August 2011
“=” indicates a tie in rank
8 Cyber Power Index: Findings and Methodology
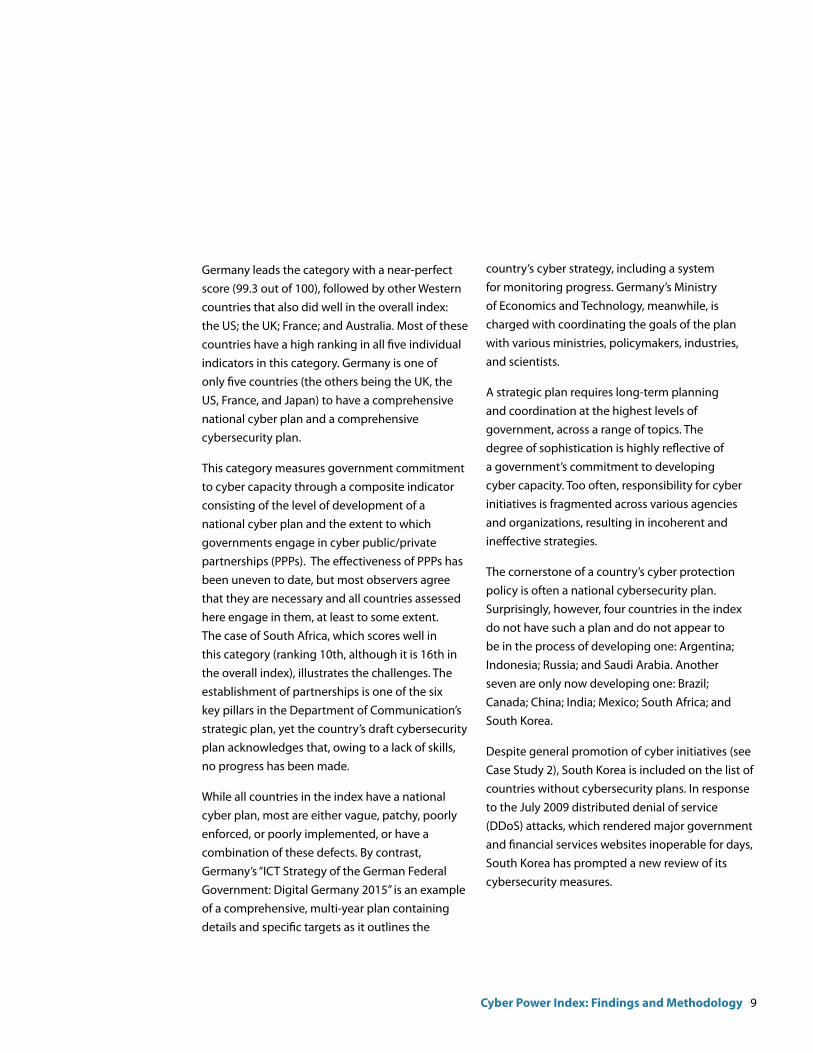
Germany leads the category with a near-perfect score (99.3 out of 100), followed by other Western countries that also did well in the overall index: the US; the UK; France; and Australia. Most of these countries have a high ranking in all five individual indicators in this category. Germany is one of only five countries (the others being the UK, the US, France, and Japan) to have a comprehensive national cyber plan and a comprehensive cybersecurity plan.
This category measures government commitment to cyber capacity through a composite indicator consisting of the level of development of a national cyber plan and the extent to which governments engage in cyber public/private partnerships (PPPs). The effectiveness of PPPs has been uneven to date, but most observers agree that they are necessary and all countries assessed here engage in them, at least to some extent. The case of South Africa, which scores well in this category (ranking 10th, although it is 16th in the overall index), illustrates the challenges. The establishment of partnerships is one of the six key pillars in the Department of Communication’s strategic plan, yet the country’s draft cybersecurity plan acknowledges that, owing to a lack of skills, no progress has been made.
While all countries in the index have a national cyber plan, most are either vague, patchy, poorly enforced, or poorly implemented, or have a combination of these defects. By contrast, Germany’s “ICT Strategy of the German Federal Government: Digital Germany 2015” is an example of a comprehensive, multi-year plan containing details and specific targets as it outlines the
country’s cyber strategy, including a system for monitoring progress. Germany’s Ministry of Economics and Technology, meanwhile, is charged with coordinating the goals of the plan with various ministries, policymakers, industries, and scientists.
A strategic plan requires long-term planning and coordination at the highest levels of government, across a range of topics. The degree of sophistication is highly reflective of a government’s commitment to developing cyber capacity. Too often, responsibility for cyber initiatives is fragmented across various agencies and organizations, resulting in incoherent and ineffective strategies.
The cornerstone of a country’s cyber protection policy is often a national cybersecurity plan. Surprisingly, however, four countries in the index do not have such a plan and do not appear to be in the process of developing one: Argentina; Indonesia; Russia; and Saudi Arabia. Another seven are only now developing one: Brazil; Canada; China; India; Mexico; South Africa; and South Korea.
Despite general promotion of cyber initiatives (see Case Study 2), South Korea is included on the list of countries without cybersecurity plans. In response to the July 2009 distributed denial of service (DDoS) attacks, which rendered major government and financial services websites inoperable for days, South Korea has prompted a new review of its cybersecurity measures.
Cyber Power Index: Findings and Methodology 9

Currently, only five countries enforce the Convention: the US; the UK; Italy; Germany; and France, although this is unsurprising, since it is mainly a regional initiative, even though it welcomes outside participation. International cyber agreements have generally been hard to achieve, owing to the varied nature of the topic, but renewed efforts are under way.
The International Telecommunications Union (ITU), a specialized agency of the UN, actively promotes cybersecurity around the world. For example, it supports the International Multilateral Partnership Against Cyber Threats (IMPACT), a global research and response center in Malaysia, of which more than 100 countries are members. Most recently, the UK and the US have made attempts to bring order into cyberspace while promoting an open environment (see Case Study 1).
The free flow of information is important at the international level, but also in individual countries. Therefore, the degree of cyber censorship is its own indicator in this category. China is frequently mentioned as an example when it comes to restrictions on access to information online. The country also ranks last, together with Saudi Arabia, in this indicator. In January 2010, for example, China and Google began a dispute over censorship rules and procedures, which the US company refused to follow. The ongoing dispute led Google to withdraw their search operations from mainland China, and the company now redirects requests through its Hong Kong site, an indication of the importance of the regulatory context to cyber activity.
In contrast, leaders in the index are frequently updating their plans in response to ongoing developments. For example, in response to the July 2009 attacks on neighboring South Korea, Japan quickly amended its Second National Strategy, originally intended to last through 2011, with the Information Security Strategy to Protect the Nation, on May 11, 2010.
Similarly, the UK, which published its Cyber Security Strategy of the United Kingdom, in 2009, is due to update its plan at the end of 2011. Germany, meanwhile, published its new Federal Cyber Security Strategy in early 2011; this builds on the country’s National Strategy Critical Infrastructure Protection (CIP Strategy) implementation plan. Among other measures, the new cybersecurity plan calls for the creation of a National Cyber Security Council that would co-ordinate initiatives among the public and private sectors. Other top scorers in the legal and regulatory framework category are also releasing plans this year; France did so in early 2011, while the US has several initiatives under way.
However, having a cybersecurity plan is only one aspect of ensuring a strong cyber protection policy overall. In the legal and regulatory framework category, additional areas include the existence of a cyber enforcement authority; the availability of cybersecurity laws, such as data privacy and computer misuse laws; and the response to cyber crime and countries’ international cybersecurity commitments. For the last indicator, the research examined whether countries are signatories to the Convention on Cybercrime, also known as the Budapest Convention on Cybercrime, after the city where the treaty was opened for signature in 2001.
10 Cyber Power Index: Findings and Methodology

c a s e s t u d y 1Toward an International Framework: The UK and the US Leading the Waythe uk and the us lead the g20 in cyber poWer and rank highly across all four categories that compose the index.
While both countries score virtually the same, various drivers account for their solid performance. Within technology infrastructure, for example, the UK is the clear winner and ranks almost 14 points ahead of second-place US. The UK’s performance is largely driven by strength in access, quality, and IT spending. Additionally, the US only slightly outperforms the UK when it comes to industry-specific ICT developments. However, the US clearly tops the economic and social context, whereas the UK ranks fifth in this area.
Both countries also rank high with regard to their legal and regulatory environments. Their commitment to cyber capacity puts them at the head of a list of only six economies that have a comprehensive national cyber plan and strong efforts underway to foster public/private partnerships (PPPs). The other four are Germany, France, Japan, and South Korea.
While the effectiveness of PPPs in improving cyber infrastructure is sometimes questioned, there is broad agreement that some form of collaboration is necessary. The benefits are illustrated by the two leaders in the index. Both the US Cyberspace Policy Review and the UK Cyber Security Strategy emphasize the priority of PPPs.
Collaborative international efforts are also increasingly important for the UK and the US, as they have the most to lose from their cyber reliance. In the context of a dearth of international standards, the two countries are stepping up efforts to create global norms.
In May 2011, the US published its International Strategy for Cyberspace, through which it seeks to “build and sustain an environment in which norms of responsible behavior guide states’ actions, sustain partnerships, and support the rule of law.” Similarly, the UK is set to host an international conference in late 2011 aimed at laying the basis for internationally agreed upon standards.
Whether the UK and the US can lead the world toward greater cooperation in cyberspace remains to be seen, but their cyber dependence necessitates their continuing effort. • •
Cyber Power Index: Findings and Methodology 11

Rank CountRy SCoRe
1 United States 64.2
2 Japan 61.2
3 Australia 60.2
4 Canada 58.8
5 United Kingdom 56.0
6 South Korea 54.1
7 Germany 52.9
8 China 50.9
9 France 48.2
10 Russia 39.3
Rank CountRy SCoRe
11 Mexico 35.5
12 Italy 34.3
13 Argentina 33.8
14 Brazil 31.1
15 Saudi Arabia 25.8
16 South Africa 24.5
17 Turkey 24.0
18 Indonesia 23.8
19 India 20.4
the economic and social context category measures:
• Educational levels
• Technical skills
• Openness of trade
• Degree of innovation in the business environment
Economic and Social Context
taBLe 4 economic and Social Context Rankings
Source: Economist Intelligence Unit
12 Cyber Power Index: Findings and Methodology

These elements provide a foundation for a well-functioning national cyber environment. However, most countries in the index have room for improvement in this category. In fact, scores within the economic and social context and industry application categories are markedly lower than the legal and regulatory framework and technology infrastructure categories.
Within the European G20 countries, only the UK placed in the top five in this category; Germany (7th), France (9th), and Italy (12th) find themselves in the middle. The US, in contrast, leads this category, driven by high tertiary enrollment, R&D investment, and an open trade environment. Moreover, four different countries—three from Asia, showing its rising influence—top each of the four indicators: Australia; China; Japan; and South Korea.
The education indicator, which is a composite of tertiary student enrollment and expected years of schooling, offers some surprises: Argentina is third and Russia fourth, both owing to strong scores in the gross enrollment ratio, which is the ratio of total enrollment—regardless of age—to the population of the age group that officially corresponds to the level of education. Australia, meanwhile, leads by a wide margin, owing to its strong score in expected years of schooling. In Australia, this number is 20, which is a significant three years more than South Korea, which ranks in second place.
Asia excels overall in the technical skills indicator, which is composed of labor productivity growth; the number of researchers in R&D; the number of
science and engineering (S&E) degrees; and English literacy. South Korea tops this indicator, with Japan in second and China fourth. Emerging markets, such as South Korea and China, do well primarily because of strong scores in labor productivity growth (for which the first five are all emerging markets: China; Argentina; Brazil; South Korea; and South Africa). Conversely, the bottom countries in this indicator are all developed countries: Australia is last, while France, the UK, and Italy are all close to the bottom.
Within the measure of technical skills, the number of S&E degrees as a percentage of total degrees is also dominated by emerging markets: China; India; Saudi Arabia; Turkey; and South Korea lead the way, while many Western countries find themselves at the bottom, including the UK (15th); Australia (16th); and the US (17th). The importance of S&E graduates to overall cybersecurity, however, has not gone unnoticed in the West. As part of its Commission on Cyber Security for the 44th Presidency, the Center for Strategic and International Studies (CSIS) released a report entitled A Human Capital Crisis in Cyber Security, which plainly notes the deficiency of technical expertise needed to design secure systems.
Unsurprisingly, the traditionally strong export economies, including China, lead the way in the trade indicator. In 2009, China’s total ICT exports accounted for 29.5 percent of the country’s total export sales and 24 percent of its import sales. After China, South Korea, the US, and Germany score third, fourth, and fifth, respectively. This list closely resembles the ranking of the world’s largest
Cyber Power Index: Findings and Methodology 13
Australia leads by a
wide margin in expected
years of schooling (20),
with South Korea a
close second.
Emerging markets
dominate the percentage
of science and
engineering degrees,
compared to
total degrees.

Surprisingly, the innovation environment—often described as an ideas economy and measured through R&D, patent filings, and private equity (PE) investment—is led by Japan, which has a clear lead over the fourth place US. While Japan ranks first in the sub-indicator for R&D as a percentage of GDP, it leads the indicator primarily because of the rate of its domestic patent filings; in 2009, Japan filed almost twice as many as the US, the runner-up country (2,743 filings per million population compared with 1,486).
this category measures:
• Access to information and communications technology
• Quality of information and communications technology
• Affordability of information and communications technology
• Spending on information technology
• Number of secure servers
Technology Infrastructure
merchandise exporters, according to 2010 data from the Economist Intelligence Unit. An exception is Mexico, which is a surprising second overall in this indicator. But Mexico scores well across all categories in this indicator: it is second in ICT exports; third in ICT imports, and tied for first in openness to trade (although eight countries hold this distinction). Mexico’s network of free-trade agreements (FTAs) and low tariffs help buoy its score in this indicator.
Compared with the economic and social context, where structural indicators such as education can take decades to improve, technology infrastructure can evolve rapidly. In 2002, for example, only 39 percent of EU 15 households had Internet access; by 2010 penetration had risen to 68 percent, according to Eurostat. The UK leads
the way in this category, propelling it into overall first position in the rankings. Its strength is also far-reaching, as it leads three out of the five indicators in this category: access; quality; and IT spending. Specifically driving the UK performance is its high Internet bandwidth speed, Wi-Fi penetration rate, and IT spending.
14 Cyber Power Index: Findings and Methodology
Mexico’s network of
free-trade agreements
(FTAs) and low tariffs
helped lift its trade
indicator ranking to #2.
The UK ranks #1 in
technology infrastructure
due to its high Internet
bandwidth speed, Wi-Fi
penetration rate, and
IT spending.

Online access is a precondition for participation in the digital era. Unfortunately, when it comes to access (measured by Internet penetration, mobile phone penetration, Wi-Fi hotspots, and social media usage), there is a clear divide between developed countries and emerging markets—where South Africa, India, and China have the lowest access rankings overall. South Korea, an emerging market, is the sole exception, which ranks in a solid fifth place for overall ICT access.
The US leads the Internet penetration sub-indicator, with an estimated 85 percent coverage. South Korea, a country that generally scores well in this area, is second, with 79 percent
coverage, followed by Canada, the UK, and Germany. Fewer than half of the countries in the index have Internet penetration rates above 50 percent, indicating that progress has been uneven across the world and that more needs to be done, particularly in emerging markets. India is last, with an Internet penetration rate of 4.5 percent. Even in China, which has seen strong economic growth over the past couple of decades, the rate is only 23 percent, an unexpectedly low figure given the number of users often cited as frequenting popular websites in the country.
Increasingly, however, mobile devices are replacing desktop computers as the primary means of
taBLe 5 technology Infrastructure Rankings
Source: Economist Intelligence Unit
Rank CountRy SCoRe
1 United Kingdom 89.1
2 United States 75.3
3 Australia 66.6
4 Canada 61.1
5 Germany 60.6
6 South Korea 57.7
7 France 52.0
8 Italy 41.0
9 Japan 38.0
10 Turkey 29.9
Rank CountRy SCoRe
11 Brazil 29.3
12 Saudi Arabia 28.5
13 Mexico 28.1
14 China 27.3
15 South Africa 26.9
16 Indonesia 26.3
17 Russia 25.5
18 Argentina 25.5
19 India 22.2
Cyber Power Index: Findings and Methodology 15

gaining online access. The rise of smart-phones and 3G networks that can carry data has allowed users in emerging markets in particular to find a new way to engage in the digital economy. This is a particularly interesting development, because it enables countries without a comprehensive ICT infrastructure to leapfrog others and reap the benefits quickly. Emerging markets have been the locus of particularly rapid growth of mobile access, albeit from a very low base. According to the ITU, there were almost 1 billion 3G mobile subscriptions at the end of 2010, across 143 countries. The mobile cellular penetration sub-indicator in this index illustrates the potential for emerging markets in this regard, as Russia ranks second; Saudi Arabia is fifth; Argentina is sixth; and South Africa is eighth.
Another way of getting online is through Wi-Fi hotspots, which are also increasingly common throughout the world, particularly in places such as libraries, public parks, and coffee shops. Free Wi-Fi has been an ongoing trend across the US for several years, as cities have scrambled to offer various forms of local access. But most Wi-Fi hotspots are now privately operated and, despite this prevalence, the US has fallen behind the UK, South Korea, and France.
The access indicator is rounded out by social media penetration, an area led by the US, Australia, and Turkey, which all have scores within one point of one another. While Turkey’s high social media penetration rate may be initially unexpected, the country’s young demographic partly explains this trend. China continues to block Western social networking sites, such as Facebook and Twitter, but it has its own equivalents. Despite the popularity
of these sites, which include Renren, Kaixon001, and Weibo (the latter has reportedly 200 million users alone), China is a surprising 17th in this sub-indicator, moderately ahead of only Japan and South Africa.
When it comes to affordability—an indicator comprising mobile phone tariffs and broadband Internet tariffs—India leads the way. The average mobile tariff is around 10 US cents/per minute, while the broadband tariff is US$14.90/per month. Compare this to the worst performers in each sub-indicator: Japan, where a call costs US$1.30/per minute and Argentina, where broadband costs US$61.40/per month. While there continue to be large differences between countries, broadband prices keep falling on average; there was a 42 percent drop between 2008 and 2009 alone, according to the ITU.
The number of secure servers per million people is also an important measure of cyber power, given the implications for safe online transactions. According to The Future of The Internet Economy Report 2011 from the OECD, six European OECD Internet users out of every ten are concerned about security and privacy. In fact, around one-third (35 percent) of EU users do not make online purchases owing to such concerns. While the number of secure servers will not resolve the issue, a more secure architecture may be able to build trust over time. Australia leads the G20 in this regard, followed by the US and the UK. Of particular note is the enormous discrepancy between countries. Australia has 1,761 secure servers per million, while middle-ranked Italy (ninth) has 154 and last placed China only has 1.9.
16 Cyber Power Index: Findings and Methodology
Russia ranks #2 in
the mobile cellular
penetration sub-
indicator, illustrating the
potential for emerging
markets to leapfrog other
countries benefitting
from a comprehensive
ICT infrastructure.

this category measures the depth and prevalence of digital infrastructure
across key sectors, Which include:
• Smart grids
• E-Health
• E-Commerce
• Intelligent transportation
• E-Government
Industry Application
Cyber Power Index: Findings and Methodology 17
taBLe 6 Industry application Rankings
Source: Economist Intelligence Unit
Rank CountRy SCoRe
1 Australia 66.5
2 South Korea 63.5
3 United States 62.3
4 Canada 61.5
5 United Kingdom 61.4
6 Germany 58.0
7 France 55.0
8 Italy 47.9
9 Japan 45.7
10 Brazil 35.9
Rank CountRy SCoRe
11 China 33.3
12 Argentina 28.5
13 Russia 25.0
14 Mexico 24.1
15 Saudi Arabia 20.6
16 India 19.0
17 Turkey 15.9
18 Indonesia 9.3
19 South Africa 7.5

c a s e s t u d y 2South Korea’s Cyber Development: A Study in Contradictionssouth korea, seventh out of 19 in the overall index, is a paradigm for the ability to seize digital opportunities while grappling with the challenges of uneven development. Its focus on promoting cyber activity, however, sets it apart from many others, as it provides a strong foundation for its recent economic development.
Starting in the 1990s, the country’s Ministry of Information and Communications (MIC) explicitly sought to develop a digital information society. After the 1997 Asian financial crisis, which greatly affected South Korea, the IT sector came to be considered as an engine for recovery and future growth, illustrated by the release of Cyber Korea 21 in 1999, one of the first national government cyber plans to create an information society.
The tradition continues today, as South Korea announced the 4th National “Informatization” Master Plan in November 2008, covering the period 2008-12. The plan looks broadly at informatization and defines it as the process of using communication technologies to further an information and knowledge society. Collectively, the informatization initiatives are a strong effort by the national government to develop cyber activity, although success to date—as measured by various international benchmarks—has been average for an OECD country. As reinforced by the Cyber Power Index, South Korea has succeeded in some areas, while it struggles in others to achieve its digital development goals.
According to the Cyber Power Index, South Korea has a 78 percent Internet penetration rate, the second highest in the G20 after the US. Unsurprisingly, then, South Korea led the world in the UN E-Government Development Index (EGDI) in 2010, having advanced from sixth place in 2008. Yet, even in South Korea, constituents do not utilize online services to any great extent. A 2010 article in The Korea Times shows that, while almost three-quarters of its citizens are aware of e-government, only around half actually use it.
Despite South Korea’s efforts, its scores in the other industry application indicators are also a study in contradiction. It leads the world in ITS and e-government. However, it ranks seventh in smart grids, sixth in online transactions, and fifth in e-health. Regarding the latter category, South Korea is looking to e-health as a potential growth engine for its economy, including plans to become a medical tourism destination. Again, the government has initiated a strong effort in the form of its high-profile healthcare project (or “U-health”), still in early stages.
While South Korea is a cyber pioneer in many respects, its legal and regulatory environment for cyber initiatives constrains its ranking in this index. • •
18 Cyber Power Index: Findings and Methodology

One measure of progress in the digital era is how traditional industries can leverage ICT to increase effectiveness and to meet new societal demands. However, while many national cyber plans prioritize technological investment, implementation is often uneven. For example, while Australia’s National Digital Strategy includes eight objectives intended to enhance digital engagement and target key areas of digital economy, smart-grid development has so far been limited. In fact, although Australia leads the industry application category, it only ranks first within the electronic health (e-health) indicator.
Smart grid implementation has been particularly strong in Europe, driven in part by initiatives from the EU, such as its Smart Grid policy (Energy End-Use Efficiency and Energy Services Directive [2006/32/EC]). Italy is not only aligned with this initiative, but has also been a pioneer in smart grid development since 2001. By the end of 2009, Italy had deployed almost 32 million smart meters, reaching around 85 percent of households. This can be compared with the US—another country with uneven development, whose Department of Energy announced in 2010 that there were only 2 million smart grid meters installed in the US.
Along with smart grid development, e-health initiatives are also increasingly gaining ground. These e-health programs look to leverage IT in the delivery of healthcare, most commonly through the use of electronic medical records (EMR), treatment from a distance (tele-medicine), and mobile health
(m-health) initiatives. Australia, which ranks towards the top of the e-health indicator, has invested heavily in digitizing the healthcare space since the late 1990s.
Those familiar with the UK National Health Service’s (NHS) Connecting for Health program, known as the world’s largest civil IT project, will be surprised that the country leads the G20 in this area. Billions of pounds over budget and years behind target, the failures of the Connecting for Health program are well-publicized. A 2011 EU e-Health Benchmarking report from two consultancies, Deloitte and Ipsos Belgium, noted that “The National Health Service has over the years been beset by numerous problems in its implementation of e-health.” As the UK lags world leaders, particularly the Scandinavian countries, it does not warrant a perfect score in e-health.
Conversely, the e-commerce indicator—a composite measure consisting of businesses placing orders online, individuals placing orders online, and individual use of online banking—contains no surprises, as it is closely correlated to the overall score of the index (0.92). The top five countries in this indicator are the same as in the overall index, just in a different order: the US is at the top, followed by Canada, the UK, Germany, and Australia.
The use of ICT in vehicles or physical infrastructure is also known as intelligent transportation systems (ITS) and includes such measures as GPS systems; electronic tolls; variable speed limits, dynamic traffic
Japan, which invests US$700 million annually inITS, leads the world, according to the Information
Technology and Innovation Foundation.
Cyber Power Index: Findings and Methodology 19
Although Australia
leads the industry
application category, it
only ranks first within
the electronic health
e-health indicator.
Italy leads the
G20 in smart grid
development.

20 Cyber Power Index: Findings and Methodology
Conclusion
capitaliZing on the cyber era results in tWo conflicting trends:
greater poWer, alongside greater vulnerability. At one end of the scale are Indonesia and Saudi Arabia, countries that have yet to capitalize on cyber benefits. While dependency is low, they also have vague and poorly enforced national cyber plans and no cybersecurity plans at all, leaving them vulnerable, but with few benefits. At the other end of the scale are those capitalizing most effectively on the digital era: the UK and the US, both of whom have several strong cyber plans in place, necessitated by strong reliance on ICT, including Internet penetration rates above 75 percent. But with their rising dependency comes new challenges, and they are now leading the way in developing international norms and standards in cyberspace to secure the domain.
Cyber power is maximized when a digital infrastructure is not only in place to enhance productivity, but is also protected—the ability to withstand attacks is increasingly important to secure a digital economy. Despite recent efforts, however, a lack of international agreements and standards necessitates new initiatives to secure the domain—particularly for those countries reaping the most digital benefits, as they are also most at risk. • •
lights; and advanced notification and tracking systems. Japan and South Korea are tied for first place in this indicator (for South Korea, also Case Study 2 for more information on South Korea’s first-place ranking).
According to the Information Technology and Innovation Foundation, Japan, which invests US$700 million annually in ITS, leads the world in this indicator. Japan is also continuing its efforts in this area by enhancing the current infrastructure and applying ITS to its entire public transportation system, including a bus-location system.
To measure e-government, the index relies on the UN Online Service Index (OSI). E-government is important beyond the delivery of information and services, as it also increases accountability, productivity, and transparency in the public sector. Because of a long-term vision and commitment in this regard, South Korea leads the world in this indicator, followed by the US, Canada, the UK, and Australia—five countries that have all embraced the integrated portal concept, wherein government services are found through a central website, as opposed to having users find the service they want by looking through several sites.
The goal of the Cyber Power Index is to benchmark the ability of the G20 countries to withstand cyber attacks and to deploy the digital infrastructure needed for a productive and secure economy. In doing so, the index measures the success of digital uptake, and the quality of the legal and regulatory environment in promoting cybersecurity. To achieve this goal, the index was constructed
Appendix I: Methodology
categories and indicators Were selected on the basis of expert analysis
performed by the economist intelligence unit. The four category scores are calculated from the mean of underlying indicators and scaled from 0-100, where 100=most favorable. These categories are: Legal and Regulatory Framework; Economic and Social Context; Technology Infrastructure; and Industry Application. Each category features three to seven underlying indicators. The overall score for the Cyber Power Index (from 0-100) is calculated from a simple average of the category and indicator scores.
Scoring Criteria and Categories
Cyber Power Index: Findings and Methodology 21
as an interactive quantitative and qualitative scoring model and consists of four categories and 39 sub-indicators, which evaluate specific attributes of cyber power.
Refer to Appendix II for details on indicator definitions.

Data for the quantitative indicators are drawn from national and international statistical sources. Where quantitative data were missing, the Economist Intelligence Unit made estimates. The main sources used in the Cyber Power Index are: the Economist Intelligence Unit; the UN Educational, Scientific and Cultural Organization (UNESCO); the International Telecommunications Union (ITU); and the World Bank.
22 Cyber Power Index: Findings and Methodology
the categories and indicators are:
legal and regulatory frameWork
• Government commitment to cyber development
• Nationalcyberplan
• Public/privatepartnerships
• Cyber protection policy
• Cyberenforcementauthority
• Cybersecuritylaws
• Cybercrimeresponse
• Internationalcybersecuritycommitments
• Cybersecurityplan
• Cyber censorship
• Political efficacy
• Intellectual property protection
economic and social context
• Educational levels
• Tertiarystudentenrollmentasapercentageof
total enrollment
• Expectedyearsofeducation
• Technical skills
• Laborproductivitygrowth
• Researchersinresearchanddevelopmentper
million people
• Scienceandengineeringdegrees
• Englishliteracy
• Trade
• Informationandcommunicationstechnology
exports as a percentage of total exports
• Informationandcommunicationstechnology
imports as a percentage of total imports
• Opennesstotrade
• Innovation environment
• Researchanddevelopmentasapercentageof
gross domestic product
• Domesticpatentfilings
• Privateequityandventurecapitalasapercentage
of gross domestic product
technology infrastructure
• Access to information and
communications technology
• Internetpenetration
• Mobilecellularpenetration
• Wi-Fihotspotspermillionpeople
• Socialmediapenetration
• Quality of information and
communications technology
• Fixedbroadbandsubscribersper100inhabitants
• InternationalInternetbandwidth
• Information technology spending as apercentage
of gross domestic product
• Affordability of information and
communications technology
• Mobilephonetariffs
• BroadbandInternettariffs
• Secure servers
industry application
• Smart grids
• E-Health
• E-Commerce
• BusinessesplacingordersviatheInternetasa
percentage of business using the Internet
• IndividualsplacingordersviatheInternetasa
percentage of Internet users
• IndividualuseofInternetbankingasapercentage
of Internet users
• Intelligent transportation
• E-Government
Data Sources
aSIa-PaCIFIC WeSteRn euRoPe
eaSteRn euRoPe & CentRaL aSIa aMeRICaS MIddLe eaSt
& aFRICa
Australia France Russia Argentina Saudi Arabia
China Germany Turkey Brazil South Africa
India Italy Canada
Indonesia United Kingdom Mexico
Japan United States
South Korea
Based on economic importance, the 19 countries of the G20 were selected by the Economist Intelligence Unit. (The 20th member, the EU, was excluded from analysis.) They are:
Country Selection
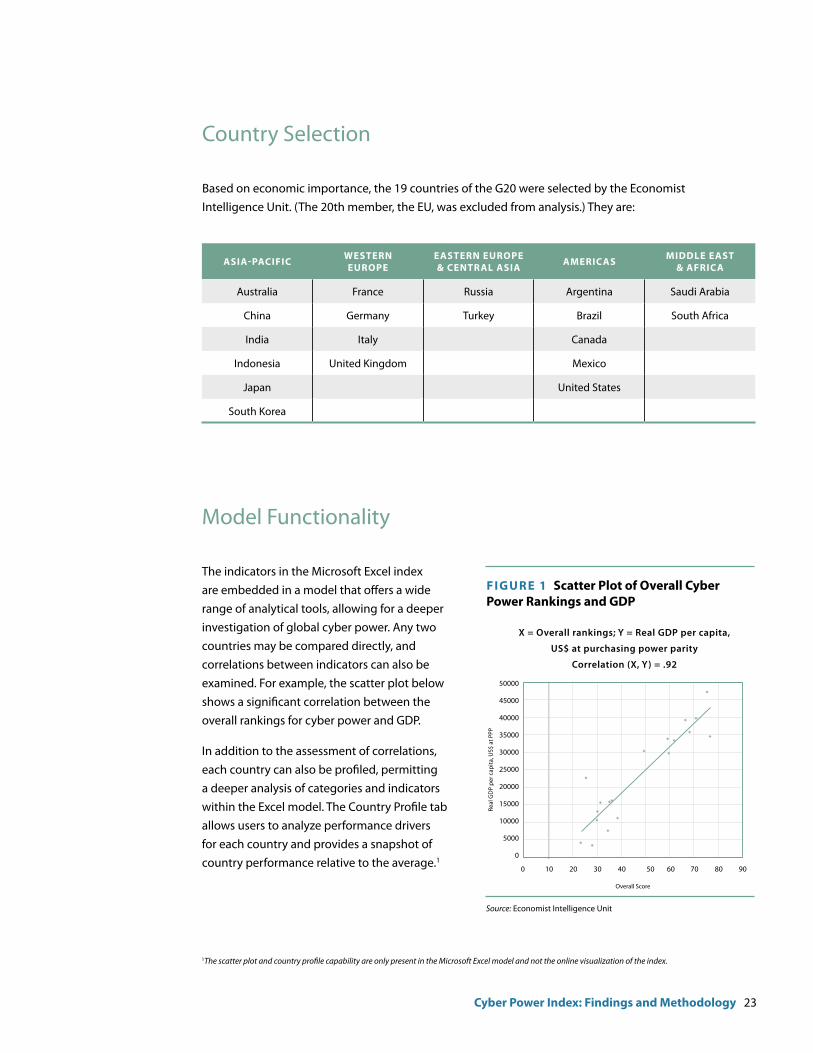
The indicators in the Microsoft Excel index are embedded in a model that offers a wide range of analytical tools, allowing for a deeper investigation of global cyber power. Any two countries may be compared directly, and correlations between indicators can also be examined. For example, the scatter plot below shows a significant correlation between the overall rankings for cyber power and GDP.
In addition to the assessment of correlations, each country can also be profiled, permitting a deeper analysis of categories and indicators within the Excel model. The Country Profile tab allows users to analyze performance drivers for each country and provides a snapshot of country performance relative to the average.1
Model Functionality
1The scatter plot and country profile capability are only present in the Microsoft Excel model and not the online visualization of the index.
FIguRe 1 Scatter Plot of overall CyberPower Rankings and gdP
Source: Economist Intelligence Unit
Cyber Power Index: Findings and Methodology 23
x = overall rankings; y = real gdp per capita,
us$ at purchasing power parity
correlation (x, y) = .92
50000
45000
40000
35000
30000
25000
20000
15000
10000
5000
0
0 10 20 30 40 50 60 70 80 90
Real
GD
P pe
r cap
ita, U
S$ a
t PPP
Overall Score

Cyber Power Categories
Legal and Regulatory Framework 26.3%
economic and Social Context 25.0%
technology Infrastructure 26.3%
Industry application 22.5%
Legal and Regulatory Framework
Government commitment to cyber development 27.1%
Cyber protection policy 24.0%
Cyber censorship 15.5%
Political efficacy 15.5%
Intellectual property protection 17.8%
economic and Social Context
Educational levels 25.2%
Technical skills 27.4%
Trade 17.3%
Innovation environment 30.1%
technology Infrastructure
ICT Access 20.3%
ICT Quality 21.9%
IT Spending 20.3%
ICT Affordability 11.7%
Secure servers 25.8%
Industry application
Smart grids 21.1%
E-Health 16.2%
E-Commerce 30.4%
Intelligent transportation 21.1%
E-Government 11.3%
The weighting assigned to each category and indicator can be changed to reflect different assumptions about their relative importance. Two sets of weighting are provided in the Excel index. The default weighting is set to the expert-defined weighting. Under this option, expert members of a peer panel convened in May 2011 and provided their input on the relative value of each category and indicator. The model includes the average weighting suggested by the experts. The second option, called neutral weighting, assumes equal importance of all indicators and evenly distributes weighting. The expert weighting is shown in Figure 2.
Weighting
FIguRe 2 expert Weighting Values
Source: Economist Intelligence Unit
24 Cyber Power Index: Findings and Methodology

Modeling the indicators and categories results in scores of 0-100 for each country, where 100 represents the greatest cyber power and 0 the least. The overall score, as well as the category scores, are averages of the normalized scores for each of the indicators. The 19 economies assessed can then be ranked according to these scores. Indicator scores are normalized and aggregated across categories to enable a comparison of broader concepts across countries. Normalization rebases the raw indicator data to a common unit so that it can be aggregated.
The indicators for which a higher value means a more favorable cyber power environment—such as real GDP growth or R&D expenditure—have been normalized on the basis of:
x = (x - min(x)) / (max(x) - min(x))
where Min(x) and Max(x) are, respectively, the lowest and highest values in the 19 economies for any given indicator. The normalized value is then
Data Modeling
transformed from a 0-1 value to a 0-100 score, to make it directly comparable with other indicators. This in effect means that the country with the highest raw data value will score 100, while the lowest will score 0.
For the indicators for which a high value means an unfavorable environment—such as mobile phone tariffs or broadband Internet tariffs—the normalization function takes the form of:
x = (x - max(x)) / (max(x) - min(x))
where Min(x) and Max(x) are, respectively, the lowest and highest values in the 19 economies for any given indicator. The normalized value is then transformed into a positive number on a scale of 0-100 to make it directly comparable with other indicators.
Cyber Power Index: Findings and Methodology 25

Appendix II: Indicator Sources and Definitions
Legal and Regulatory Framework
IndICatoR SouRCe yeaR IndICatoR deFInItIon and ConStRuCtIon
National cyber plan
Economist Intelligence Unit
2011
This indicator measures whether there is a national cyber plan with targets and deadlines. The scoring for this indicator is as follows: 0 = No;1 = No, but plan is being developed;2 = Yes, but plan is vague or is poorly enforced;3 = Yes, but plan is not comprehensive or has a few shortcomings in implementation;4 = Yes, plan is comprehensive and has specific targets and deadlines.
Public/private partnerships
Economist Intelligence Unit
2011
This indicator measures whether the government engages in public/private partnerships (PPPs). The scoring for this indicator is as follows:0 = Cyber-related PPPs do not exist;1 = Government makes limited efforts to partner with private sector;2 = Active, but uneven efforts;3 = Above-average efforts;4 = Strong efforts.
Cyber enforcement
authority
Economist Intelligence Unit
2011
This indicator measures whether there is a central cyber enforcement authority. The scoring for this indicator is as follows:0 = No central enforcement authority or collaboration across agencies;1 = No central enforcement exists, but there is minimal collaboration across agencies;2 = No central enforcement exists, but there is moderate collaboration across agencies;3 = Central agency exists with shortcomings in enforcement;4 = Central enforcement agency exists with evidence of strong enforcement.
Cybersecurity laws
Economist Intelligence Unit
2011
This indicator measures whether the country passed national cybersecurity laws, such as data privacy and computer-misuse laws. The scoring for this indicator is as follows:0 = No cybersecurity laws exist;1= A few laws exist, but are not enforced;2 = A few laws exist, with moderate enforcement;3 = Several laws exist and are adequately enforced;4 = Laws cover all main areas of cybersecurity and are strictly enforced.
26 Cyber Power Index: Findings and Methodology

Cyber Power Index: Findings and Methodology 27
IndICatoR SouRCe yeaR IndICatoR deFInItIon and ConStRuCtIon
Cyber crime response
Economist Intelligence Unit
2011
This indicator measures whether the country has a CERT security response team in place and actively responds to cyber crime. The scoring for this indicator is as follows:0 = No;1 = Minimal or limited response;2 = Uneven response;3 = Above-average response;4 = Strong response.
International cybersecurity commitments
Economist Intelligence Unit
2011
This indicator measures whether a country is a signatory to an international commitment on cybersecurity, with particular consideration to the Convention on Cybercrime, also known as the Budapest Convention on Cybercrime. The scoring for this indicator is as follows:0 = No;1 = Acceding;2 = Signatory;3 = Ratified;4 = In force.
Cybersecurity plan
Economist Intelligence Unit
2011
This indicator measures whether the country has a cybersecurity plan with explicit targets. The scoring for this indicator is as follows:0 = No;1 = No, but plan is being developed;2 = Yes, but plan is vague;3 = Yes, but plan is not comprehensive;4 = Yes, plan is comprehensive and has specific targets and deadlines.
Cyber censorshipFreedom House, Freedom on the
Net 20112011
The scoring for this indicator is as follows:2 = Free (0–11 points);1 = Partly free (12–23 points);0 = Not free (24–35 points).
Political efficacyEconomist
Intelligence Unit Risk Briefing
2010
A composite score measured on a scale of 0–100, which measures effectiveness of policy formulation; quality of bureaucracy; excessive bureaucracy/red tape; vested interests/cronyism; corruption; accountability of public officials; and human rights.
Intellectual property
protection
Economist Intelligence Unit
Risk Briefing2010
A measure of the strength of intellectual property protection measured on a scale of 0–4, where 0=best.
Legal and Regulatory Framework (continued)

Economic and Social Context
28 Cyber Power Index: Findings and Methodology
IndICatoR SouRCe yeaR IndICatoR deFInItIon and ConStRuCtIon
Tertiary student enrollment as a percentage of
total enrollment
UN Educational, Scientific
and Cultural Organization
Latest year available, between 2006 and
2010, unless
otherwise indicated in the model
The percentage of the 18–22 age group, who are enrolled full-time in tertiary education.
Expected years of education
UN Educational, Scientific
and Cultural Organization
Between 2008 and
2009, unless
otherwise indicated in the model
The total number of years of schooling (primary to tertiary) that a child of a certain age can expect to receive in the future, assuming that the probability of his or her being enrolled in school at any particular age is equal to the current enrollment ratio for that age.
Labor productivity
growth
Economist Intelligence Unit
2010Efficiency of labor, measured in terms of output per worker (real GDP per person employed). This indicator is measured as the percentage change between 2009 and 2010.
Researchers in research and
development per million people
UN Educational, Scientific
and Cultural Organization
Latest year available, between 2006 and
2008, unless
otherwise indicated in the model
Researchers in R&D are professionals engaged in the conception or creation of new knowledge, products, processes, methods, or systems, and in the management of the projects concerned. Postgraduate doctoral students (ISCED97 level 6) engaged in R&D are included.
Science and Engineering degrees as a
percentage of total degrees
awarded
Organisation for Economic
Co-operation and Development;
UN Educational, Scientific
and Cultural Organization;
National Science Foundation; Economist
Intelligence Unit
Latest year available, between 2006 and
2010
The OECD definition of science degrees includes: life sciences; physical sciences; mathematics and statistics; and computing. The OECD definition of engineering degrees includes: engineering and engineering trades; manufacturing and processing; and architecture and building.
English literacyEducation First;
Economist Intelligence Unit
2011
The scoring for this indicator is as follows:0 = Very low proficiency;1 = Low proficiency;2 = Moderate proficiency;3 = High proficiency;4 = Very high proficiency.

Cyber Power Index: Findings and Methodology 29
IndICatoR SouRCe yeaR IndICatoR deFInItIon and ConStRuCtIon
Information and communication
technology exports as a
percentage of total exports
UN Comtrade 2009ICT exports include telecommunication, audio and video, computer-related equipment, and electronic components, among other ICT goods. Software is excluded.
Information and communication
technology imports as a
percentage of total imports
UN Comtrade 2009ICT imports include telecommunication; audio and video; computer-related equipment; and electronic components, among other ICT goods. Software is excluded.
Openness to trade
Economist Intelligence
Unit Business Environment
Rankings
2010This indicator is measured on a scale of 0–5, where 5=best, and represents for trade as a percentage of GDP.
Research and development
expenditure as a percentage of gross domestic
product
UN Educational,Scientific and
CulturalOrganization
Latest year available, between 2006 and
2008, unless
otherwise indicated in the model
R&D expenditure includes current and capital expenditure on creative, systematic activity that increases the country’s stock of knowledge.
Domestic patent filings per million
people
World Intellectual Property
Organization
2009, unless
otherwise indicated in the model
A patent filing is defined as the procedure for requesting IP protection at an IP office. The resident filing refers to an application filed with the Office of, or acting for, the State, in which the first-named applicant in the application concerned has residence.
Private equity and venture capital as a percentage of gross domestic
product
Organisation for Economic
Co-operation and Development;
National Venture Capital
Associations; Economist
Intelligence Unit
2010, unless
otherwise indicated in the model
Private equity is defined as securities that are not listed on a public exchange and is taken as a percentage of gross domestic capital. Venture capital is considered a sub-set of private equity.
Economic and Social Context (continued)

Technology Infrastructure
30 Cyber Power Index: Findings and Methodology
IndICatoR SouRCe yeaR IndICatoR deFInItIon and ConStRuCtIon
Internet penetration
International Telecommunications
Union; Economist Intelligence Unit
2008
This indicator measures Internet users per 100 people. It also includes subscribers who pay for Internet access (dial-up, leased line, and fixed broadband) and people with access to the worldwide computer network without paying directly, either as the member of a household, or from work or school.
Mobile cellular penetration
Economist Intelligence
Unit Technology Indicators
2008
This indicator measures mobile cellular subscriptions per 100 people. It also includes the number of subscriptions to a public mobile telephone service using cellular technology, which provides access to the Public Switched Telephone Network. Post-paid and prepaid subscriptions are included.
Wi-Fi hotspots per million
peopleJiWire 2011
This indicator measures the penetration of wireless hotspots, derived from JiWire’s database of 636,927 free and paid Wi-Fi locations in 142 countries.
Social media penetration
comScore; Economist
Intelligence Unit 2010
This indicator measures social media users as a percentage of Internet users.
Fixed broadband subscriber
lines per 100 inhabitants
Economist Intelligence
Unit Technology Indicators
2010 data, unless
otherwise indicated in the Global Dynamism
Index
Subscriber lines with a transmission speed greater than 128 Kbps per 100 people. Subscriber lines include primary rate interface (PRI) ISDN connections; xDSL connections; cable modem and cable telephony connections; and high-speed fixed wireless connections.
International Internet
bandwidth
International Telecommunication
Union and TeleGeography
2009This indicator is defined as the capacity of backbone operators to carry Internet traffic.
Information technology
spending as a percentage of
gross domestic product
Economist Intelligence
Unit Technology Indicators
2010This indicator measures total IT spending on packaged software, hardware, and IT services as a percentage of gross domestic product.
Mobile phone tariffs
World Economic Forum; International Telecommunications
Union
2008
This indicator measures average per-minute cost of various mobile cellular calls, and is used as a measure of ICT affordability. Tariffs are expressed in international dollars, adjusted for purchasing power parity.
Broadband Internet tariffs
World Economic Forum; International Telecommunications
Union
2008
This indicator measures the residential monthly fee of fixed broadband tariffs and is used as a measure of ICT affordability. Tariffs are expressed in international dollars, adjusted for purchasing power parity.

Industry Application
Cyber Power Index: Findings and Methodology 31
IndICatoR SouRCe yeaR IndICatoR deFInItIon and ConStRuCtIon
Secure servers Netcraft
Latest available
year, 2009 or 2010
This indicator measures the number of servers using encryption technology for Internet transactions.
IndICatoR SouRCe yeaR IndICatoR deFInItIon and ConStRuCtIon
Smart gridsEconomist
Intelligence Unit 2011
The scoring for this indicator is as follows:0 = Smart grids do not exist within the country;1 = Plans for grid modernization are underway;2 = Smart grids are moderately, but unevenly, developed;3 = Smart grids are well-developed;4 = Smart grids are highly advanced and are widely deployed geographically.
E-HealthEconomist
Intelligence Unit 2011
E-Health initiatives include the development of electronic medical records, tele-medicine provision, and mobile health delivery. The scoring for this indicator is as follows:0 = E-Health technology does not exist within the country;1 = Minimal e-Health infrastructure exists;2 = Moderately deployed, yet unevenly integrated across common avenues;3 = Deployed across most common avenues;4 = Well-developed and integrated across all common avenues.
Businesses placing orders via
the Internet
UN Conference on Trade and
Development; Organisation for Economic
Co-operation and Development;
Economic Intelligence Unit
Latest year available, between 2006 and
2010
This indicator is measured as the percentage of business Internet users. The scoring for this indicator is as follows:0 = 0–9%;1 = 10–24%;2 = 25–39%;3 = 40–54%;4 = 55%+.
Individuals placing orders via
the Internet
UN Conference on Trade and
Development; Organisation for Economic
Co-operation and Development;
Economic Intelligence Unit
Latest year available, between 2007 and
2010
This indicator is measured as the percentage of Internet users. The scoring for this indicator is as follows:0 = 0–19%;1 = 20–39%;2 = 40–59%;3 = 60–79%;4 = 80%+.
Technology Infrastructure (continued)

Industry Application (continued)
Background Indicators
32 Cyber Power Index: Findings and Methodology
IndICatoR SouRCe yeaR IndICatoR deFInItIon and ConStRuCtIon
Real gross domestic product,
US$ at PPP
Economist Intelligence Unit
Country data2010
This indicator measures real gross domestic product at purchasing power parity, divided by the population.
Real gross domestic product
growth
Economist Intelligence Unit
Country data2010
Percentage change of gross domestic product over 3 years, from 2007 to 2010. The underlying gross domestic product data are calculated at constant market prices, rebased to 2005 constant prices and translated into US$ using the LCU:$ exchange rate in 2005.
Human development
indexUN 2010
UN composite index that measures development progress by combining indicators of life expectancy, educational attainment and income. This indicator is measured on a scale of 0 to 1, where 0=low human development and 1=very high human development.
Gini coefficient World Bank
Latest year available, 2007 or
2008
This indicator assesses the level of inequality and is measured on a scale of 0 to 100, where 100=perfect equality.
IndICatoR SouRCe yeaR IndICatoR deFInItIon and ConStRuCtIon
Individual use of Internet banking
UN Conference on Trade and
Development; Organisation for Economic
Co-operation and Development;
Economic Intelligence Unit
Latest year available, between 2007 and
2010
This indicator is measured as the percentage of Internet users. The scoring for this indicator is as follows:0 = 0–19%;1 = 20–39%;2 = 40–59%;3 = 60–79%;4 = 80%+.
Intelligent transportation
Economist Intelligence Unit
2011
Intelligent transportation systems include a range of measures, from simple GPS systems to advanced sensor technology, leading to inventions such as electronic tolls; variable speed limits; dynamic traffic lights; and advanced notification and tracking systems. The scoring for this indicator is as follows:0 = Intelligent transportation systems do not exist within the country;1 = Plans are underway or minimal intelligent transportation systems exist;2 = Moderately deployed, yet unevenly integrated across common avenues;3 = Deployed across most common avenues;4 = Well-developed, and integrated across all common avenues.
E-GovernmentUN Online
Services Index2010
This indicator measures the quality, scope, and utility of online services. It is measured on a scale of 0–1, where 0=low provision of online services and 1=high provision of online services.

About Booz Allen HamiltonbooZ allen hamilton is a leading provider of management and technology consulting services to the US government in defense, intelligence, and civil markets, and to major corporations, institutions, and not-for-profit organizations. Booz Allen is headquartered in McLean, Virginia, employs more than 25,000 people, and had revenue of $5.59 billion for the 12 months ended March 31, 2011.
Booz Allen understands that cybersecurity is no longer just about protecting assets. It’s about enabling organizations to take full advantage of the vast opportunities that the ecosystem of cyberspace now offers for business, government, and virtually every aspect of our society.
Those opportunities can be imperiled, however, by rapidly emerging cyber threats from hackers (hacktivists), organized crime, nation states, and terrorists. We help our clients in both business and government understand the full spectrum of threats and system vulnerabilities, and address them effectively and efficiently.
Booz Allen believes the key to cybersecurity today is integration—creating a framework that “thinks bigger” than technology to encompass policy, operations, people, and management. Through this Mission Integration Framework, organizations can align these essential areas to address the real issues, and develop cyber strategies and solutions that keep pace with a fast-changing world.
to learn more, visit www.boozallen.com. (nySe: BaH)
Cyber Power Index: Findings and Methodology 33
About the Economist Intelligence Unitthe economist intelligence unit is par t of the economist group, the leading source of analysis on international business and world affairs. Founded in 1946 as an in-house research unit for The Economist newspaper, we deliver business intelligence, forecasting and advice to over 1.5m decision-makers from the world’s leading companies, financial institutions, governments and universities. Our analysts are known for the rigour, accuracy and consistency of their analysis and forecasts, and their commitment to objectivity, clarity and timeliness.

An Economist Intelligence Unit research program sponsored by Booz Allen Hamilton
©2011 Booz Allen Hamilton Inc.