cyber benefits and risks - home | pardee center for ... risk pardee... · cyber benefits and risks:...
TRANSCRIPT
Cyber Benefits and Risks:
Quantitatively Understanding and Forecasting the Balance
Extended Project Report from the
Frederick S. Pardee Center for International Futures Josef Korbel School of International Studies
University of Denver www.pardee.du.edu
September 2015
Barry B. Hughes, David Bohl, Mohammod Irfan, Eli Margolese-Malin, and José Solórzano
In project collaboration with
and the

Cyber Risk Extended Report 2
Table of Contents
Executive Summary 4 Conceptualizing Benefits and Costs 4 Using the IFs System for Analysis 4 Background Research Foundations 5 Forecasts and Findings 9 Conclusion 11 A Final Note on Study Contributions 12
1. Introduction: Understanding and Anticipating Change in the Benefits and Costs of Cyber Technology 13
2. ICT and Cyber Development Indices 18 Indices Replicated in the IFs Forecasting System 18
ICT Development Index 18 Global Cybersecurity Index 19
Additional Indices of Importance in Cyber Security Analyses 21 Digitization Index 21 Digital Economy Ranking Index 21 Networked Readiness Index 22
3. Benefits 23 Competing Schools of Thought on Economic Benefits 23
Pessimism Versus optimism concerning ICT’s economic production impacts 23 ICT as a general-purpose technology 25
ICT’s Economic Impact: The Production Side 26 ICT as a growth sector in the economy 26 ICT investment and capital services 29 ICT and multifactor productivity 32
Comparing the Productivity Impacts of GPTs: Steam, Electricity, ICT 33 Variation in ICT Impact across Time/Pervasiveness and Countries 36
Drivers of variation in ICT impact: ICT (especially broadband) pervasiveness 36 Drivers of variable ICT impact: Beyond PCs and broadband 39 Drivers of variable ICT impact: Country development level 41
Consumer Surplus 42 Consumer surplus forecasts 46
Summary of Knowledge Concerning Cyber Risk Benefits: Modeling Implications 47
4. Costs 49 Spendingon risk mitigation 49
The cybersecurity industry 50 National cyber defense spending 51 Cyber insurance 53 General comments on cyber security spending 53
Adverse Cyber Events: Micro Analysis 53 The cyber system itself 54 Beyond the internet 55 The evidence from actual events 56 Model-based analyses 57

Cyber Risk Extended Report 3
Very large-scale events 59 Adverse Cyber Events: Macro Analysis 60
Defining motivations, actions, actors and targets 60 Estimating probability of adverse cyber events 63 The debate around cyberwar occurrence/probability 64 General comments on probabilities of adverse events 65 Measuring costs of adverse events 66 Bringing probabilities and costs together: The Cyber Risk Matrix 69
Opportunity Costs 72 Summary of Knowledge Concerning Cyber Risk Costs: Modeling Implications 73 Comparing the Costs and Benefits of ICT/Cyber 74
5. Structure of Cyber Risks and Benefits Representation in IFs 77 Forecasting Cyber Risks and Benefits 77 ICT or Cyber Pervasiveness 78 Security Spending and Security Levels 79 Adverse Event Probabilities and Costs 81 Cyber Contributions to Economic Growth (Productivity) and Possible Opportunity Costs of Underutilizing ICT 84 Cyber Benefits: Consumer Surplus 88 Cyber Benefits: ICT Production Sector Growth 89 ICT/Cyber Total and Cumulative Costs and Benefits 90 Cyber Benefits and Costs: Forward Linkage to Economic Productivity 91
6. Forecasting of Cyber Benefits and Risk-Related Costs 93 Base Case Analysis 93
ICT/cyber pervasiveness 93 ICT/cyber benefits 94 ICT/cyber costs 96 Comparing cyber benefits and costs 100
Scenarios of Cyber Benefits and Costs: Foundational Analysis 103 Scenarios of Cyber Benefits and Costs: Defining a Scenario Space 107 Scenarios of Cyber Benefits and Costs: Exploring the Alternative Futures 109
7. Conclusions 115
Acknowledgments 116
Bibliography 117 Works Cited 117 Additional Works Consulted 124
Appendices 126 Appendix A: The Cyber Risk Dashboard Concept (Final May Differ Somewhat) 126 Appendix B: Productivity Impacts of ICT 129
MFP Physical Capital Equations 130 Appendix C: Cyber Risk Form in IFs Stand-Alone Model 131

Cyber Risk Extended Report 4
Executive Summary
What is the balance of economic benefits and costs conferred upon societies by cyber technologies, also designated here as information and communication technologies (ICT)? And how might that balance change in coming years? This report, prepared as a quantitative foundation for work sponsored by the Zurich Insurance Group, addresses these questions by assessing the current pattern of benefits and costs in countries and globally, mapping their apparent trajectory in recent years, and exploring their possible futures through 2030.
Conceptualizing Benefits and Costs Conceptually, the economic benefits from cyber technologies include the often rapid relative growth rates of cyber-producing sectors, the contributions to production, productivity (and therefore growth across the broader economy) from investments in cyber technologies, and consumer-captured surpluses from cost reductions as the technologies develop (i.e., surpluses not represented in standard economic measures such as gross domestic product). Costs include the spending required to defend against adverse cyber events stemming from hacking, cybercrime, cyber espionage, and cyber terror or war, the costs of such events themselves, and opportunity costs—the potential economic benefits not realized because of forgone use of cyber-technologies in fear of such events.1 All of these benefits and costs obviously depend on the changing technological landscape and decisions made by households, organizations including corporations, and governments with respect to cyber security, its use and abuse.
Using the IFs System for Analysis Research for this report uses specialized cyber benefit and risk extensions to the existing International Futures (IFs) forecasting system, based at the Frederick S. Pardee Center for International Futures at the University of Denver. The IFs system includes highly integrated, long-term models of demographics, economics, education, health, energy, agriculture, governance and other systems that together provide a foundation for addressing the questions motivating this project. In addition to augmenting the existing modeling system so as to represent ICT/cyber pervasiveness and the various categories of benefits and costs, this project is building a new, stand-alone form or dashboard within the IFs system to support our analysis and that of others.
1 Countries that lack the human capital and infrastructure capacity to fully deploy cyber technologies can also suffer from such opportunity costs.
Cyber Risk Extended Report 5
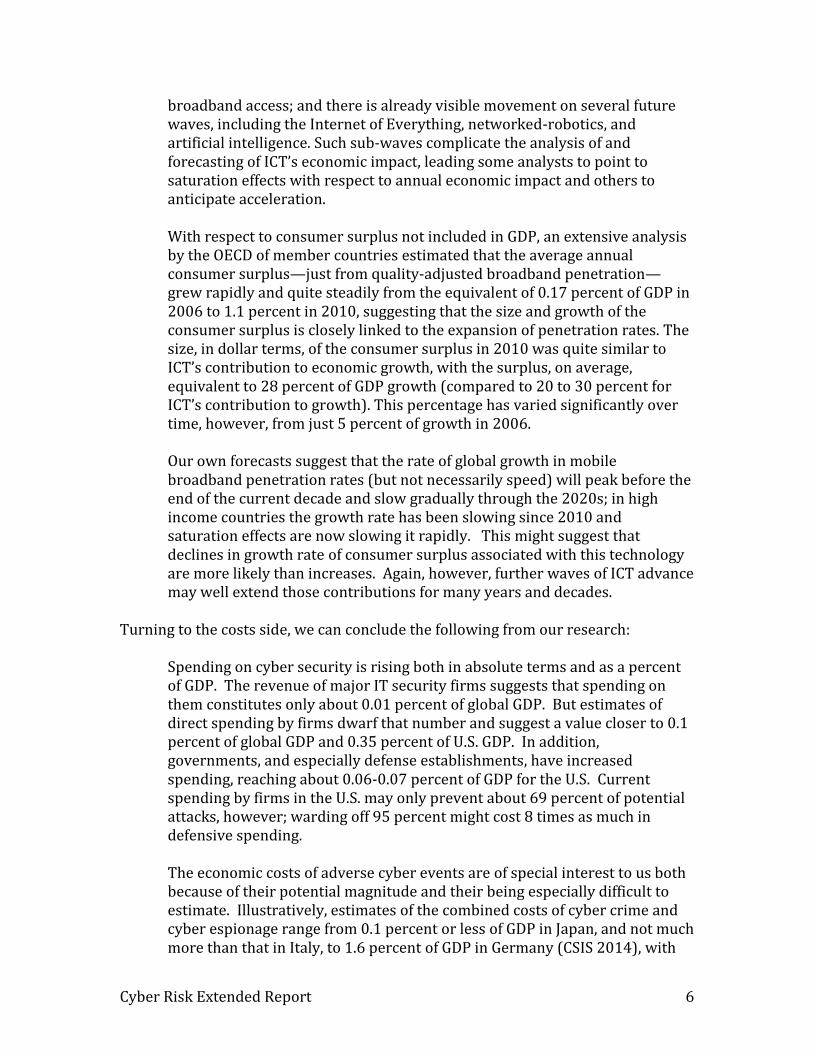
Background Research Foundations Among the findings of our research with respect to cyber benefits are:
Estimates of the share of the Internet economy in the total economy vary from just over 1% of GDP in some countries (e.g. Indonesia at 1.3% and Brazil at 1.5%) to about 8 percent of GDP in others (e.g. the United Kingdom at 8.3% and South Korea at 7.3%). Interestingly, in the United States it appears to be only about 4.7%.2 Although exceptionally rapid growth rates in this sector have fueled some increments to GDP growth in recent decades, the sector is not likely to grow much larger over time—in many respects it is analogous to the energy sector of the global economy, in which value added of another general purpose technology is approximately 6 percent of GDP and where some forms of energy will grow rapidly and replace others, and some country shares (especially in developing countries) will rise while those of others will fall, but the sector size does not change much over time. The ICT sector’s value added has similarly been estimated globally to have grown from about 6 to 9 percent of total business value added and then to have actually begun a decline bringing it back down near 6 percent by 2011. The sector's growth as a share of global GDP is very likely behind us. We have therefore paid no attention to the further growth of this sector as a source of direct economic benefit. ICT’s greatest economic impact, however, is and will remain its contribution to the production of the larger economy. That has two potential elements. First, ICT capital investments in the ICT and other sectors provide capital services (just as capital investments in other sectors do). Second, many argue that ICT is a general-purpose technology that enhances the productivity of labor and capital broadly, just as steam power and electricity did in earlier centuries. Estimates of the two economic benefits range widely across not just time and countries, but analysis, with much clearer evidence for significant capital services contributions than for broader total factor productivity impact. Generally estimates for total GDP contribution fall into the range of 20-30 percent of economic growth, about 0.6-1.5 percentage points of absolute contribution to growth. Many studies focus more narrowly on the impact of broadband penetration rates and find that increases in penetration rates of 10 percent generate 0.9-2.0 percentage points of economic growth, with the greatest impacts coming as countries approach the middle range of the penetration process Yet, broadband is only a recent entry in a series of sub-waves of ICT technologies that have built on each other over time and will continue to do so into the future. Today, the use of the cloud for storage and computation is building on a foundation of
2 Because these are estimates for the “internet economy” they will somewhat underestimate the size of the cyber economy.
Cyber Risk Extended Report 6
broadband access; and there is already visible movement on several future waves, including the Internet of Everything, networked-robotics, and artificial intelligence. Such sub-waves complicate the analysis of and forecasting of ICT’s economic impact, leading some analysts to point to saturation effects with respect to annual economic impact and others to anticipate acceleration. With respect to consumer surplus not included in GDP, an extensive analysis by the OECD of member countries estimated that the average annual consumer surplus—just from quality-adjusted broadband penetration—grew rapidly and quite steadily from the equivalent of 0.17 percent of GDP in 2006 to 1.1 percent in 2010, suggesting that the size and growth of the consumer surplus is closely linked to the expansion of penetration rates. The size, in dollar terms, of the consumer surplus in 2010 was quite similar to ICT’s contribution to economic growth, with the surplus, on average, equivalent to 28 percent of GDP growth (compared to 20 to 30 percent for ICT’s contribution to growth). This percentage has varied significantly over time, however, from just 5 percent of growth in 2006. Our own forecasts suggest that the rate of global growth in mobile broadband penetration rates (but not necessarily speed) will peak before the end of the current decade and slow gradually through the 2020s; in high income countries the growth rate has been slowing since 2010 and saturation effects are now slowing it rapidly. This might suggest that declines in growth rate of consumer surplus associated with this technology are more likely than increases. Again, however, further waves of ICT advance may well extend those contributions for many years and decades.
Turning to the costs side, we can conclude the following from our research:
Spending on cyber security is rising both in absolute terms and as a percent of GDP. The revenue of major IT security firms suggests that spending on them constitutes only about 0.01 percent of global GDP. But estimates of direct spending by firms dwarf that number and suggest a value closer to 0.1 percent of global GDP and 0.35 percent of U.S. GDP. In addition, governments, and especially defense establishments, have increased spending, reaching about 0.06-0.07 percent of GDP for the U.S. Current spending by firms in the U.S. may only prevent about 69 percent of potential attacks, however; warding off 95 percent might cost 8 times as much in defensive spending. The economic costs of adverse cyber events are of special interest to us both because of their potential magnitude and their being especially difficult to estimate. Illustratively, estimates of the combined costs of cyber crime and cyber espionage range from 0.1 percent or less of GDP in Japan, and not much more than that in Italy, to 1.6 percent of GDP in Germany (CSIS 2014), with
Cyber Risk Extended Report 7
values for the U.S. and China at about 0.65 percent. Cybercrime motivates nearly two-thirds of all attacks and its costs are easier to estimate than those of hacktivism (the second largest motivator) or those of cyber espionage and cyber warfare (in third and fourth place by numbers of attacks). In general, the share of GDP affected by adverse events should rise with pervasiveness of ICT in socio-economic systems and fall with security spending levels. Opportunity costs, tied to not using ICT to its full economic advantage, results in today's world primarily from political control decisions, such as in China, Cuba, and especially North Korea, not to embrace ICT as fully as the technological and social base of the society would allow. If ICT, globally, could be contributing about one-fourth of growth, North Korea is foregoing nearly all of that potential and Cuba perhaps half. Theoretically, opportunity costs could also arise from decisions by societies to forego full use of the technologies because of cyber threats, not just to exert political control.
In stepping back and evaluating the range of information available to us concerning the costs and benefits of ICT and making forecasts of them, the most critical variables are contributions to economic production and to consumer surplus on the benefit side and adverse events on the cost side—the adverse events are especially large and volatile. Unfortunately, there is considerable uncertainty about all of these:
The literature does not tell us much about likely future trends in economic production or consumer surplus contributions. It could be that such benefits will trend downward in a long wave, as have other general-purpose technologies (such as electricity). Nor does debate over trends in adverse event costs help us greatly. On one side lie arguments that the offense always has the advantage and, coupled with increasing pervasiveness of the technology, the costs of security will soar and will still be inadequate to slow adverse event impacts. On the other side, analyses like that of Microsoft (Burt et al. 2014) around malware suggest that developed countries and their capabilities are increasingly winning the battle; the current and almost frenzied ramp-up of security spending and capabilities might significantly control adverse events (although governments are also ramping up offensive capabilities). It could also be that ICT is so closely linked to human knowledge expansion that, in contrast to past waves, "this time truly is different." That is, ICT is may be setting up a positive feedback loop generating exponential advances and even moving us to an impending singularity with respect to artificial intelligence and both the economic growth and risks it may generate (Kurzweil 2006). In such a future, the analysis of economic benefits and costs would need be quickly superseded by much broader analysis of humanity's future character, much as in science fiction representations.
Cyber Risk Extended Report 8
Coming back to the more immediate future, there are huge uncertainties in the literature and limited insights about benefit-cost analysis across countries. Again, penetration rates of ICT should boost both benefits and costs, as normally will rates of increase in penetration.
One of the most important elements in comparing costs and benefits of ICT is to understand the distinction between comparing annual values and comparing the accumulation of them over time. The discussion above focused on annual values as a percentage of GDP, a critical first step in the analysis. However, not all costs and benefits accumulate over time in the same manner:
Most of the costs, including spending on security and impacts of adverse events, are expenses with limited carry-forward impacts. In modeling terms, they are flows, with the costs paid annually and accumulating over time as a simple sum. In contrast, increases to capital stock and productivity from all forms of investment including those involving ICT, carry forward across time like capital in a bank account. The summation across time of these compounding terms rises exponentially and quite sharply. In consequence, it is possible that, in any given country-year of our forecasting, annual ICT risk-related costs could exceed annual benefits. Yet as the forecast horizon grows, the exponentially accumulated benefits will grow so large that they will all but inevitably swamp costs accumulated more linearly. Only risks so large that they caused societies dramatically to reduce or eliminate the use of the technology—and therefore to erase cumulative benefits—would tilt the cumulative balance toward the negative side.
Box 1.1 The balance of cyber benefits and risks: annual versus cumulative In 2010, Mom and Pop Dry Cleaners bought a computer to better manage their purchase of supplies. Their profits in 2009 had been $300,000 and the new computer helped them save $3,000 (1%) on supply costs in 2010 even after the capital investment. Unfortunately, Pop downloaded malware and the firm hired to clean their system charged $3,000—a one-time cost that completely offset that year’s savings. In 2011, they bought a software package to manage their customer database and used it add $3,000 to their profits. Because the computer was also still saving them money on supply ordering, Mom and Pop’s total cyber benefit that year was $6,000. But they also paid $3,000 to another firm that greatly enhanced the security of their systems. Then, in 2012, they purchased software allowing them to mail out specials and attract more clients, generating a surprisingly coincidental contribution to profit of $3,000. And, of course, they again used their computer and earlier software purchases to recognize the savings in supply and benefits of the customer database for a total cyber contribution to profits of $9,000. Unfortunately, that same year hackers broke through their new security system and the firm that patched them up charged $4,500.

Cyber Risk Extended Report 9
Evaluating the benefits of the path they started to follow in 2010, Mom said to Pop: “this year the annual risk-related costs of keeping these bloody systems more than offset the annual boost to profits ($3,000 minus $4,500); those @#*& hackers! But the cumulative contributions to our profits keep compounding: $3,000 plus $6,000 plus $9,000 equals $18,000, while the risk-related costs we pay each year are one-time ($3,000 plus $3,000 plus $4,500 equals $10,500). I want to invest $3,000 next year to create a webpage to get the word out about our shop!’
There are, of course, many complex possible future growth patterns for both costs and benefits of ICT. Given the large degree of uncertainty in the economic analysis, scenarios are needed to frame the uncertainty and provide the foundation for computing the annual and cumulative cost-benefit analysis. Scenario analysis typically reflects the major dimensions of uncertainty:
The two key dimensions identified above were around trends in economic growth benefits and in adverse event costs. The scenario stories can elaborate quite different futures of technological development and economic impact and quite variable logics of action and reaction by the actors involved in the benefit-risk struggles of the cyber world. At the same time there are other and deeper drivers that may influence the path of technological change and that can and will certainly affect the logics of action and reaction. For instance, patterns of geo-political conflict and cooperation across states will affect the extent of collaboration to both maximize and share benefits and to minimize risks of adverse events (some potentially generated by interstate conflict) and to limit the opportunity cost burdens of disconnected and isolated systems. So, too, will patterns of domestic inequality, social trust, and cohesion affect the balance of benefits and costs. Our partners at the Atlantic Council will be developing the scenario stories that interact with our own scenario implementations in the exploration of alternative cyber futures.
Forecasts and Findings Turning to our analysis, the findings reinforce the wider perception in both scientific studies and the media that annual costs associated with protecting against and absorbing the impact of adverse cyber events have been climbing as a portion of GDP. On a global basis those and opportunity costs collectively may have risen above 1 percent of GDP and they could be 1.25 percent by 2030. The percentage is now larger for high-income countries than for low-income ones (1.1 versus 0.7 percent), but by 2030 that pattern could be reversed as ICT becomes more pervasive in low-income and middle-income countries and high-income countries face slower growth in costs.

Cyber Risk Extended Report 10
On the benefit side, our Base Case scenario suggests that the combined magnitude of growth contributions and consumer surplus as a percentage of GDP is now more stable or even decreasing, as at least the current ICT wave, riding on the back of greater use of broadband services, plays out globally. (Subsequent scenario discussion will explore the implications of a world in which further waves continue to raise ICT pervasiveness.) It is now the middle-income countries that are gaining the most benefit, equivalent to as much as 2 percentage points of GDP growth each year, somewhat more than the benefit in low-income countries and nearly 4 times that of high-income ones. By 2030, it is likely to be low-income economies that gain the most each year. Again globally, the declining rate of annual benefits and the rising rate of costs has, in fact, been leading toward a cross-over of the two curves, a phenomenon that may well be happening very near to the end of this decade. The cross-over point for high-income countries quite likely occurred before 2010. While middle-income countries will move toward it but not reach it by 2030, low-income countries can expect a continued and substantial net benefit through this forecast horizon. Taking into account the compounding cumulative character of benefits and the additive cumulative character of costs, however, the global value of benefits from ICT that we expect in our Base Case scenario between 2010 and 2030 is more than 180 trillion dollars and the global value of costs will be nearer 23 trillion, giving rise to a very large net benefit. Most of that will again accrue to high-income countries where the benefit and cost numbers are 64 and 14 trillion, respectively. To put these numbers in context, the global GDP in 2030 ($2011) will be about 135 trillion and the cumulative GDP between 2010 and that year will be more than 2,000 trillion. The two greatest uncertainties surrounding the future benefits and costs of the cyber economy are (1) the future unfolding of ICT technology and therefore the potential extent of the embeddedness of it in the economy, giving rise to growth and consumer benefits as well as to security spending costs and (2) the cost of adverse cyber events with the greatest uncertainty being around cyber war or terror. We have done preliminary explorations of the impacts of major changes in assumptions for both of these. With respect to the unfolding of technology, we explored the impact of effectively doubling our index of ICT globally between 2015 and 2030, relative to the rise in the Base Case scenario. With respect to adverse events around cyber war/terror, we raised the assumption from zero cost in the Base Case scenario to 1 percent of GDP in 2016 and to 2 percent by 2030. These two explorations are not the same as scenarios, which should be coherent alternative stories of the future that would explain how the unfolding of variables associated with such key uncertainties might be driven by broader future change in technological, economic, and socio-political systems. This report has not explored such scenarios, an effort which is part of the broader project to which it contributes.
Cyber Risk Extended Report 11
In our forecasting, the changed assumption of ICT’s unfolding has both annual benefits and costs, but the net is positive. The cumulative global net benefit through 2030 is about 15 trillion dollars. The changed assumption about cyber war/terror has only costs and lowers cumulative net benefits by more than 20 trillion dollars. In short, however, the general magnitude of our Base Case result (a net cumulative benefit of 158 trillion dollars) appears quite robust to even rather dramatic changes in assumptions with respect to the two key uncertainties. Finally, our analysis turned to elaboration in IFs of the Atlantic Council’s four ICT scenarios: Leviathans (governments control, regulate and use the cyber sphere), Independent Internet (organizations and individuals dominate), Clockwork Orange (conflict of all on all), and Cyber Shangri-La (growing benefits and capabilities of protecting them). None of those worlds has, of course, ever existed and all differ by definition from our Base Case analysis of the path we seem to be on. Hence our parameterization of them in IFs is necessarily somewhat arbitrary, even while guided by the insights of our research and Base Case analysis. We find that on a global level the net of annual benefits and costs may well shift toward costs for all scenarios except Shangri-La, with very large net costs emerging in Clockwork Orange. Across global income categories in the Independent Internet scenario (as well as in others except Shangri-La) it is high-income countries that are most likely to suffer net annual costs. Yet other income groupings may also see erosion of annual net benefits. Only in the Clockwork Orange scenario and in high-income countries (where net annual costs reach 7 percent of GDP) do net cumulative benefits and costs turn negative by 2030. In sharp contrast, upper-middle-income countries could realize cumulative net benefits of nearly $60 trillion through 2030 even in that scenario. In the world of relatively self-sufficient Leviathans, the East Asia and Pacific region by itself could benefit by as much as $50 trillion far outstripping net returns to other regions.
Conclusion In conclusion, the not-so-good and even bad news is that for some and probably many countries, annual costs associated with cyber risk and events could likely come to exceed the annual benefits. The good news is that cyber technology’s driving of economic transformation and growth is cumulative and, moreover, is giving rise, as have past general purpose technologies like electricity, to advances in stocks of capital and multifactor productivity that compound over time and greatly boost GDP. Those cumulative advances, although reduced by cumulative risk-related costs, will almost certainly be very large, perhaps adding 20 percent to the global GDP of 2030 compared to what it would be without ICT. The inevitable prescription is that security efforts must be undertaken and expenditures borne so as to reduce the risk of large-scale adverse events and maximize the benefits as this transforming wave of change washes across the globe.
Cyber Risk Extended Report 12
A Final Note on Study Contributions Contributions of this study include:
We have been able to build and convey an admittedly imprecise understanding of the relative benefits and costs of cyber technology. We have not found any previous attempt to build exhaustive typologies of different benefits and costs as we have done, to assess at least roughly the contemporary monetary values of the different elements in the typologies, and to provide an overall assessment of current benefits and costs. We have proceeded to structure a forecasting model that builds on the initial data that we have, using cross-country comparison and longitudinal series when possible. The model incorporates measures of ICT penetration or pervasiveness and of ICT associated risk as driving variables for future benefits and costs, as well as drawing upon existing variables already in IFs including GDP per capita and economic growth rates. We have shown that there is an annual balance between benefits and costs that would quite possibly already tilt globally in the direction of costs if consumer surplus were not explicitly considered, but tilts in the direction of benefits when if it is. And we have shown that when the compounding of benefits is taken into account (because contributions to capital, productivity, and consumer benefits are stocks rather than annual expenditures), the balance tilts decisively in the direction of benefits. We have created the capability to intervene in the forecasting system so as to explore very different assumptions and integrated scenarios around the future of the technology and each of the associated benefits and costs, especially the critical uncertainty around costs of adverse events, so as to explore the implications of alternative possible scenarios. We are in the processing of creating an easy-to-use interface to be added to the International Futures (IFs) forecasting system to allow exploration of both alternative initial assumptions and variable unfolding as part of the user’s own scenario analysis, an interface that will be freely available for all to use. We will, at the end of this research and development, have created a general thinking tool to helping consider the actions needed by households, organizations (including firms) and governments to protect themselves from the greatest cyber risks and to take advantage of the most likely opportunities.

Cyber Risk Extended Report 13
1. Introduction: Understanding and Anticipating Change in the Benefits and Costs of Cyber Technology3 The media (itself a critical part of our information and communications technology or cyber-empowered society) showers us with stories about the benefits of the newest and greatest ICT/cyber-based developments and how even much more those contributions will come to be in future years. Simultaneously, that same media delivers constant warnings about the threats to us from cyber-activism (hacktivism), cybercrime, cyber-espionage and even cyber-terrorism/war.4 Figure 1.1 summarizes our conceptual approach to moving such micro-level information to a macro-level and dynamic basis for understanding and forecasting the balance of costs and benefits.
Figure 1.1. Conceptual schema of analysis Source: Authors
3 The authors express their great appreciation to the data acquisition and other help to this project from Shelby Johnson and Katherine Hill.
4 Singer and Friedman (2014: 36) pointed out that "by 2013 there were over half a million online references in the media to a 'cyber Pearl Harbor' and another quarter million to a feared 'cyber 9/11'".
+
Economic Growth
Drivers:
Multifactor Productivity
Capital
Labor
[Impacts can be flows
or stocks and variable
by duration, as well as
variable by magnitude
or % of GDP impact)
+
Probability of Adverse
Events (Attacks,
Accidents)
Costs of
Adverse Events
GDP per capita and
Economic Structure
Spending on Security
(Economic Friction)
+
+
Broader Dvelomental
Impacts
Of Cyber
ICT Pervasiveness,
Connectivity,
and Rate of Advance
Productivity
Contribution of Cyber
+
+
+
-
+
+
Opportunity Costs of
Limiting Cyber
Development
- Costs of Cyber
Attacks
-
-
Technology Change and
Political/Social Choices
(Including Cyber Security)
Direct Size of Cyber
Economy
Consumer
Surplus from Cyber
Cyber Costs Cyber Benefits
+

Cyber Risk Extended Report 14
Both benefits and costs depend on the character of cyber technology, the extent and pervasiveness of it within and across countries and over time, and the rate of change in the penetration of the technologies into our economies and broader societies. Measuring that penetration or pervasiveness of use is therefore a basic foundational step in exploring costs and benefits. Most measures devote primary attention to the development level of and extent of adoption of technologies such as mobile broadband; some measures look beyond the technologies to the social foundations of their use, such as the socio-cultural or legal environment. One of the first tasks of this report, undertaken in the next section, will be to review the existing ICT or cyber development indices. Turning to the costs and benefits of cyber pervasiveness, we probably have better understanding of aggregate benefits than we do of costs. Analysts have labored over the productivity and growth data, sometimes struggling to actually find and measure those economic benefits, but generally succeeding and dividing them three major categories:
1. Direct contributions to growth and employment from the increased size of the ICT
production and distribution systems.
2. Indirect contributions of cyber to enhanced production and productivity
throughout the economy through the progressive imbedding of ICT into the
capital stock.
3. The even harder-to-measure surplus benefits that consumers gain (consumer
surplus) from steadily and quite rapidly decreased prices or improved capacity
and quality at the same price—we all know Moore's Law.
Similar attention but less coherence characterizes the search to fully identify, much less quantify, the economic risks and their costs to us in our households, firms and other organizations, and governments. Again these fall into three primary categories:
1. Although a baseline portion of that, namely the amount we spend on defending
ourselves against adverse events, should perhaps be relatively easily to identify in
the level of those expenditures, moving beyond outlays for services to the time
investments of those using them is not simple.
2. Beyond that baseline, many of those adverse cyber events themselves carry
uncertain or probabilistic frequencies and associated direct and indirect costs.
3. Still more complicated can be conceptualizing and thinking about the opportunity
costs of foregoing some uses of cyber, for instance, interoperability and
connectivity, and therefore the benefits that would otherwise accrue.

Cyber Risk Extended Report 15
In comparing risk-related costs and benefits of ICT in this project it is important to understand the distinction between annual values and the accumulation of them over time. Not all costs and benefits accumulate over time in the same manner:
Most of the costs, including spending on security and impacts of adverse events, are one-time expenses with limited carry-forward impacts. Although they might divert some investment from more productive uses and thereby slow growth, they are primarily operating costs. Thus the sum of them over time is an appropriate way to represent their accumulation. In modeling terms, they are flows. In contrast, increases to capital stock and productivity from all forms of investment including those involving ICT, carry forward across time like capital in a bank account. An increase from ICT in economic growth in year 2 of analysis is on top of (compounding) the increased production that resulted from a growth boost in year 1. The summation across time of these compounding terms rises exponentially, unlike the more linear summation of one-time costs. To illustrate, if all annual costs totaled 1 percent of GDP, over 5 years the sum would be 5 percent of the average GDP. But if benefits added 1 percent to productivity levels each year, the compounded sum would be 1 + 2 [actually a little more because of compounding] + 3 + 4 + 5 = 15 percent of initial GDP. It thus takes very little time for the cumulative benefits of such compounding to reach levels unlikely to be overtaken by annual risk-related costs. Similarly, a reduction in price of electronic goods in year 2 (a consumer benefit) is on the base on any reduced price in year 1 and the accumulated consumer benefits therefore also exhibit compounding behavior. In consequence of this distinction, it is possible that for any given country-year of our forecasting, annual ICT risk-related costs could come to exceed annual benefits.5 Yet as the forecast horizon grows, the accumulation of benefits will grow so large that they will almost inevitably swamp accumulated costs. Only risks that caused societies to actually reduce or eliminate the use of the technology and therefore forego cumulative benefits6 would tilt the cumulative balance toward the negative side.
5 Consider analysis of costs and benefits of the electricity revolution. Had one looked at annual productivity benefits of electricity against the costs of accidents resulting from it (adverse events) and the costs of investing in safe use (security expenditures), not to mention job displacement and many other transition costs, it might have looked like an extremely mixed blessing and even a curse. Yet the accumulation of economic benefits has clearly overwhelmed the accumulation of such costs.
6 The opening scenes of the movie Transcendence portray a devastated society that has unplugged its ICT technology because of the risks that emerged with artificial intelligence.

Cyber Risk Extended Report 16
We recognize that beyond the economic benefits and costs lie a host of others, including both the ability to connect easily with friends and families around the world and the loss of privacy that those connections and the monitoring of them carry. The largely economic focus of this report should not signal insensitivity to the importance of those other benefits and costs. The benefits and costs change rapidly with the availability of technology, its rate of adoption, and the character of its use including the extent of associated attention to security. Our desire is to understand the trajectory of that change and differences across time and countries. This report conveys the data and estimates that we have found, sometimes well and systematically organized, often scattered, and very frequently only anecdotal. Moving beyond the complications of conceptualization and measurement of current conditions and trajectories, the drivers of our cyber future will be complex and subject to both technological developments and human decisions and actions that we obviously cannot fully anticipate. Hence we will provide not just a Base Case forecast suggesting where benefits and costs seem to be going, but we will explore alternative futures about how they might evolve in this report, as well as in a separate one co-authored with our partners at the Atlantic Council. We use the International Futures (IFs) forecasting system as the primary tool to help us organize, display, and analyze our data and to build forecasts. IFs has several features of importance to the analysis:
1. It contains a set of heavily integrated and quite rich models: demographic,
economic, human development (education and health), physical (energy,
agriculture, and infrastructure), and socio-political (governance and government
finance). This project enhances that model, especially in terms of the relationship
between ICT infrastructure and the economy, and uses the full system.
2. IFs contains an interface that facilitates display and analysis of historical data as
well as of forecasts and the development of alternative scenarios. This project
enhances that interface with a new display or dashboard focused on the benefits
and costs of cyber technology.
3. IFs represents 186 countries at different stages of socio-economic benefit and
adoption of cyber technology.
4. The IFs system is freely open for use by anyone else who may wish to make other
assumptions and explore other possible futures.
The IFs tool and this associated report allow systematic investigation of the relative benefits and costs of cyber. In spite of the challenges of the effort and the known uncertainties associated with it, we know of no other such capability.

Cyber Risk Extended Report 17
This report first delves into the conceptual, data and forecasting formulation issues in three different areas: indices of ICT or cyber development across countries; the economic benefits that those developments confer; and the economic costs associated with them. Insofar as we could find forecasts of these by others, and those are surprisingly scarce, the following sections report those. The report then turns to our analysis and forecasting of those variables in coming years. A technical appendix to the report provides information on the character of the interface within IFs for analysis and on the formulations of the forecasting model itself (opening the "black box").
Cyber Risk Extended Report 18
2. ICT and Cyber Development Indices One of the first activities of the project was to survey literature and data sources for indices that would help assess, for as many countries and years as possible, the usage or pervasiveness of cyber/ICT and the security environment. Such measures are relevant both to risk-related costs and to benefits, so we present some of the key indices in this section. We have pulled about 150 ICT-related data series into IFs. Among those are these indices replicated in the International Futures (IFs) forecasting system.
Indices Replicated in the IFs Forecasting System We have replicated two important ICT/cyber indices in the IFs system, both of them produced by the International Telecommunications Union (ITU). See Section 5 of this report for more detail on their use in IFs.
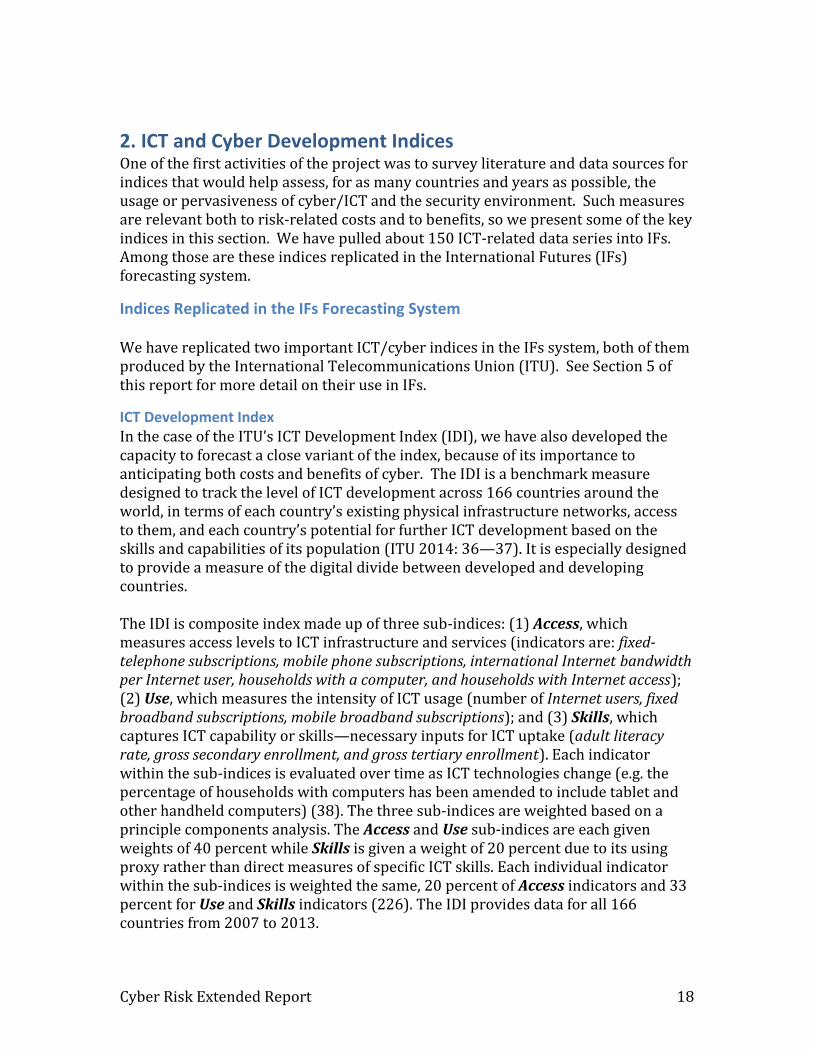
ICT Development Index In the case of the ITU’s ICT Development Index (IDI), we have also developed the capacity to forecast a close variant of the index, because of its importance to anticipating both costs and benefits of cyber. The IDI is a benchmark measure designed to track the level of ICT development across 166 countries around the world, in terms of each country’s existing physical infrastructure networks, access to them, and each country’s potential for further ICT development based on the skills and capabilities of its population (ITU 2014: 36—37). It is especially designed to provide a measure of the digital divide between developed and developing countries. The IDI is composite index made up of three sub-indices: (1) Access, which measures access levels to ICT infrastructure and services (indicators are: fixed-telephone subscriptions, mobile phone subscriptions, international Internet bandwidth per Internet user, households with a computer, and households with Internet access); (2) Use, which measures the intensity of ICT usage (number of Internet users, fixed broadband subscriptions, mobile broadband subscriptions); and (3) Skills, which captures ICT capability or skills—necessary inputs for ICT uptake (adult literacy rate, gross secondary enrollment, and gross tertiary enrollment). Each indicator within the sub-indices is evaluated over time as ICT technologies change (e.g. the percentage of households with computers has been amended to include tablet and other handheld computers) (38). The three sub-indices are weighted based on a principle components analysis. The Access and Use sub-indices are each given weights of 40 percent while Skills is given a weight of 20 percent due to its using proxy rather than direct measures of specific ICT skills. Each individual indicator within the sub-indices is weighted the same, 20 percent of Access indicators and 33 percent for Use and Skills indicators (226). The IDI provides data for all 166 countries from 2007 to 2013.

Cyber Risk Extended Report 19
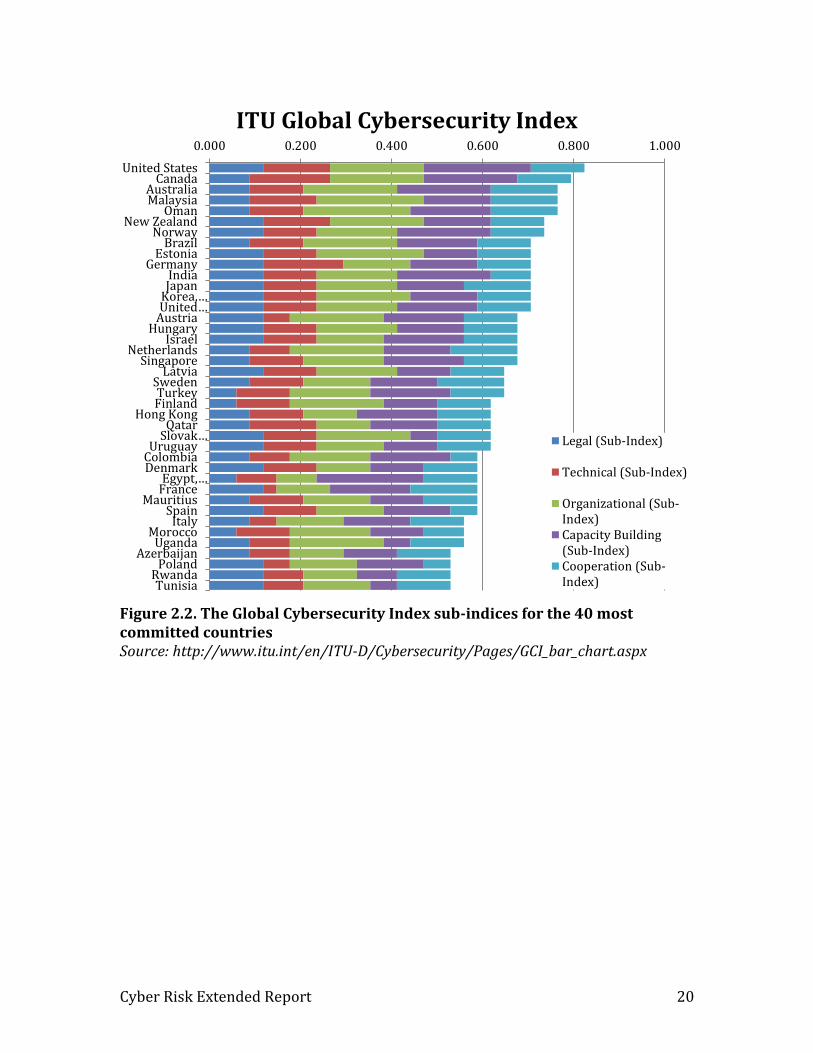
Global Cybersecurity Index The ITU’s Global Cybersecurity Index (GCI) ranks the cybersecurity capabilities of 195 countries across five categories (see Figures 2.1 and 2.2): (1) legal measures which compares the legal institutions and frameworks that are in place to deal with cybersecurity and cybercrime; (2) technical measures, looking at the technical standards endorsed by the state; (3) organizational measures, which considers the institutional measures that are in place to foster the development of cybersecurity; (4) capacity building for awareness and access to resources; and (5) the level of intrastate and international cooperation. The ITU lists the goals of the GCI as the following:
Promote government strategies at a national level
Drive implementation efforts across industries and sectors
Integrate security into the core of technological progress
Foster a global culture of cybersecurity7
Figure 2.1. National cybersecurity commitment Note: blue indicates highest and red indicates lowest Source: ITU Global Cyber Security Index, available at http://www.itu.int/en/ITU-D/Cybersecurity/Pages/GCI.aspx
7 “Global Cyber Security Index,” ITU.int, 2014. Available at: http://www.itu.int/en/ITU-D/Cybersecurity/Pages/GCI.aspx [accessed on 5/12/15]
Cyber Risk Extended Report 20
Figure 2.2. The Global Cybersecurity Index sub-indices for the 40 most committed countries Source: http://www.itu.int/en/ITU-D/Cybersecurity/Pages/GCI_bar_chart.aspx
0.000 0.200 0.400 0.600 0.800 1.000
United StatesCanada
AustraliaMalaysia
OmanNew Zealand
NorwayBrazil
EstoniaGermany
IndiaJapan
Korea,…United…
AustriaHungary
IsraelNetherlands
SingaporeLatvia
SwedenTurkeyFinland
Hong KongQatar
Slovak…Uruguay
ColombiaDenmark
Egypt,…France
MauritiusSpain
ItalyMorocco
UgandaAzerbaijan
PolandRwandaTunisia
ITU Global Cybersecurity Index
Legal (Sub-Index)
Technical (Sub-Index)
Organizational (Sub-Index)Capacity Building(Sub-Index)Cooperation (Sub-Index)

Cyber Risk Extended Report 21
Additional Indices of Importance in Cyber Security Analyses Several additional indices of either the pervasiveness of ICT connectivity or of cyber security appear in the literature.
Digitization Index Katz et al. (2013) developed a Digitization Index designed to measure cross-country ‘digitization,’ which they defined as the ‘transformation of the techno-economic environment and socio-institutional operations through digital communications and applications.’ The index is built from six equally weighted sub-indices, which cover affordability (line/subscription cost for fixed and mobile telephone and fixed broadband connections adjusted for GDP per capita), infrastructure reliability (investment per subscriber by service type), network access (penetration metrics including fixed broadband and mobile phones per household, PCs per population, etc.), capacity (international Internet bandwidth and broadband speed), usage (e-commerce, e-government, social network visitors, Internet subscribers, etc.), and human capital (engineers as a percentage of the population and the percent of the labor force with more than a secondary education) (2). Katz et al. calculated an index value for 184 countries for the period 2004—2011 and identified four categories of countries based on index score: Advanced (countries with large talent base for using ICT, and high speed and high quality services), Transitional (countries that have addressed the reliability challenge, and have achieved ubiquitous and affordable access), Emerging (those countries that have addressed affordability and are making progress in access rates), and Constrained (those countries with limited, expensive services) (Sabbagh et al. 2012: 8—11).
Digital Economy Ranking Index The Economist Intelligence Unit’s (EIU) Digital Economy Ranking Index (DERI) was developed as a successor index to the EIU’s e-readiness rankings. The EIU has yet to publish an update to the 2010 rankings. The DERI measured the quality of a country’s ICT infrastructure and the ability of consumers, businesses, and government to use ICT to their benefit. It was designed to allow easy comparison between countries and provided rankings for 70 countries around the world, covering the years 2009 and 2010. The Index incorporated over 100 indicators grouped into six main categories: connectivity and technology infrastructure, business environment, social and cultural environment, legal environment, government policy and vision, and consumer and business adoption—each individual indicator and category were given weights based on significance. The Index included quality measures for mobile and broadband technology (the share of 3G and 4G subscriptions and the share of fiber-optic lines, respectively). It also included an indicator for Internet security but the primary report did not specify what component indicators were used. The underlying data for the DERI came from the EIU itself, plus Pyramid Research, the World Bank, UN, and the World Intellectual Property Organization, among others.
Cyber Risk Extended Report 22
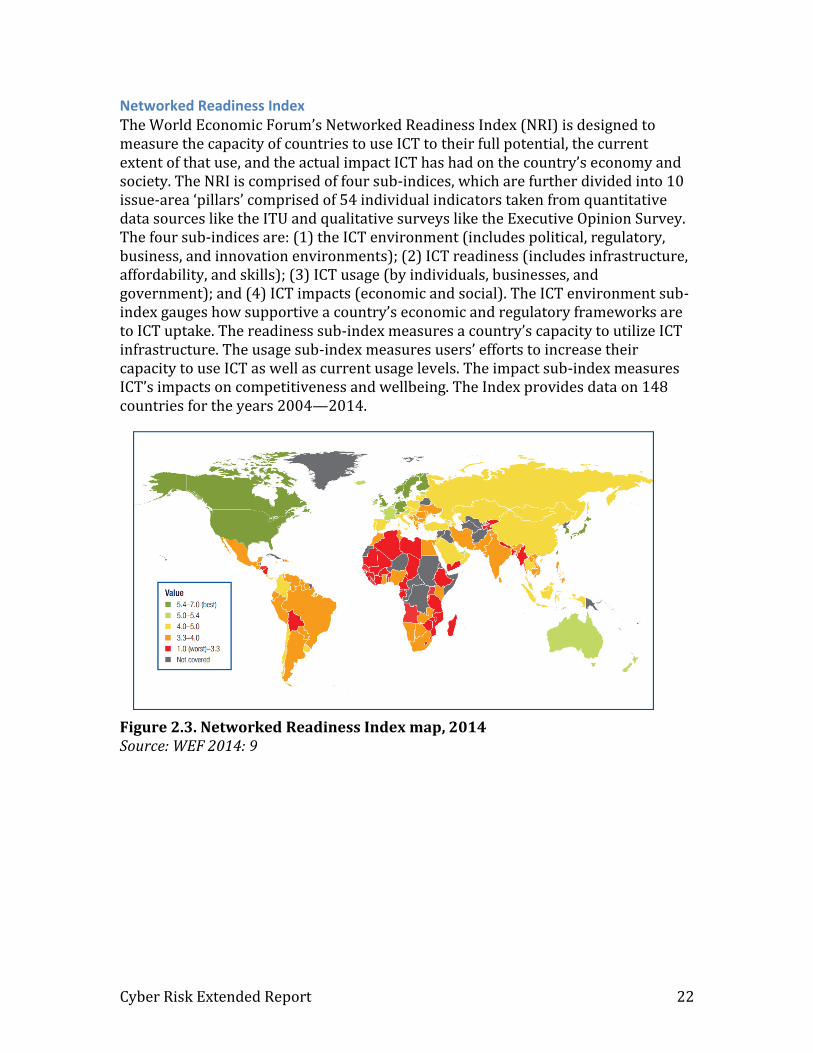
Networked Readiness Index The World Economic Forum’s Networked Readiness Index (NRI) is designed to measure the capacity of countries to use ICT to their full potential, the current extent of that use, and the actual impact ICT has had on the country’s economy and society. The NRI is comprised of four sub-indices, which are further divided into 10 issue-area ‘pillars’ comprised of 54 individual indicators taken from quantitative data sources like the ITU and qualitative surveys like the Executive Opinion Survey. The four sub-indices are: (1) the ICT environment (includes political, regulatory, business, and innovation environments); (2) ICT readiness (includes infrastructure, affordability, and skills); (3) ICT usage (by individuals, businesses, and government); and (4) ICT impacts (economic and social). The ICT environment sub-index gauges how supportive a country’s economic and regulatory frameworks are to ICT uptake. The readiness sub-index measures a country’s capacity to utilize ICT infrastructure. The usage sub-index measures users’ efforts to increase their capacity to use ICT as well as current usage levels. The impact sub-index measures ICT’s impacts on competitiveness and wellbeing. The Index provides data on 148 countries for the years 2004—2014.
Figure 2.3. Networked Readiness Index map, 2014 Source: WEF 2014: 9
Cyber Risk Extended Report 23
3. Benefits With information and communication technologies becoming ever-faster and cheaper and coming to underlie ever-more economic activities around the world, the question is no longer whether ICT has positive impacts on growth. Instead, the appropriate questions are (1) how large are those impacts and (2) what form do they take (e.g. contributions to the value added of the ICT sector, gains to productivity more broadly, consumer surplus, etc.) (Niebel 2014; Cardona et al. 2013)? Similarly, researchers have begun to look at whether ICT’s impacts increase with speed and quality, whether they differ for developed versus developing countries, and whether ICT’s benefits are mostly already realized (at least in developed countries) or will continue to increase significantly for decades to come. This section reviews the latest analyses of ICT’s relationships to the economy and identifies some important takeaways for our modeling effort.
Competing Schools of Thought on Economic Benefits We begin our exploration of the economic benefits of ICT with an overview of the main schools of thought regarding its role in driving productivity and growth: (1) that the major gains from ICT are already past (the Pessimist school); (2) that gains are likely to continue—with major gains yet to come (the Optimist school); and (3) a variation or extension of the Optimist school, that ICT should be regarded as a general-purpose technology with especially wide and long-lasting impacts—like electricity and the steam engine before it. We then review the latest quantitative findings regarding the size of the ICT sector, the broader contribution of ICT to productivity and GDP, and its generation of a consumer surplus—additional economic benefits not captured by standard measures of economic growth like GDP.
Pessimism Versus optimism concerning ICT’s economic production impacts In the Pessimistic perspective, earlier technologies like electricity, sanitation, and the automobile claimed all the low-hanging productivity fruit—they provided productivity gains that simply cannot be replicated by existing or future technological innovations (Gordon 2014; 2012; Cowen 2011; Theil 2010). For Pessimists, today’s ICT innovations and all foreseeable technological innovations represent refinements of earlier technologies and thus are likely to provide only marginal benefits. This diminution of returns is part of their explanation for why the average annual rate of productivity growth (in terms of output per hour) in the United Sates has been markedly lower over the last 40 years (1.59 percent) than it was in the 81 years prior (2.36 percent) (Gordon 2014: 21). Going further, Gordon has argued that the observable productivity bonus from ICT, was small and short-lived compared to earlier technologies, lasing only 8 years (1996—2004); since then, he has found no detectable increase in US productivity due to ICT (Gordon 2012: 35). As part of his headwinds of economic growth facing
Cyber Risk Extended Report 24
the US (primarily demographic), Gordon calculated that reduced innovation going forward will likely slow future economic productivity growth by 0.6 percentage points per year (Gordon 2012: 22). Cowen (2011) suggested that part of the reason ICTs have not had the same magnitude of productivity impact as earlier technologies is that digital technologies simply do not produce the number of jobs as earlier, more labor and capital-intensive technologies (and, in fact, often automate away existing jobs). At the heart of the Pessimist argument is the notion that the rate of innovation is slowing down. This finding is much disputed in the literature. Byrne et al. (2013: 22) initially found support for the Pessimist school. They found that ICTs’ contribution to labor productivity in the United States was significantly lower during the 2004 to 2012 period (0.64 percentage points) than its contribution from 1995 to 2004 (1.5 percentage points) and even slightly lower than the 1974 to 1995 period (0.77 percentage points). But the authors found that a large reason for this was not due to a slowing of innovation but to a significant portion of ICT manufacturing in the United States being off-shored to other countries. The authors also pointed out that there tends to be a time-lag in productivity gains that seems to have occurred with all major technology transitions—while PCs first arrived in the 1980s, the productivity gains attributed to them were not visible until the 1990s. So, they suggest, the gains from the recent transition to post-PC technologies like broadband-equipped smart phones and tablets may be yet to come. The McKinsey Global Institute (2013) and Cardona et al. (2013) also found a lag between initial deployment of new ICTs and their economic impact, as it takes time for the technologies to reach critical mass and for firms to reorganize to take full advantage of them. Paul Starr, in an article on the growth paradox, similarly, suggested that companies generally take five to seven years to realize productivity gains from investing in computer hardware.8 The lag between initial deployment and measurable productivity effects supports the Optimistic school of thought—that we are still in an early phase of ICT’s economic impact. For Optimists, the notion that ICT’s impact in a country like the United States might already be over is nonsense. MGI (2015), for example, found that even in a seemingly technology-saturated country like the US, there remains much room for the diffusion of productivity enhancing technologies, and that the better deployment of existing technologies along with those currently in the pipeline would provide enough boost to the country’s productivity to overcome Gordon’s economic headwinds even without transformative new technology.
8 Paul Starr, “The Growth Paradox: if our technology is so smart, why aren’t we all richer?” The New Republic, July 14, 2014. Available at: http://www.princeton.edu/~starr/articles/articles14/Starr_GrowthParadox_7-2014.pdf [accessed on 5/6/16]

Cyber Risk Extended Report 25
The pace of innovation and the amount spent on innovation also do not seem to be decreasing. Oulton (2012: 1723) found that not only did ICT investment in the US reach levels post-2004 (the start of Gordon’s productivity slump) that were significantly higher than during the dot.com boom but that productivity gains remained rapid even during the dot.com bust and subsequent recession. MGI (2015: 56) also found that the rate of widespread deployment of new technologies is continuing to accelerate. For fixed-line telephones, it took more than fifty years to reach 50 percent of homes in the US, for smart phones it took a little more than five years.9
ICT as a general-purpose technology Building on the optimistic perspective, many researchers examining the benefits of ICT have come to see it as a general-purpose technology (GPT) that can transform entire economies rather than a discrete sector which simply adds/subtracts a given amount of GDP as it grows/shrinks. GPTs are typically defined as having three primary characteristics: (1) applicability across a wide range of uses (pervasiveness); (2) having a wide scope for improvement, experimentation and enjoying continuously falling prices; (3) facilitating further innovations in products and processes across sectors (Cardona et al. 2013; Kretschmer 2012). Together, these characteristics make ICT a non-rivalrous and long-lasting resource capable of significantly disrupting older ways of doing things (MGI 2013). Like electricity almost a century and a half ago, and the steam engine before that, ICT has become a pervasive enabling technology, increasing efficiency and lowering transaction costs for an ever-wider array of economic activities, from streamlining supply chains to enabling worldwide collaboration for developing new products and services (OECD 2013; ITU 2012; Czernich 2009; Atkinson and McKay 2007). Reinforcing the notion of ICT as a GPT, Kretschmer (2012) and others have remarked on the difficulty of measuring ICT’s role in productivity due to it having many spillover effects that are hard to isolate. Oulton (2012), for example, found that the bulk of productivity gains from ICT actually came from outside the ICT sector. And as Shapiro and Mathur (2011: 4) point out, the gains from ICT investment by industries outside the ICT sector grew ten times faster than investments in any other type of input.
9 This brings up a major criticism against the Pessimistic School—that it only focuses on the United States. ICT is spreading rapidly across the globe and it seems a faulty conclusion to think that adding millions more ICT users to the global economy every year will not impact economic growth very broadly.
Cyber Risk Extended Report 26
ICT’s Economic Impact: The Production Side Contributing to and often attempting to resolve the debates between the more pessimistic and optimistic arguments, there is a vast and fast-growing empirical literature on the relationship of ICTs to economic production and productivity. The overwhelming bulk of studies has found that ICTs, whether measured in terms of ICT investment, ICT capital stocks, or penetration rates (pervasiveness), have had a positive and significant production impact, notably through capital deepening and enhanced multifactor productivity (Hanclova et al. 2015). This section looks at the latest quantitative findings in the literature. We look in turn at the growth of the ICT sector itself, the capital services of ICT across the economy, and the contribution of ICT to multifactor productivity. Following this survey of production side impacts, we will give some additional attention to the issue of variation in ICT impact across time and countries. And then we will turn our attention away from the production side to the issue of consumer surplus not computed in GDP statistics.
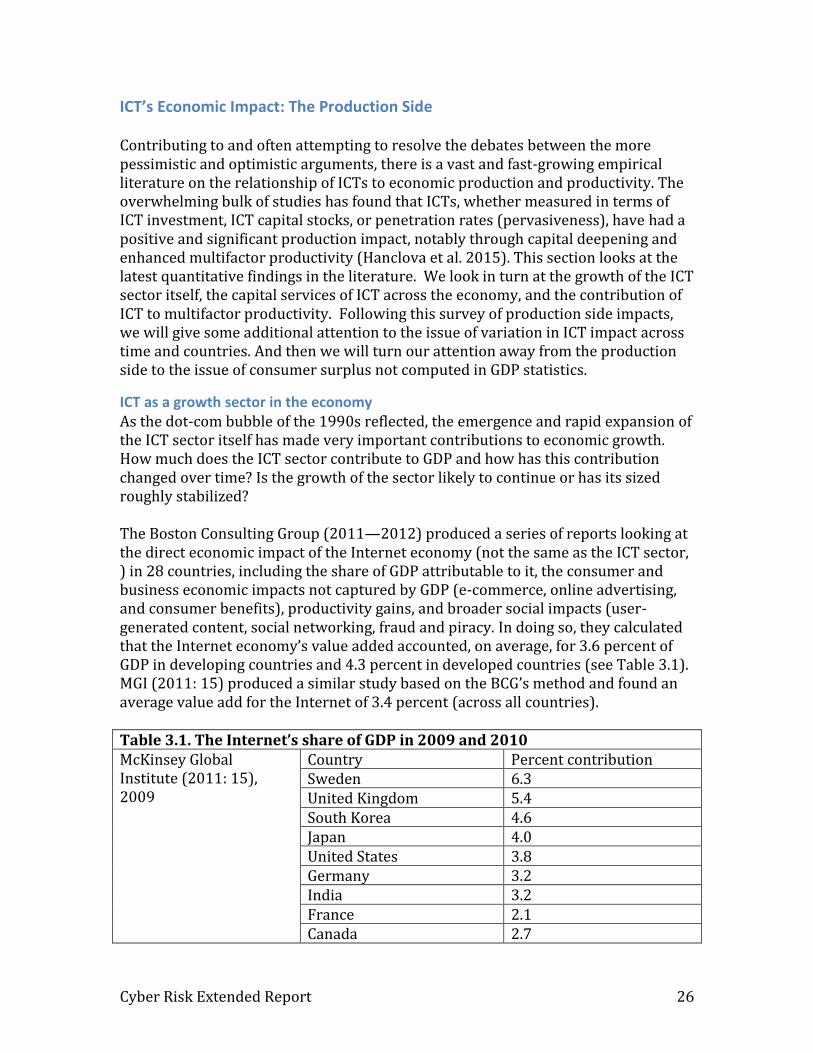
ICT as a growth sector in the economy As the dot-com bubble of the 1990s reflected, the emergence and rapid expansion of the ICT sector itself has made very important contributions to economic growth. How much does the ICT sector contribute to GDP and how has this contribution changed over time? Is the growth of the sector likely to continue or has its sized roughly stabilized? The Boston Consulting Group (2011—2012) produced a series of reports looking at the direct economic impact of the Internet economy (not the same as the ICT sector, ) in 28 countries, including the share of GDP attributable to it, the consumer and business economic impacts not captured by GDP (e-commerce, online advertising, and consumer benefits), productivity gains, and broader social impacts (user-generated content, social networking, fraud and piracy. In doing so, they calculated that the Internet economy’s value added accounted, on average, for 3.6 percent of GDP in developing countries and 4.3 percent in developed countries (see Table 3.1). MGI (2011: 15) produced a similar study based on the BCG’s method and found an average value add for the Internet of 3.4 percent (across all countries). Table 3.1. The Internet’s share of GDP in 2009 and 2010 McKinsey Global Institute (2011: 15), 2009
Country Percent contribution Sweden 6.3 United Kingdom 5.4 South Korea 4.6 Japan 4.0 United States 3.8 Germany 3.2 India 3.2 France 2.1 Canada 2.7

Cyber Risk Extended Report 27
China 2.6 Italy 1.7 Brazil 1.5 Russia 0.8
Boston Consulting Group (2012: 9), 2010
United Kingdom 8.3 South Korea 7.3 China 5.5 Japan 4.7 United States 4.7 India 4.1 Australia 3.3 Germany 3.0 Canada 3.0 France 2.9 Mexico 2.5 Brazil 2.2 Saudi Arabia 2.2 Italy 2.1 Argentina 2.0 South Africa 1.9 Russia 1.9 Turkey 1.7 Indonesia 1.3
Boston Consulting Group (2011: 12), 2010
Sweden 6.6 Hong Kong 5.9 Denmark 5.8 Netherlands 4.3 Czech Republic 3.6 Poland 2.7 Belgium 2.5 Spain 2.2 Egypt 1.6
Source: Boston Consulting Group (BCG). 2012. The Internet Economy in the G-20: the $4.2 Trillion Growth Opportunity. Boston Consulting Group, Boston; BCG. 2011. Turning Local: From Madrid to Moscow, the Internet is Going Native. Boston Consulting Group, Boston; MGI. 2011. Internet matters: The Net’s sweeping impact on growth, jobs, and prosperity. McKinsey Global Institute.
The BCG reports also provide a forecast of the Internet Economy’s GDP share for each country out to 2016. The forecast shows strong growth in developing economies and much slower growth in developed, with most developing economies seeing compounded annual growth rates of between 11 and 24 percent while developed economies grow at 6 to 8 percent per year. Between 2010 and 2016, the average developed economy sees the Internet economy’s GDP share increase from

Cyber Risk Extended Report 28
4.3 percent to 5.5 percent (a 27 percent increase) and the average developing economy sees it grow from 3.6 to 4.9 percent (a 36 percent increase). More broadly across the whole ICT sector, and more focused on the production side, according to Atkinson and Stewart (2013: 3) global output from the ICT sector accounted for 6 percent of the world’s GDP in 2010, more than double what it was in 1995.10 Based on data from the OECD, the size of the ICT sector in developed countries, when measured as a share of the total business sector’s value added, appears to have followed an inverted U-shaped pattern between 1995 and 2011.11 Over this period, the average OECD country saw its ICT share increase from 6.6 percent in 1995 to a high of 9.5 percent in 2003, before undergoing a slow decline to a low of 5.9 percent in 2011(see Figure 3.1).12 In general, more than half of OECD countries maintained an ICT share between 5 and 10 percent of total business value added throughout the time period. Data is much sparser for developing countries, but in general, their ICT shares also tend to average between 5 and 11 percent of total business sector value added.13
10 According to the McKinsey Global Institute, the Internet by itself contributed some $1,7 billion dollars or 2.9% to global GDP in 2009, more than the entire GDP of Canada. If the Internet were its own sector it would have a greater contribution to GDP at the global level than the education, agriculture, utilities, or mining sector (MGI 2011: 1—2).
11 Total business sector value added refers to the value added by all non-agriculture (incl. hunting and fishing), real estate, and community (non-market activities like public administration, education, and health services) activities (OECD STAN database for Industrial Analysis, available at: www.oecd.org/sti/stan)
12 Data from the OECD Factbook database. Years with data include: 1995, 2003, 2006, 2008, 2009, 2011. Available at: http://www.oecd-ilibrary.org/economics/data/oecd-factbook-statistics/oecd-factbook_data-00590-en [accessed on 5/11/15]
13 Data from UNCTADstat database, available at: http://unctad.org/en/Pages/Statistics.aspx [accessed on 5/11/15].

Cyber Risk Extended Report 29
Figure 3.1. ICT value added as a percentage of total business sector value added, average of OECD countries, 1995—2011 Source: OECD Factbook database, share of ICT value added, available at: http://www.oecd-ilibrary.org/economics/data/oecd-factbook-statistics/oecd-factbook_data-00590-en [accessed on 5/11/15] There are important implications of this analysis of ICT sector value added for our modeling of future ICT economic impact. Attention to the new or digital economy goes back to the 1990s and coincides heavily with rapid growth in the use of personal computers and the internet. Over that time the size of the ICT production sector itself (hardware and software) within the global economy grew rapidly, but has largely stabilized and even retreated in many countries. It is interesting to note that the energy sector globally is about 5-6 percent of GDP and quite stable, about the current size of the ICT sector. Although some countries will experience a rise in the relative size of their ICT sectors, it seems likely that others will have largely offsetting decreases. Therefore in our economic analysis we will pay no real attention to this aspect of ICT’s economic contribution. Instead, we will focus on the secondary, broader effects of the ICT revolution.
ICT investment and capital services Economic production is almost always explained most proximately as a result of capital, labor, and multifactor (or total factor) productivity (MFP or TFP). Each of these factors is a stock that accumulates (or depreciates/declines) over time, and analysts and forecasters calculate annual production (a flow) from them using Cobb-Douglas or similar production functions (as we do in the International Futures forecasting system). A considerable amount of growth in the capital stock of countries in recent years across all sectors has been investment in ICT capital. Assuming rational investment
0%
2%
4%
6%
8%
10%
12%

Cyber Risk Extended Report 30
decisions, it is reasonable to posit that the contribution of ICT capital deepening to economic growth is comparable to that of non-ICT capital.14 This provides a general basis on which to assess the contribution of ICT capital investment not just within the ICT sector, but across the entire economy. In addition, however, there is the productivity term in the production function, which drives growth mostly upward independently of the capital and labor stocks. A major uncertainty concerning the ICT contribution to growth (to which we will return below) surrounds its impact on MFP. The Conference Board (CB) used a standard growth accounting framework to calculate the contribution of growth in a country’s ICT capital services (IT hardware, software, and telecommunications equipment) to GDP growth over the period from 1990 to 2013 for 122 countries, developed and developing. The CB found that, at the global level, ICT capital contributed between 0.5 and 0.7 percent to GDP growth from 1997 to 2013, with developed economies seeing less of a contribution (0.3—0.6 percent) than developing (0.7—1.0 percent). In general, most countries seemed to follow a pattern of more rapid growth between 1997 and 2006, slower growth from 2007-2011, and then a return to more rapid growth in 2012—2013 (see Figure 3.2, which shows the contribution by World Bank income-level groupings) (CB 2014: 13). In terms of its share of total growth, ICT capital services at the global level accounted for 18.4 percent of total GDP growth (compared to contributions from labor, labor quality, non-ICT capital, and TFP growth) per year from 1997—2006, saw a low of 13.2 percent in 2011, and reached a high of 24.1 percent in 2013. ICT accounted for a larger share of total GDP growth in developed countries (21.4 percent between 1997-2006, 17.6 percent in 2011, and 38.5 percent in 2013) than in developing countries (12.7 percent in 1997-2006, 11.3 percent in 2011, and 21.7 percent in 2013); because economic growth has been faster in developing countries than in high-income ones, however, a lower share could still generate a higher percentage point contribution to growth rates.
14 As Conference Board (undated: 9) notes suggest: “It is assumed that the total value of capital services equals its compensation for all assets. For each country, this nominal rate of return is invariant across different asset types, but varies across time.”

Cyber Risk Extended Report 31
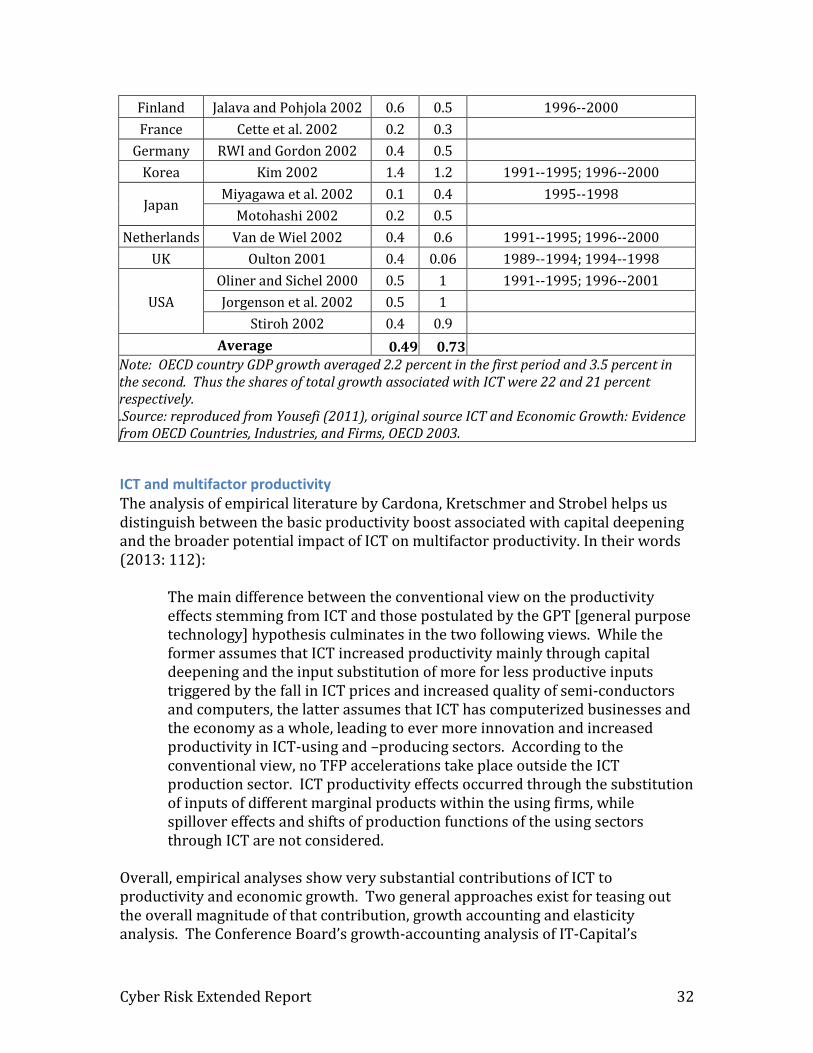
Figure 3.2. ICT capital services’ contribution to GDP growth by WB country income group, 1990—2012 Note: simple cross-country averages of raw data used for each income grouping. Source: The Conference Board Total Economy Database, Contribution of ICT Capital Services to GDP Growth, 2014, available at: https://www.conference-board.org/data/economydatabase/index.cfm?id=27762 Yousefi’s 2011 survey of existing studies, this time focusing on the earlier 1990—2000 period, also found a positive time trend in ICT’s impact. Taken together, the 17 studies identified found that ICT investment contributed 0.49 percentage points to GDP growth between 1990 and 1995 and 0.72 percentage points between 1995 and 2000 (see Table 3.2). And an estimate by the OECD for OECD countries found ICT investment to provide anywhere from a 0.3—1.3 percentage point contribution to GDP growth over the 1995—2001 period, with the strongest growth reported in countries with the most ICT capital, like the US and Korea.
Table 3.2. Impact of ICT investment on GDP growth: results from national studies
Country Study 1990--1995
1995--2000
Different years by study
Australia
Parham et al. 2001 0.7 1.3 1989/1990--1994/1995; 1994/1995--1999/2000
Simon and Wardop 2001 0.9 1.3 1991--1995; 1996--2000
Gretton et al. 2004 0.6 1.1 1989/1990--1994/1995; 1994/1995--1999/2000
Belgium Kegels et al. 2002 0.3 0.5 1991--1995
Canada Armstrong et al. 2002 0.4 0.7 1988--1995
Khan and Santos 2002 0.3 0.5 1991--1995; 1996--2000
0.00
0.50
1.00
1.50
2.00
2.50
3.001
99
0
19
91
19
92
19
93
19
94
19
95
19
96
19
97
19
98
19
99
20
00
20
01
20
02
20
03
20
04
20
05
20
06
20
07
20
08
20
09
20
10
20
11
20
12
Pe
rce
nt
High-income countries Upper-middle-income countries
Lower-middle-income countries Low-income countries
World
Cyber Risk Extended Report 32
Finland Jalava and Pohjola 2002 0.6 0.5 1996--2000
France Cette et al. 2002 0.2 0.3
Germany RWI and Gordon 2002 0.4 0.5
Korea Kim 2002 1.4 1.2 1991--1995; 1996--2000
Japan Miyagawa et al. 2002 0.1 0.4 1995--1998
Motohashi 2002 0.2 0.5
Netherlands Van de Wiel 2002 0.4 0.6 1991--1995; 1996--2000
UK Oulton 2001 0.4 0.06 1989--1994; 1994--1998
USA
Oliner and Sichel 2000 0.5 1 1991--1995; 1996--2001
Jorgenson et al. 2002 0.5 1
Stiroh 2002 0.4 0.9
Average 0.49 0.73
Note: OECD country GDP growth averaged 2.2 percent in the first period and 3.5 percent in the second. Thus the shares of total growth associated with ICT were 22 and 21 percent respectively. .Source: reproduced from Yousefi (2011), original source ICT and Economic Growth: Evidence from OECD Countries, Industries, and Firms, OECD 2003.
ICT and multifactor productivity The analysis of empirical literature by Cardona, Kretschmer and Strobel helps us distinguish between the basic productivity boost associated with capital deepening and the broader potential impact of ICT on multifactor productivity. In their words (2013: 112):
The main difference between the conventional view on the productivity effects stemming from ICT and those postulated by the GPT [general purpose technology] hypothesis culminates in the two following views. While the former assumes that ICT increased productivity mainly through capital deepening and the input substitution of more for less productive inputs triggered by the fall in ICT prices and increased quality of semi-conductors and computers, the latter assumes that ICT has computerized businesses and the economy as a whole, leading to ever more innovation and increased productivity in ICT-using and –producing sectors. According to the conventional view, no TFP accelerations take place outside the ICT production sector. ICT productivity effects occurred through the substitution of inputs of different marginal products within the using firms, while spillover effects and shifts of production functions of the using sectors through ICT are not considered.
Overall, empirical analyses show very substantial contributions of ICT to productivity and economic growth. Two general approaches exist for teasing out the overall magnitude of that contribution, growth accounting and elasticity analysis. The Conference Board’s growth-accounting analysis of IT-Capital’s
Cyber Risk Extended Report 33
contribution to global growth suggests that between 15-25 percent of growth since 1997 is associated with it. Cardona, Kretschmer and Strobel (2013: 116-117) review a range of growth accounting exercises for the European Union and the United States across the 1990-2007 period. Those analyses suggest between 17 and 70 percent (the high value for the US in 1995-2000) of labor productivity gains can be accounted for by ICT. The comparative growth accounting analysis of Yousefi (2011) noted above and used in Table 3.2 found a similarly wide range of impacts. Cardona, Kretschmer and Strobel (2013: 118) also reviewed a very wide range of studies using the elasticity approach, which relates incremental ICT capital to incremental production and find a strong cluster of estimates in the 0.05-0.06 range.15 Thus if ICT capital were to double in about 20 years, which our analysis suggests will probably do globally between 2010 and 2030, that would produce roughly a 10 percent increase in GDP, or about 0.5 percent each year (and if global growth over that period were to average 3.5 percent, that would account for about 15 percent of it).16 As we shall see below, many elasticity analyses use a technology proxy such as broadband penetration rates rather than capital stock and produce estimates of similar magnitude. Across their wide survey of empirical work, Cardona, Kretschmer and Strobel (2013) analyzed a wide range of studies that use a significant range of methodologies for industry data and regression analysis. They summarized the results and conclude that “We find strong indication but no final evidence that ICT is a General Purpose Technology” (Cardona, Kretschmer and Strobel 2013: 122).
Comparing the Productivity Impacts of GPTs: Steam, Electricity, ICT ICT is the latest in a long line of general purpose technologies (GPTs) that have provided transformative productivity boosts. A major debate in the literature is whether the gains currently seen from ICT live up to those from earlier GPTs like electricity and steam power (Gordon 2014; 2012). In the past, the advent of each new GPT followed a similar development path: slow initial uptake, a long delay between the increase in the pace of technological change and a measurable increase in productivity (Solow’s productivity paradox), a marked increase in productivity as the technology becomes more widespread and the rate of diffusion increases, and an eventual saturation and stagnation in productivity as full deployment is reached (Atkeson and Kehoe 2007; Moser and Nicholas 2004; Jalava and Pohjol 2008). For
15 Another study not in their set, Hanclova et al. (2015: 400), found that the elasticity of ICT capital to total economic growth in EU-14 countries remained stable at 0.032% and in EU-7 countries at 0.087% between 1994—2008.
16 In another way of putting this, Cardona et al. (2013) in their survey of the ICT investment literature found that from 1995 to 2012, a 10 percent increase in total ICT investment translated to a 0.5—0.6 percentage point increase in the growth rate of labor productivity in the average country. They also found a positive time trend between studies when it comes to the elasticity between ICT investment and productivity, with ICT’s impact increasing over time in the average country.
Cyber Risk Extended Report 34
steam power, the major productivity gains began after 1830 and reached their peak in 1850, 100 years after Watt’s steam engine (Crafts 2004). For electricity, it was 50 years after the building of the first electrical power plant before electricity had a significant impact on productivity (Edquist and Kenrekson 2006; Moser and Nicholas 2004). ICT also saw an initial delay in productivity gains, with the significant gains of the 1990s (from computers) coming 40 years after the first mainframe computers (other forms of ICT had earlier impacts). The length of time between initial invention of a GPT and its productivity impact tends to depend on the size of the knowledge stock of old technologies, i.e. the “extent of knowledge about business practices that business organizations built up before the [GPT] revolution,”—with the larger the stock, the slower the transition (Atkeson and Kehoe 2007: 66). GPTs also appear to trigger productivity slowdowns during the initial phase of their adoption due to disruption of old structures and learning processes (Atkeson and Kehoe 2007; Jovanovic and Rousseau 2005; ). Steam and then electricity both had to overcome very large knowledge stocks—water and animal power for steam and then steam for electricity. The rapid advance of ICT and its myriad forms tend to benefit from smaller stocks of knowledge that have less time to accumulate (Atkeson and Kehoe [2007] point out that there is little direct evidence of the extent of ICT’s knowledge stock). Thus, unlike earlier GPTs, we can measure productivity gains from the newest forms of ICT like mobile broadband, only a few years after their initial introduction rather than half a century or more. If the speed of ICT’s development and pace of productivity impacts are faster than earlier GPTs, how does the magnitude of impact compare? Here the literature is mixed, with divisions between the Pessimist and Optimist camps. But several studies comparing the productivity gains from steam, electricity and ICT have found that ICT is already providing significantly greater productivity gains than those earlier technologies. Using growth accounting methods, Crafts (2004: 341) found that ICT, at its peak in 1996—2001 contributed 1.79 percentage points per year to labor productivity in the United States (57 percent from capital deepening, 43 percent from TFP) compared to 0.98 percentage points from electricity at its height in 1919—1929 (Crafts 2002: 22) and 0.41 percentage points from steam in 1850—1870 (Crafts 2004: 348) (see Figure 3.3). Similarly, Javala and Pohjol (2008: 272), found that for Finland, ICT contributed 1.54 percentage points to GDP growth per year from 1990 to 2004, compared to electricity, which contributed 0.52 percentage points per year from 1920—1938. ICT’s total contribution to growth increased from an electricity-like 0.48 percentage points in 1980—1990 to 1.54 percentage points due largely to major gains in MFP, the contribution from which increased from 0.26 percentage points to 0.91 percentage points by 2004 (282).
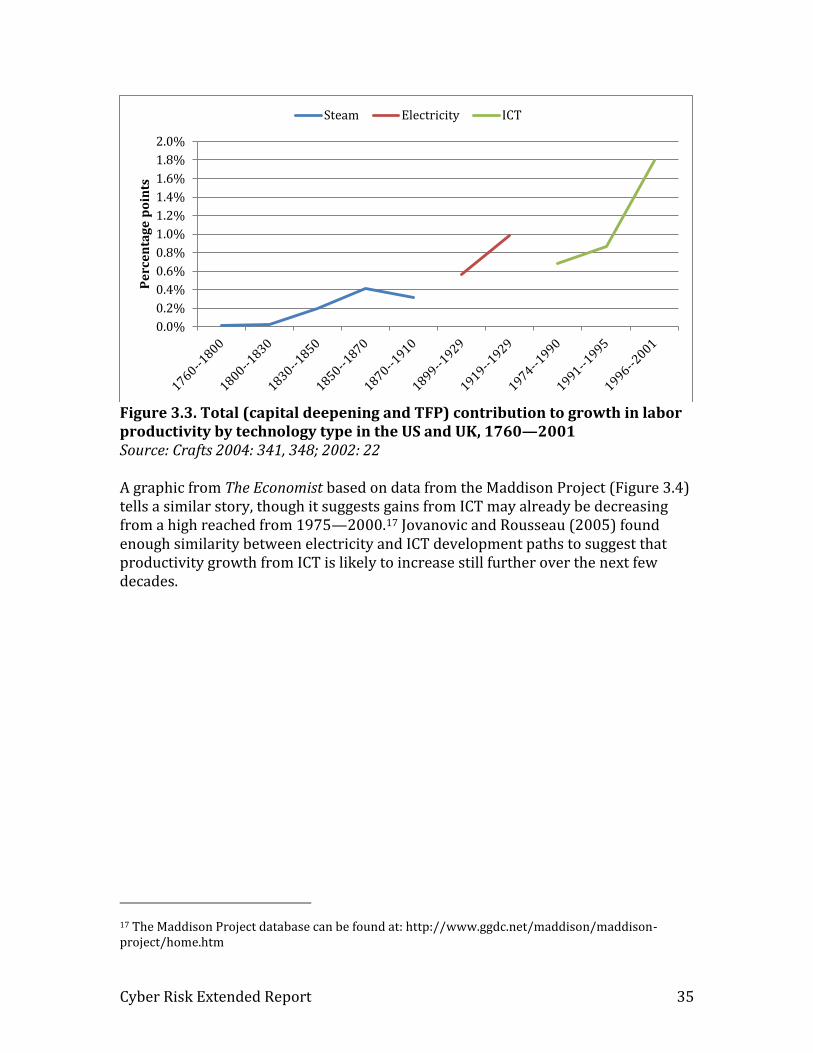
Cyber Risk Extended Report 35
Figure 3.3. Total (capital deepening and TFP) contribution to growth in labor productivity by technology type in the US and UK, 1760—2001 Source: Crafts 2004: 341, 348; 2002: 22 A graphic from The Economist based on data from the Maddison Project (Figure 3.4) tells a similar story, though it suggests gains from ICT may already be decreasing from a high reached from 1975—2000.17 Jovanovic and Rousseau (2005) found enough similarity between electricity and ICT development paths to suggest that productivity growth from ICT is likely to increase still further over the next few decades.
17 The Maddison Project database can be found at: http://www.ggdc.net/maddison/maddison-project/home.htm
0.0%
0.2%
0.4%
0.6%
0.8%
1.0%
1.2%
1.4%
1.6%
1.8%
2.0%P
erc
en
tag
e p
oin
ts
Steam Electricity ICT

Cyber Risk Extended Report 36
Figure 3.4. Average annual percent change in GDP per capita over 25-year periods with technological advances highlighted. Source: “The third great wave,” the Economist.com, October 4th 2014. Available at: http://www.economist.com/news/special-report/21621156-first-two-industrial-revolutions-inflicted-plenty-pain-ultimately-benefited A particularly interesting takeaway from these studies is that much of the productivity gain from each GPT came from those sectors using rather than just producing the technology, although not all studies succeeded in measuring (or even took into account) actual spillovers from the technologies (Edquist and Henrekson 2006).
Variation in ICT Impact across Time/Pervasiveness and Countries A large number (but not all) of studies in the literature suggest that the contribution of ICT to economic growth has been increasing over time. Obviously time is not the driver, but rather the advance of the technology and its penetration rate across countries. Similarly, studies seem to suggest a lower share of GDP growth associated with ICT in less economically advanced countries where penetration rates are lower. We explore these issues in turn.
Drivers of variation in ICT impact: ICT (especially broadband) pervasiveness Many studies look at relationship between the level of ICT pervasiveness and productivity rates, particularly in regards to access rates, quality, and intensity of use. The first such studies examined the impact of fixed-line telephones on productivity. Röller and Waverman (2001: 919), for example found that from 1970 to 1990 fixed telephone lines in OECD countries increased annual gross national product (GNP) growth in those countries by 0.59 percentage points. For mobile phones, a 10 percent increase in penetration rates in developing countries increased GDP per capita growth by between 0.6 percentage points and 1.2 percentage points

Cyber Risk Extended Report 37
(Waverman et al. 2005: 21; Deloitte 2012: 4).18 Over time, the impact of these traditional ICTs has lessened compared to newer ICTs. In the case of fixed-line phones, this is likely because most developed countries reached saturation long ago and most developing countries have leapfrogged them in favor of mobile connections. Standard mobile phones are reaching a similar point of saturation in many countries. Sabaggh et al. (2012: 13), using the Digitization Index described above, found that the impact of digitization accelerates as countries reach higher Index values. For those countries at the lowest digitization levels (Constrained), a 10 percentage point increase in digitization contributed 0.5 percentage points to GDP per capita growth. For midlevel countries (Emerging and Transitional), the impact was 0.51 and 0.59 percentage points, respectively. Finally, for countries with advanced levels of digitization, the annual contribution of digitization to GDP per capita was 0.62 percentage points. The authors highlighted the importance of such indices in capturing the multiplier effect of the technology ecosystem that is lost when studies only focus on a single technology like broadband. Interestingly, the authors also calculated the impact of digitization on HDI. They found that a 10 percentage point increase in the Digitization Index led to a .13 point increase in the HDI (Sabaggh et al. 2012: 15). Many more studies (and also policy analyses) suggest a useful stylized fact concerning the impact of modern ICTs on economic growth: a 10 percentage point increase in access to broadband (fixed or mobile) or the Internet yields a 0.9 to 2.0 percentage point increase in the growth rate of a country’s GDP per capita (see Table 3.3) 19 —with developed countries tending to see a rate of increase at the lower end of the range and developed countries the higher (WEF 2009: 3). Our figure in IFs for global broadband penetration rate in 2015 is 14 percent with a forecast of 32 percent by 2030, an average of about 1 percent gain each year. In combination with the stylized fact, that would suggest an economic growth impact globally of broadband advance alone of about 0.09-0.2 percentage points.
18 The Deloitte (2012: 9) report also found that had the countries studied had mobile penetration rates that were 10 percent higher between 1995 and 2010, “they would have experienced on average in the long run a TFP increase of 4.2 percentage points.”
19 The Koutroumpis (2009) study is an outlier on the downward side.

Cyber Risk Extended Report 38
Table 3.3. ICT’s Impact on Economic Growth by Technology and Study
Author Countries Time Period Impact
Broadband
Atkinson and Stewart (2013: 5)
10% increase in broadband penetration rates raises GDP growth by 0.25 and 1.38 percentage points
Czernich et al. (2009: 505)
25 OECD countries
1996--2007
10% increase in broadband penetration rates raises GDP per capita growth by 0.9--1.5 percentage points
Koutroumpis (2009: 477)
22 OECD countries
2002--2007
For every 10% increase in broadband penetration GDP growth rate increases by 0.25%*
Qiang et al. (2009: 45)
186 countries all income levels
1980--2002
10% increase in broadband penetration yields an additional 1.21 percentage points to GDP growth in high-income countries and 1.38 percentage points in low- and middle-income countries
Waverman (2009)
High and medium income countries
For every 10% increase in penetration, productivity grows by 1.3%*
Internet
Deighton and Quelch (2009: 4)
United States 2008
Internet contributed 2% of total GDP based on number of jobs relying on the Internet
Qiang et al. (2009: 45)
186 countries all income levels
1980--2002
10% increase in Internet penetration increases GDP growth by 0.77 percentage points in high-income countries and 1.12 percentage points in low- and middle-income countries
Mobile phones
Qiang et al. (2009: 45)
186 countries all income levels
10% increase in mobile phone penetration increases GDP growth by 0.60 percentage points in high-income countries and 0.81 percentage points in low- and middle-income countries
Waverman et al. (2005: 21)
100 Developing Countries
1996--2003
10% increase in mobile phone penetration raises GDP per capita growth rate by 0.59 percentage points
Fixed-line telephones
Qiang et al. (2009: 45)
186 countries all income levels
10% increase in fixed telephone penetration increases GDP growth by 0.43 percentage points in high-income countries and 0.73 percentage points in low- and middle-income countries
Röller and Waverman (2001: 919)
21 OECD countries
1970—1990
Average annual impact of telephones is 0.59 of GNP growth
*results multiplied by 10 for better comparison with other studies
The economic benefit from increasing access to ICT tends to follow an inverted U-
Cyber Risk Extended Report 39
shape relationship. At low levels of penetration, ICT’s impact on growth is negligible. The magnitude of the impact then increases as a critical mass is reached and then declines once saturation is achieved (ITU 2012). Koutroumpis (2009: 482), for example, found that for developed countries with low broadband penetration rates (below 20 percent), the average impact on GDP growth was 0.15 percent, while developed countries with mid-level broadband penetration (between 20 percent and 30 percent) averaged 0.23 percent, and those with high penetration (above 30 percent) averaged 0.39 percent—the authors also point out that, unlike earlier ICT technologies, broadband has yet to near saturation. Gruber et al. (2014: 1055) and Röller and Waverman (2001: 921) both identified access level thresholds of 15 percent and 40 percent, respectively, after which gains from access rapidly accelerated. It is important to note, however, that the patterns of saturation and the declining growth impact of traditional ICTs may not necessarily represent the future for broadband-based ICTs. While the benefits from access may saturate, additional benefits can continue to accrue beyond the access inflection point due to advances in speed and reliability and reductions in cost even as overall access rates remain unchanged. For example, Rohman and Bohlin (2012: 12) found that doubling broadband connection speeds would contribute an additional 0.3 percentage points to annual GDP growth beyond contributions due to general access (when the average speed was 8.3Mps). Sosa (2014: 1,5) found that the transition to gigabit broadband (100x faster than standard broadband connections) could produce economic benefits equal to the earlier transition from dial-up to broadband (once the technology becomes widely available, at more than 50 percent access).
Drivers of variable ICT impact: Beyond PCs and broadband Although broadband internet access is a major focus now, as was access to PCs in the 1990s, new technologies and new ways of applying existing ones will likely generate even more value for the global economy. The MGI (2013) study on disruptive technologies looks at the potential economic value in 2025 of 12 “up and coming” technologies likely to disrupt current economic patterns.20 The spread of mobile internet technologies, for example, could generate some $3.7 trillion to $10.8 trillion for the global economy each year by 2025 (MGI 2013: 34)—of which $2.7 to $6.0 trillion would be directly captured by GDP, the rest, $1 to $4.8 trillion would come in the form of consumer surpluses. This suggests that by 2025, some 1.9 percent to 4.2 percent of the world’s GDP could come from mobile internet technologies.21 For cloud computing, the estimated overall economic impact in 2025
20 Note: each technology’s value is given in terms of its total economic value, including contribution to GDP and consumer surplus and it states that the reported values should not be compared with GDP. The report, however, does provide a breakdown for a few of the technologies.
21 Percentages are calculated by taking MGI’s estimated potential economic impact, subtracting their estimated consumer surplus and dividing that by the IFs global GDP forecast for 2025 ($141 trillion).

Cyber Risk Extended Report 40
could range from $1.7 to $6.2 trillion dollars, of which $1.2 to $5.5 trillion could stem from consumer surpluses from using cloud-enabled Internet services, meaning by 2025, cloud computing could account for $0.5 to $0.7 trillion or 0.35 percent to 0.49 percent of global GDP (64). In MGI’s (2013: 12) estimation of the economic impact of other directly ICT-related technologies like the automation of knowledge work ($5.2—$6.7 trillion), autonomous cars ($0.2--$1.9), the internet of things ($2.7—$6.2), and advanced robotics ($1.7—$4.5), they do not identify the consumer surplus portion, but it seems safe to assume that not all of the impact estimated would be directly on GDP. What the MGI (2013) study and other work suggests, however, is that the economic impact of ICT will not fade away with the saturation of broadband internet access, any more than it did after widespread adoption of personal computers. A useful mental model may be of sub-waves within the long wave of ICT transformation, each of which leave their mark on economic growth even as they blend into each other to a significant degree. We can see just such a pattern looking at the impact of past ICT developments. MGI (2011b: 25), for example, identified four waves of ICT adoption since the 1950s, each of which had its own impact on productivity growth in the United States (see Figure 3.5). First wave was the “mainframe” era, which ran from 1959 to 1973. During this early period, ICT’s contribution to labor productivity was low, responsible for about 11 percent of total productivity and its share of overall capital expenditure was also low. The second wave, the “microcomputers and PCs” era, lasted from 1973 to 1995. It built on the first wave and while the overall period saw lower productivity gains than in the first period (1.49 percent growth versus 2.82 percent), the contribution from ICT increased to 43 percent thanks to significant capital deepening. The third wave, “Internet and Web 1.0” lasted from 1995—2000, and rapid productivity growth underpinned by significant capital deepening and rapid improvements in quality that increased ICT’s contribution to productivity to 59 percent of total. The fourth and most recent wave, “mobile devices and web 2.0,” saw a change in the way ICT contributes to productivity, with the impact of capital deepening beginning to abate while the impact from innovation rose.
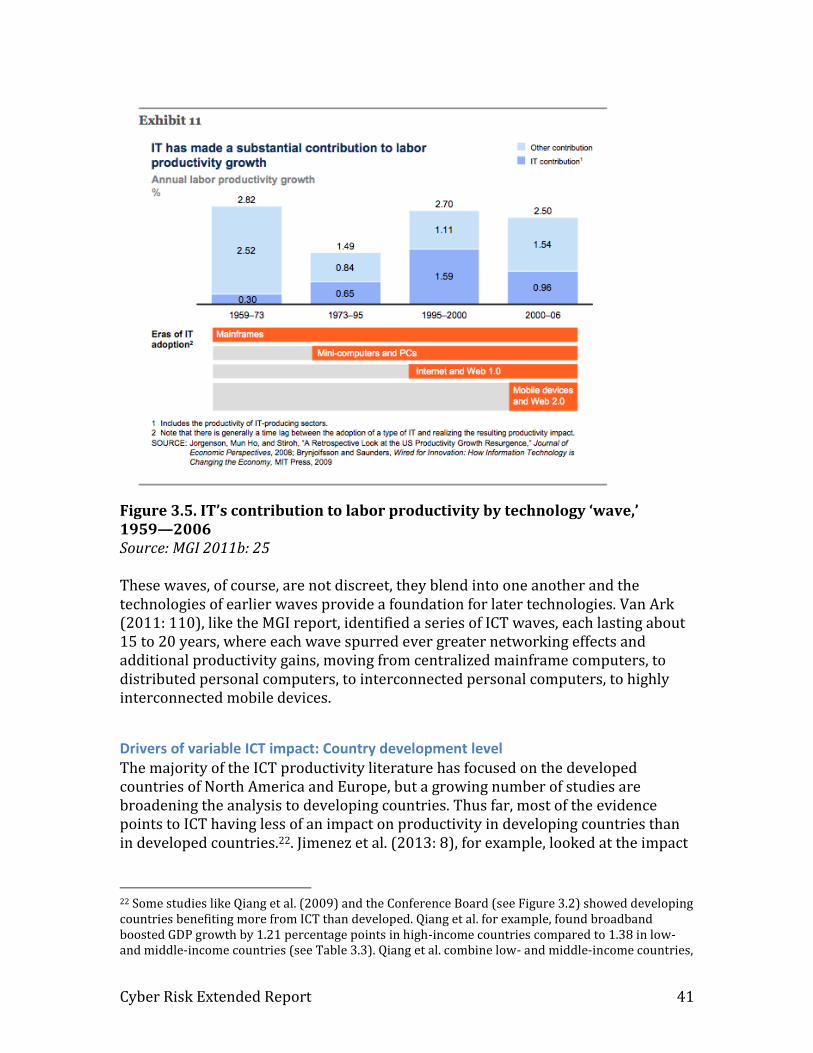
Cyber Risk Extended Report 41
Figure 3.5. IT’s contribution to labor productivity by technology ‘wave,’ 1959—2006 Source: MGI 2011b: 25 These waves, of course, are not discreet, they blend into one another and the technologies of earlier waves provide a foundation for later technologies. Van Ark (2011: 110), like the MGI report, identified a series of ICT waves, each lasting about 15 to 20 years, where each wave spurred ever greater networking effects and additional productivity gains, moving from centralized mainframe computers, to distributed personal computers, to interconnected personal computers, to highly interconnected mobile devices.
Drivers of variable ICT impact: Country development level The majority of the ICT productivity literature has focused on the developed countries of North America and Europe, but a growing number of studies are broadening the analysis to developing countries. Thus far, most of the evidence points to ICT having less of an impact on productivity in developing countries than in developed countries.22. Jimenez et al. (2013: 8), for example, looked at the impact
22 Some studies like Qiang et al. (2009) and the Conference Board (see Figure 3.2) showed developing countries benefiting more from ICT than developed. Qiang et al. for example, found broadband boosted GDP growth by 1.21 percentage points in high-income countries compared to 1.38 in low- and middle-income countries (see Table 3.3). Qiang et al. combine low- and middle-income countries,
Cyber Risk Extended Report 42
of infodensity levels (represented by ICT access rates and ICT-related skills—proxied by secondary and tertiary education enrollment rates) on productivity in developed and developing countries. They found the impact to be significantly greater for developed than developing countries (a regression result of 0.135 versus 0.0126 for GDP per capita). Jimenez et al. (2013) and Yousefi (2011) identified three primary causes for this: (1) developing countries are behind in investing in R&D and adapting ICTs; (2) their workers lack the skills necessary to take full advantage of the technologies; and (3) ICT-related data from developing countries tends to be scarce and rather poor. Similarly, Yousefi (2011: 590) found that while developed countries and upper-middle-income countries both saw significant productivity boosts from ICTs, lower-middle- and low-income countries saw little to no impact. Interestingly, Yousefi found that upper-middle-income countries had the highest coefficient when it came to ICT capital investment’s impact on GDP growth, at 0.35, compared to 0.22 for high-income countries and 0.22 for all countries combined. Lee, Gholami, and Tong (2005) found that while ICT investment contributes to productivity and GDP growth in many developed countries, for many developing countries the direction of causality is actually reversed, with economic growth spurring investment in ICT. The differences between developed countries and developing countries suggests that ICTs’ impact on growth depends largely on what Yousefi (2011) called the “capacity to benefit”—which includes human capital (educational attainment, manpower skills), market structure, legal and institutional frameworks, supportive industries, transportation, and distribution networks, etc. In terms of our forecasting, the discussions of the impacts on growth of time/ICT penetration and of developmental level tend to reinforce each other. In both cases, higher penetration or use seem pretty clearly, and not surprisingly associated with greater impact. Our forecasting formulation for GDP impact of ICT should reflect this. In the case of developing countries, lower levels of human capita reinforce the lesser impact association with lower levels of pervasiveness. In fact, this analysis more generally suggests a formulation that might attribute in Base Case analysis about 20 percent of economic growth to ICT in the most highly penetrated countries and lesser amounts in less penetrated and therefore also generally less economically-developed ones.
Consumer Surplus A major part of the Optimistic argument concerning ICT’s economic impacts—and those of technology more generally—is that standard economic measures like GDP
however, making it unclear whether there is a difference between those countries of upper-middle-income status (i.e. China) and those of low-income countries, as one would expect.
Cyber Risk Extended Report 43
do not capture all the welfare, or network, effects that arise from their use. This is particularly problematic when trying to accurately measure the economic impact of Internet-based technologies, where free services like email, search engines, and social networks obviously impact the ways people work and live but do not necessarily generate the sort of monetary transactions that would cause their effects to show up in a country’s national accounts. The need to address this shortcoming has led researchers to develop ways to calculate the monetary consumer surplus such technologies produce as prices decline. The ICT consumer surplus represents the net monetary value of consumer-derived benefits from consuming an ICT product or service after taking into account: (1) the consumer’s willingness to pay for the service; (2) the actual cost of the service; and (3) any pollution effects arising from the use of the service (i.e. the negative effects of advertising interruptions, loss of privacy, data theft, etc.) (MGI 2011: 54; OECD 2013; Dutz et al. 2009). The size of the ICT consumer surplus is thus driven by two main factors: the rate of ICT adoption or penetration, and declining unit prices—which are, in turn, driven by income (ICT adoption), productivity gains, and competition (price declines) (Katz 2010). The most common approach to measuring consumer surplus revolves around consumer’s willingness to pay for broadband access and the change in broadband subscription costs over time. The assumption is, that anyone who upgrades from dialup to broadband service in a given year and pays the prevailing price for that year ought to be willing to pay that same price in later years in order to maintain their subscription even as the actual price of that subscription declines—broadband prices have been decreasing year after year, with the global average price for an entry-level subscription falling by 70 percent between 2008 and 2013.23 The difference between the original price paid and the current price represents the size of the surplus enjoyed by the consumer (i.e. money available for other spending). As the price decreases, consumers come to enjoy ever larger surpluses. Greenstein and McDevitt’s (2012; 2011; 2009) approach to calculating the annual broadband consumer surplus is perhaps the most widely cited and adopted method—the OECD (2013) adopted the approach for its own study of the impact of the Internet. Greenstein and McDevitt used the total number of broadband subscribers, total broadband revenue, the amount of cannibalized revenue resulting from the switch from dialup to broadband (what dialup revenue would have been without the advent of faster technologies), subscription cost over time, and an assumed willingness to pay based on an initial price.24 Using this method,
23 “ITU releases annual global ICT data and ICT Development Index country rankings,” November 24 2014, ITU.int, available at: http://www.itu.int/net/pressoffice/press_releases/2014/68.aspx#.VVJpEfnF98E [accessed on 5/12/15]
24 The OECD identified a number of factors that would impact a consumer’s willingness to upgrade from dialup to broadband and the anticipated value of broadband service. For consumer willingness,

Cyber Risk Extended Report 44
Greenstein and McDevitt (2012: 12) calculated the consumer surplus from broadband for 30 OECD countries. Taken together, consumers in these 30 countries enjoyed a surplus of $45.5 billion in 2010, or about 0.09 percent of their total GDP (the equivalent of 3 percent of GDP growth that year), up from $21.9 billion (0.05 percent of G) in 2006.25 These results, however, do not reflect the impact of improvements in service quality, nor does it take into account any possible network effects from increasing broadband penetration. .26 Greenstein and McDevitt (2012), thus, extended their analysis to provide “quality-adjusted” estimates of consumer surplus. The quality-adjusted consumer surplus takes into account the difference between the cost per megabyte per second of connection speed—if a subscriber paid $5 dollars per mb/s in 2005 and the cost per mb/s falls to $1 in 2010, that $4 dollar difference is the quality-adjusted consumer surplus. This approach tends to yield a much higher surplus than the standard approach. Greenstein and McDevitt (2012: 15) found that the annual quality-adjusted consumer surplus for the 30 OECD countries to be $436.9 billion in 2010 or about 0.89 percent of GDP—the equivalent of 28.9 percent of GDP growth from 2009—2010 (see Table 3.4 for individual country results reported in percent of total GDP). For most OECD countries, the surplus as a percentage of GDP growth ranged from 20 to around 55 percent in 2010. An earlier report by Greenstein and McDevitt (2009: 4) found that for the US, the consumer surplus from broadband was equivalent to between 31 and 47 percent of “newly created GDP.” Another important finding stemming from Greenstein and McDevitt’s work (2010: 13—14) is that changes in the size of a country’s consumer surplus are directly proportional to changes in the size and extent of its ICT networks. For the seven countries studied (US, UK, Canada, China, Brazil, Mexico, Spain), the authors found a correlation between the number of broadband subscribers and the size of the broadband bonus (revenue plus consumer surplus) of 0.91. This suggests that countries with high levels of ICT penetration ought to see large consumer surpluses.
the primary factors were savings on a second line, savings from reduced commute time, anticipated health and entertainment benefits, and savings on phone bills—assuming users move to Voice over IP. For service providers, the factors impacting the value of the service provided include the sale of second lines, revenue from dialup service (as well as revenue lost from conversion to broadband), and revenue from broadband service. As for the valuation of different broadband connections, Rosston et al. (2010) found that a household’s willingness to pay tends to increase with better speeds and increased reliability.
25 These percentages were calculated using the GDP MER historical series in IFs version 7.13
26 Changing prices to consumers not only affect their welfare, but potentially also their level of consumption. Oulton (2012: 1731) found that over the long run, assuming ICT intensity remains at current levels and the relative prices of ICT products continue to decline at 7% per year, ICT use will add, on average, 0.54 percentage points per year to consumption growth, on average, in 19 European countries. If, however, ICT intensity in Europe were to reach current levels in the United States or Sweden, ICT would contribute 0.74 percentage points to consumption.

Cyber Risk Extended Report 45
Table 3.4. Estimated annual consumer surplus from quality adjusted broadband in percent of GDP PPP
2006 2007 2008 2009 2010 Accumulated surplus*
Australia 0.18% 0.34% 0.54% 0.49% 0.78% 2.35%
Austria 0.01% 0.06% 0.29% 0.34% 1.11% 1.82%
Belgium 0.18% 0.18% 0.22% 0.49% 1.41% 2.50%
Canada 0.08% 0.14% 0.15% 0.42% 0.44% 1.24%
Czech Republic 0.72% 0.86% 3.92% 3.82% 3.68% 13.63%
Denmark 0.05% 0.31% 0.57% 0.55% 0.94% 2.44%
Finland 0.09% 0.28% 0.60% 0.33% 0.44% 1.75%
France 0.05% 0.08% 0.10% 0.27% 0.31% 0.81%
Germany 0.00% 0.07% 0.03% 0.04% 0.04% 0.18%
Greece 0.00% 0.02% 0.06% 0.25% 0.25% 0.58%
Hungary 0.16% 1.03% 2.51% 4.18% 4.03% 12.42%
Iceland 0.34% 0.40% 0.35% 0.48% 1.09% 2.69%
Ireland 0.05% 0.04% 0.33% 0.78% 0.90% 2.11%
Italy 0.96% 1.04% 1.24% 1.24% 1.17% 5.78%
Japan 0.03% 0.06% 0.05% 0.06% 0.10% 0.30%
South Korea 0.12% 0.17% 2.43% 2.09% 2.20% 7.18%
Luxembourg 0.05% 1.34% 1.51% 1.51% 1.95% 6.51%
Mexico 0.07% 0.15% 0.12% 0.18% 0.18% 0.70%
New Zealand 0.08% 2.26% 2.20% 2.01% 2.30% 9.15%
Norway 0.22% 0.27% 0.31% 0.54% 0.58% 1.93%
Poland 0.06% 0.21% 0.38% 0.42% 0.68% 1.76%
Portugal 0.09% 0.32% 0.90% 2.07% 1.90% 5.38%
Slovak Rep 0.00% 0.01% 0.20% 0.15% 0.15% 0.51%
Spain 0.06% 0.08% 0.22% 0.20% 0.21% 0.77%
Sweden 0.04% 0.07% 0.14% 0.13% 0.14% 0.52%
Switzerland 0.40% 0.47% 0.88% 1.20% 1.85% 4.89%
Turkey 0.15% 0.47% 0.50% 0.48% 0.49% 2.11%
United Kingdom 0.65% 0.71% 0.91% 2.11% 2.08% 6.62%
USA 0.05% 0.05% 0.30% 0.63% 0.62% 1.66%
Average 0.17% 0.40% 0.76% 0.95% 1.10% 3.42% *The accumulated benefit is the compounded annual benefits from 2006—2010 Source: OECD. 2013. Measuring the Internet Economy: A Contribution to the Research Agenda. OECD Digital Economy Papers, no. 226. OECD Publishing, Paris.
Estimates for ICT consumer surplus vary significantly between studies and from year to year due to what Gruber et al. (2014: 1048) described as the “particular dynamism of the ICT market” with its rapid improvements in quality and price
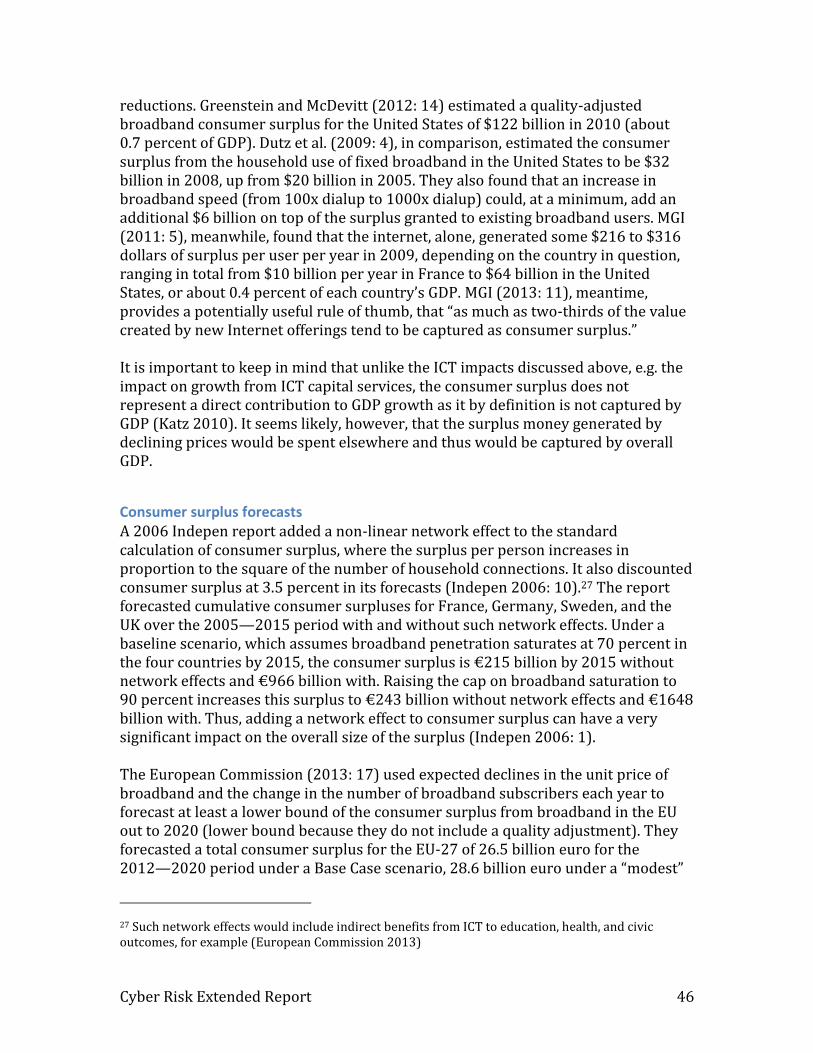
Cyber Risk Extended Report 46
reductions. Greenstein and McDevitt (2012: 14) estimated a quality-adjusted broadband consumer surplus for the United States of $122 billion in 2010 (about 0.7 percent of GDP). Dutz et al. (2009: 4), in comparison, estimated the consumer surplus from the household use of fixed broadband in the United States to be $32 billion in 2008, up from $20 billion in 2005. They also found that an increase in broadband speed (from 100x dialup to 1000x dialup) could, at a minimum, add an additional $6 billion on top of the surplus granted to existing broadband users. MGI (2011: 5), meanwhile, found that the internet, alone, generated some $216 to $316 dollars of surplus per user per year in 2009, depending on the country in question, ranging in total from $10 billion per year in France to $64 billion in the United States, or about 0.4 percent of each country’s GDP. MGI (2013: 11), meantime, provides a potentially useful rule of thumb, that “as much as two-thirds of the value created by new Internet offerings tend to be captured as consumer surplus.” It is important to keep in mind that unlike the ICT impacts discussed above, e.g. the impact on growth from ICT capital services, the consumer surplus does not represent a direct contribution to GDP growth as it by definition is not captured by GDP (Katz 2010). It seems likely, however, that the surplus money generated by declining prices would be spent elsewhere and thus would be captured by overall GDP.
Consumer surplus forecasts A 2006 Indepen report added a non-linear network effect to the standard calculation of consumer surplus, where the surplus per person increases in proportion to the square of the number of household connections. It also discounted consumer surplus at 3.5 percent in its forecasts (Indepen 2006: 10).27 The report forecasted cumulative consumer surpluses for France, Germany, Sweden, and the UK over the 2005—2015 period with and without such network effects. Under a baseline scenario, which assumes broadband penetration saturates at 70 percent in the four countries by 2015, the consumer surplus is €215 billion by 2015 without network effects and €966 billion with. Raising the cap on broadband saturation to 90 percent increases this surplus to €243 billion without network effects and €1648 billion with. Thus, adding a network effect to consumer surplus can have a very significant impact on the overall size of the surplus (Indepen 2006: 1). The European Commission (2013: 17) used expected declines in the unit price of broadband and the change in the number of broadband subscribers each year to forecast at least a lower bound of the consumer surplus from broadband in the EU out to 2020 (lower bound because they do not include a quality adjustment). They forecasted a total consumer surplus for the EU-27 of 26.5 billion euro for the 2012—2020 period under a Base Case scenario, 28.6 billion euro under a “modest”
27 Such network effects would include indirect benefits from ICT to education, health, and civic outcomes, for example (European Commission 2013)

Cyber Risk Extended Report 47
scenario (assumes a 5 percent reduction in deployment costs), and 31.9 billion euro under a “more optimistic” scenario (assumes a 10 percent reduction in deployment costs). The McKenzie Global Institute (MGI), as part of its investigation into the economic value of disruptive technologies, forecasted the potential consumer surplus from mobile Internet technologies and cloud computing, at the global level, out to 2025. They found that by 2025, mobile Internet technologies could produce a consumer surplus of between 0.7 percent and 3.3 percent of global GDP (between $1 and $4.8 trillion dollars) (MGI 2013: 37), with cloud computing producing an additional 0.84 to 3.9 percent of GDP ($1.2 trillion to $5.5 trillion) from cloud-enabled internet services (MGI 2013: 64). MGI’s consumer surplus forecasts were based on survey results on the value of the Internet to users and the expected increase in the number of users over time.
Summary of Knowledge Concerning Cyber Risk Benefits: Modeling Implications With respect to the ICT sector's share of the GDP, sources including the Boston Consulting Group (2011-2012), MGI (2011), and the OECD Factbook suggest very strongly that it is no longer growing faster than the broader economy and may, in fact be retrenching slightly. The modeling and forecasting implication of this is that our current representation of the ICT as a share of the global economy (approximately 6 percent and stable) is reasonable and we do not need to further consider an incremental growth contribution related to sector expansion or contraction. Considering the implication for our modeling of the existing analyses around both ICT capital services and the broader issue of whether ICT contributes as a General Purpose Technology to MFP growth suggests that there is not yet great clarity in separating the two effects in forecasting. Instead, we should develop a formulation that estimates positive economic growth impacts of ICT advance as a general portion of overall economic growth. In doing so, the studies of the Conference Board are particularly useful, as are the literature reviews of Yousefi (2011). These studies suggest that ICT capital services have been contributing about 20 percent to global economic growth (one-fifth of the total growth). 28 Global GDP growth in IFs between 2010 and 2020 (data and forecasts) averages about 3.2 percent, suggesting an ICT contribution of 0.64 percent. Although the proportionate contribution to growth of developing countries may have been lower in earlier years, the absolute contribution may have been higher; moreover, the proportionate and absolute contributions appear in Conference Board analysis to have accelerated in recent years, consistent with technological convergence. Growth contributions in low-
28 According to the McKenzie Global Institute (2011: 2-3) the internet alone over the 15 years from 1995 to 2009 accounted for 7 percent of GDP growth in surveyed economies (including the G8, China, India, Brazil, Sweden, and South Korea), and in the five years from 2004—2009 this percentage increased to 11 percent.
Cyber Risk Extended Report 48
income countries may even exceed 2 percent, or nearly a third of the total annual GDP growth, and in middle-income countries may be approximately 1-1.5 percent or near one-fourth of their total growth. Countries less penetrated by ICT should receive less growth impetus. These analyses suggest that we should represent and forecast the ICT contribution to global growth in terms of percentages of total growth from capital services. The review of broader contribution of ICT to multifactor productivity by Cardona, Kretschmer and Strobel (2013) was inconclusive, suggesting that we should perhaps not represent further increments to economic growth beyond that from the capital services analysis. In terms of our own forecasting efforts, it appears that the consumer surplus from ICT, would, if captured directly by GDP, represent a sizable boost to economies around the world, equivalent to between 20 and 55 percent of GDP growth in a given year—Greenstein and McDevitt (2012) calculated a combined surplus from broadband of $438 billion for the 30 OECD countries studied, about 29 percent of GDP growth from 2009 to 2010. For the average OECD country, the surplus amounted to a consumer benefit equal to 1 percent of GDP. Greenstein and McDevitt (2010) also found that the amount of surplus is directly proportional to the extent of broadband penetration, with a correlation of 0.91. These analyses suggest that the economic contribution of ICT to consumer surplus, as a percentage of GDP, could actually exceed the contribution of it to economic growth. Some of the MGI analyses of the impacts of disruptive technology similarly suggest that, at least in some cases, consumers capture considerably more benefit that is attributable to cyber’s impact on growth. Yet for our modeling we rely very heavily on two substantial data sources for both the initialization of these two economic benefits and for forecasting of them, namely on Conference Board data for growth contribution and on OECD data for consumer surplus. For OECD countries, those with the greatest overlapping coverage in the two datasets, a simple average of the Conference Board estimates in years near our base year of 2010 is that ICT contributions to growth exceed those to consumer surplus (as they probably do also for developing countries). High variability from year to year in both series makes direct comparison exceedingly difficult, but we have tried to replicate fairly closely the differences of the series in our initial conditions and forecasts, with those suggesting at least a 50 percent greater contribution of ICT to growth than to consumer surplus..

Cyber Risk Extended Report 49
4. Costs Although avoidance of or reaction to adverse cyber events is at the core of typologies for considering costs around them, there is no standard typology. In 2014 the Center for Strategic and International Studies (CSIS) released a study estimating the impact of cyber crime and cyber espionage across 31 countries. Their estimates took into account the direct and indirect costs arising from five primary sources: (1) the loss of intellectual property, which can undermine the victim’s revenue and disincentive investment in research and development, (2) stolen information or financial assets, (3) opportunity costs that may arise from changes in behavior or spending patterns, (4) the costs of securing vulnerable systems and networks, and (5) the cost of recovering from an attack, including not just the immediate damage, but also the reputational damage.29 A McAfee blog post30 in 2014 divided the damage from cyber maliciousness into six categories associated with account, innovation, operational, opportunity, IT, and reputational costs. Most studies assess the cost of a data breach for a company. Yet governments and individuals also face costs that we want to also consider. We group costs associated with adverse cyber events across targets into three categories: (1) investment in cybersecurity and risk mitigation, (2) the direct and indirect costs associated with an adverse cyber event, and (3) the opportunity costs of foregoing use of cyber services or infrastructure in the wake of an attack or the threat of attacks. Each of these dimensions poses very major and unique obstacles to measurement and estimation, which we will discuss later.
Spendingon risk mitigation From password management and anti-malware software, to national cyber defense spending, to cybersecurity insurance, investment in cyber risk mitigation is a cost borne by governments, firms, and individuals alike. For countries like the U.S. these costs may now represent about 0.3-0.4 percent of GDP annually. The complete elimination of malicious activity is almost certainly unachievable. As discussed below, Ponemon Institute LLC explored the possible costs for businesses of thwarting 95 percent of attacks and suggests that it would require an average spending of 9-12 times that of today, depending on the industry. This helps explain the currently rapid global growth of cybersecurity spending both in absolute terms and as a percent of GDP, but also suggests that it will be nearly impossible to reach such high levels of security.31
29 In 2013 CSIS identified 6 categories, dividing the second one in this list. IBM (2014) provided a similar list.
30 https://blogs.mcafee.com/business/economic-impact-cybercrime-cyber-espionage:
31 Eric Engleman and Chris Strohm, “Cybersecurity Disaster Seen in U.S. Survey Citing Spending Gaps,” Bloomburg.com, January 30th, 2012. Available at: http://www.bloomberg.com/news/articles/2012-01-31/cybersecurity-disaster-seen-in-u-s-survey-citing-spending-gaps [accessed 5/6/15]

Cyber Risk Extended Report 50
The cybersecurity industry IT research and advisory company, Gartner, Inc. forecast that “worldwide spending on information security will reach $71.1 billion in 2014, an increase of 7.9 percent over 2013, with the data loss prevention segment recording the fastest growth at 18.9 percent… Total information security spending will grow a further 8.2 percent in 2015 to reach $76.9 billion” (about 0.1 percent of global GDP) as companies become more aware of the cyber threats they face.32 Estimates and forecasts for the United States from the Telecommunications Industry Association (TIA) provide a useful comparison; TIA foresaw U.S. spending on cybersecurity reaching $46 billion in 2014 (0.28 percent of GDP) and growing to $63.5 billion (more than 0.35 percent of GDP) within 3 years (see Figure 4.1).33
Figure 4.1. Cybersecurity spending in the US, in percent of GDP and billions of US dollars, 2009—2017 Source: http://test.tiaonline.org/resources/market-forecast Preventative spending has exponentially increasing costs (or diminishing returns) with the pursuit of higher security levels. A 2012 survey of 172 technology managers in the US found that companies would need to see a nine-fold increase in cybersecurity spending in order to stave off 95% of attacks: 32 “Gartner Says Worldwide Information Security Spending Will Growth Almost 8 Percent in 2014 as Organizations Become More Threat-Aware,” Gartner.com, August 22, 2014. Available at: http://www.gartner.com/newsroom/id/2828722 [accessed on 5/6/15]
33 “TIA’s 2014—2017 Market Review & Forecast,” Tiaonline.org, 2014. Available at: http://test.tiaonline.org/resources/market-forecast [accessed on 5/6/15]
0
10
20
30
40
50
60
70
0
0.05
0.1
0.15
0.2
0.25
0.3
0.35
0.4
2009 2010 2011 2012 2013 2014 2015 2016 2017
Bil
lio
n U
S$
Pe
rce
nt
of
GD
P
Absolute
%GDP
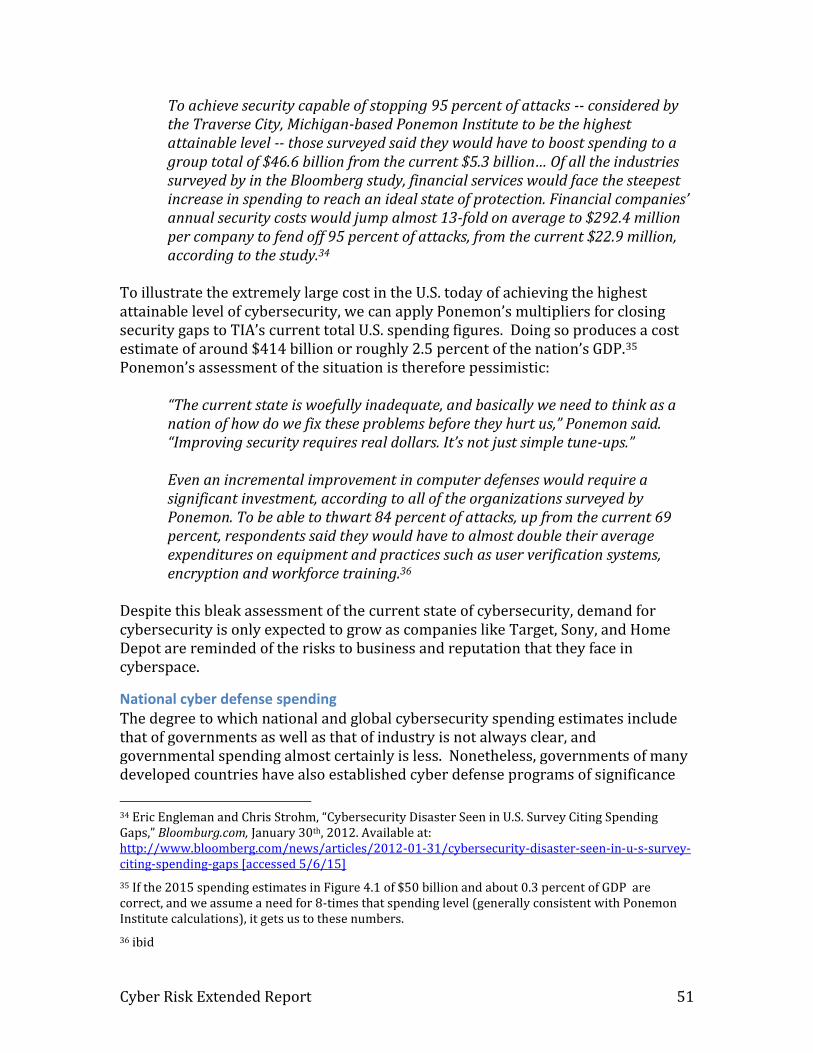
Cyber Risk Extended Report 51
To achieve security capable of stopping 95 percent of attacks -- considered by the Traverse City, Michigan-based Ponemon Institute to be the highest attainable level -- those surveyed said they would have to boost spending to a group total of $46.6 billion from the current $5.3 billion… Of all the industries surveyed by in the Bloomberg study, financial services would face the steepest increase in spending to reach an ideal state of protection. Financial companies’ annual security costs would jump almost 13-fold on average to $292.4 million per company to fend off 95 percent of attacks, from the current $22.9 million, according to the study.34
To illustrate the extremely large cost in the U.S. today of achieving the highest attainable level of cybersecurity, we can apply Ponemon’s multipliers for closing security gaps to TIA’s current total U.S. spending figures. Doing so produces a cost estimate of around $414 billion or roughly 2.5 percent of the nation’s GDP.35 Ponemon’s assessment of the situation is therefore pessimistic:
“The current state is woefully inadequate, and basically we need to think as a nation of how do we fix these problems before they hurt us,” Ponemon said. “Improving security requires real dollars. It’s not just simple tune-ups.” Even an incremental improvement in computer defenses would require a significant investment, according to all of the organizations surveyed by Ponemon. To be able to thwart 84 percent of attacks, up from the current 69 percent, respondents said they would have to almost double their average expenditures on equipment and practices such as user verification systems, encryption and workforce training.36
Despite this bleak assessment of the current state of cybersecurity, demand for cybersecurity is only expected to grow as companies like Target, Sony, and Home Depot are reminded of the risks to business and reputation that they face in cyberspace.
National cyber defense spending The degree to which national and global cybersecurity spending estimates include that of governments as well as that of industry is not always clear, and governmental spending almost certainly is less. Nonetheless, governments of many developed countries have also established cyber defense programs of significance
34 Eric Engleman and Chris Strohm, “Cybersecurity Disaster Seen in U.S. Survey Citing Spending Gaps,” Bloomburg.com, January 30th, 2012. Available at: http://www.bloomberg.com/news/articles/2012-01-31/cybersecurity-disaster-seen-in-u-s-survey-citing-spending-gaps [accessed 5/6/15]
35 If the 2015 spending estimates in Figure 4.1 of $50 billion and about 0.3 percent of GDP are correct, and we assume a need for 8-times that spending level (generally consistent with Ponemon Institute calculations), it gets us to these numbers.
36 ibid

Cyber Risk Extended Report 52
and agencies with substantial funding streams (RAND 2013). In the US, the Department of Homeland Security (DHS) “spent $459 million on its various cybersecurity programs in 2012. The Pentagon spent roughly eight times as much, not even including the defensive and offensive cyber spending share of NSA’s classified budget (roughly $10.5 billion37 according to the Snowden leaks)” (Singer and Friedman 2014: 200). These figures are in line with market forecasts by Input Inc. that expect federal spending on cybersecurity to grow from $8.6 billion in 2012 to $13.3 billion in 2015 (or approximately 0.08% of U.S. GDP) 38 Driven by an increased threat of network-centric warfare, Strategic Defense Intelligence (SDI) forecasts the global military IT, data, and computing market to reach $68.6 billion by 2022 (nearly 0.07 percent of GDP) representing an increase of around 0.006% of global GDP relative to 2014 (GDP forecasts for the U.S. and the world from IFs).39
Figure 4.2. Global military IT, data, and computing market in billions of US dollars, 2012—2022 Source: Strategic Defense Intelligence cited in “The Global Military IT, Data and Computing Market 2012—2022,” ASDReports.com November 8th 2012. Available at: https://www.asdreports.com/news-903/global-military-it-data-computing-market-20122022 [accessed on 5/6/15]
37 That figure is the total NSA budget; if cyber security were 10 percent of that total, the spending would be about $1 billion.
38 Gerry Smith, “Former Government Officials Stand to Profit from Cybersecurity Boom,” Huffingtonpost.com, September 14th 2011. Available at: http://www.huffingtonpost.com/2011/09/15/former-government-officials-cybersecurity-boom_n_958790.html [accessed 5/6/15]
39 “The Global Military IT, Data and Computing Market 2012—2022,” ASDReports.com November 8th 2012. Available at: https://www.asdreports.com/news-903/global-military-it-data-computing-market-20122022 [accessed on 5/6/15]

Cyber Risk Extended Report 53
Cyber insurance Beyond direct industrial and governmental cyber defense spending, a survey conducted by the Ponemon Institute found that 32 percent of organizations have also incorporated cyber insurance into their risk management strategy (Ponemon 2014). Global cybersecurity insurance premiums in 2014 are estimated at $2.43 billion, up from $1.3 billion in 2013, and nearly $1 billion in 2012 (CSIS 2014; Betterley 2014).40 The 2014 value would constitute another 0.03 percent of GDP. 41
General comments on cyber security spending Again, estimates on spending are very scarce and piecemeal and not very confidence-inspiring. Values for the United States are a bit more specific than for other countries and suggest that industrial spending may be about 0.3 percent of GDP with national security spending a bit less than 0.1 percent. Globally the numbers are almost certainly quite a bit less, with industrial spending at about 0.1 percent. Everywhere there are prescriptions for higher spending and there is evidence that rates are rising, also as a percentage of GDP. In forecasting, it will make sense to tie spending levels to the pervasiveness of ICT within and across societies, which suggests that forecast values as a portion of GDP will rise almost everywhere and that there will be some convergence of lower-income countries with higher-income ones.
Adverse Cyber Events: Micro Analysis Coupled with our ever-increasing reliance on ICT/cyber comes the potential for large-scale, highly disruptive cyber-attacks on critical infrastructure networks—attacks that could cause significant and long-lasting economic damage. The possibility of cyber-attacks causing countrywide internet outages crashes of entire cellular networks, or damage to national electrical grids has attracted much attention in recent years. It is also possible that adverse cyber events could result from natural disasters or from conscious decisions to shut down cyber systems in the face of threats to them. Outside of temporary internet disruptions to countries with already limited access (e.g., North Korea and Kyrgyzstan) and intentional government disruptions within countries in conflict (e.g., Egypt and Syria), no such large-scale and significantly
40 Stuart Poole-Robb, “Here’s why the cyber insurance industry is worth £55.6 billion,” ITProPortal.com, February 7th. Available at: http://www.itproportal.com/2015/02/07/heres-cyber-insurance-industry-worth-55-6-billion/ [accessed on 5/6/15]
41 "Cyber attack risk requires $1bn of insurance cover, companies, warned," Financial Times February 18,2015 Section 2: 1; http://www.ft.com/intl/cms/s/0/61880f7a-b3a7-11e4-a6c1-00144feab7de.html#axzz3SWUuKoFj

Cyber Risk Extended Report 54
damaging attacks or events have occurred. Moreover, there remains considerable debate as to whether such attacks could actually be carried out against a developed country like the United States (Singer and Friedman 2014; Lawson 2011). Yet given the increasing move toward smart ICT-enabled infrastructure, it is important to address this possibility even if we can only speculate as to the costs of a major event. This discussion, thus looks at the current literature regarding the potential impacts of major disruptive adverse cyber-events, including efforts to build quantitative models of those impacts, and offers some examples of past cyber and non-cyber-related infrastructure disruptions in order to give us at least an idea as to the potential cost. Along the way, we draw on the literature supporting this analysis to provide three vignettes of possible adverse cyber events and their effects.
The cyber system itself The greatest concern for most analysts is that of malicious events involving large-scale attacks initiated by private or governmental actors. Another possibility is, of course, that states themselves might choose to shut down key cyber systems and suffer the costs of doing so. Vignette 1 presents an actual case, namely the shut-down of the Egyptian internet by the Mubarak government in Egypt during the Arab spring rebellion of 2011. The vignette illustrates the opportunity costs associated with decisions to withdraw from the cyber sphere, whether political choices or fear of attacks might motivate the withdrawal.
Cyber Risk Extended Report 55
Vignette 1: What if Egypt withdrew from the Internet? (It did). The rapid spread of smartphones and social media applications around the world has helped empower many protest and prodemocracy movements, enabling them to easily get their messages out to their fellow citizens and to people and news media around the world. In response, countries with restive populations may actually unplug themselves from the internet and shutdown their cellphone networks in an effort to disrupt lines of communication. In early 2011 Egypt undertook such a voluntary withdrawal from the internet, resulting in significant opportunity costs for the county as businesses suddenly had to do without. Estimates by the Organization for Economic Cooperation and Development put the direct and immediate cost of Egypt’s five-day self-imposed exile at about 3 to 4 percent of its GDP with an unknown longer-term cost should, for example, foreign companies decide that it is too risky to setup shop in a country willing to switch off the internet.42
Beyond the internet Beyond the internet itself, many critical infrastructure networks are potentially vulnerable to cyber-attacks on their software control systems or other unexpected events that could disrupt network operation and even damage physical equipment. Electricity grids, energy distribution networks (e.g. oil and gas pipelines), water desalination and purification plants, and the ICT networks underpinning the communications, transportation and financial sectors are all potentially vulnerable and have been subject to penetration by hackers, usually to extract data and not to cause damage. Indeed, from 2011 to 2013, the number of cyber intrusions into the U.S.’s critical infrastructure networks increased by some 1700 percent (Singer and Freidman 2014: 97). A major cyber-event affecting any of these infrastructures would likely produce two kinds of costs: (1) immediate costs, including damage to hardware, loss of life, loss of revenue, and downtime (productivity) losses; and (2) long-term costs, including liability, the cost of adapting the affected infrastructure to better withstand future attacks, loss of customers or the erosion of public confidence in the reliability of the networks in question, the relocation of businesses to unaffected areas, and the costs of curtailing the use of ICT in critical infrastructure management and business operations (Krepinevich 2012; Dübendorfer et al. 2004). The literature also makes a distinction between direct and indirect costs, where direct costs are the economic
42See http://www.oecd.org/countries/egypt/theeconomicimpactofshuttingdowninternetandmobilephoneservicesinegypt.htm and http://www.networkcomputing.com/networking/egypt-takes-$90-million-hit-from-internet-blackout/d/d-id/1095862? For higher estimates see also Parmy Olson, “Egypt’s Internet Blackout Cost More than OECD Estimates,” Forbes.com February 3rd 2011, available at: http://www.forbes.com/sites/parmyolson/2011/02/03/how-much-did-five-days-of-no-internet-cost-egypt/

Cyber Risk Extended Report 56
consequences stemming from the disruption of a specific company or sector while indirect, or ripple costs, are those incurred by the disruption of supplies and services to consumers (Dynes et al. n.d.) According to Krepinevich (2012), while a short-term or one-off cyber-attack could inflict serious damage to a business or business sector, long-lasting or frequent, repeated attacks could potentially cause fundamental disruptions to an affected economy and society:
While people are generally prepared to deal with the occasional brief power outage that lasts a few minutes or so, and the rare extended outage (e.g. following a major storm) every few years, none are prepared for frequent outages lasting many hours or days… the costs of permanently shifting to this new way of life would be substantial and enduring. (Krepinevich 2012: 15—16)
The evidence from actual events The question is, how much damage could a sustained cyber-attack on a critical infrastructure network actually do? While a damaging, large-scale cyber-attack has yet to occur, there are some places we can look to get an idea of the potential cost. Over the last 8 years, a spate of distributed denial of service attacks (DDoS), likely carried out by Russian-backed hackers (or the Russian state itself) has shown how such attacks can disrupt ICT networks. In 2007, hackers hit Estonia’s government and financial networks with significant and long-lasting DDoS attacks that disrupted government e-mail and many banking services over the course of several weeks (Kozlowski 2014). The attacks, however, caused no actual damage to the country’s ICT networks and the financial losses were minimal (one Estonian bank reported a total loss of $1 million USD) (Kozlowski 2014: 238; Ashemore 2009). Suspected Russian-backed hackers carried out similar DDoS attacks against Georgia in 2008 and Kyrgyzstan in 2009. In the case of Kyrgyzstan, roughly 80 percent of internet traffic was shut down for a week (Kozolwski 2014: 241). We have not found any estimates of the economic cost of this shut down. In 2014, a potential cyber-attack (or a pre-emptive defensive decision) completely shut down North Korea’s internet and cellular network for 9 hours, again with no estimates as to the economic cost of the shutdown.43 The Stuxnet cyber worm, discovered in 2010, represented a step beyond the DDoS attacks—it was capable of physical damaging the infrastructure it infected, in this case, the centrifuges of Iran’s nuclear program. The worm reprogrammed the control systems of the centrifuge motors, causing them to spin in ways that damaged the physical mechanism. The damage likely set the Iranian program back by several months to a year as repairs were carried out (Farwell and Rohozinski
43 Jack Kim, “North Korea blames U.S. for Internet outage, calls Obama ‘monkey,’ Reuters.com, December 28th 2014. Available at: http://www.reuters.com/article/2014/12/28/us-northkorea-cybersecurity-idUSKBN0K502920141228 [accessed 6/19/15]

Cyber Risk Extended Report 57
2011). Being highly targeted, the Stuxnet worm did not cause any significant economic damage but it would seem to represent the potential blueprint for a worm that do so. Natural disasters and accidental infrastructure breakdowns and blackouts may, perhaps, provide us with a better idea of the potential cost of a large-scale cyber-event (whether an attack or a natural disaster affecting cyber systems) that does physical damage to a country’s infrastructure. In 1989, a large solar (geomagnetic) storm damaged Canadian and U.S. electricity infrastructure, resulting in a major power outage that lasted 9 hours and affected millions of people in Quebec and across the northeast U.S. with a total cost of about $6 billion.44 Then, on August 14th, 2003, a non-cyber-related 2-day blackout affected 50 million people across 8 US states and two Canadian Provinces. Estimates for the cost of the blackout run from $6.8 to $10.3 billion with no long-term damage done to regional or national economies (Greenburg et al. 2007: 723; Lawson 2011). For the impact of a truly epic attack, one targeting multiple infrastructure networks, one can look to the effects of super storm Sandy. According to a damage assessment for the State of New York, Sandy inflicted $7.3 billion in damage to transportation infrastructure, $1 billion to water, waste and sewer, and $1.5 billion to other utilities. The total direct damage of nearly $10 billion would have been about 0.7 percent of the gross state product of nearly $1.4 trillion.45 The long-term and more indirect effect of the storm was to reduce output in New Jersey by $1.2 billion in 2013 (more than 0.2 percent of gross state product).
Model-based analyses Given the lack of real world instances, several research groups have built quantitative models designed to estimate the macro-economic costs of various infrastructure outages, mostly electricity disruption, but also IT failures. Vignette 2 describes such a hypothetical scenario created by the Swiss Federal Institute of Technology Zurich, which used an economic damage model to calculate the cost of a weeklong countrywide internet blackout and found that such a shutdown could cost Switzerland as much as 1.2 percent of GDP.46
44 http://www.solarsystemcentral.com/solar_storm_page.html
45 http://www.governor.ny.gov/news/governor-cuomo-holds-meeting-new-yorks-congressional-delegation-mayor-bloomberg-and-regional
46 http://www.mi2g.com/cgi/mi2g/frameset.php?pageid=http%3A//www.mi2g.com/cgi/mi2g/press/220705.php

Cyber Risk Extended Report 58
Vignette 2: What if Switzerland Experienced a Country-wide Internet Blackout? A massive and sustained Distributed Denial of Service attack (DDOS) by parties unknown disrupts internet service across the whole of Switzerland in 2005. The attack lasts a full week before it is finally defeated and service restored. In just the first day of the attack, the total internet blackout costs the country 310 million CHF in downtime (productivity and revenue loss) and disaster recovery. By the seventh day, the cost of the attack has ballooned to 5.8 billion CHF or 1.2 percent of Switzerland’s GDP in 2005 (Dübendorfer et al. 2004: 28). This suggests that costs, at least for those countries with significant reliance on ICT (48 percent of all jobs in Switzerland were classified as being ICT intensive), could increase exponentially with attack duration.47
Dynes et al. (n.d.) built a model looking at the cost of an internet outage lasting 3—10 days affecting three economic sectors in the US: automobile manufacturing, electrical device manufacturing, and oil refining. Not surprisingly, they found that the longer the outage, the greater the cost. For the automobile sector, a 3-day outage resulted in no measurable loss while a 10-day outage resulted in the loss of $22.6 million in direct and indirect costs. For the electrical device sector, a 3-day disruption cost $2.9 million, 10-days cost $65.2 million, and for the refining sector, the costs were $96.8 and $405 million respectively—the much higher costs are due to full shutdowns required due to the loss of safety monitoring systems (Dynes et al. n.d.: 18). Given a GDP of over $17 trillion in 2015, that loss would, however, not be very significant. Zimmerman et al. (2007) built a model to explore the potential economic cost of a terrorist attack on a major electrical system in the US. For the electrical system, the cost depends in large part on the size of the network/affected population, the time of year (attacks are more costly during peak-use seasons), and the duration of the shutdown. Based on their model and past blackouts, Zimmerman et al (2007: 286) estimated that a 19.6-hour blackout in a heavily populated urban area that resulted in 150 deaths could result in damages amounting to $1.2 billion (70 percent due to premature death, 20% business losses, and 10% due to public service disruption). Rose et al. (2005: 34) used a similar model to estimate the economic impacts of a terrorist attack on the Los Angeles electrical system, estimating a loss of $20.5 billion in 2 weeks (that would exceed 2.5 percent of the gross city product of about $800 billion). Greenburg et al. (2007) modeled the potential long-term economic impact of a terrorist attack on New Jersey’s power grid in terms of employment, personal
47 mi2g, “More than 1% GDP drop estimated per week of Internet blackout,” www.mi2g.com, July 22nd 2005. Available at: http://www.mi2g.com/cgi/mi2g/frameset.php?pageid=http%3A//www.mi2g.com/cgi/mi2g/press/220705.php

Cyber Risk Extended Report 59
income, and gross state product up to 5 years after the event (2005—2010). In their worst-case scenario, the attack knocks out 95 percent of the electricity network during the first day and it takes up to two months to fully restore all power (with 90% restored by the end of the first month) (726). The result: in 2005 the state sees non-agricultural employment decline by 3.3%, personal income by 1.3%, and gross state product (GSP) by 3.4%. How the state recovers depends on whether the jobs return (Greenburg et al. 2007: 729). They find that, in a simulated natural disaster (a one off event that doesn’t prompt businesses to relocate), the state not only rebounds by 2010 but even sees a 1.4% gain in GSP over the base case as rebuilding efforts help spur growth. The question the authors raise is whether this same rebound might occur after a terrorist attack. They find that the recovery depends on whether businesses (and private individuals) come to see the affected region as riskier than before and so chooser to relocate, which could have longer-term economic consequences. The authors point to the example of 9/11 where New York lost about $3 billion in output in 2 years as businesses moved to New Jersey after the attack (730). In the case where only half of lost employment returns by 2010, New Jersey’s GSP remains 1.8% lower in 2010 than in the base case.
Very large-scale events Although very significant, the focus of such studies on relatively short-term events and/or on a city or state within a country limits the potential economic impact to a fairly small percentage of national GDP. What would be the impact of a much larger and longer-term adverse event? Vignette 3 considers that question.
Vignette 3: What if the United States Suffered a Cyber-Pearl Harbor? The Stuxnet Worm was perhaps the first cyber-attack on a country that caused physical damage to infrastructure—and while it was highly targeted to Iran’s nuclear facilities, a next-generation worm might be able to cripple critical infrastructure networks across an entire country. Imagine: sometime in the near future, a cyber worm spreads through the U.S.’s critical infrastructure networks, targeting the software control systems of electrical stations, transportation and communication hubs, water treatment stations, etc. It results in massive power and internet outages, crashes cellphone networks, disrupts water supply, shuts down of the country’s air traffic, and more. What might be the economic cost of such a severe disruption? While we have no historical examples to draw from, Lloyd’s of London has developed a hypothetical scenario of a large-scale cyber-attack on the U.S.’s infrastructure in order to gauge the economic costs of such an attack. In their scenario, a piece of malware spreads through much of the Northeastern United States electrical grid, infecting a number of generators and causing them to overload. The physical damage inflicted by the malware results in power outages affecting 93 million people across 15 states that last anywhere from 24 hours to several weeks (Lloyd’s 2015: 4).
Cyber Risk Extended Report 60
The resulting damage to infrastructure, lost business revenues, supply chain disruptions, transport and water network disruptions, etc., costs the U.S. economy $243 billion under the S1 scenario (outages last 2 weeks, 50 generators damaged) and as much as $1 trillion in the extreme X1 scenario (outages last 4 weeks and 100 generators damaged) (Lloyd’s 2015: 4, 15). The Lloyd’s report provides some important takeaways: (1) the economic costs associated with a cyber-induced infrastructure outage is “non-linear with respect to the size and duration of the outage” (23); (2) even with a severe initial shock, the impact to GDP tends to disappear within 3 to 4 years of the attack; (3) imports and exports are particularly impacted due to transport disruptions—the scenarios assume a 100% shock to exports compared to a 50% drop in labor productivity and consumption for the duration of the outage.
Adverse Cyber Events: Macro Analysis For forecasting purposes it is necessary that we focus not on individual events, but on the country-year pattern of events. For our base case analysis the question is: What do adverse events now cost countries each year? For our scenario analysis the question becomes: How can we represent alternative futures in which those country-year costs are significantly different from those of today? As we shall see below, even without any international cyber conflict, actual adverse cyber events probably are costing the United States nearly 0.65 percent of GDP annually, perhaps about twice what is being spent on cyber security. Thus the risk associated with adverse cyber events is likely the most important cost associated with cyber insecurity that we address in this project. Moreover, beyond the immediate costs to revenue and reputation borne by companies, adverse event risk drives behavior including cybersecurity spending and the potential underutilization of technology. Adverse cyber events can be conceptualized within a traditional agent-based risk assessment framework, wherein governments, organizations, and individuals are the targets of a variety of malicious activities, each of which carries with it a particular likelihood and cost. At the aggregate country-level, where avoiding all such events is next to impossible, the subject of overall costs is central to understanding the dynamics of cyber risk. We will proceed through the steps of such a risk assessment, beginning with definition of the actors and targets and proceeding to discussion of event probabilities and costs.
Defining motivations, actions, actors and targets There exist multiple typologies for defining actors, targets, and actions in the cyber threat landscape. This lack of standardization stems from the difficulties that exist in attributing attacks to particular actors and in determining the motive behind

Cyber Risk Extended Report 61
them—motivations/actions and actors/targets are the two key dimensions around which typologies are built.48 The global policy think tank, RAND, uses a threat-actor typology that distinguishes three types (see Table 4.1): (1) individuals, including grey hat or black hat hackers; (2) coordinated sub– or pan-national groups or networks, such as criminal, terrorist, or hacktivist groups, as well as commercial organizations; and (3) states.49
Table 4.1. Cyber threat actors Source: RAND (2013: 6) This typology can be useful not only for conceptualizing the sources of cyber threat, or the actors perpetrating the attacks, but also for conceptualizing the targets of malicious cyber activity. A Detica report exploring the cost cybercrime in the UK adopts this same general target distinction in their classification of those affected by adverse cyber incidents as either citizens, businesses, or governments (2011). For this project, we have adopted the taxonomy used by former Special Advisor on cybersecurity to the White House, Richard Clarke, which classifies types of malicious cyber activities by motivations and associated actors (see Figure 4.3): (1) hactivists, individuals or groups whose motivation for carrying out cyber-attacks is ideological; (2) cyber criminals, again individuals or groups that launch attacks aimed at financial gain; (3) cyber espionage that has the primary motive of acquiring intellectual property from firms or governments; and (4) cyber war which carries with it more destructive attacks launched from politically or militarily motivated state or non-state actors.
48 For readings on other existing topologies see Lachow (2009), Cavelty (2012), and Rid (2013).

Cyber Risk Extended Report 62
Criminal Hacktivist Espionage War
Definition Organized groups of criminals who hide in “cyber sanctuary” countries to launch attacks against individuals and companies for financial gain.
Loosely organized collections of hackers that launch targeted campaigns against specific entities or websites with the intention of causing embarrassment or financial harm.
Cyber espionage operations are typically well-funded and well-organized when carried out by nation-states. They target national secrets and intellectual property. This stolen intellectual property is used to enhance their domestic economies.
While similar to espionage, this category deals with actions that are intended to cause damage to the target, instead of acquiring information. These actions may be carried out by nation-states or terrorist organizations.
Motivation - Money - Information to sell (e.g. credit card numbers)
- Protest - Revenge - Power
- Acquiring sensitive information - National Security Economic gains
- Destroy, degrade, deny - Political considerations
Capability - Large number of actors - Basic to advanced skills - Present in most Countries
- Large number of actors - Limited skills
- Small but growing number of countries with capability - Significant support infrastructure
- Limited number of actors - Potential non-state actor - Expensive to maintain
Figure 4.2: Cyber threat actors Source: http://www.sifma.org/issues/operations-and-technology/cybersecurity/guidance-for-small-firms/ Table 4.3 brings the actors and targets together in one matrix whose elements indicate the possible threat-types or actions that link the two.
Table 4.3. Threat, actor, and target matrix Source: Authors. In order to make this actor-target-motivation framework useful for forecasting, however, it is essential that we associate economic costs with it. As indicated earlier, we conceptualize an activity probability-cost schema for that. Our cyber risk matrix in Table 4.4 combines focus on the threats, their probability of affecting a target, and the damage the threats could potentially cause. The risk of an adverse cyber event is equal to the annual probability of that event occurring times its cost as a percentage of GDP.

Cyber Risk Extended Report 63
Table 4.4. Unpopulated cyber risk matrix Source: Authors.
Populating this matrix with the appropriate probabilities and costs will be the subject of the coming sub-sections. We should make clear, however, that the values with which we populate it will, again, be rough estimates. The probabilities and costs in this matrix structure will be principal focal points of scenario analysis.
Estimating probability of adverse cyber events In the realm of illicit cyber activity, the rewards are high and the costs are very often low. Potential targets, on the other hand, face multiple obstacles and sources of friction toward securing their networks. The Center for Strategic and International Studies explains this imbalance in the following way:
Hackers see low risk from cybercrime, with the added benefit that as manufacturing and research capabilities improve around the world, the return on stealing IP will increase, giving people more reason to hack—better indigenous manufacturing capabilities mean a greater return from hacking. Defenders lack the incentive to do more because they underestimate risk; the incentive for cybercriminals is to do more, as the rate of return is increasing. Absent a change in the incentives equation, the loss from cybercrime will increase. (2014a:10)
Furthermore, technological advancement continues to favor the attacker—a relationship that is not likely to disappear anytime soon (Mandient 2013). These trends seem to indicate a high probability that cybercrime and cyber espionage are here to stay.

Cyber Risk Extended Report 64
IBM and Ponemon provided estimates derived from surveys regarding the likelihood that a company will experience a data breach in a given period of time. IBM (2014: 5) reported an estimated likelihood of 69% that a company will experience one or more minor disruptions over a 24-month period, and a 23% likelihood of a substantial disruption. Similarly, Ponemon (2014: 18) estimated that over a 24 month period there is a 22 percent likelihood that a company will experience a data breach involving at least 10,000 stolen records and a 1 percent chance of a breach with 100,000 or more records. Ponemon (2014) suggested significant variation between countries in the likelihood of data breaches. For example, India and Brazil have the highest estimated probability of occurrence, and Australia and Germany have the lowest. In terms of absolute numbers of cyber espionage attacks, Verizon (2014: 39) estimated that the US is targeted in over half of the attacks worldwide. Furthermore, it indicated that cyber espionage has been increasing in relative prevalence since 2009 (Verizon 2014: 9). These studies collectively show that, while countries are not subject to the same levels of aggression, no country is immune to cyber-attacks. Put otherwise, the probability of a country experiencing a malicious cyber event in a given year, particularly those categorized as criminal or espionage, is not statistically different from one. The contested presence of cyber warfare is one exception to this observation, particularly in the exploration of alternative futures where a country, such as the US, could experience a non-zero probability of falling victim with significant destruction to a cyber-attack launched by an enemy.
The debate around cyberwar occurrence/probability Hactivism, cybercrime, and cyber espionage are reoccurring concepts found throughout the literature. The existence of cyber war as a unique category of cyber-attacks, however, is contested. Gartzke (2013: 73) claims that since “in most cases cyberwar cannot achieve the objectives that have historically prompted nations to commit to tangible military violence, “cyberwar” is only warfare in the context of terrestrial forms of interstate threats or force.” Rid’s thesis is that cyber war is a “wasted metaphor,” in that it has “never happened in the past, it does not occur in the present, and it is highly unlikely that it will disturb our future” (2013: 15-16). He claims that “not a single human being has ever been killed or hurt as a result of a code-triggered cyber-attack;” Moreover, he argues that no violent cyber operation has ever been attributed to a state and that for cyber war to exist, “a violent act and its larger political intention must also be attributed to one side at some point during the confrontation. History does not know of acts of war without eventual attribution” (2013: 37, 21). Another consideration for the inclusion of cyber war as a category of risk is that it may be increasingly impossible to disentangle from conventional war or other non-cyber forms of conflict. Take for example the hypothetical scenario in which a state

Cyber Risk Extended Report 65
successfully launches a cyber-attack that causes the death or injury of US citizens. The US government has voiced the position that any such activities that “proximately result in the death, injury, or significant destruction would likely be viewed as a use of force,” and would be met with kinetic retaliation.50 From this binary perspective, a war waged entirely in the “fifth domain”51 seems improbable. Nevertheless, the inclusion of “significant destruction” introduces a level of fuzziness regarding the distinction between cyber acts of war and cyber sabotage. Singer and Friedman explain that the idea of cyber war might be more similar to the types of non-violent conflict between the US and the USSR during the Cold War:
Cyberwar’s lines can be just as fuzzy. “We in the US tend to think of war and peace as an on-off toggle switch—either at full-scale war or enjoying peace,” says Joel Brenner, former head of counterintelligence under the US Director of National Intelligence. “The reality is different. We are now in a constant state of conflict among nations that rarely gets to open warfare.... What we have to get used to is that even countries like China, with which we are certainly not at war, are in intensive cyberconflict with us.” (2014: 121)
Singer and Friedman reclaim the term cyber war, and recast it as a more multidimensional concept. Walt echoes this in his call for a more nuanced definition of cyber war, which among other dimensions includes the degradation of an enemy’s military capabilities as well as criminal or terrorist attacks on critical infrastructure.52
General comments on probabilities of adverse events As explained above, the probability of a particular attack for most country-years is likely to remain fairly static for all events other than cyberwar. Moreover, events are basically certain (a probability equal to 1) for all cells of Table 4.3 except those in the cyberwar/cyber conflict row where they will be very nearly 0 for most country-years. The other cell for which they will be very near 0 is that of criminal attacks on government. Again, however, we need to structure our forecasting so that users of the system can make alternative assumptions for any country-year.
50 Remarks by Harold Hongju Koh, Legal Advisor to US Department of State, “International Law in Cyberspace,” US Department of State, September 18th 2012. Available at http://www.state.gov/s/l/releases/remarks/197924.htm [accessed on 5/6/15]
51 The Economist describes cyberspace as the “fifth domain” of warfare, after land, sea, air, and space “War in the fifth domain,” Economist.com, July 1st 2010. Available at: http://www.economist.com/node/16478792 [accessed on 5/6/15]
52 Stephen M. Walt. “Is the cyber threat overblown?” Foreign Policy, March 30th 2010. http://foreignpolicy.com/2010/03/30/is-the-cyber-threat-overblown/ [accessed on 5/6/15]

Cyber Risk Extended Report 66
This discussion of largely fixed and mostly binary probabilities suggests strongly that the central variable in exploring the risk associated with an adverse cyber events becomes the total country-year costs of each event cell in Table 4.3.
Measuring costs of adverse events When a government or organization falls victim to a cyber-attack it faces a variety of direct and indirect costs. IT security firm McAfee classifies the damage resulting from malicious cyber events into six parts, including “the loss of intellectual property, the theft of financial assets and sensitive business information, opportunity costs, additional costs for securing networks, and the cost of recovering from cyberattacks, including reputational damage to the hacked company” (CSIS 2014). A previous sub-section treated the costs of securing networks and the next one will address opportunity costs. Here we focus on the other four categories (see Box 4.1 for further elaboration of them).
Box 4.1. Damages from malicious cyber activity From Net Losses: Estimating the Global Cost of Cybercrime, Report Summary (CSIS 2014b: 2-3) IP theft and innovation cannibalism Intellectual property (IP) losses are the most difficult to estimate for the cost of cybercrime, but it is also is the most important variable for determining loss. IP theft shifts trade balances and national employment. Countries where IP creation and IP-intensive industries are important for wealth creation lose more in trade, jobs, and income from cybercrime. The effect of cyberespionage on national security is significant, and the monetary value of the military technology taken does not reflect the full cost to victim countries. Cybercrime damages innovation. One way to think about the cost from cybercrime is to ask how investors would act if returns on innovation doubled. Companies would invest more and the global rate of innovation would increase. By eroding the returns on intellectual property (IP), cybercrime invisibly creates a disincentive to innovation…
Risk-free financial crime When millions of people have their credit card information stolen by hackers, it gets immediate attention. Financial crime usually involves fraud, but this can take many forms to exploit consumers, banks, and government agencies. The most damaging financial crimes penetrate bank networks, with cybercriminals gaining access to accounts and siphoning out money. High profile cyberheists that steal tens of millions of dollars from banks are a global phenomenon…
Confidential business information and market manipulation Stealing business confidential information—investment information, exploration data, and sensitive commercial negotiation data—can yield immediate gain. The damage to individual companies runs into the millions of dollars… Hacking of central banks or finance ministries could provide valuable economic information on the direction of markets or interest rates…
Recovery costs Cleaning up cybercrime is expensive. The cost to individual companies of recovery from cyberfraud or data breaches is increasing. While criminals will not be able to monetize all the information they steal, the victim has to spend as if they could use all the stolen data. The aggregate cost for recovery is greater than the gain to cybercriminals… The bill for recovery costs is where the real damage to society begins, and the effect on a business can include damage to brand and other reputational losses and harm to customer relations and retention.

Cyber Risk Extended Report 67
Estimates of annual country-wide costs due to adverse cyber events are difficult to come by, and the range of existing estimates is so wide that any cited figure must be taken with great caution. As an example, Table 4.5 lists some of the U.S. estimates encountered during research for this project. For cyber espionage alone, values range from $2 billion to $500 billion. The CSIS estimate, to which we will give more attention, suggests that the U.S. cost of cyber espionage and cybercrime combined is around $113 billion.
Table 4.5. A comparison of estimates for the cost of adverse cyber events for the US Sources (in order from top down): BLACKOPS Partners, “The Firm,” available at: http://blackopspartners.com/firm/ [accessed on 5/6/15]; “Cybersecurity and American power: addressing new threats to America’s economy and military,” American Enterprise Institute, July 9th, 2012, available at: http://www.aei.org/events/cybersecurity-and-american-power/ [accessed on 5/6/15]; US Government Office of the National Counterintelligence Executive (ONCIX). 2011. Foreign Spies Stealing US Economic Secrets in Cyberspace: Report to Congress on Foreign Economic Collection and Industrial Espionage, 2009—2011. Full report. US GOV, Washington DC.; Frank C. Figliuzzi, Assistant Director, Counterintelligence Division, FBI, “Statement Before the House Committee on Homeland Security, Subcommittee on Counter Terrorism and Intelligence,” FBI.gov, June 28th, 2012. Available at http://www.fbi.gov/news/testimony/economic-espionage-a-foreign-intelligence-threat-to-americans-jobs-and-homeland-security [accessed on 5/6/15];
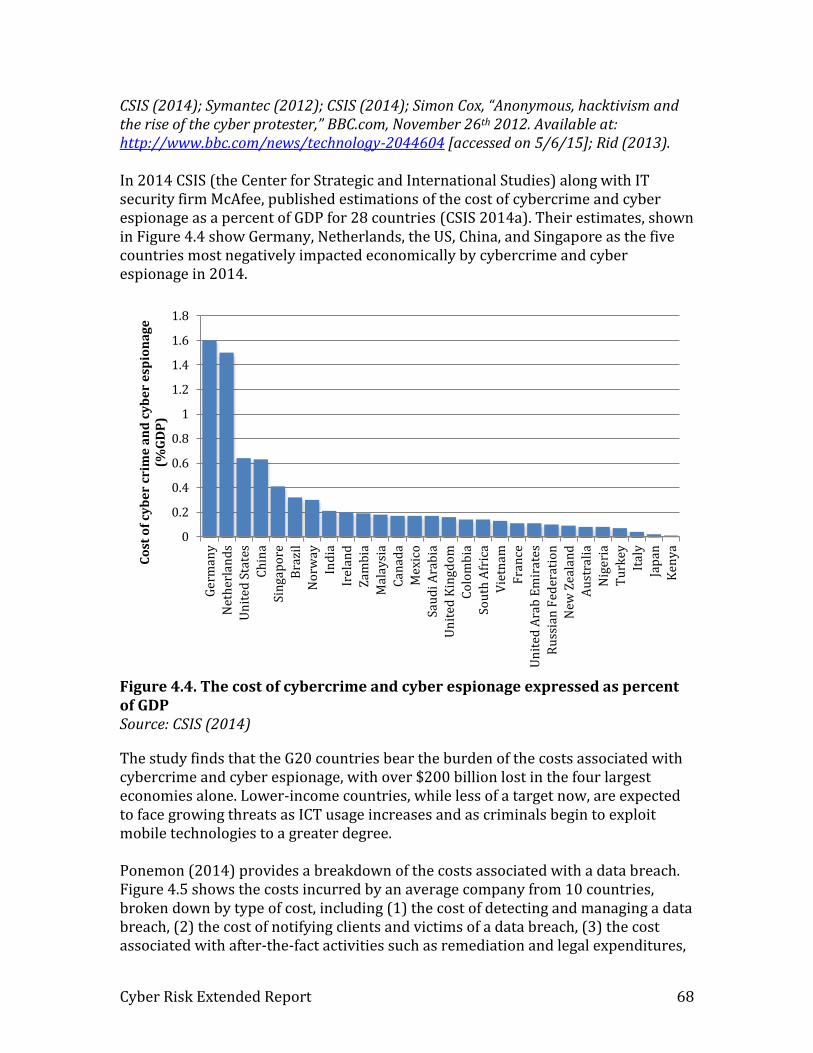
Cyber Risk Extended Report 68
CSIS (2014); Symantec (2012); CSIS (2014); Simon Cox, “Anonymous, hacktivism and the rise of the cyber protester,” BBC.com, November 26th 2012. Available at: http://www.bbc.com/news/technology-2044604 [accessed on 5/6/15]; Rid (2013). In 2014 CSIS (the Center for Strategic and International Studies) along with IT security firm McAfee, published estimations of the cost of cybercrime and cyber espionage as a percent of GDP for 28 countries (CSIS 2014a). Their estimates, shown in Figure 4.4 show Germany, Netherlands, the US, China, and Singapore as the five countries most negatively impacted economically by cybercrime and cyber espionage in 2014.
Figure 4.4. The cost of cybercrime and cyber espionage expressed as percent of GDP Source: CSIS (2014)
The study finds that the G20 countries bear the burden of the costs associated with cybercrime and cyber espionage, with over $200 billion lost in the four largest economies alone. Lower-income countries, while less of a target now, are expected to face growing threats as ICT usage increases and as criminals begin to exploit mobile technologies to a greater degree. Ponemon (2014) provides a breakdown of the costs associated with a data breach. Figure 4.5 shows the costs incurred by an average company from 10 countries, broken down by type of cost, including (1) the cost of detecting and managing a data breach, (2) the cost of notifying clients and victims of a data breach, (3) the cost associated with after-the-fact activities such as remediation and legal expenditures,
0
0.2
0.4
0.6
0.8
1
1.2
1.4
1.6
1.8
Ger
man
y
Net
her
lan
ds
Un
ited
Sta
tes
Ch
ina
Sin
gap
ore
Bra
zil
No
rway
Ind
ia
Irel
and
Zam
bia
Mal
aysi
a
Can
ada
Mex
ico
Sau
di
Ara
bia
Un
ited
Kin
gdo
m
Co
lom
bia
Sou
th A
fric
a
Vie
tnam
Fra
nce
Un
ited
Ara
b E
mir
ates
Ru
ssia
n F
eder
atio
n
New
Zea
lan
d
Au
stra
lia
Nig
eria
Tu
rkey
Ital
y
Jap
an
Ken
ya
Co
st o
f cy
be
r cr
ime
an
d c
yb
er
esp
ion
ag
e
(%G
DP
)
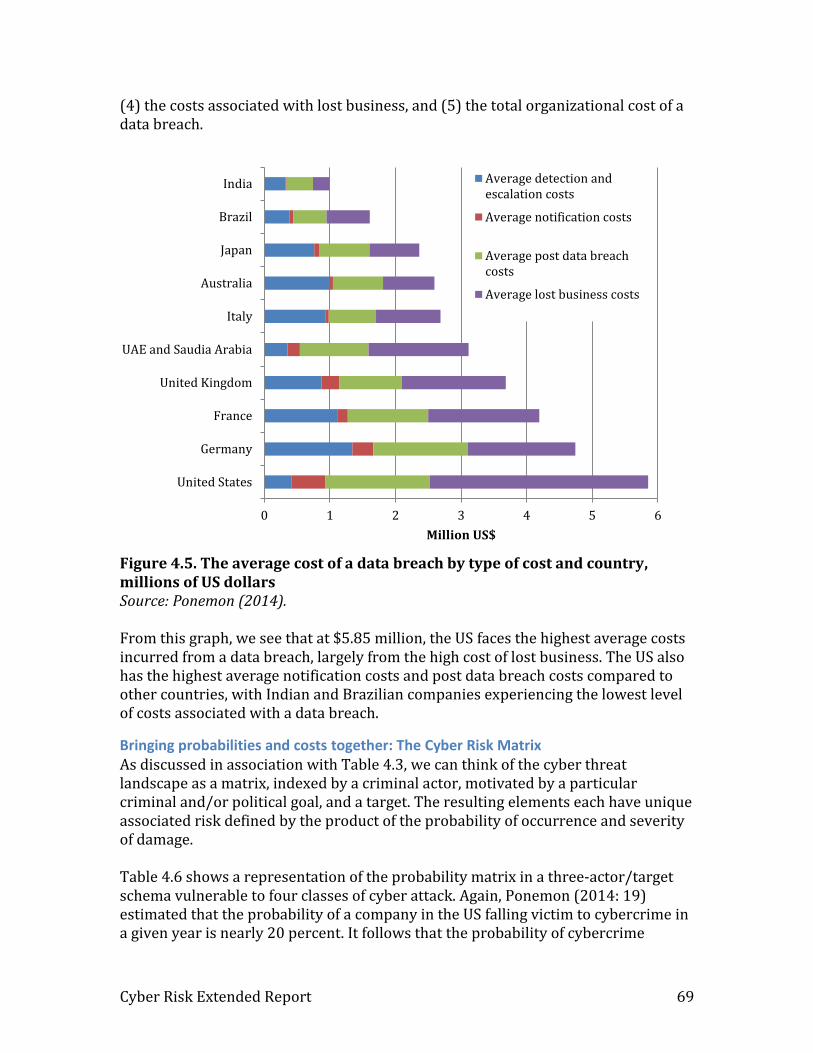
Cyber Risk Extended Report 69
(4) the costs associated with lost business, and (5) the total organizational cost of a data breach.
Figure 4.5. The average cost of a data breach by type of cost and country, millions of US dollars Source: Ponemon (2014). From this graph, we see that at $5.85 million, the US faces the highest average costs incurred from a data breach, largely from the high cost of lost business. The US also has the highest average notification costs and post data breach costs compared to other countries, with Indian and Brazilian companies experiencing the lowest level of costs associated with a data breach.
Bringing probabilities and costs together: The Cyber Risk Matrix As discussed in association with Table 4.3, we can think of the cyber threat landscape as a matrix, indexed by a criminal actor, motivated by a particular criminal and/or political goal, and a target. The resulting elements each have unique associated risk defined by the product of the probability of occurrence and severity of damage. Table 4.6 shows a representation of the probability matrix in a three-actor/target schema vulnerable to four classes of cyber attack. Again, Ponemon (2014: 19) estimated that the probability of a company in the US falling victim to cybercrime in a given year is nearly 20 percent. It follows that the probability of cybercrime
0 1 2 3 4 5 6
United States
Germany
France
United Kingdom
UAE and Saudia Arabia
Italy
Australia
Japan
Brazil
India
Million US$
Average detection andescalation costs
Average notification costs
Average post data breachcosts
Average lost business costs

Cyber Risk Extended Report 70
occurring on US soil is essentially 100 percent (or 1 when considering probabilities on a scale of 0 to 1). A similar argument can be made for most adverse cyber events. A notable exception is cyber acts of war (or terrorism), which, according to Rid (2013), has yet to occur. Additionally, a zero probability for cybercrime against government assumes no cyber theft of federal reserves or other financial assets.
Table 4.6. Adverse cyber event probability matrix Source: Authors. We have similarly populated the cyber cost matrix (Table 4.7) with estimates for each threat-actor-target vector. These values are (to the best of our ability) calibrated to estimates found in the literature. But when estimates could not be found, or when there were conflicting values, estimation was still necessary. For example, with no estimates for the cost of the U.S. involvement in a cyber war, we have assumed a round 1.0 percent of GDP (roughly twice the 2014 cost of the wars in Iraq and Afghanistan). A primary calibration point comes from CSIS (2014), which indicates the overall cost of cybercrime and cyber espionage in the U.S .to be 0.64% of GDP. In the forecasting model, see Section 5, any user will be able to change these estimates.

Cyber Risk Extended Report 71
Table 4.7. Adverse cyber event cost matrix Note: units are percent of GDP Source: Various sources, especially CSIS (2014). The product of these two tables gives us the overall cost of advese cyber events as a percent of GDP (Table 4.8). Our first rough-cut estimates in this table indicate that organizations (primarily firms) have the lion’s share of risk associtated with a mallicious cyber attack, followed by individuals, and then the government. Were, of course, there any intergovernmental cyber conflict, that ordering could quickly change. The Risk panel in Table 4.7 is a multiplication of the probability and cost cells, and because all values are in percent of GDP we can compute row and column totals as well as a table total. The table total suggests that, for a country like the United States, annual costs from adverse cyber events probably cost about 0.63 percent of GDP.
Table 4.8. The product of the probability and cost matrices Note: Units are percent of GDP Sources: various.

Cyber Risk Extended Report 72
Table 4.9 converts these values into millions of US dollars in order to facilitate comparison with estimates from the literature.
Table 4.9. Adverse cyber event risk matrix Note: units are millions of US dollars Sources: Percentages of GDP from Table 4.6 multiplied by IFs GDP numbers.
Opportunity Costs Opportunity cost is borne by countries, organizations, and households alike in the form of risk-adverse behavior that limits the benefits they may have received otherwise. We can think of opportunity costs as originating from one of two sources: (1) a conscious decision not to engage, or to disengage, in the use of cyber services and infrastructure, and (2) the opportunity cost associated with underdeveloped ICT infrastructure and the value added it could contribute. There exists some speculation as to whether the Internet blackouts experienced by North Korea after the 2014 Sony attacks were actually caused by the government preemptively taking the country offline in anticipation of a cyber-retaliation from the U.S., as opposed to retaliatory action by the U.S.53 If such defensive action were the case, the country would have experienced an opportunity cost, foregoing the benefits and income that would have been derived from the use of these services, in turn for reduced risk of a cyber-attack.
53 Shane Harris, “Cyberwar on North Korea Could Be Illegal,” TheDailyBeast.com, December 23rd 2014. Available at: http://www.thedailybeast.com/articles/2014/12/22/would-a-cyberattack-on-north-korea-be-illegal.html [accessed on 5/12/15]
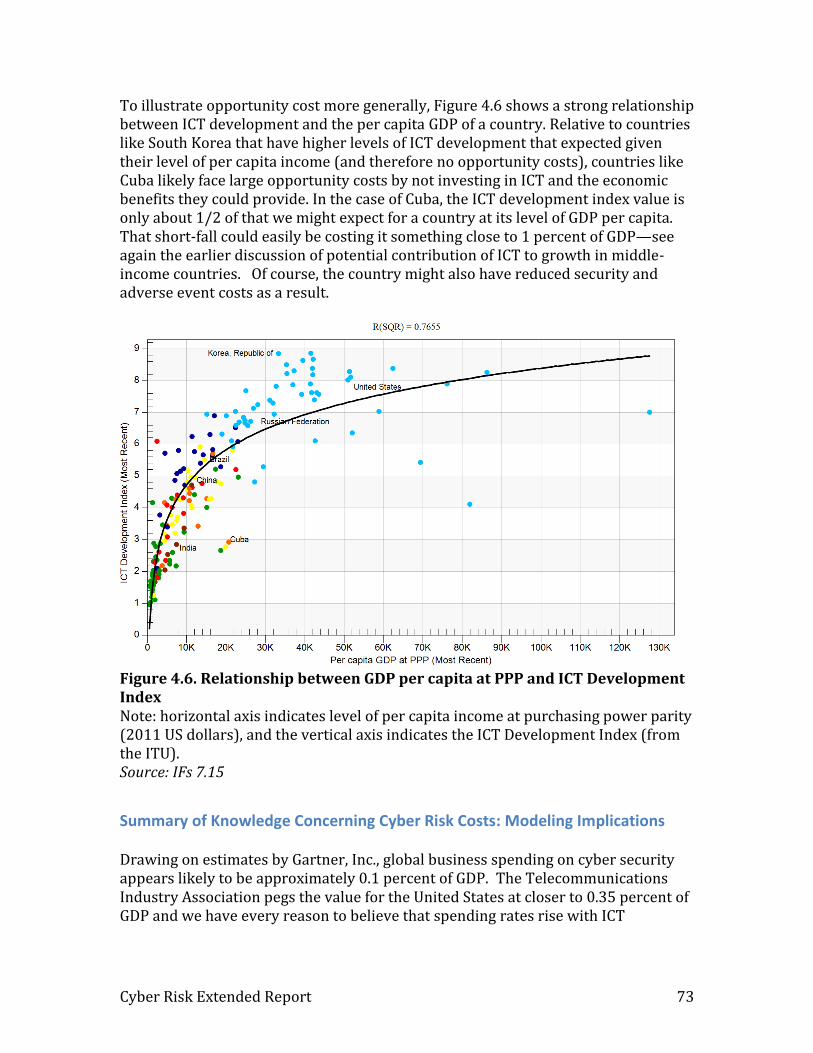
Cyber Risk Extended Report 73
To illustrate opportunity cost more generally, Figure 4.6 shows a strong relationship between ICT development and the per capita GDP of a country. Relative to countries like South Korea that have higher levels of ICT development that expected given their level of per capita income (and therefore no opportunity costs), countries like Cuba likely face large opportunity costs by not investing in ICT and the economic benefits they could provide. In the case of Cuba, the ICT development index value is only about 1/2 of that we might expect for a country at its level of GDP per capita. That short-fall could easily be costing it something close to 1 percent of GDP—see again the earlier discussion of potential contribution of ICT to growth in middle-income countries. Of course, the country might also have reduced security and adverse event costs as a result.
Figure 4.6. Relationship between GDP per capita at PPP and ICT Development Index Note: horizontal axis indicates level of per capita income at purchasing power parity (2011 US dollars), and the vertical axis indicates the ICT Development Index (from the ITU). Source: IFs 7.15
Summary of Knowledge Concerning Cyber Risk Costs: Modeling Implications Drawing on estimates by Gartner, Inc., global business spending on cyber security appears likely to be approximately 0.1 percent of GDP. The Telecommunications Industry Association pegs the value for the United States at closer to 0.35 percent of GDP and we have every reason to believe that spending rates rise with ICT

Cyber Risk Extended Report 74
pervasiveness levels. Moreover, Strategic Defense Intelligence puts U.S. government security spending at another 0.06-0.07 percent of GDP. Ponenon Institute analysis suggests that, even with such industry spending in the U.S., it is only possible to ward off 69 percent of attacks. Their analysis suggests that to ward off 95 percent of adverse events, commercial spending might need to rise to about 2.5 percent of GDP, almost the same as the rate of total global military spending (although the United States spends more than 4 percent of GDP on military defense). In spite of such spending, adverse cyber events probably cost the United States another 0.65 percent of GDP and cost China a somewhat similar proportion. Almost all of this is for crime and espionage events. Although the percentage costs that CSIS (2014) estimates for Germany and the Netherlands are much higher, in the 1.5-1.6 percent range, cost rates for other countries are considerably lower than the U.S. and China. In total, then, cyber insecurity may already cost the U.S. about 1.1 percent of GDP annually, exceeding the annual economic benefits of ICT to economic growth and pushing up toward the sum of likely benefits of ICT to both economic growth and consumer surplus.
Comparing the Costs and Benefits of ICT/Cyber In the above discussion we considered three sources of economic benefits from ICT/Cyber (value added, productivity and GDP, and consumer surplus) as well as three sources of economic costs (spending on cyber risk mitigation, the cost of adverse cyber events, and opportunity costs). A comparison of the aggregate benefits with the aggregate costs provides us with an annualized snapshot of the state of cyber risk economics. However, that is only one side of the story. Another perspective considers the cumulative costs and benefits that accrue to a country over time.
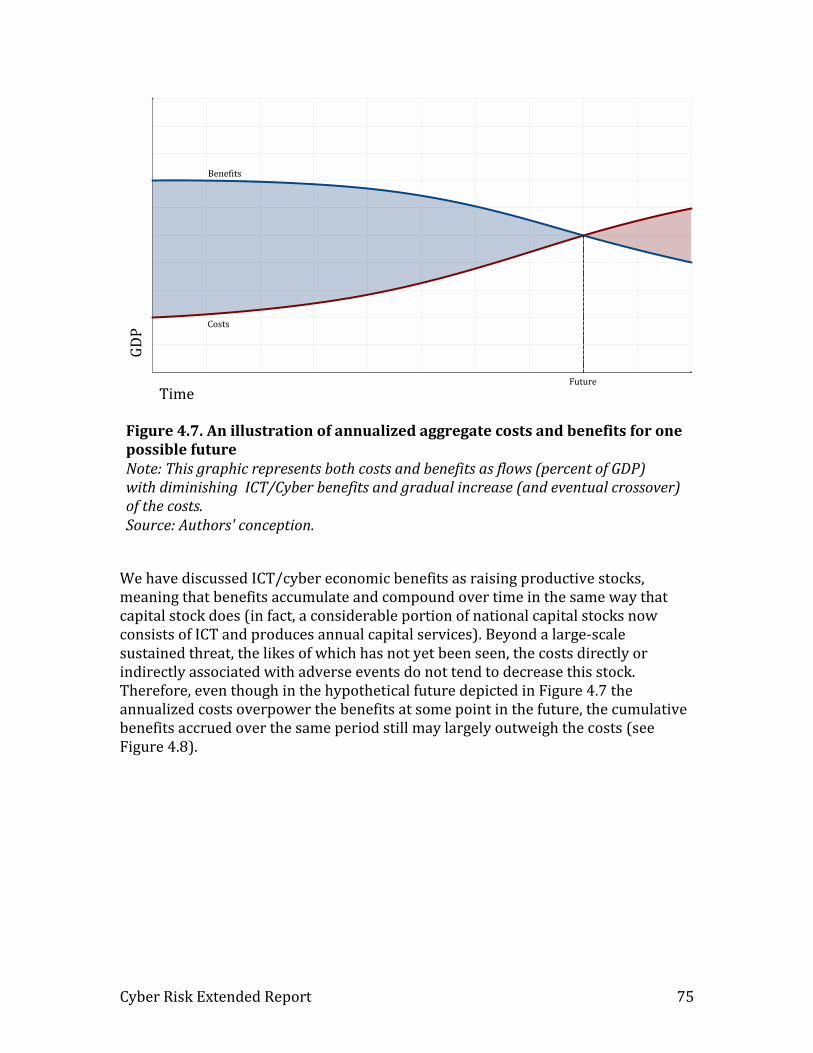
Cyber Risk Extended Report 75
Figure 4.7. An illustration of annualized aggregate costs and benefits for one possible future Note: This graphic represents both costs and benefits as flows (percent of GDP)
with diminishing ICT/Cyber benefits and gradual increase (and eventual crossover) of the costs. Source: Authors' conception.
We have discussed ICT/cyber economic benefits as raising productive stocks, meaning that benefits accumulate and compound over time in the same way that capital stock does (in fact, a considerable portion of national capital stocks now consists of ICT and produces annual capital services). Beyond a large-scale sustained threat, the likes of which has not yet been seen, the costs directly or indirectly associated with adverse events do not tend to decrease this stock. Therefore, even though in the hypothetical future depicted in Figure 4.7 the annualized costs overpower the benefits at some point in the future, the cumulative benefits accrued over the same period still may largely outweigh the costs (see Figure 4.8).
Time
GDP
Bene its
Costs
Future
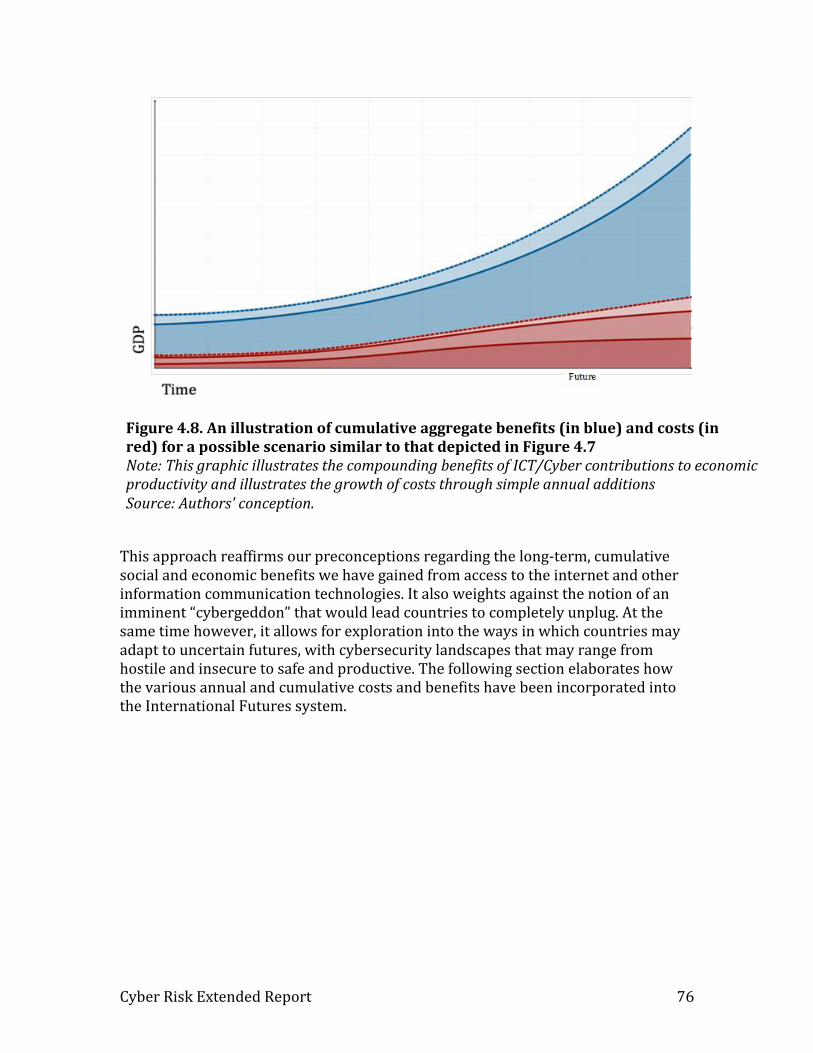
Cyber Risk Extended Report 76
Figure 4.8. An illustration of cumulative aggregate benefits (in blue) and costs (in red) for a possible scenario similar to that depicted in Figure 4.7
Note: This graphic illustrates the compounding benefits of ICT/Cyber contributions to economic productivity and illustrates the growth of costs through simple annual additions Source: Authors' conception.
This approach reaffirms our preconceptions regarding the long-term, cumulative social and economic benefits we have gained from access to the internet and other information communication technologies. It also weights against the notion of an imminent “cybergeddon” that would lead countries to completely unplug. At the same time however, it allows for exploration into the ways in which countries may adapt to uncertain futures, with cybersecurity landscapes that may range from hostile and insecure to safe and productive. The following section elaborates how the various annual and cumulative costs and benefits have been incorporated into the International Futures system.
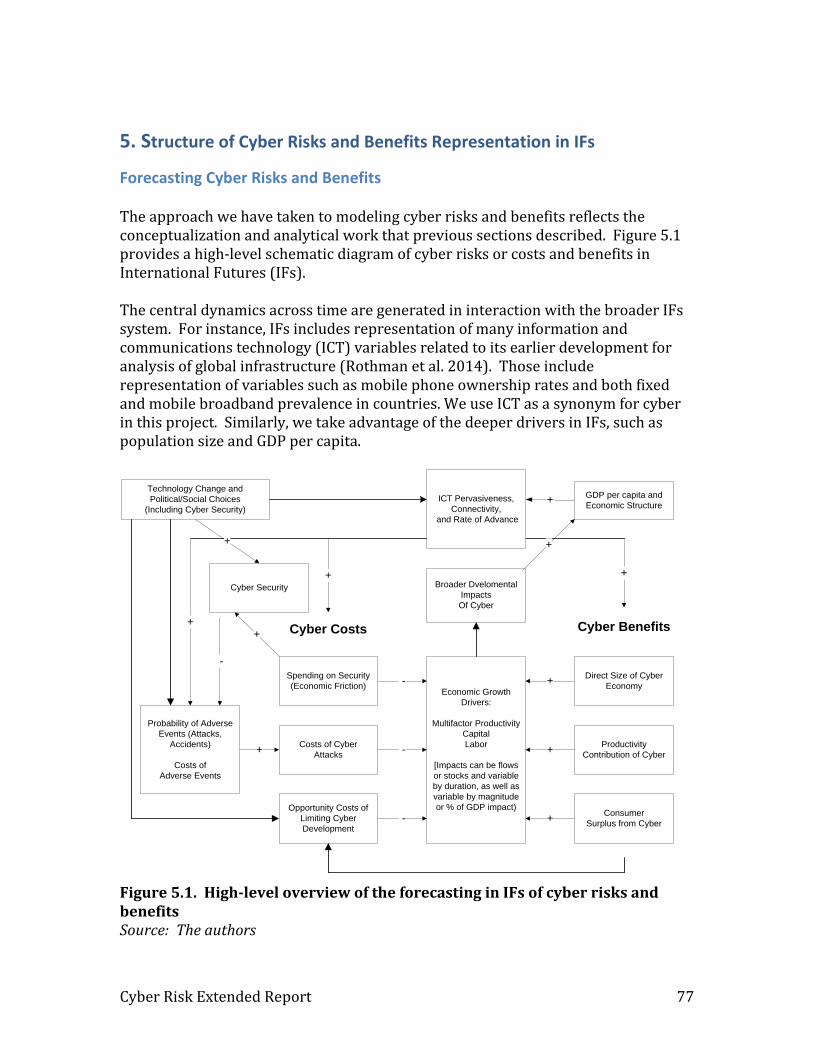
Cyber Risk Extended Report 77
5. Structure of Cyber Risks and Benefits Representation in IFs
Forecasting Cyber Risks and Benefits The approach we have taken to modeling cyber risks and benefits reflects the conceptualization and analytical work that previous sections described. Figure 5.1 provides a high-level schematic diagram of cyber risks or costs and benefits in International Futures (IFs). The central dynamics across time are generated in interaction with the broader IFs system. For instance, IFs includes representation of many information and communications technology (ICT) variables related to its earlier development for analysis of global infrastructure (Rothman et al. 2014). Those include representation of variables such as mobile phone ownership rates and both fixed and mobile broadband prevalence in countries. We use ICT as a synonym for cyber in this project. Similarly, we take advantage of the deeper drivers in IFs, such as population size and GDP per capita.
+
Economic Growth
Drivers:
Multifactor Productivity
Capital
Labor
[Impacts can be flows
or stocks and variable
by duration, as well as
variable by magnitude
or % of GDP impact)
+
Probability of Adverse
Events (Attacks,
Accidents)
Costs of
Adverse Events
GDP per capita and
Economic Structure
Spending on Security
(Economic Friction)
+
+
Broader Dvelomental
Impacts
Of Cyber
ICT Pervasiveness,
Connectivity,
and Rate of Advance
Productivity
Contribution of Cyber
+
+
+
-
+
+
Opportunity Costs of
Limiting Cyber
Development
- Costs of Cyber
Attacks
-
-
Technology Change and
Political/Social Choices
(Including Cyber Security)
Direct Size of Cyber
Economy
Consumer
Surplus from Cyber
Cyber Costs Cyber Benefits
+
Cyber Security
+
+
Figure 5.1. High-level overview of the forecasting in IFs of cyber risks and benefits Source: The authors
Cyber Risk Extended Report 78
As Figure 5.1 suggests, there are two main drivers of the various costs associated with cyber risk and the various benefits (earlier sections explained the typologies of those costs and benefits). The first driver is the pervasiveness of ICT within countries at any point in time (country-years are our major unit of analysis). The second is the extent of cyber security and the associated probabilities and costs of adverse cyber events. In this section we will first discuss the representation in IFs of ICT pervasiveness and the nexus of variables around security spending, security, and adverse event risk probability and cost. Then we will move to discussion of other variable cyber cost and benefit variables.
ICT or Cyber Pervasiveness The International Telecommunications Union (ITU) collects and provides a large number of data series important to our work here. Among these, the ITU has built an index based on many of its other series called the ICT Development Index (IDI). That index is a weighted average of three sub-indices, namely one on access to ICT, one on skills for its use, and one on actual use. See Section 2 of this report for an introduction to the index. The replication in IFs for forecasting of this index is ICTINDEX. 54 IFs contains and forecasts most of the variables that are used in construction of the sub-indices.
𝐼𝐶𝑇𝐼𝑁𝐷𝐸𝑋𝑟,𝑡 = (0.4 ∗ 𝐼𝐶𝑇𝐴𝐶𝐶 + 0.4 ∗ 𝐼𝐶𝑇𝑈𝑆𝐸 + 0.2 ∗ 𝐼𝐶𝑇𝑆𝐾𝐼𝐿𝐿) ∗ 10
Where,
𝐼𝐶𝑇𝐴𝐶𝐶 = (𝐼𝐶𝑇𝑀𝑂𝐵𝐼𝐿𝑟,𝑡 120⁄ + 𝐼𝐶𝑇𝐶𝑂𝑀𝑃𝑈𝑇𝐸𝑅𝑆𝑟,𝑡 100⁄
+ 𝐼𝐶𝑇𝐼𝑁𝑇𝑁𝐸𝑇𝐻𝐻𝑟,𝑡 100⁄ )/3
𝐼𝐶𝑇𝑈𝑆𝐸 = (𝐼𝐶𝑇𝐵𝑅𝑂𝐴𝐷𝑟,𝑡 50⁄ + 𝐼𝐶𝑇𝐵𝑅𝑂𝐴𝐷𝑀𝑂𝐵𝐼𝐿𝑟,𝑡 100⁄ )/2
54 Although the IDI is driven in IFs from component variables, it could also have been driven by deeper developmental variables such as GDP per capita, years of education, or specific ITC variables such as mobile broadband subscription rates. In our analysis of those we found that the log of GDP2011PCPPP/1000 has R2 of 0.7655 in 1.0589+1.5915*ln(X) but saturates somewhat too slowly (EU countries above, oil producers below); with Edyears15 added both significant, but minimal addition to adjusted R2 (0.783); -.01908+1.135*ln(GDPCP/1000) + 0.26155*Edyearsage15Total. Much better, instead add ICTBroadbandMobileSubsPer100. Takes R2 to 0.8609; 1.3187 + 1.1053*ln(GDP2011PCPPP/1000) +0.2629* ICTBroadbandMobileSubsPer100.

Cyber Risk Extended Report 79
𝐼𝐶𝑇𝑆𝐾𝐼𝐿𝐿 = (𝐿𝐼𝑇𝑟,𝑡 100⁄ + 𝐸𝐷𝑆𝐸𝐶𝐸𝑁𝑅𝐺𝑟,𝑡,𝑡𝑜𝑡𝑎𝑙 100⁄ + 𝐸𝐷𝑇𝐸𝑅𝐸𝑁𝑅𝐺𝑟,𝑡,𝑡𝑜𝑡𝑎𝑙 100⁄ )
/3 As evident in the above equations, following ITU we divide level of ICT development into three categories, access (ICTACC), use (ICTUSE) and skill (ICTSKILL). ICT access component is combined from mobile-cellular phones per 100 inhabitants (ICTMOBIL), percentage of households with a personal computer (ICTCOMPUTERS) and percentage of households with internet access (ICTINTERNETHH). Fixed and wireless-broadband use per 100 inhabitants (ICTBROAD and ICTBROADMOBIL) are used as indicators of ICT use. Skills for ICT use are determined by adult literacy rate (LIT), secondary gross enrollment ratio (EDSECENRG) and tertiary gross enrollment ratio (EDTERENRG). One weakness of the IDI is that it is closely tied to current ICT technology around mobile phones and broadband use. But ICT or cyber technology and its use continues to advance rapidly. One example is the anticipated "internet of everything" with connected devices to be found in all areas of our lives, including management of systems in the home, self-driving cars, and even control of medical assistance systems within our bodies. Thus the saturating character of the ICTINDEX may underestimate future prevalence. This is a major reason we have added a multiplier (ictindexm) to our formulation for the IDI that we can use for scenario analysis. Also, in our formulations using the index, we do not assume that its influence ceases with that saturating level—the level itself becomes an ongoing driver.
Security Spending and Security Levels Security spending as a percentage of GDP (ICTCYBSECSPEND) is a variable in IFs that serves two purposes. First, it is one of the key costs of cyber risk. Second, it at least theoretically should increase cyber security (ICTCYBSECUR). Unfortunately, as earlier sections indicated, data on cyber security spending are highly anecdotal and partial. Figure 4.1, showing spending in the US from 2009 through estimates for 2017 (from the Telecommunications Industry Association), is the best country-year data set we have. A key insight from that series is that the portion of GDP allocated to security has been growing from about 0.18 percent to an anticipated 0.35 percent in 2017. In spite of the scarcity of data, the general consensus is that spending rates have been rising. The literature also generally suggests that those rates rise with both the pervasiveness of ICT and the development level of societies. We have had little choice in this project but to put into IFs a stylized formulation for the future of cyber security spending and to add a multiplier that allows strong scenario control on it. The general statement is:

Cyber Risk Extended Report 80
𝐼𝐶𝐶𝑌𝐵𝑆𝐸𝐶𝑆𝑃𝐸𝑁𝐷𝑟,𝑡 = 𝐹(𝐼𝐶𝑇𝐼𝑁𝐷𝐸𝑋𝑟,𝑡. 𝐺𝐷𝑃𝑃𝐶𝑃𝑟,𝑡)*𝒊𝒄𝒕𝒄𝒚𝒃𝒔𝒆𝒄𝒔𝒑𝒆𝒏𝒅𝒎𝑟,𝑡
The specific formulation logs both of the driving variables so that they saturate rather than driving spending rates up indefinitely as a percentage of GDP and scales the result so that it peaks near 0.4% of GDP. The exogenous multiplier on security spending, ictcybsecspendm, is set at 1.0 in the Base Case, but can be used to easily raise or lower that maximum level.55
𝐼𝐶𝑇𝐶𝑌𝐵𝑆𝐸𝐶𝑆𝑃𝐸𝑁𝐷𝑟,𝑡 =
𝐴𝑀𝐼𝑁 (0.4,ln(𝐴𝑀𝐼𝑁(10,𝐼𝐶𝑇𝐼𝑁𝐷𝐸𝑋𝑟,𝑡))
3.65∗
ln(𝐴𝑀𝐼𝑁(80,𝐺𝐷𝑃𝑃𝐶𝑃𝑟,𝑡))
6.95)*𝒊𝒄𝒕𝒄𝒚𝒃𝒔𝒆𝒄𝒔𝒑𝒆𝒏𝒅𝒎𝑟,𝑡
Turning to the actual level of cyber security, ICTCYBSECUR, we have based our index on the cyber security index of the ITU (see Section 2 for an introduction to that index and its 5 sub-indices). Unlike our representation in IFs of the ICT development index (IDI), we cannot forecast the cyber security index from other variables in IFs. Instead we need to forecast it from presumed driving variables, such as the ICT Development Index and cyber security spending.
𝐼𝐶𝑇𝐶𝑌𝐵𝑆𝐸𝐶𝑈𝑅𝑟,𝑡 = 𝐹(𝐼𝐶𝑇𝐼𝑁𝐷𝐸𝑋𝑟,𝑡. 𝐼𝐶𝑇𝐶𝑌𝐵𝑆𝐸𝐶𝑆𝑃𝐸𝑁𝐷𝑟,𝑡)*𝒊𝒄𝒕𝒄𝒚𝒃𝒔𝒆𝒄𝒖𝒓𝒎𝑟,𝑡
Again, however, we don't really have a meaningful cyber spending database so the more specific formulation is tied most fundamentally to the magnitude of the ICT development index as indicated in Figure 5.2.56 It may surprise some that security rises with ICT pervasiveness rather than falling; but this is entirely consistent with the findings of a Microsoft group (Burt, et al. 2014) that show malware control rising with development generally.
55 Because the ICTINDEX term peaks near 10, logging it and dividing by 3.65 causes that term to peak at 0.63. Similarly, constraining GDPPCP to $80,000, logging it and dividing by 6.95 causes that term also to peak at 0.63. The value of 0.63 squared is 0.4.
56 The relationship in Figure 6.2 might be improved by additional variables. Transparency International's corruption/transparency measure is nearly significant when added and transparency does improve security, but the adjusted R-squared is not improved. Adding Polity's democracy slightly improves R-squared, but the T value is low.

Cyber Risk Extended Report 81
Figure 5.2. ICT Cyber Security Index as a function of ICT Development Index Source: Using data from the ITU. Around that core, the spending variable should be considered only an estimated forecast, which scenario interventions might increase or decrease, so that it can modify the core variable in an elasticity-like representation.
𝐼𝐶𝑇𝐶𝑌𝐵𝑆𝐸𝐶𝑈𝑅𝑟,𝑡 = ((0.00502 + 0.0671 ∗ 𝐼𝐶𝑇𝐼𝑁𝐷𝐸𝑋𝑟,𝑡) ∗ 𝐼𝐶𝑇𝐶𝑌𝐵𝑆𝐸𝐶𝑆𝑃𝐸𝑁𝐷𝑟,𝑡
𝐼𝐶𝑇𝐶𝑦𝑏𝑆𝑒𝑐𝑆𝑝𝑒𝑛𝑑𝐸𝑥𝑝𝑟,𝑡
0.2 )*𝒊𝒄𝒕𝒄𝒚𝒃𝒔𝒆𝒄𝒖𝒓𝒎𝑟,𝑡
where
𝐼𝐶𝑇𝐶𝑦𝑏𝑆𝑒𝑐𝑆𝑝𝑒𝑛𝑑𝐸𝑥𝑝𝑟,𝑡
= 𝐴𝑀𝐼𝑁 (0.4,ln(𝐴𝑀𝐼𝑁(10, 𝐼𝐶𝑇𝐼𝑁𝐷𝐸𝑋𝑟,𝑡))
3.65
∗ln(𝐴𝑀𝐼𝑁(80, 𝐺𝐷𝑃𝑃𝐶𝑃𝑟,𝑡))
6.95)
Adverse Event Probabilities and Costs As Figure 5.1 suggests, moving beyond the cost of cyber security, the second cost associated with cyber risk is that of adverse events (ICTCYBEVTCOST), also represented in IFs as a percentage of GDP and possibly the type of risk or benefit that is subject to the greatest volatility and uncertainty. IFs computes the basic core of that cost as a function of two elements specified exogenously: (1) the probability of adverse events (ictcybevprob) by actor category
Afghanistan
Albania Algeria
Angola
Argentina
Armenia
Australia
Austria
Azerbaijan
Bahrain Bangladesh
Barbados Belarus
Belgium
Benin
Bhutan Bolivia Bosnia and Herzegovina
Botswana
Brazil
Brunei
Bulgaria
Burkina Faso
Cambodia
Cameroon
Canada
Cape Verde Central African Republic
Chad
Chile
China
Colombia
Comoros
Congo, Democratic Republic of
Congo, Republic of
Costa Rica
Cote d'Ivoire
Croatia
Cuba
Cyprus
Czech Republic
Denmark
Djibouti
Dominican Republic
Ecuador
Egypt, Arab Republic of
El Salvador
Eritrea
Estonia
Ethiopia Fiji
Finland
France
Gabon
Gambia, The
Georgia
Germany
Ghana
Greece
Grenada
Guatemala
Guinea
Guinea-Bissau
Guyana
Haiti
Honduras
Hong Kong
Hungary
Iceland
India
Indonesia
Iran, Islamic Republic of
Ireland
Israel
Italy
Jamaica
Japan
Jordan
Kazakhstan
Kenya
Korea, Republic of
Kuwait
Kyrgyz Republic
Laos, People's Democratic Republic
Latvia
Lebanon
Lesotho
Liberia Libya
Lithuania Luxembourg
Macedonia, Former Yugoslav Republic of
Madagascar
Malawi
Malaysia
Maldives
Mali
Malta
Mauritania
Mauritius
Mexico
Moldova
Mongolia
Montenegro
Morocco
Mozambique
Myanmar
Namibia
Nepal
Netherlands
New Zealand
Nicaragua
Niger
Nigeria
Norway
Oman
Pakistan Palestine
Panama
Papua New Guinea
Paraguay Peru
Philippines
Poland
Portugal
Qatar
Romania
Russian Federation
Rwanda
Saudi Arabia
Senegal
Serbia
Seychelles
Singapore
Slovak Republic
Slovenia
Solomon Islands
South Africa
Spain
Sri Lanka
St. Lucia
St. Vincent and the Grenadines
Sudan
Suriname
Swaziland
Sweden
Switzerland
Syrian Arab Republic Tajikistan
Tanzania
Thailand
Togo
Tonga
Trinidad and Tobago
Tunisia Turkey
Turkmenistan
Uganda
Ukraine United Arab Emirates
United Kingdom
United States
Uruguay
Uzbekistan
Venezuela
Vietnam
Yemen, Republic of
Zambia
Zimbabwe
0
0.1
0.2
0.3
0.4
0.5
0.6
0.7
0.8
1 2 3 4 5 6 7 8 9
y= 5.02E-03 + 0.0671*(x)R(SQR) = 0.4210
ICT
CY
BG
lob
alC
yb
Se
cIn
de
xIT
U(M
OS
TR
EC
EN
T)
ICTCYBICTDevelopmentIndexITU(MOSTRECENT)
Cyber Risk Extended Report 82
(hactivism, cybercrime, cyber espionage, and cyber terrorism) and target (households, firms/organizations, and governments); and (2) the cost of such adverse events (ictcybevcost). That core cost increases with ICT pervasiveness (ICTINDEX) and decreases with ICT security (ICTSECURITY). To understand the equation below, note that in Figure 5.2 the pervasiveness index runs from 1 to about 9, while the security index runs from 0 to about 0.8. To avoid division by zero, we shift the security index upward by 0.1. Because the security index is computed linearly from the pervasiveness index, they will rise together. But the slope in Figure 6.1 is such that security will rise somewhat more slowly than pervasiveness, leading to a small upward tendency in event cost. In addition, the user can via scenario change the trajectory of event cost with the exogenous parameter (ictcybevtcostm). 𝐼𝐶𝑇𝐶𝑌𝐵𝐸𝑉𝑇𝐶𝑂𝑆𝑇𝑟,𝑡
= 𝐴𝑀𝐴𝑋(0.01, (∑ ∑ (𝒊𝒄𝒕𝒄𝒚𝒃𝒆𝒗𝒑𝒓𝒐𝒃𝑎,𝑡𝑎𝑟 ∗ 𝒊𝒄𝒕𝒄𝒚𝒃𝒆𝒗𝒑𝒄𝒐𝒔𝒕𝑎,𝑡𝑎𝑟)
3
𝑡𝑎𝑟=1
4
𝑎=1
∗𝐼𝐶𝑇𝐼𝑁𝐷𝐸𝑋𝑟,𝑡
𝐼𝐶𝑇𝐶𝑌𝐵𝑆𝐸𝐶𝑈𝑅𝑟,𝑡 + 0.1
𝐼𝐶𝑇𝐼𝑁𝐷𝐸𝑋𝑟,𝑡=1
𝐼𝐶𝑇𝐶𝑌𝐵𝑆𝐸𝐶𝑈𝑅𝑟,𝑡=1 + 0.1⁄
− 𝐼𝐶𝑇𝐶𝑦𝑏𝐸𝑣𝑡𝑆𝑐𝑎𝑙𝑒𝑟,𝑡) ∗ 𝒊𝒄𝒕𝒄𝒚𝒃𝒆𝒗𝒕𝒄𝒐𝒔𝒕𝒎𝑟,𝑡)
where
𝐼𝐶𝑇𝐶𝑦𝑏𝐸𝑣𝑡𝑆𝑐𝑎𝑙𝑒𝑟,𝑡
= 𝐶𝑦𝑏𝐶𝑟𝑖𝑚𝑒𝐸𝑠𝑝𝐹(𝐼𝐶𝑇𝐼𝑁𝐷𝐸𝑋𝑟=𝑈𝑛𝑖𝑡𝑒𝑑 𝑆𝑡𝑎𝑡𝑒𝑠,𝑡=1)
− 𝐶𝑦𝑏𝐶𝑟𝑖𝑚𝑒𝐸𝑠𝑝𝐹(𝐼𝐶𝑇𝐼𝑁𝐷𝐸𝑋𝑟,𝑡)
and
𝐶𝑦𝑏𝐶𝑟𝑖𝑚𝑒𝐸𝑠𝑝𝐹(𝐼𝐶𝑇𝐼𝑁𝐷𝐸𝑋𝑟,𝑡) = -.0738 + .0605 ∗ 𝐼𝐶𝑇𝐼𝑁𝐷𝐸𝑋𝑟,𝑡
The scaling factor in the above equation (ICTCybEvtScale) requires explanation. It is a way of introducing (1) initial country differences in adverse event costs (linked to differences in ICT pervasiveness) and (2) some ongoing increase in event costs with growth around the world in ICT pervasiveness. The scaling factor is calculated in a function (CybCrimeEspF) that estimates cybercrime and espionage costs as a portion of GDP from ICT pervasiveness (ICTIndex). See the function in Figure 5.3. The scaling factor uses the United States in the first model year as the base, because the basic event probabilities and costs have been set using U.S. data. Thus if a country-year has lower ICT pervasiveness than the US in 2010, the function will compute a lower expected adverse event cost and the overall cyber event cost in the above equation will be reduced. The key problem surrounding initializing of adverse event costs and scaling of them is that we have extremely limited data on such costs. One partial exception is the
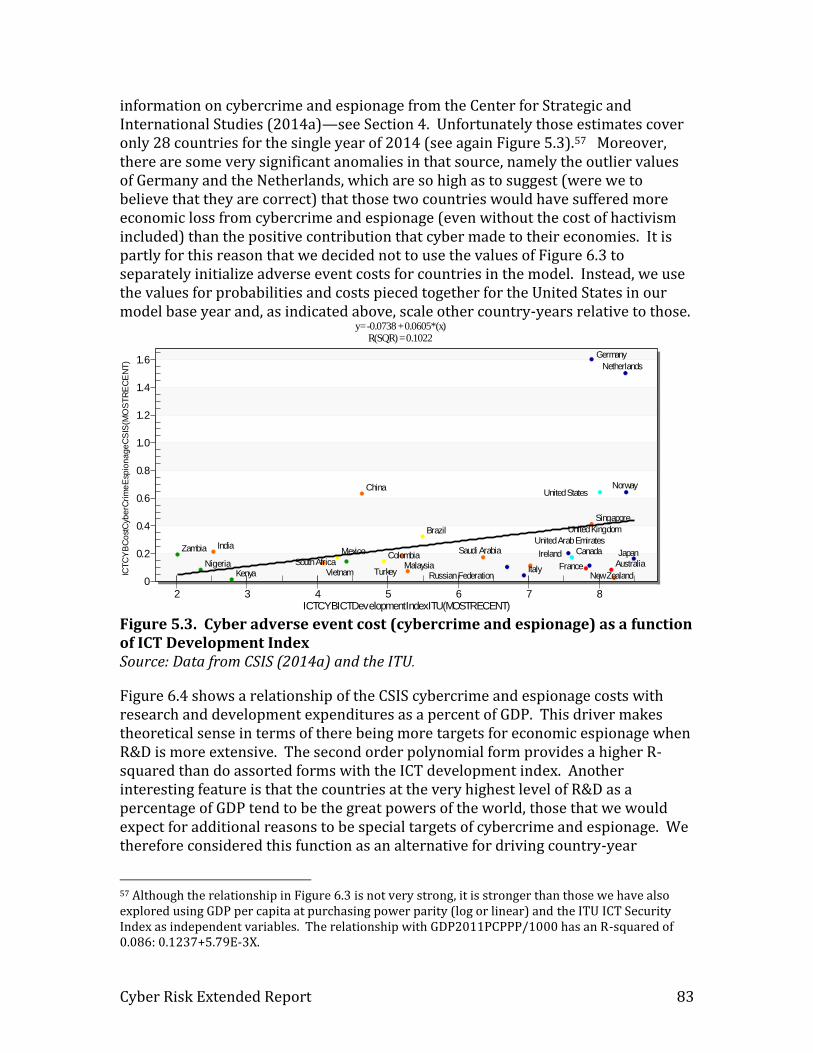
Cyber Risk Extended Report 83
information on cybercrime and espionage from the Center for Strategic and International Studies (2014a)—see Section 4. Unfortunately those estimates cover only 28 countries for the single year of 2014 (see again Figure 5.3).57 Moreover, there are some very significant anomalies in that source, namely the outlier values of Germany and the Netherlands, which are so high as to suggest (were we to believe that they are correct) that those two countries would have suffered more economic loss from cybercrime and espionage (even without the cost of hactivism included) than the positive contribution that cyber made to their economies. It is partly for this reason that we decided not to use the values of Figure 6.3 to separately initialize adverse event costs for countries in the model. Instead, we use the values for probabilities and costs pieced together for the United States in our model base year and, as indicated above, scale other country-years relative to those.
Figure 5.3. Cyber adverse event cost (cybercrime and espionage) as a function of ICT Development Index Source: Data from CSIS (2014a) and the ITU.
Figure 6.4 shows a relationship of the CSIS cybercrime and espionage costs with research and development expenditures as a percent of GDP. This driver makes theoretical sense in terms of there being more targets for economic espionage when R&D is more extensive. The second order polynomial form provides a higher R-squared than do assorted forms with the ICT development index. Another interesting feature is that the countries at the very highest level of R&D as a percentage of GDP tend to be the great powers of the world, those that we would expect for additional reasons to be special targets of cybercrime and espionage. We therefore considered this function as an alternative for driving country-year
57 Although the relationship in Figure 6.3 is not very strong, it is stronger than those we have also explored using GDP per capita at purchasing power parity (log or linear) and the ITU ICT Security Index as independent variables. The relationship with GDP2011PCPPP/1000 has an R-squared of 0.086: 0.1237+5.79E-3X.
Australia
Brazil
Canada
China
Colombia
France
Germany
India Ireland
Italy
Japan
Kenya Malaysia
Mexico
Netherlands
New Zealand
Nigeria
Norway
Russian Federation
Saudi Arabia
Singapore
South Africa Turkey
United Arab Emirates
United Kingdom
United States
Vietnam
Zambia
0
0.2
0.4
0.6
0.8
1.0
1.2
1.4
1.6
2 3 4 5 6 7 8
y= -0.0738 + 0.0605*(x)R(SQR) = 0.1022
ICT
CY
BC
ost
Cyb
erC
rim
eE
spio
na
ge
CS
IS(M
OS
TR
EC
EN
T)
ICTCYBICTDevelopmentIndexITU(MOSTRECENT)
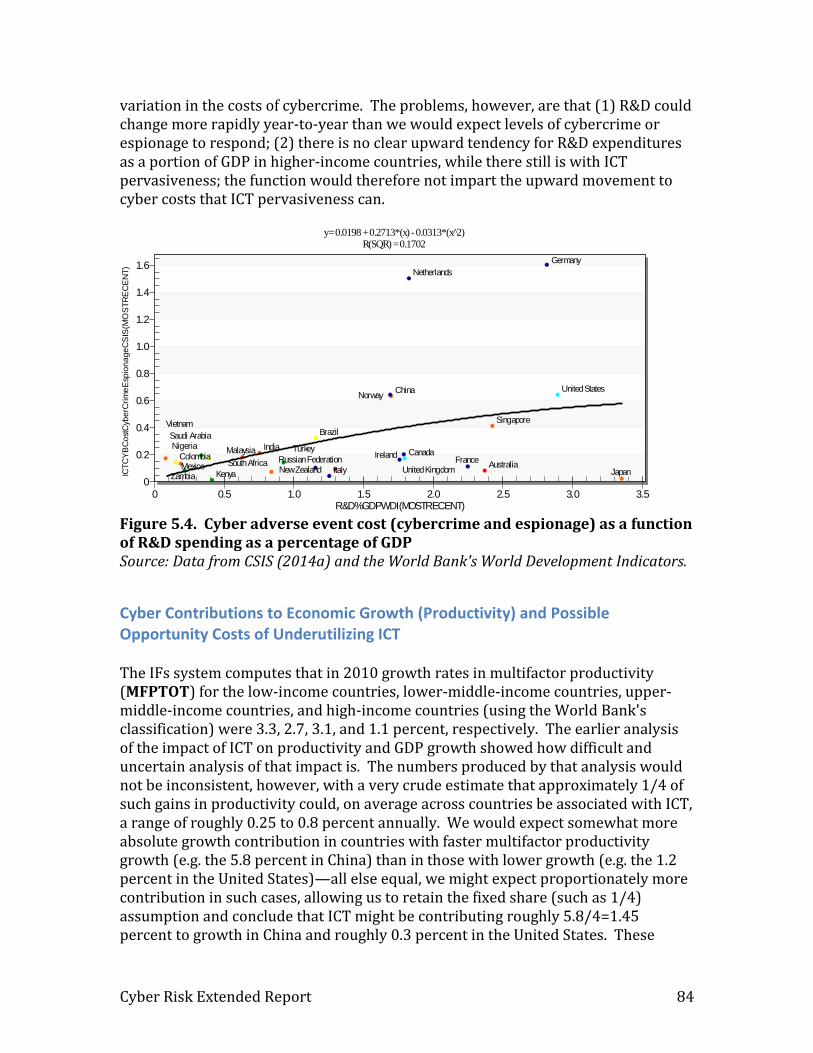
Cyber Risk Extended Report 84
variation in the costs of cybercrime. The problems, however, are that (1) R&D could change more rapidly year-to-year than we would expect levels of cybercrime or espionage to respond; (2) there is no clear upward tendency for R&D expenditures as a portion of GDP in higher-income countries, while there still is with ICT pervasiveness; the function would therefore not impart the upward movement to cyber costs that ICT pervasiveness can.
Figure 5.4. Cyber adverse event cost (cybercrime and espionage) as a function of R&D spending as a percentage of GDP Source: Data from CSIS (2014a) and the World Bank's World Development Indicators.
Cyber Contributions to Economic Growth (Productivity) and Possible Opportunity Costs of Underutilizing ICT The IFs system computes that in 2010 growth rates in multifactor productivity (MFPTOT) for the low-income countries, lower-middle-income countries, upper-middle-income countries, and high-income countries (using the World Bank's classification) were 3.3, 2.7, 3.1, and 1.1 percent, respectively. The earlier analysis of the impact of ICT on productivity and GDP growth showed how difficult and uncertain analysis of that impact is. The numbers produced by that analysis would not be inconsistent, however, with a very crude estimate that approximately 1/4 of such gains in productivity could, on average across countries be associated with ICT, a range of roughly 0.25 to 0.8 percent annually. We would expect somewhat more absolute growth contribution in countries with faster multifactor productivity growth (e.g. the 5.8 percent in China) than in those with lower growth (e.g. the 1.2 percent in the United States)—all else equal, we might expect proportionately more contribution in such cases, allowing us to retain the fixed share (such as 1/4) assumption and conclude that ICT might be contributing roughly 5.8/4=1.45 percent to growth in China and roughly 0.3 percent in the United States. These
Australia
Brazil
Canada
China
Colombia France
Germany
India Ireland
Italy Japan Kenya
Malaysia
Mexico
Netherlands
New Zealand
Nigeria
Norway
Russian Federation
Saudi Arabia
Singapore
South Africa
Turkey
United Kingdom
United States
Vietnam
Zambia0
0.2
0.4
0.6
0.8
1.0
1.2
1.4
1.6
0 0.5 1.0 1.5 2.0 2.5 3.0 3.5
y= 0.0198 + 0.2713*(x) - 0.0313*(x̂ 2)R(SQR) = 0.1702
ICT
CY
BC
ost
Cyb
erC
rim
eE
spio
na
ge
CS
IS(M
OS
TR
EC
EN
T)
R&D%GDPWDI(MOSTRECENT)

Cyber Risk Extended Report 85
numbers may be a little conservative relative those in the literature reviewed earlier, but not outrageously so. And the overall approach is consistent with the observation that ICT has greater potential contribution to growth in developing (faster growing) than developed countries. Yet it is also reasonable to argue that different societies will have different economic benefits from ICT depending on the intensity of either (a) their level of its use, or (b) the growth rate in their use of it. For instance, we saw some literature reports that the growth impact could follow an inverted-U shape curve with maximum contribution in the middle range of adoption patterns; and we saw many that related its impact to the rate of adoption of technologies such as mobile phones or broadband connections (mobile or fixed). Figure 5.5 provides some information about the level of ICT pervasiveness using again the ITU development index, as a function of GDP per capita at purchasing power parity. Countries above the line (like Israel and Denmark) are almost certainly obtaining "extra" benefit from ICT relative to peers at their development level. Countries below the line (like Kuwait and Brunei) are probably obtaining less.
Figure 5.5. ICT Development Index as a function of GDP per capita at purchasing power parity Source: the ITU and World Bank's World Development Indicators The impact of higher or lower ICT penetration or pervasiveness than expected on economic growth is not something that the literature or data can easily tell us. So again we need to consider a stylized approach that gives us generally reasonable estimates.
Afghanistan
Albania
Algeria
Angola
Argentina
Armenia
Australia
Austria
Azerbaijan
Bahrain
Bangladesh
Barbados
Belarus
Belgium
Benin
Bhutan
Bolivia
Bosnia and Herzegovina
Botswana
Brazil Brunei
Bulgaria
Burkina Faso
Cambodia
Cameroon
Canada
Cape Verde
Central African Republic
Chad
Chile
China
Colombia
Comoros
Congo, Democratic Republic of
Congo, Republic of
Costa Rica
Cote d'Ivoire
Croatia
Cuba
Cyprus
Czech Republic
Denmark
Djibouti
Dominican Republic
Ecuador Egypt, Arab Republic of
El Salvador
Eritrea
Estonia
Ethiopia
Fiji
Finland
France
Gabon
Gambia, The
Georgia Germany
Ghana
Greece
Grenada
Guatemala
Guinea Guinea-Bissau
Guyana
Haiti
Honduras
Hong Kong Hungary
Iceland
India
Indonesia
Iran, Islamic Republic of
Ireland
Israel
Italy
Jamaica
Japan
Jordan
Kazakhstan
Kenya
Korea, Republic of
Kosovo
Kuwait
Kyrgyz Republic
Laos, People's Democratic Republic
Latvia
Lebanon
Lesotho
Liberia
Libya
Lithuania Luxembourg
Macedonia, Former Yugoslav Republic of
Madagascar Malawi
Malaysia
Maldives
Mali
Malta
Mauritania
Mauritius
Mexico
Moldova
Mongolia
Montenegro
Morocco
Mozambique Myanmar
Namibia
Nepal
Netherlands
New Zealand
Nicaragua
Niger
Nigeria
Norway
Oman
Pakistan
Palestine
Panama
Papua New Guinea
Paraguay Peru Philippines
Poland Portugal
Qatar
Romania
Russian Federation
Rwanda
Saudi Arabia
Senegal
Serbia Seychelles
Singapore
Slovak Republic
Slovenia
Solomon Islands
South Africa
Spain
Sri Lanka
St. Lucia St. Vincent and the Grenadines
Sudan
Suriname
Swaziland
Sweden
Switzerland
Syrian Arab Republic
Taiwan, China
Tajikistan Tanzania
Thailand
Togo
Tonga
Trinidad and Tobago
Tunisia
Turkey Turkmenistan
Uganda
Ukraine
United Arab Emirates
United Kingdom United States
Uruguay
Uzbekistan
Venezuela
Vietnam
Yemen, Republic of Zambia
Zimbabwe
0
1
2
3
4
5
6
7
8
9
0 10K 20K 30K 40K 50K 60K 70K 80K 90K 100K 110K 120K 130K
y= -9.9348 + 1.5915*ln(x)R(SQR) = 0.7655
ICT
CY
BIC
TD
eve
lop
me
ntI
nd
exIT
U(M
OS
TR
EC
EN
T)
GDP2011PCPPP(MOSTRECENT)
Cyber Risk Extended Report 86
Consider, for instance, that the index value for the Republic of Korea, a heavy embracer, is nearly 8.9, but the expected index value for the country given its GDP per capita and the relationship in Figure 5.5 is only 6.6. Thus the "surplus" ICT development level is 2.3/(9-1) or 29 percent. The model calculates an MFPTOT value for the country in 2015 of 2.45 percent. One-fourth of that, our basic estimate for all countries, would be an ICT contribution to growth of 0.61 percent. But adding 29 percent to that would raise the value of 0.78 percent. On the other end of the spectrum, the" expected" ICT index value for Kuwait at its level of GDP per capita would be 8.0 but the actual value is 4.2. It could be foregoing as much as 3.8/(9-1) or 48 percent of potential contribution. In 2015 its MFPTOT level in IFs is 2.3 percent. Rather than estimating the MPF contribution of ICT for Kuwait at 2.3/4=0.58 percent, we can reduce that by nearly half to 0.28 percent. The difference between these two numbers, 0.3 percent, is effectively the opportunity cost of Kuwait's failure to use ICT more intensely. With respect to which countries may receive bonus contributions to productivity gains from ICT and which might be paying opportunity costs, Figure 5.5 suggests some bases for supposition. Some countries will not embrace ICT as fully as others at similar levels of development as measured by GDP per capita at purchasing power parity for reasons that might be cultural or efforts at reflect social control within authoritarian states; examples might be Cuba, Saudi Arabia, Oman, Libya and Qatar. Other reasons could be low population densities, geographical barriers, social inequalities, or weak governance, perhaps in Indonesia, Mexico, Namibia, Botswana, Gabon, and the Republic of the Congo. Theoretically, potential ICT users in still other societies could decide to forgo some of the benefits of cyber because of concerns around security or experience with actual security threats; interestingly, both the United States and China are below the line In sharp contrast, many societies, including Israel, the Republic of Korea, Estonia, and the Scandinavian countries, have especially embraced ICT. In general, Figure 6.5 suggests that European societies have greater that "expected" levels of pervasiveness (ICTIndexExp), African, Middle Eastern, and Latin American societies have lower levels, and Asian societies are more mixed. We calculate that expected value of the ICT index from a function like that of Figure 6.5 as in the equation below, but because ICT and therefore ICTINDEX is advancing so rapidly, we actually re-estimate the function in each year of our forecasting.
𝐼𝐶𝑇𝐼𝑛𝑑𝑒𝑥𝐸𝑥𝑝𝑟,𝑡 = −9.9348 + 1.5915 ∗ 𝐺𝐷𝑃𝑃𝐶𝑃𝑟,𝑡

Cyber Risk Extended Report 87
These estimations of expected ICT index values can be the basis for the calculation of two important variables in IFs. The first is ICTCYBBENEFIT, the actual or potential percentage-point contributions of ICT to economic growth, represented as a moving average of GDP growth rate (MaGDPr). The second is ICTCYBOPCOST, the foregone benefit from underutilizing ICT (for those countries actually below the regression line). We calculate the former as the basic a fraction (ICTGrContrib) of MaGDPr (again for all countries) plus any "bonus" from more intensive use of ICT as indicated by being above the expected value or minus any “penalty” as indicated by being below the expected value (the difference between actual and expected is scaled by the overall range of the index). The function for the growth contribution fraction was developed by trial and error so as to assure that the cyber growth benefits for countries in different global income categories fit the historical data from the Conference Board as well as possible.
𝐼𝐶𝑇𝐶𝑌𝐵𝐵𝐸𝑁𝐸𝐹𝐼𝑇𝑟,𝑡
= (𝐼𝐶𝑇𝐺𝑟𝐶𝑜𝑛𝑡𝑟𝑖𝑏𝑟,𝑡 ∗ 𝑀𝑎𝐺𝐷𝑃𝑟𝑟,𝑡
∗ (1 + (𝐼𝐶𝑇𝐼𝑁𝐷𝐸𝑋𝑟,𝑡 − 𝐼𝐶𝑇𝐼𝑛𝑑𝑒𝑥𝐸𝑥𝑝𝑟,𝑡)/10)) ∗ 𝒊𝒄𝒕𝒄𝒚𝒃𝒃𝒆𝒏𝒆𝒇𝒊𝒕𝒎𝑟,𝑡
where
𝐼𝐶𝑇𝐺𝑟𝐶𝑜𝑛𝑡𝑟𝑖𝑏𝑟,𝑡 = 0.3 − 0.15 ∗ 𝐴𝑚𝑖𝑛(𝐺𝐷𝑃𝑃𝑃𝐶𝑟,𝑡/40
We calculate the opportunity cost as the "penalty" of actually being below the expected value. Obviously, we could (and will) calculate a single net benefit number for each country-year based on the contributed share of MaGDPr plus the bonus or minus the penalty. But we want to explicitly know the penalty level and not to double count values. The user can modify the opportunity cost with an additive factor (ictcybopcostadd). if (𝐼𝐶𝑇𝐼𝑁𝐷𝐸𝑋𝑟,𝑡 ≥ 𝐼𝐶𝑇𝐼𝑛𝑑𝑒𝑥𝐸𝑥𝑝𝑟,𝑡 𝑡ℎ𝑒𝑛
𝐼𝐶𝑇𝐶𝑌𝐵𝑂𝑃𝐶𝑂𝑆𝑇𝑟,𝑡 = 0.0
else
𝐼𝐶𝑇𝐶𝑌𝐵𝑂𝑃𝐶𝑂𝑆𝑇𝑟,𝑡
= 𝐼𝐶𝑇𝐺𝑟𝐶𝑜𝑛𝑡𝑟𝑖𝑏𝑟,𝑡 ∗ 𝑀𝑎𝐺𝐷𝑃𝑟𝑟,𝑡
∗ (1 +𝐼𝐶𝑇𝐼𝑛𝑑𝑒𝑥𝐸𝑥𝑝𝑟,𝑡 − 𝐼𝐶𝑇𝐼𝑁𝐷𝐸𝑋𝑟,𝑡
10) + 𝒊𝒄𝒕𝒄𝒚𝒃𝒐𝒑𝒄𝒐𝒔𝒕𝒂𝒅𝒅𝑟,𝑡
Although not a separate variable in the model, the net economic contribution of ICT to MFP for each country is
𝐼𝐶𝑇𝐶𝑏𝑦𝑁𝑒𝑡𝐵𝑒𝑛𝑒𝑓𝑖𝑡𝑟,𝑡 = 𝐼𝐶𝑇𝐶𝑌𝐵𝐵𝐸𝑁𝐸𝐹𝐼𝑇𝑟,𝑡- 𝐼𝐶𝑇𝐶𝑌𝐵𝑂𝑃𝐶𝑂𝑆𝑇𝑟,𝑡

Cyber Risk Extended Report 88
Cyber Benefits: Consumer Surplus Beyond the economic benefit of ICT or cyber to productivity, the second primary economic benefit is to consumers and is appropriated called consumer surplus (ICTCONSURPLUS). Still again the data or estimates on this are very scarce. The best source of data we found was the Organization for Economic Cooperation and Development (OECD) and Figure 6.6 plots their most recent year's numbers as a function of GDP per capita at purchasing power parity (a linear plot further reduces the low R-squared to 0.0893). The average value is approximately 0.2 percent, making it somewhat smaller than the positive contribution of ICT to MFP advance. Interestingly, the larger economies (notably the United States, Japan, Germany, and the United Kingdom) tend to have lower values, not exceeding 0.1 percent. Perhaps this reflects the fact that those countries were relatively early technology adopters, a supposition supported by historical values for South Korea that also exceed 0.1 percent in only 2010. The plot of Figure 5.6 suggests that the relationship might well have the shape of an inverted-U in which the peak contributions are for middle-income countries, but we have no data on the lower-income end of the pattern. More logically, perhaps, the consumer surplus might be related to the level of the ICT development index or its rate of change. Yet we found that the R-squared with the level of the index was only 0.052; and adding that to GDP per capita as a driver added nothing to R-squared. We did find that there was the expected positive relationship between the rate of change in the ICT development index over the most recent 5-year period and the consumer benefit, but again the R-squared was only 0.065, and the upward slope was heavily influence by a single middle-income country, Turkey.
Figure 5.6. ICT consumer surplus as a function of GDP per capita at purchasing power parity Source: World Bank's World Development Indicators and the Organization for Economic Co-operation and Development.
Australia
Austria
Belgium
Canada
Czech Republic
Denmark
Finland
France
Germany Greece
Hungary
Iceland
Ireland Italy
Japan
Korea, Republic of
Luxembourg
Mexico
Netherlands
New Zealand Norway
Poland Portugal
Slovak Republic
Spain
Sweden
Switzerland
Turkey
United Kingdom
United States
0
0.1
0.2
0.3
0.4
0.5
0.6
0.7
0.8
0.9
20000 30000 40000 50000 60000 70000 80000
y= 1.9498 - 0.1695*ln(x)R(SQR) = 0.1017
ICT
CY
BC
onsum
erS
urp
lusO
EC
D(M
OS
TR
EC
EN
T)/
GD
P2011(M
OS
TR
EC
EN
T)/
10000
GDP2011PCPPP(MOSTRECENT)
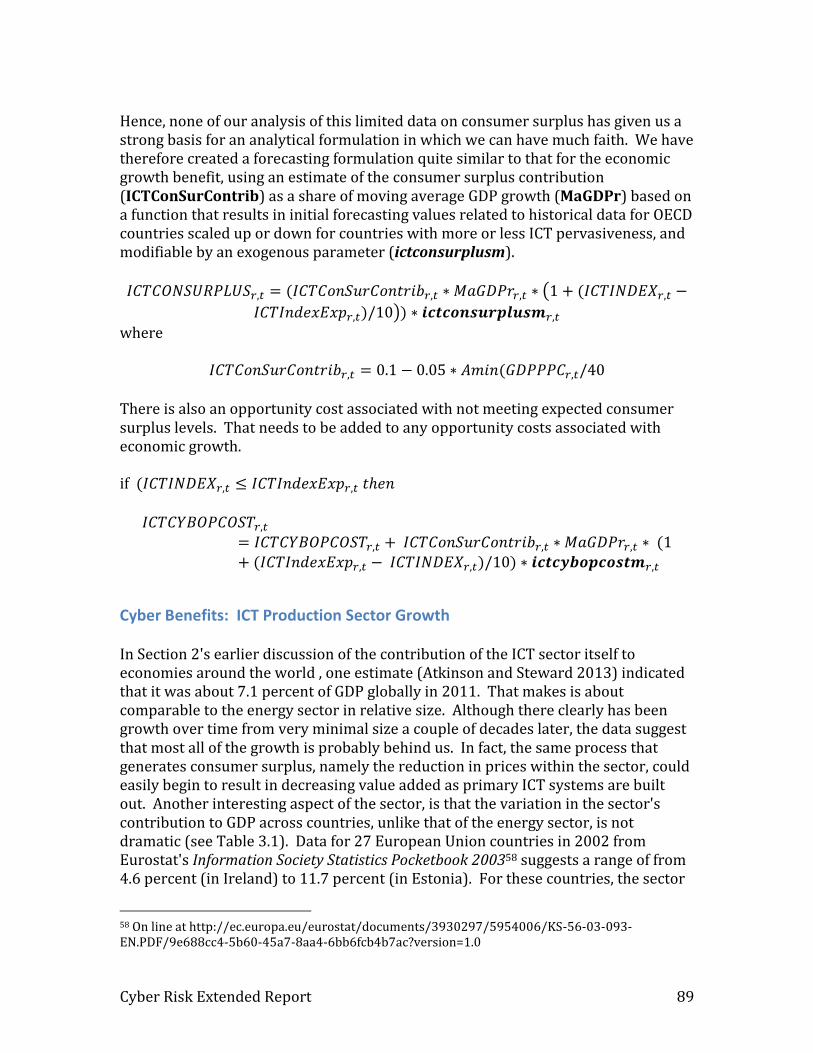
Cyber Risk Extended Report 89
Hence, none of our analysis of this limited data on consumer surplus has given us a strong basis for an analytical formulation in which we can have much faith. We have therefore created a forecasting formulation quite similar to that for the economic growth benefit, using an estimate of the consumer surplus contribution (ICTConSurContrib) as a share of moving average GDP growth (MaGDPr) based on a function that results in initial forecasting values related to historical data for OECD countries scaled up or down for countries with more or less ICT pervasiveness, and modifiable by an exogenous parameter (ictconsurplusm).
𝐼𝐶𝑇𝐶𝑂𝑁𝑆𝑈𝑅𝑃𝐿𝑈𝑆𝑟,𝑡 = (𝐼𝐶𝑇𝐶𝑜𝑛𝑆𝑢𝑟𝐶𝑜𝑛𝑡𝑟𝑖𝑏𝑟,𝑡 ∗ 𝑀𝑎𝐺𝐷𝑃𝑟𝑟,𝑡 ∗ (1 + (𝐼𝐶𝑇𝐼𝑁𝐷𝐸𝑋𝑟,𝑡 −
𝐼𝐶𝑇𝐼𝑛𝑑𝑒𝑥𝐸𝑥𝑝𝑟,𝑡)/10)) ∗ 𝒊𝒄𝒕𝒄𝒐𝒏𝒔𝒖𝒓𝒑𝒍𝒖𝒔𝒎𝑟,𝑡
where
𝐼𝐶𝑇𝐶𝑜𝑛𝑆𝑢𝑟𝐶𝑜𝑛𝑡𝑟𝑖𝑏𝑟,𝑡 = 0.1 − 0.05 ∗ 𝐴𝑚𝑖𝑛(𝐺𝐷𝑃𝑃𝑃𝐶𝑟,𝑡/40
There is also an opportunity cost associated with not meeting expected consumer surplus levels. That needs to be added to any opportunity costs associated with economic growth. if (𝐼𝐶𝑇𝐼𝑁𝐷𝐸𝑋𝑟,𝑡 ≤ 𝐼𝐶𝑇𝐼𝑛𝑑𝑒𝑥𝐸𝑥𝑝𝑟,𝑡 𝑡ℎ𝑒𝑛
𝐼𝐶𝑇𝐶𝑌𝐵𝑂𝑃𝐶𝑂𝑆𝑇𝑟,𝑡
= 𝐼𝐶𝑇𝐶𝑌𝐵𝑂𝑃𝐶𝑂𝑆𝑇𝑟,𝑡 + 𝐼𝐶𝑇𝐶𝑜𝑛𝑆𝑢𝑟𝐶𝑜𝑛𝑡𝑟𝑖𝑏𝑟,𝑡 ∗ 𝑀𝑎𝐺𝐷𝑃𝑟𝑟,𝑡 ∗ (1+ (𝐼𝐶𝑇𝐼𝑛𝑑𝑒𝑥𝐸𝑥𝑝𝑟,𝑡 − 𝐼𝐶𝑇𝐼𝑁𝐷𝐸𝑋𝑟,𝑡)/10) ∗ 𝒊𝒄𝒕𝒄𝒚𝒃𝒐𝒑𝒄𝒐𝒔𝒕𝒎𝑟,𝑡
Cyber Benefits: ICT Production Sector Growth In Section 2's earlier discussion of the contribution of the ICT sector itself to economies around the world , one estimate (Atkinson and Steward 2013) indicated that it was about 7.1 percent of GDP globally in 2011. That makes is about comparable to the energy sector in relative size. Although there clearly has been growth over time from very minimal size a couple of decades later, the data suggest that most all of the growth is probably behind us. In fact, the same process that generates consumer surplus, namely the reduction in prices within the sector, could easily begin to result in decreasing value added as primary ICT systems are built out. Another interesting aspect of the sector, is that the variation in the sector's contribution to GDP across countries, unlike that of the energy sector, is not dramatic (see Table 3.1). Data for 27 European Union countries in 2002 from Eurostat's Information Society Statistics Pocketbook 200358 suggests a range of from 4.6 percent (in Ireland) to 11.7 percent (in Estonia). For these countries, the sector
58 On line at http://ec.europa.eu/eurostat/documents/3930297/5954006/KS-56-03-093-EN.PDF/9e688cc4-5b60-45a7-8aa4-6bb6fcb4b7ac?version=1.0
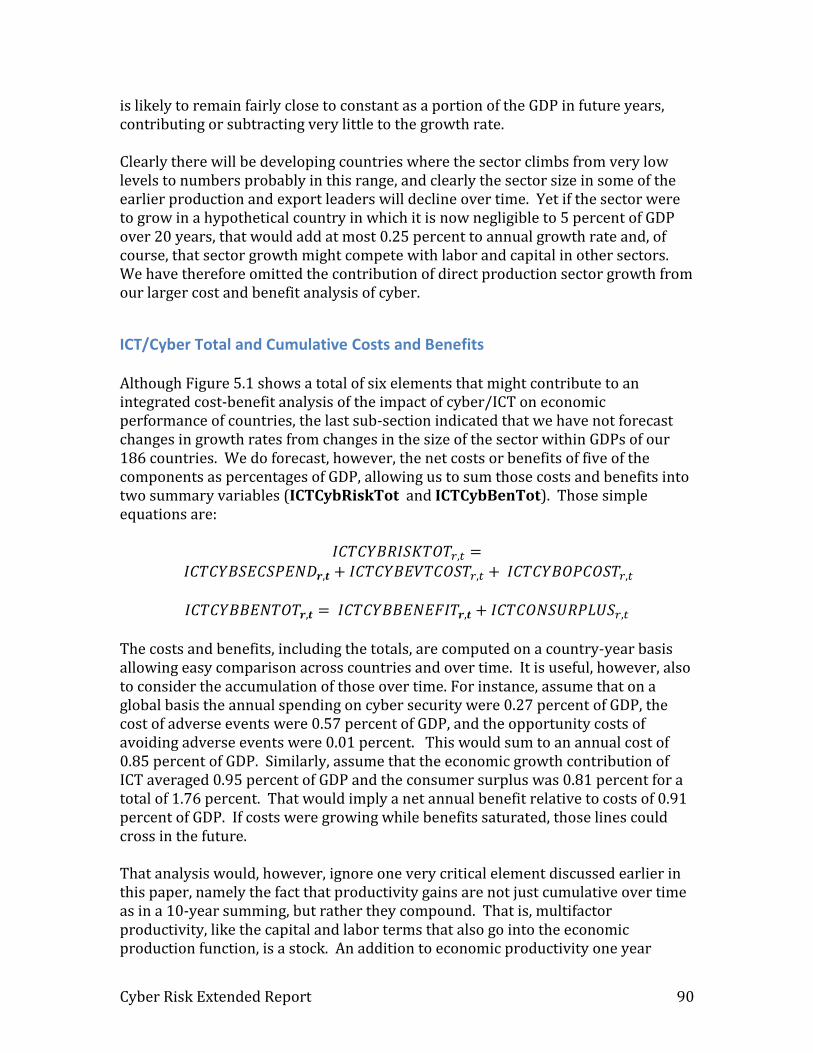
Cyber Risk Extended Report 90
is likely to remain fairly close to constant as a portion of the GDP in future years, contributing or subtracting very little to the growth rate. Clearly there will be developing countries where the sector climbs from very low levels to numbers probably in this range, and clearly the sector size in some of the earlier production and export leaders will decline over time. Yet if the sector were to grow in a hypothetical country in which it is now negligible to 5 percent of GDP over 20 years, that would add at most 0.25 percent to annual growth rate and, of course, that sector growth might compete with labor and capital in other sectors. We have therefore omitted the contribution of direct production sector growth from our larger cost and benefit analysis of cyber.
ICT/Cyber Total and Cumulative Costs and Benefits Although Figure 5.1 shows a total of six elements that might contribute to an integrated cost-benefit analysis of the impact of cyber/ICT on economic performance of countries, the last sub-section indicated that we have not forecast changes in growth rates from changes in the size of the sector within GDPs of our 186 countries. We do forecast, however, the net costs or benefits of five of the components as percentages of GDP, allowing us to sum those costs and benefits into two summary variables (ICTCybRiskTot and ICTCybBenTot). Those simple equations are:
𝐼𝐶𝑇𝐶𝑌𝐵𝑅𝐼𝑆𝐾𝑇𝑂𝑇𝑟,𝑡 =
𝐼𝐶𝑇𝐶𝑌𝐵𝑆𝐸𝐶𝑆𝑃𝐸𝑁𝐷𝒓,𝒕 + 𝐼𝐶𝑇𝐶𝑌𝐵𝐸𝑉𝑇𝐶𝑂𝑆𝑇𝑟,𝑡 + 𝐼𝐶𝑇𝐶𝑌𝐵𝑂𝑃𝐶𝑂𝑆𝑇𝑟,𝑡
𝐼𝐶𝑇𝐶𝑌𝐵𝐵𝐸𝑁𝑇𝑂𝑇𝒓,𝒕 = 𝐼𝐶𝑇𝐶𝑌𝐵𝐵𝐸𝑁𝐸𝐹𝐼𝑇𝒓,𝒕 + 𝐼𝐶𝑇𝐶𝑂𝑁𝑆𝑈𝑅𝑃𝐿𝑈𝑆𝑟,𝑡
The costs and benefits, including the totals, are computed on a country-year basis allowing easy comparison across countries and over time. It is useful, however, also to consider the accumulation of those over time. For instance, assume that on a global basis the annual spending on cyber security were 0.27 percent of GDP, the cost of adverse events were 0.57 percent of GDP, and the opportunity costs of avoiding adverse events were 0.01 percent. This would sum to an annual cost of 0.85 percent of GDP. Similarly, assume that the economic growth contribution of ICT averaged 0.95 percent of GDP and the consumer surplus was 0.81 percent for a total of 1.76 percent. That would imply a net annual benefit relative to costs of 0.91 percent of GDP. If costs were growing while benefits saturated, those lines could cross in the future. That analysis would, however, ignore one very critical element discussed earlier in this paper, namely the fact that productivity gains are not just cumulative over time as in a 10-year summing, but rather they compound. That is, multifactor productivity, like the capital and labor terms that also go into the economic production function, is a stock. An addition to economic productivity one year
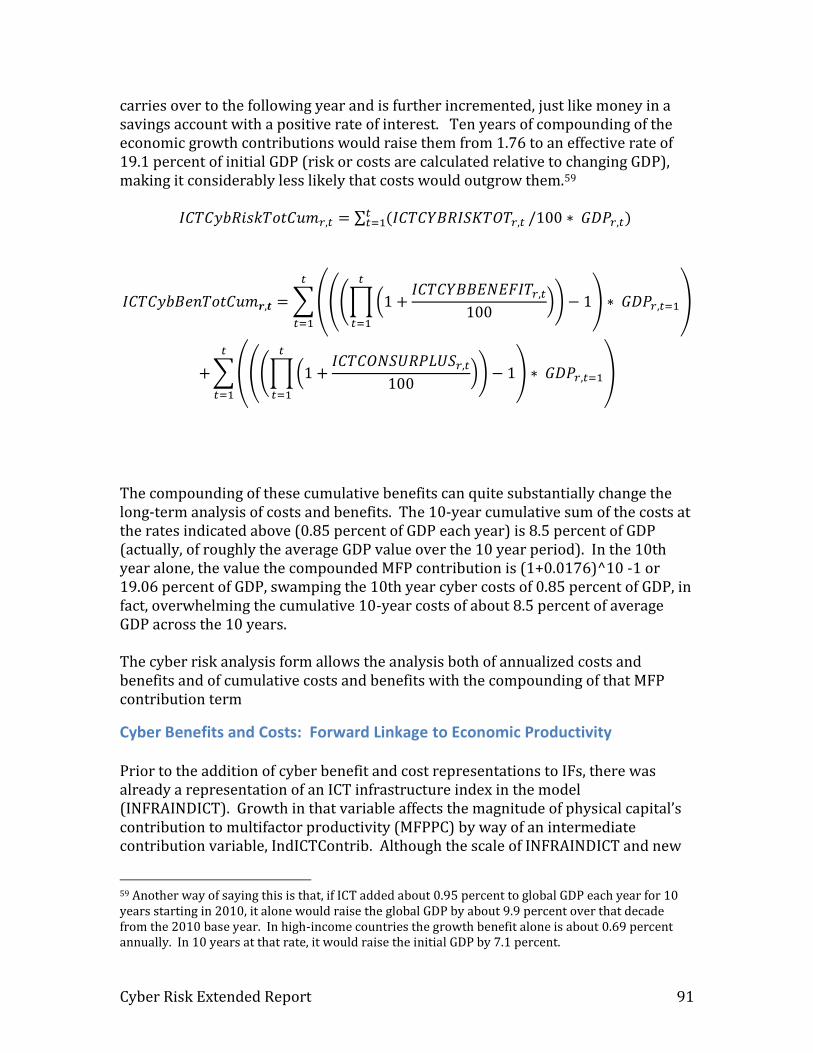
Cyber Risk Extended Report 91
carries over to the following year and is further incremented, just like money in a savings account with a positive rate of interest. Ten years of compounding of the economic growth contributions would raise them from 1.76 to an effective rate of 19.1 percent of initial GDP (risk or costs are calculated relative to changing GDP), making it considerably less likely that costs would outgrow them.59
𝐼𝐶𝑇𝐶𝑦𝑏𝑅𝑖𝑠𝑘𝑇𝑜𝑡𝐶𝑢𝑚𝑟,𝑡 = ∑ (𝐼𝐶𝑇𝐶𝑌𝐵𝑅𝐼𝑆𝐾𝑇𝑂𝑇𝑟,𝑡𝑡𝑡=1 /100 ∗ 𝐺𝐷𝑃𝑟,𝑡)
𝐼𝐶𝑇𝐶𝑦𝑏𝐵𝑒𝑛𝑇𝑜𝑡𝐶𝑢𝑚𝒓,𝒕 = ∑ (((∏ (1 +𝐼𝐶𝑇𝐶𝑌𝐵𝐵𝐸𝑁𝐸𝐹𝐼𝑇𝑟,𝑡
100)
𝑡
𝑡=1
) − 1) ∗ 𝐺𝐷𝑃𝑟,𝑡=1)
𝑡
𝑡=1
+ ∑ (((∏ (1 +𝐼𝐶𝑇𝐶𝑂𝑁𝑆𝑈𝑅𝑃𝐿𝑈𝑆𝑟,𝑡
100)
𝑡
𝑡=1
) − 1) ∗ 𝐺𝐷𝑃𝑟,𝑡=1)
𝑡
𝑡=1
The compounding of these cumulative benefits can quite substantially change the long-term analysis of costs and benefits. The 10-year cumulative sum of the costs at the rates indicated above (0.85 percent of GDP each year) is 8.5 percent of GDP (actually, of roughly the average GDP value over the 10 year period). In the 10th year alone, the value the compounded MFP contribution is (1+0.0176)^10 -1 or 19.06 percent of GDP, swamping the 10th year cyber costs of 0.85 percent of GDP, in fact, overwhelming the cumulative 10-year costs of about 8.5 percent of average GDP across the 10 years. The cyber risk analysis form allows the analysis both of annualized costs and benefits and of cumulative costs and benefits with the compounding of that MFP contribution term
Cyber Benefits and Costs: Forward Linkage to Economic Productivity Prior to the addition of cyber benefit and cost representations to IFs, there was already a representation of an ICT infrastructure index in the model (INFRAINDICT). Growth in that variable affects the magnitude of physical capital’s contribution to multifactor productivity (MFPPC) by way of an intermediate contribution variable, IndICTContrib. Although the scale of INFRAINDICT and new
59 Another way of saying this is that, if ICT added about 0.95 percent to global GDP each year for 10 years starting in 2010, it alone would raise the global GDP by about 9.9 percent over that decade from the 2010 base year. In high-income countries the growth benefit alone is about 0.69 percent annually. In 10 years at that rate, it would raise the initial GDP by 7.1 percent.
Cyber Risk Extended Report 92
the ICT index (ICTINDEX) are very different (the former is scaled nearly a factor of 10 higher), they grow globally in almost identical manner, saturating by 2050 in the Base Case scenario. For scenario analysis of the project, changes in ICTINDEX are introduced by way of its multiplicative parameter, ictindexm. Thus a simple way in which to pass through changes in ICTINDEX to MFP is simply to add changes in that multiplicative parameter to the formulation for the old index’s contribution to MFP.
𝐼𝑛𝑑𝐼𝐶𝑇𝐶𝑜𝑛𝑡𝑟𝑖𝑏𝑟,𝑡 = 𝐼𝑁𝐹𝑅𝐴𝐼𝑁𝐷𝐼𝐶𝑇𝒓,𝒕−𝟏 ∗ 𝒊𝒄𝒕𝒊𝒏𝒅𝒆𝒙𝒎𝑟,𝑡 − 𝐼𝑁𝐹𝑅𝐴𝐼𝑁𝐷𝐼𝐶𝑇𝒓,𝒕−𝟐 ∗𝒊𝒄𝒕𝒊𝒏𝒅𝒆𝒙𝒎𝑟,𝑡−1
This is second-best to switching the MFP contribution over to being directly driven by the new ICTINDEX, but it well serves the needs of the project analyzing cyber benefits and costs.
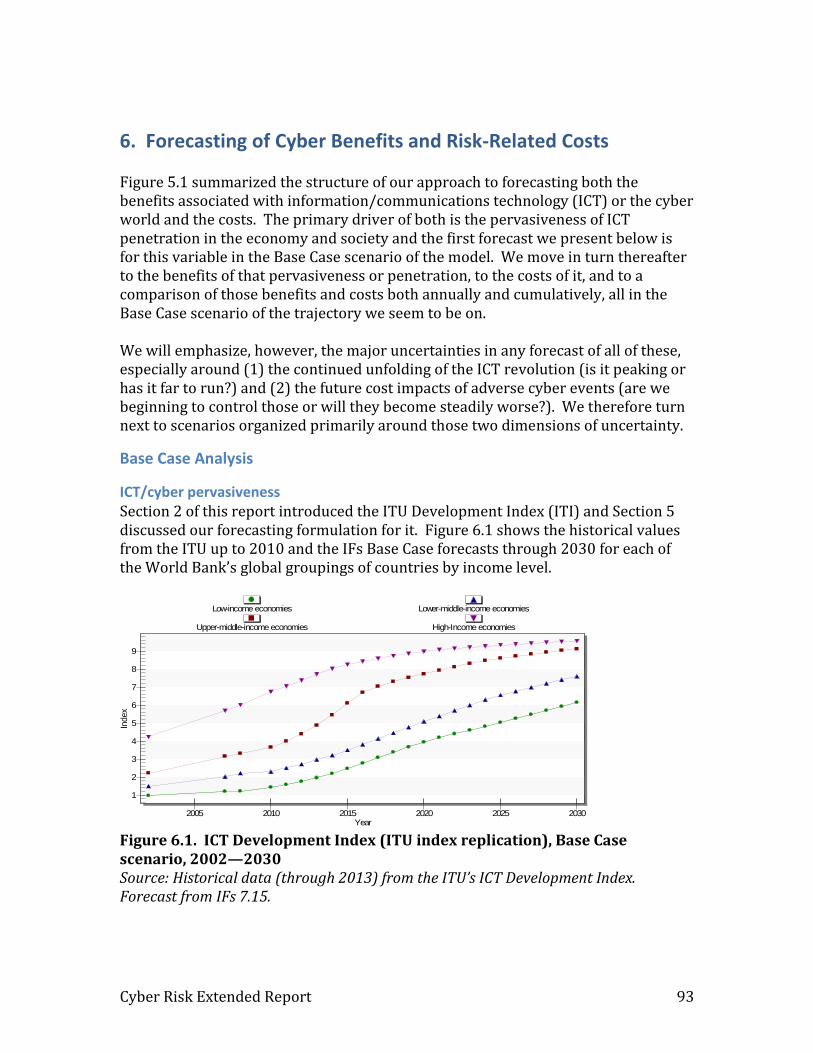
Cyber Risk Extended Report 93
6. Forecasting of Cyber Benefits and Risk-Related Costs Figure 5.1 summarized the structure of our approach to forecasting both the benefits associated with information/communications technology (ICT) or the cyber world and the costs. The primary driver of both is the pervasiveness of ICT penetration in the economy and society and the first forecast we present below is for this variable in the Base Case scenario of the model. We move in turn thereafter to the benefits of that pervasiveness or penetration, to the costs of it, and to a comparison of those benefits and costs both annually and cumulatively, all in the Base Case scenario of the trajectory we seem to be on. We will emphasize, however, the major uncertainties in any forecast of all of these, especially around (1) the continued unfolding of the ICT revolution (is it peaking or has it far to run?) and (2) the future cost impacts of adverse cyber events (are we beginning to control those or will they become steadily worse?). We therefore turn next to scenarios organized primarily around those two dimensions of uncertainty.
Base Case Analysis
ICT/cyber pervasiveness Section 2 of this report introduced the ITU Development Index (ITI) and Section 5 discussed our forecasting formulation for it. Figure 6.1 shows the historical values from the ITU up to 2010 and the IFs Base Case forecasts through 2030 for each of the World Bank’s global groupings of countries by income level.
Figure 6.1. ICT Development Index (ITU index replication), Base Case scenario, 2002—2030 Source: Historical data (through 2013) from the ITU’s ICT Development Index. Forecast from IFs 7.15.
1
2
3
4
5
6
7
8
9
Index
Year2005 2010 2015 2020 2025 2030
Low-income economies Lower-middle-income economies
Upper-middle-income economies High-Income economies

Cyber Risk Extended Report 94
The figure suggests two phenomena. First, there is ongoing convergence of ICT in the economies and societies of countries across income levels, and especially notable is the near catching up of upper-middle-income countries (like China and Brazil) with high-income ones. Second, and more controversial is the saturation apparent in the index for both high-income and upper-middle-income countries. The basis for that is the strong tie of the index to the rolling out of mobile broadband access and the inherent saturation of that as penetration nears universality. As indicated earlier, it is easy to conceptualize future waves of ICT/cyber involving higher speeds, more extensive cloud usage, the internet of everything, and artificial intelligence applications that postpone that saturation and potentially even convert the pattern to an exponentially increasing one. There can be little doubt that the Base Case of IFs on this issue should be recognized to be on the conservative side of the dimension of uncertainty that ranges from near-term saturation to very long-term and aggressive advance in pervasiveness.
ICT/cyber benefits In earlier discussion of Section 3 we indicated that the overall size of the ICT sector globally had likely reached a roughly stable share of the GDP. Thus growth of that sector is unlikely to contribute much to economic growth rates of the average economy (it will increase in some countries and decrease in others). Instead we look here at the contributions of ICT to economic growth via capital services and MFP contribution and at its contribution to consumer surplus.

Cyber Risk Extended Report 95
Figure 6.2 shows the percentage point contribution of ICT to economic growth. Again, two conclusions are apparent: (1) the annual growth contribution is considerably higher in developing economies than in high-income ones and has grown very rapidly in those countries over the last decade; (2) the contributions in most societies is likely to erode over time because of the increasing saturation of ICT pervasiveness and as lower-income countries catch-up with higher-income ones both in ICT and in GDP per capita.
Figure 6.2. ICT cyber benefit, annual boost to GDP growth, 1990—2030 Note: Using simple average of country values because a few large GDP countries in grouping (e.g. China) can otherwise distort. Using 5-year moving average. Historical data (through 2012) are from Conference Board (2014a and 2014b). The biggest discrepancy between historical data and forecasts are for lower-middle-income countries and our forecast may underestimate the future contribution there but recent years may well be a temporary bubble of growth contribution; globally there is strong history-forecast continuity. Source: Historical data (through 2010) from The Conference Board Total Economy Database, Contribution of ICT Capital Services to GDP Growth, 2014, available at: https://www.conference-board.org/data/economydatabase/index.cfm?id=27762. Forecast from IFs 7.15.
0.5
1.0
1.5
2.0
Perc
ent
Year1990 1995 2000 2005 2010 2015 2020 2025 2030
High-income countries Upper-middle-income countries
Lower-middle-income countries Low-income countries
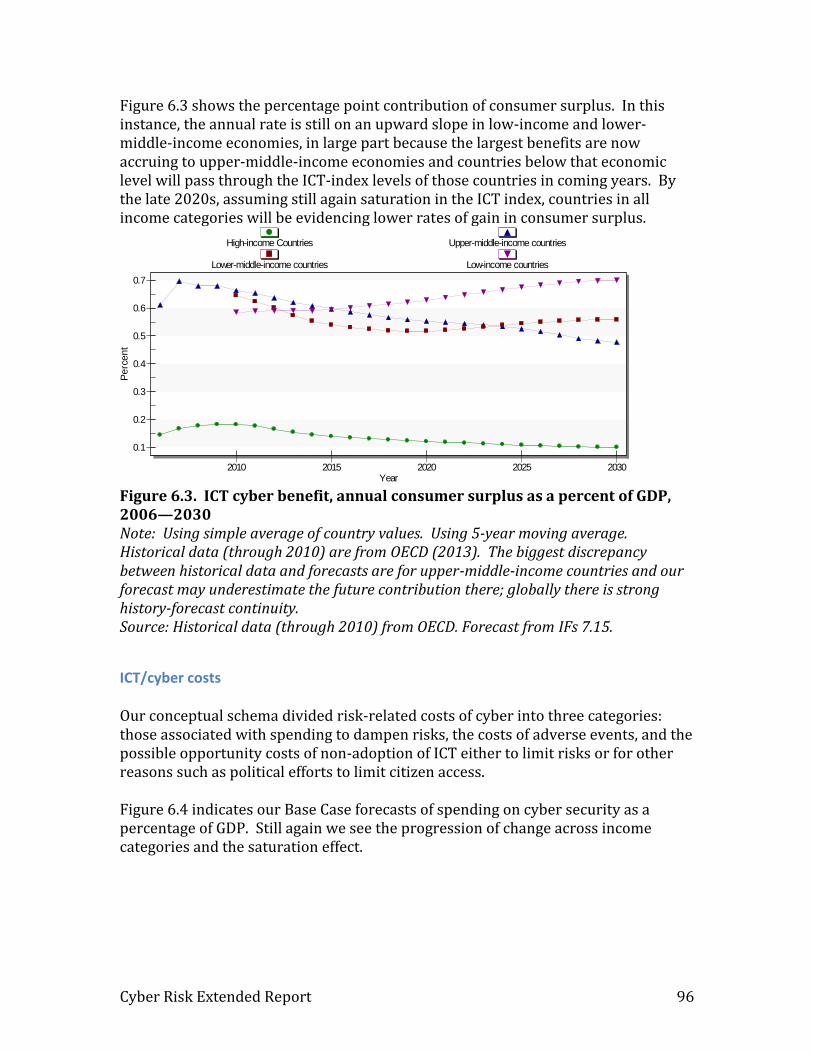
Cyber Risk Extended Report 96
Figure 6.3 shows the percentage point contribution of consumer surplus. In this instance, the annual rate is still on an upward slope in low-income and lower-middle-income economies, in large part because the largest benefits are now accruing to upper-middle-income economies and countries below that economic level will pass through the ICT-index levels of those countries in coming years. By the late 2020s, assuming still again saturation in the ICT index, countries in all income categories will be evidencing lower rates of gain in consumer surplus.
Figure 6.3. ICT cyber benefit, annual consumer surplus as a percent of GDP, 2006—2030 Note: Using simple average of country values. Using 5-year moving average. Historical data (through 2010) are from OECD (2013). The biggest discrepancy between historical data and forecasts are for upper-middle-income countries and our forecast may underestimate the future contribution there; globally there is strong history-forecast continuity. Source: Historical data (through 2010) from OECD. Forecast from IFs 7.15.
ICT/cyber costs Our conceptual schema divided risk-related costs of cyber into three categories: those associated with spending to dampen risks, the costs of adverse events, and the possible opportunity costs of non-adoption of ICT either to limit risks or for other reasons such as political efforts to limit citizen access. Figure 6.4 indicates our Base Case forecasts of spending on cyber security as a percentage of GDP. Still again we see the progression of change across income categories and the saturation effect.
0.1
0.2
0.3
0.4
0.5
0.6
0.7
Pe
rce
nt
Year2010 2015 2020 2025 2030
High-income Countries Upper-middle-income countries
Lower-middle-income countries Low-income countries

Cyber Risk Extended Report 97
Figure 6.4. ICT security spending as percent of GDP, 2010—2030 Note: Using simple average of country values. There are inadequate historical data to allow comparison of our early forecast values with recent historical ones. Source: IFs 7.15.
In dollar terms, the global value for 2015 is almost exactly $250 billion ($2011). This is lower that some of the estimates we saw earlier in Section 4, especially the highly criticized $1 trillion estimate of McAfee. By 2030 our estimate in constant dollars reaches nearly $0.5 trillion (see Figure 6.5).
Figure 6.5. ICT security spending in billion $US 2011 dollars, 2010—2030 Source: IFs 7.15.
0.05
0.10
0.15
0.20
0.25
0.30
0.35
Per
cent
Year
20102011
20122013
20142015
20162017
20182019
20202021
20222023
20242025
20262027
20282029
2030
Low-Income Economies Lower-Middle-Income Economies
Upper-Middle-Income Economies High-Income Economies
0
100
200
300
400
500
Billio
n D
olla
rs
Year
20102011
20122013
20142015
20162017
20182019
20202021
20222023
20242025
20262027
20282029
2030
Low-income countries Lower-middle-income countries Upper-middle-income countries
High-income countries World

Cyber Risk Extended Report 98
All else being equal (the common assumption, of course, in all modeling formulations), an increase in cyber spending should result in an increase in cyber security. Figure 6.6 shows the Base Case forecasts of our cyber security index, which responds to ICT pervasiveness and spending levels and therefore demonstrates a similar pattern of behavior.
Figure 6.6. ICT Security Index (ITU index replication), 2010—2030 Source: IFs 7.15.
0.1
0.2
0.3
0.4
0.5
0.6
Inde
x
Year
20102011
20122013
20142015
20162017
20182019
20202021
20222023
20242025
20262027
20282029
2030
Low-Income Economies Lower-Middle-Income Economies
Upper-Middle-Income Economiess High-Income Economies
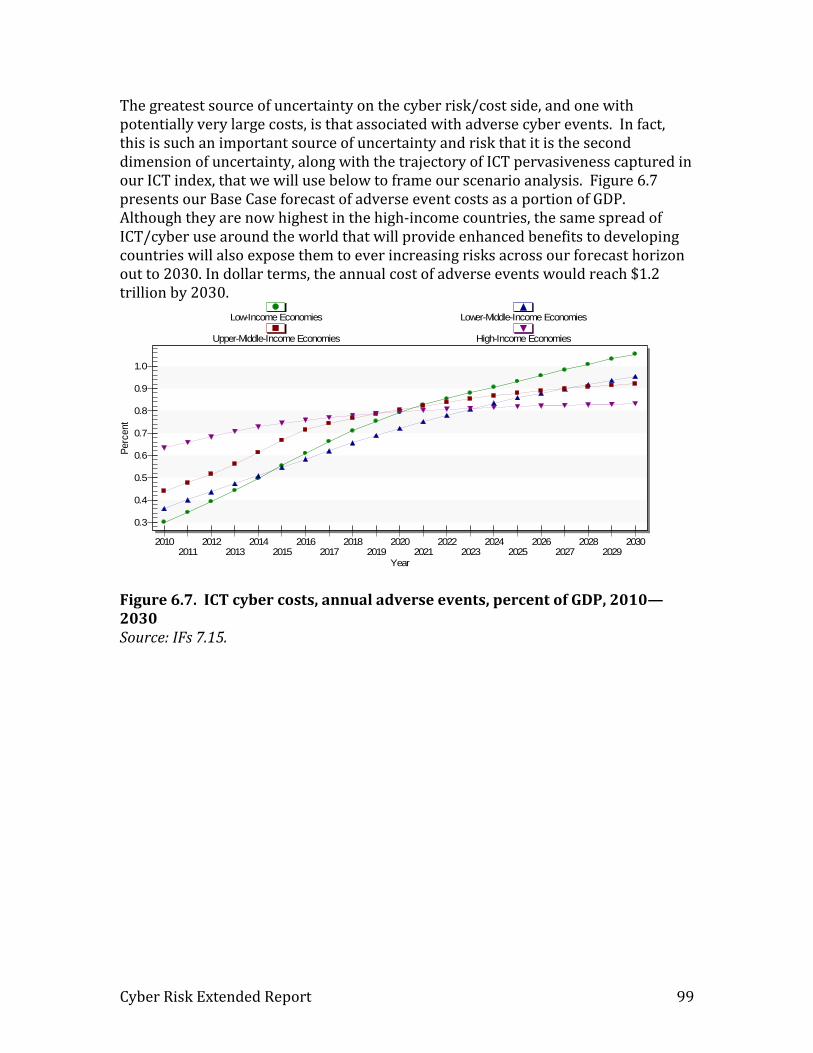
Cyber Risk Extended Report 99
The greatest source of uncertainty on the cyber risk/cost side, and one with potentially very large costs, is that associated with adverse cyber events. In fact, this is such an important source of uncertainty and risk that it is the second dimension of uncertainty, along with the trajectory of ICT pervasiveness captured in our ICT index, that we will use below to frame our scenario analysis. Figure 6.7 presents our Base Case forecast of adverse event costs as a portion of GDP. Although they are now highest in the high-income countries, the same spread of ICT/cyber use around the world that will provide enhanced benefits to developing countries will also expose them to ever increasing risks across our forecast horizon out to 2030. In dollar terms, the annual cost of adverse events would reach $1.2 trillion by 2030.
Figure 6.7. ICT cyber costs, annual adverse events, percent of GDP, 2010—2030 Source: IFs 7.15.
0.3
0.4
0.5
0.6
0.7
0.8
0.9
1.0
Perc
ent
Year
20102011
20122013
20142015
20162017
20182019
20202021
20222023
20242025
20262027
20282029
2030
Low-Income Economies Lower-Middle-Income Economies
Upper-Middle-Income Economies High-Income Economies

Cyber Risk Extended Report 100
The final cost term is that of opportunity costs (see Figure 6.8). Again, that is associated with under-usage of ICT, probably more common today for political control reasons, but potentially more common in future scenarios as a way of limiting adverse event costs. Note that the scale for display of these indicates a maximum of less than 0.2 percent of GDP for lower-middle-income countries, making it a much less significant cost for most countries and regions than security spending, much less adverse event costs. It appears that lower-middle-income countries bear the largest level of such costs, followed by upper-middle-income countries. Because these are the countries typically undergoing the most challenging socio-political transitions, that is not surprising.
Figure 6.8. ICT cyber costs, annual opportunity costs, percent of GDP, 2010—2030 Source: IFs 7.15.
Comparing cyber benefits and costs Looking first at all annual benefits and costs globally, Figure 6.9 sums those across each of the individual benefit and cost categories. Strikingly, it suggests that the fairly steady rise of cyber costs associated with security spending and adverse events, in combination with the fall of benefits as at least this wave of cyber technologies (especially broadband penetration) has been playing out, may in fact have taken us to a critically important point in time where the two curves may be near to crossing over each other. We must jump quickly to the very obvious caveat: both data and forecasting formulations include a great many estimates and guesses. The exact year of such a cross-over and whether it will even occur is highly uncertain, and our finding of it in the 2018-2020 period, after building all of the costs and benefit terms up individually, must be understood to be highly tentative.
0
0.02
0.04
0.06
0.08
0.10
0.12
0.14
0.16
0.18
Perc
ent
Year
20102011
20122013
20142015
20162017
20182019
20202021
20222023
20242025
20262027
20282029
2030
Low-income economies Lower-middle-income economies
Upper-middle-income economies High-income economies

Cyber Risk Extended Report 101
Figure 6.9. ICT cyber costs and benefits, global annual totals, percent of GDP, 2010—2030 Note: Using 5-year moving average.
Source: IFs 7.15. In Figure 6.10 there is great variation of those patterns across country income groupings. The cross-over point appears to have happened already for high-income countries, likely to be approaching for middle-income countries by 2030, and unlikely to be near for low-income countries even by 2030. Figure 6.11 elaborates the regions other than high-income countries (mostly those of the North Atlantic).
0.90
0.95
1.00
1.05
1.10
1.15
1.20
1.25
1.30P
erc
ent of G
DP
Year
20102011
20122013
20142015
20162017
20182019
20202021
20222023
20242025
20262027
20282029
2030
Benefits Costs
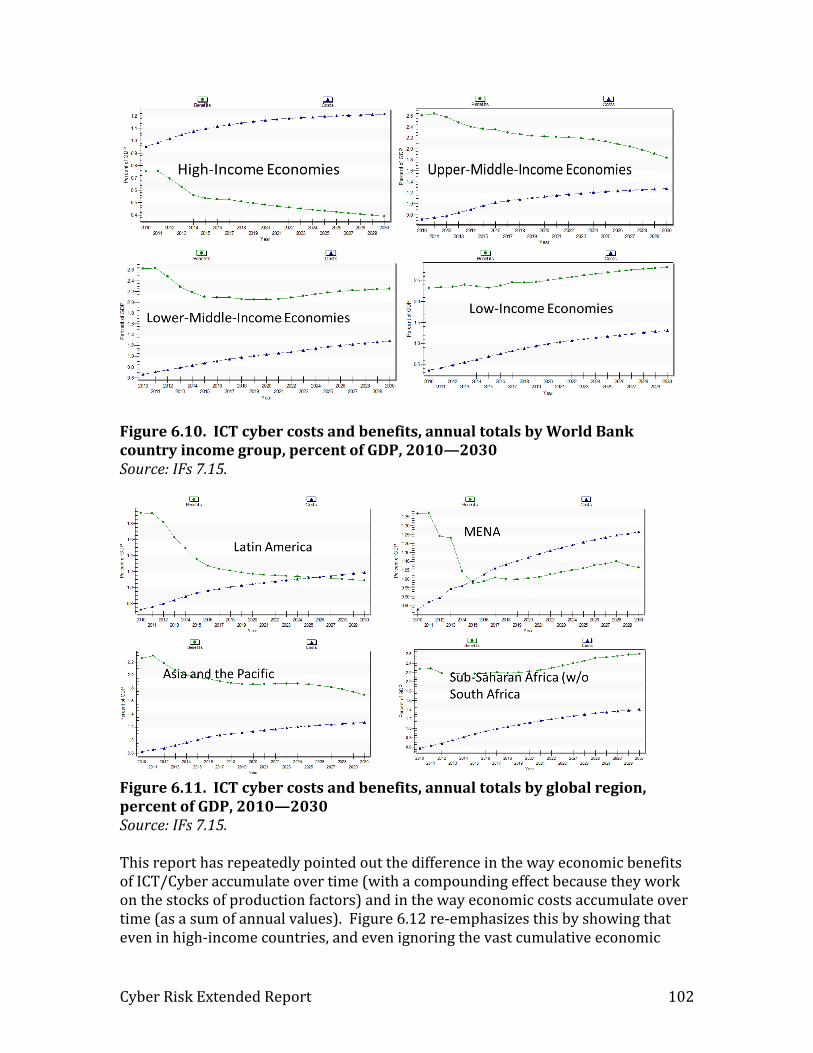
Cyber Risk Extended Report 102
Figure 6.10. ICT cyber costs and benefits, annual totals by World Bank country income group, percent of GDP, 2010—2030 Source: IFs 7.15.
Figure 6.11. ICT cyber costs and benefits, annual totals by global region, percent of GDP, 2010—2030 Source: IFs 7.15. This report has repeatedly pointed out the difference in the way economic benefits of ICT/Cyber accumulate over time (with a compounding effect because they work on the stocks of production factors) and in the way economic costs accumulate over time (as a sum of annual values). Figure 6.12 re-emphasizes this by showing that even in high-income countries, and even ignoring the vast cumulative economic

Cyber Risk Extended Report 103
benefits of ICT in recent decades, the cumulative benefit will continue to outstrip cumulative costs even by 2030, rising in fact to about 60 trillion dollars of net benefit. On a global level the benefits between 2010 and 2030 would be about 170 trillion dollars versus costs of 23 trillion. Those costs are huge and demand our attention, but benefits still dwarf them.
Figure 6.12. ICT cyber costs and benefits, cumulative values for high-income countries, in billions of $US 2011 dollars, 2010—2030 Source: IFs 7.15.
To this point in this section we have repeatedly noted that the focus has been on the Base Case scenario of IFs, the way in which things appear to be unfolding. It is time to turn to an exploration of alternative possible futures.
Scenarios of Cyber Benefits and Costs: Foundational Analysis There are two primary uncertainties concerning the future of benefits and costs associated with cyber/ICT that this report has repeatedly emphasized. The first is concerns the future unfolding of the technology and its potential pervasiveness (and associated benefits). Although our Base Case scenario has built in a continuation of the saturating ICT index that we have taken from ITU data, we have often noted that the index is heavily influenced by what may actually be an ICT sub-wave associated with the expansion in recent years of access to broadband, especially mobile broadband. An alternative assumption is that this sub-wave will be superseded by further waves around cloud computing and storage, the internet of everything, and artificial intelligence. Figure 6.13 shows only one possible pattern for the future of the index.
0
10,000
20,000
30,000
40,000
50,000
60,000
Billion D
ollar
Year
20102011
20122013
20142015
20162017
20182019
20202021
20222023
20242025
20262027
20282029
2030
Cumulative Benefits (Compounded) Cumulative Costs (Additive)

Cyber Risk Extended Report 104
Figure 6.13. ICT Development Index (ITU index replication), Base Case scenario and Rapid Cyber/ICT Development intervention, 2002—2030 Source: Historical data (through 2014 from ITU). Forecast from IFs 7.15. The other key uncertainty is around the future probability and costs of adverse events, with associated balance of strength between defensive forces and offensive forces in limiting or increasing those costs. In this category, the biggest unknown is the extent to which actors, especially but not exclusively national governments, might engage aggressively in cyber terrorism or warfare. Figure 6.14 suggests an extreme situation of a step-jump in such activity from current levels that most observers have characterized as nil or very low, to a level that would cost countries about 1 percent of GDP each year on top of other kinds of adverse events. (This was introduced globally, but would likely affect major powers and superpowers substantially more than secondary actors on the world stage).
2
4
6
8
10
12
14
16
Index
Year2005 2010 2015 2020 2025 2030
Base Case Rapid Cyber/ICT Development
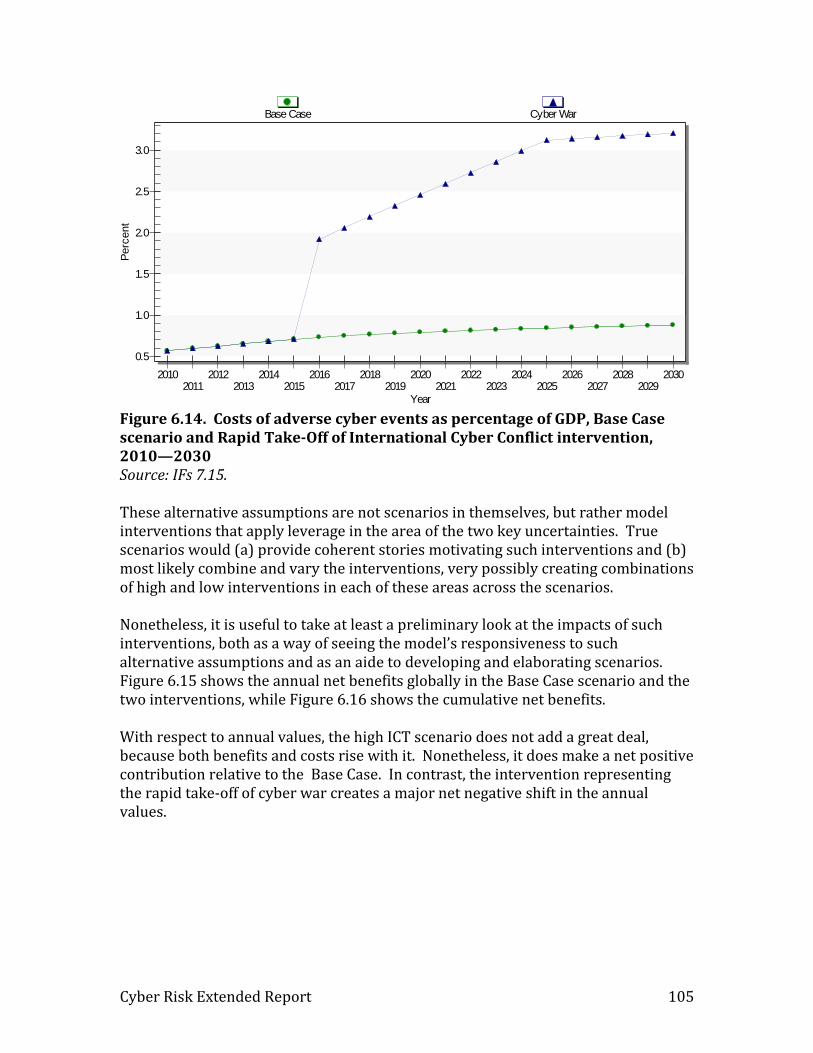
Cyber Risk Extended Report 105
Figure 6.14. Costs of adverse cyber events as percentage of GDP, Base Case scenario and Rapid Take-Off of International Cyber Conflict intervention, 2010—2030 Source: IFs 7.15. These alternative assumptions are not scenarios in themselves, but rather model interventions that apply leverage in the area of the two key uncertainties. True scenarios would (a) provide coherent stories motivating such interventions and (b) most likely combine and vary the interventions, very possibly creating combinations of high and low interventions in each of these areas across the scenarios. Nonetheless, it is useful to take at least a preliminary look at the impacts of such interventions, both as a way of seeing the model’s responsiveness to such alternative assumptions and as an aide to developing and elaborating scenarios. Figure 6.15 shows the annual net benefits globally in the Base Case scenario and the two interventions, while Figure 6.16 shows the cumulative net benefits. With respect to annual values, the high ICT scenario does not add a great deal, because both benefits and costs rise with it. Nonetheless, it does make a net positive contribution relative to the Base Case. In contrast, the intervention representing the rapid take-off of cyber war creates a major net negative shift in the annual values.
0.5
1.0
1.5
2.0
2.5
3.0
Perc
ent
Year
20102011
20122013
20142015
20162017
20182019
20202021
20222023
20242025
20262027
20282029
2030
Base Case Cyber War
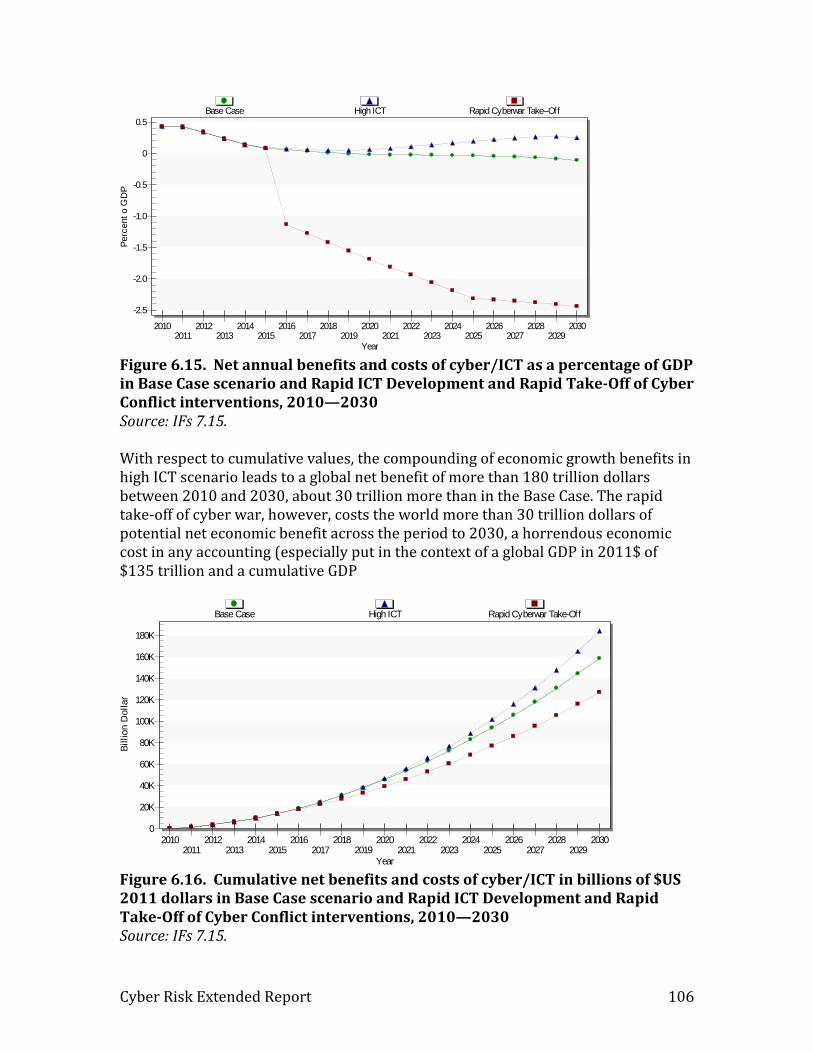
Cyber Risk Extended Report 106
Figure 6.15. Net annual benefits and costs of cyber/ICT as a percentage of GDP in Base Case scenario and Rapid ICT Development and Rapid Take-Off of Cyber Conflict interventions, 2010—2030 Source: IFs 7.15. With respect to cumulative values, the compounding of economic growth benefits in high ICT scenario leads to a global net benefit of more than 180 trillion dollars between 2010 and 2030, about 30 trillion more than in the Base Case. The rapid take-off of cyber war, however, costs the world more than 30 trillion dollars of potential net economic benefit across the period to 2030, a horrendous economic cost in any accounting (especially put in the context of a global GDP in 2011$ of $135 trillion and a cumulative GDP
Figure 6.16. Cumulative net benefits and costs of cyber/ICT in billions of $US 2011 dollars in Base Case scenario and Rapid ICT Development and Rapid Take-Off of Cyber Conflict interventions, 2010—2030 Source: IFs 7.15.
-2.5
-2.0
-1.5
-1.0
-0.5
0
0.5P
erc
ent o G
DP
Year
20102011
20122013
20142015
20162017
20182019
20202021
20222023
20242025
20262027
20282029
2030
Base Case High ICT Rapid Cyberwar Take--Off
0
20K
40K
60K
80K
100K
120K
140K
160K
180K
Billion D
ollar
Year
20102011
20122013
20142015
20162017
20182019
20202021
20222023
20242025
20262027
20282029
2030
Base Case High ICT Rapid Cyberwar Take-Off
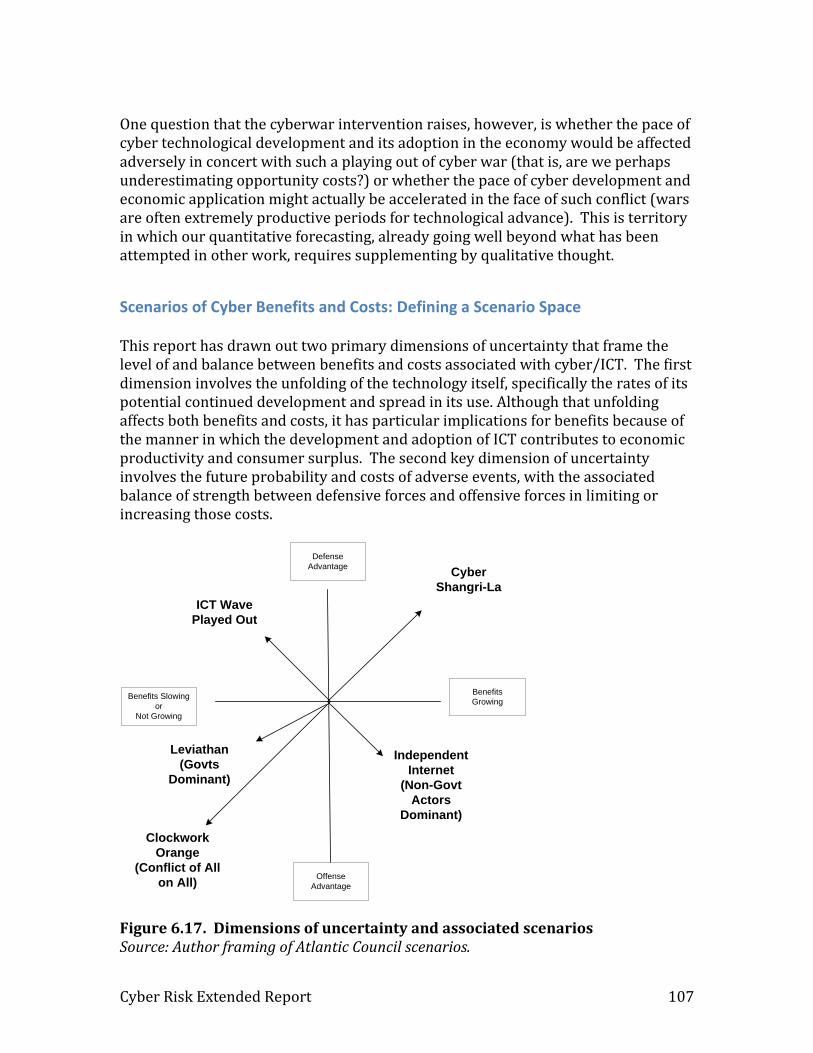
Cyber Risk Extended Report 107
One question that the cyberwar intervention raises, however, is whether the pace of cyber technological development and its adoption in the economy would be affected adversely in concert with such a playing out of cyber war (that is, are we perhaps underestimating opportunity costs?) or whether the pace of cyber development and economic application might actually be accelerated in the face of such conflict (wars are often extremely productive periods for technological advance). This is territory in which our quantitative forecasting, already going well beyond what has been attempted in other work, requires supplementing by qualitative thought.
Scenarios of Cyber Benefits and Costs: Defining a Scenario Space This report has drawn out two primary dimensions of uncertainty that frame the level of and balance between benefits and costs associated with cyber/ICT. The first dimension involves the unfolding of the technology itself, specifically the rates of its potential continued development and spread in its use. Although that unfolding affects both benefits and costs, it has particular implications for benefits because of the manner in which the development and adoption of ICT contributes to economic productivity and consumer surplus. The second key dimension of uncertainty involves the future probability and costs of adverse events, with the associated balance of strength between defensive forces and offensive forces in limiting or increasing those costs.
Defense
AdvantageCyber
Shangri-La
Offense
Advantage
Benefits Slowing
or
Not Growing
Benefits
Growing
Leviathan
(Govts
Dominant)
Clockwork
Orange
(Conflict of All
on All)
ICT Wave
Played Out
Independent
Internet
(Non-Govt
Actors
Dominant)
Figure 6.17. Dimensions of uncertainty and associated scenarios Source: Author framing of Atlantic Council scenarios.

Cyber Risk Extended Report 108
Figure 6.17 illustrates the manner in which the two dimensions frame a scenario space in interaction with an elaboration of the roles that key actors may play across that space. Governments may decide increasingly to assert themselves and at least attempt to control the cyber sphere. Such action would likely at least initially focus on defense of the cyber world and its contributions to economic growth and consumer surplus. Specific actions would likely include (1) setting up barriers against outside actors that might seek to disrupt those benefits for particular countries or groupings of countries and (2) highly regulating actions by organizations and individuals that internationally or domestically may seek private benefits at the expense of others through activities such cybercrime. It is highly likely that such barriers and regulations would slow the growth of benefits. Moreover, the involvement of governments and the creation of geographic divisions of the cyber world sharply raises the probability that governments would become offensive actors with respect not just to malicious organizations and individuals but also against other governments in an escalating action-reaction dynamic. From this the Leviathans emerge. Governments may, however, also deem it not desirable to pursue such control or may find it impossible to do so. Instead, independent actors may reign supreme and aggressively push forward the technology, its adoption, and its benefits in the economy. If they do, there clearly will be continuing efforts to defend cyberspace, but the inherent advantages of offense in finding weaknesses could well continue to grow relative to the ability of defensive users to protect against all avenues of attack. The Independent Internet thus occupies the lower right quadrant of Figure 6.17. Of course, the possibility exists that governments would not abandon their efforts at control even as independent actors pursued their own. This would likely encourage increasing aggressiveness and hostility among governments and between them and a huge range of organizations including those adopting terrorist techniques. This war of all-on-all is the Clockwork Orange scenario and would inevitably slow benefit growth even while offensive forces continually grew in strength. At the other extreme, it is very conceivable that the growing criticality of the cyber world across all economic and social sectors would provide the incentives for governments and at least the strongest of social actors (including corporations) to cooperate. They would do so both in building the cyber sphere and its benefits and in creating defensive structures along with redundancies and recovery capabilities that effectively reduce offensive actions to continued harassment with controlled and even reduced consequence. This is Cyber Shangri-La. Some have argued that the creation of the mobile broadband is the last major cyber development. Thus the ICT wave will soon play out, allowing stabilization of the cyber world and allowing defensive forces to catch up with and control offensive ones. This report has repeatedly suggested, however, that mobile broadband is much more likely one sub-wave among many that will crash against the shoreline of
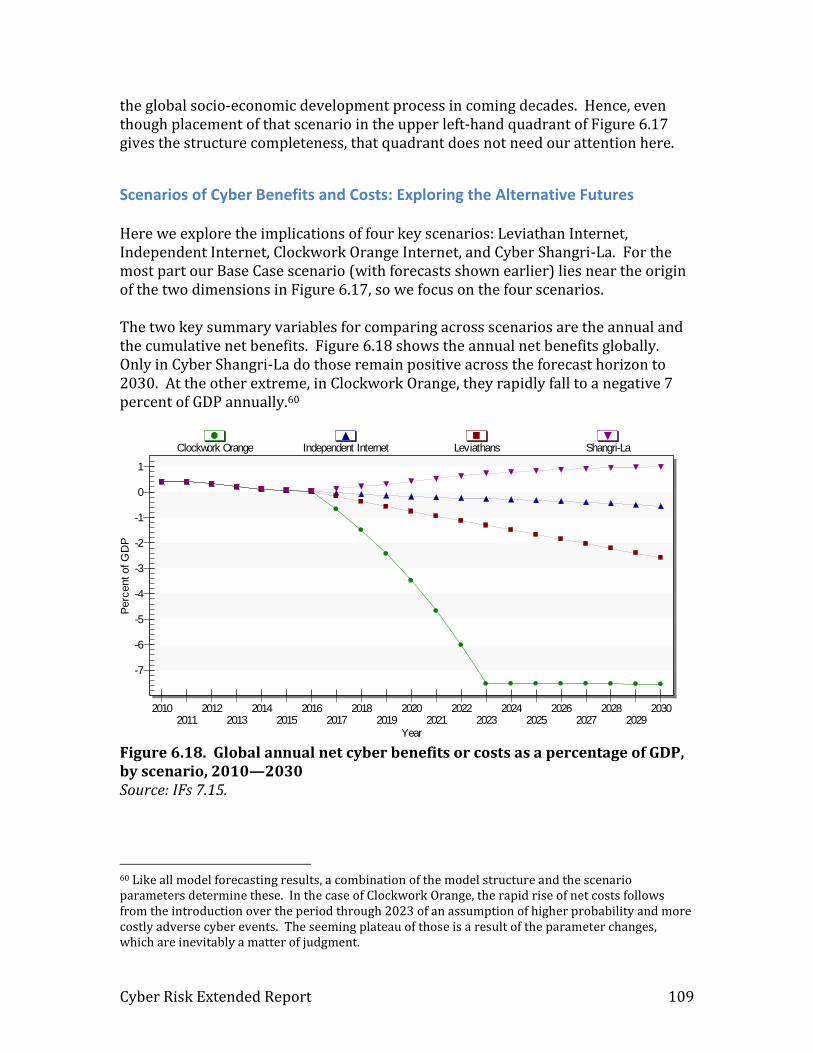
Cyber Risk Extended Report 109
the global socio-economic development process in coming decades. Hence, even though placement of that scenario in the upper left-hand quadrant of Figure 6.17 gives the structure completeness, that quadrant does not need our attention here.
Scenarios of Cyber Benefits and Costs: Exploring the Alternative Futures Here we explore the implications of four key scenarios: Leviathan Internet, Independent Internet, Clockwork Orange Internet, and Cyber Shangri-La. For the most part our Base Case scenario (with forecasts shown earlier) lies near the origin of the two dimensions in Figure 6.17, so we focus on the four scenarios. The two key summary variables for comparing across scenarios are the annual and the cumulative net benefits. Figure 6.18 shows the annual net benefits globally. Only in Cyber Shangri-La do those remain positive across the forecast horizon to 2030. At the other extreme, in Clockwork Orange, they rapidly fall to a negative 7 percent of GDP annually.60
Figure 6.18. Global annual net cyber benefits or costs as a percentage of GDP, by scenario, 2010—2030 Source: IFs 7.15.
60 Like all model forecasting results, a combination of the model structure and the scenario parameters determine these. In the case of Clockwork Orange, the rapid rise of net costs follows from the introduction over the period through 2023 of an assumption of higher probability and more costly adverse cyber events. The seeming plateau of those is a result of the parameter changes, which are inevitably a matter of judgment.
-7
-6
-5
-4
-3
-2
-1
0
1
Perc
ent of G
DP
Year
20102011
20122013
20142015
20162017
20182019
20202021
20222023
20242025
20262027
20282029
2030
Clockwork Orange Independent Internet Leviathans Shangri-La

Cyber Risk Extended Report 110
The picture varies quite a lot across country income levels as well as across scenarios. Figure 6.19 shows the pattern across global income levels in the Independent Internet scenario. Already in 2010 the annual costs outweigh benefits for the High-income countries, and the gap grows over time. In sharp contrast, all developing regions have net benefits near 2 percent of GDP initially, and those for Low-income countries continue to be substantial over the entire horizon as those for middle-income countries erode.
Figure 6.19. Annual net cyber benefits or costs as percentage of GDP: income-level variation in the Independent Internet scenario, 2010—2030 Source: IFs 7.15.
-1.5
-1.0
-0.5
0
0.5
1.0
1.5
2.0
Perc
ent of G
DP
Year2010 2015 2020 2025 2030
Low-income countries Lower-middle-income countries
Upper-middle-income countries High-income countries

Cyber Risk Extended Report 111
Similarly, the annual net benefits vary greatly by geographic region in the Shangri-La scenario, which causes them generally to rise over time rather than fall. Although East Asia and the Pacific reap the greatest benefits in 2010, by 2030 those accrue to South Asia and sub-Saharan Africa.
Figure 6.20. Annual net cyber benefits or costs as percentage of GDP: developing region variation in the Cyber Shangri-La scenario, 2010—2030 Source: IFs 7.15.
0
0.5
1.0
1.5
2.0
2.5
3.0
3.5
Perc
ent of G
DP
Year2010 2015 2020 2025 2030
East Asia and Pacif ic Europe and Central Asia Latin America and the Caribbean
Middle East and North Africa South Asia Sub-Saharan Africa
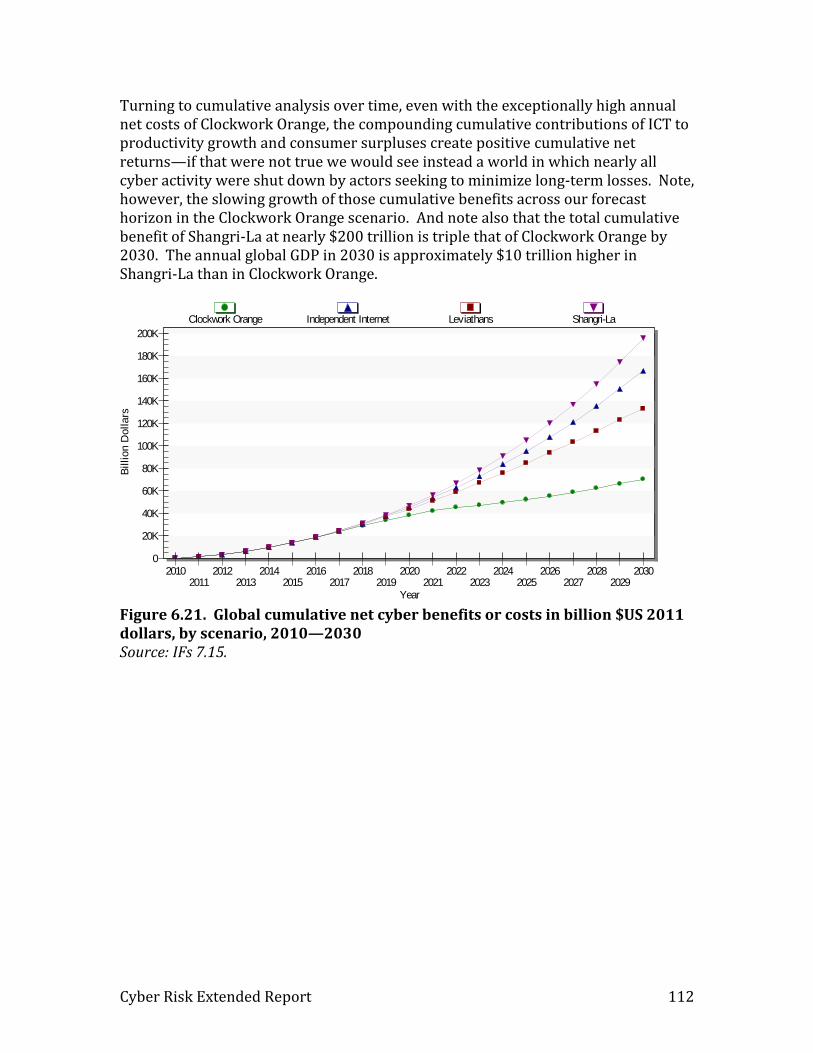
Cyber Risk Extended Report 112
Turning to cumulative analysis over time, even with the exceptionally high annual net costs of Clockwork Orange, the compounding cumulative contributions of ICT to productivity growth and consumer surpluses create positive cumulative net returns—if that were not true we would see instead a world in which nearly all cyber activity were shut down by actors seeking to minimize long-term losses. Note, however, the slowing growth of those cumulative benefits across our forecast horizon in the Clockwork Orange scenario. And note also that the total cumulative benefit of Shangri-La at nearly $200 trillion is triple that of Clockwork Orange by 2030. The annual global GDP in 2030 is approximately $10 trillion higher in Shangri-La than in Clockwork Orange.
Figure 6.21. Global cumulative net cyber benefits or costs in billion $US 2011 dollars, by scenario, 2010—2030 Source: IFs 7.15.
0
20K
40K
60K
80K
100K
120K
140K
160K
180K
200K
Billion D
ollars
Year
20102011
20122013
20142015
20162017
20182019
20202021
20222023
20242025
20262027
20282029
2030
Clockwork Orange Independent Internet Leviathans Shangri-La
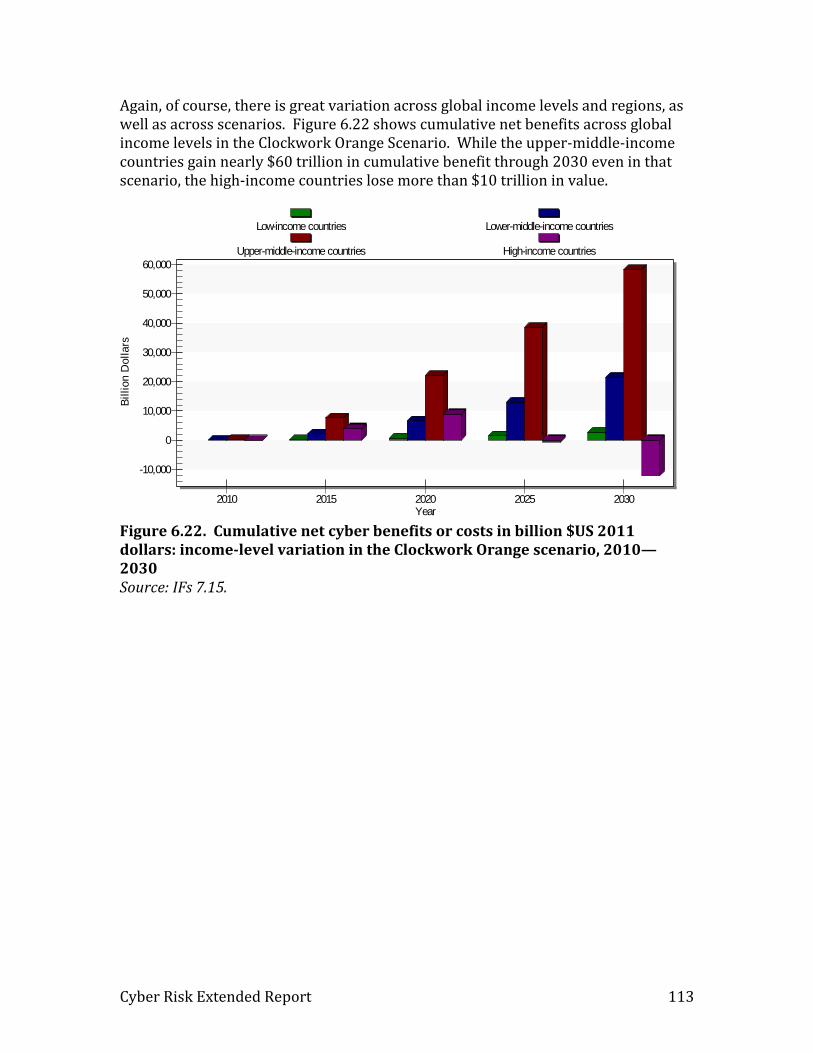
Cyber Risk Extended Report 113
Again, of course, there is great variation across global income levels and regions, as well as across scenarios. Figure 6.22 shows cumulative net benefits across global income levels in the Clockwork Orange Scenario. While the upper-middle-income countries gain nearly $60 trillion in cumulative benefit through 2030 even in that scenario, the high-income countries lose more than $10 trillion in value.
Figure 6.22. Cumulative net cyber benefits or costs in billion $US 2011 dollars: income-level variation in the Clockwork Orange scenario, 2010—2030 Source: IFs 7.15.
-10,000
0
10,000
20,000
30,000
40,000
50,000
60,000
Billion D
ollars
Year2010 2015 2020 2025 2030
Low-income countries Lower-middle-income countries
Upper-middle-income countries High-income countries
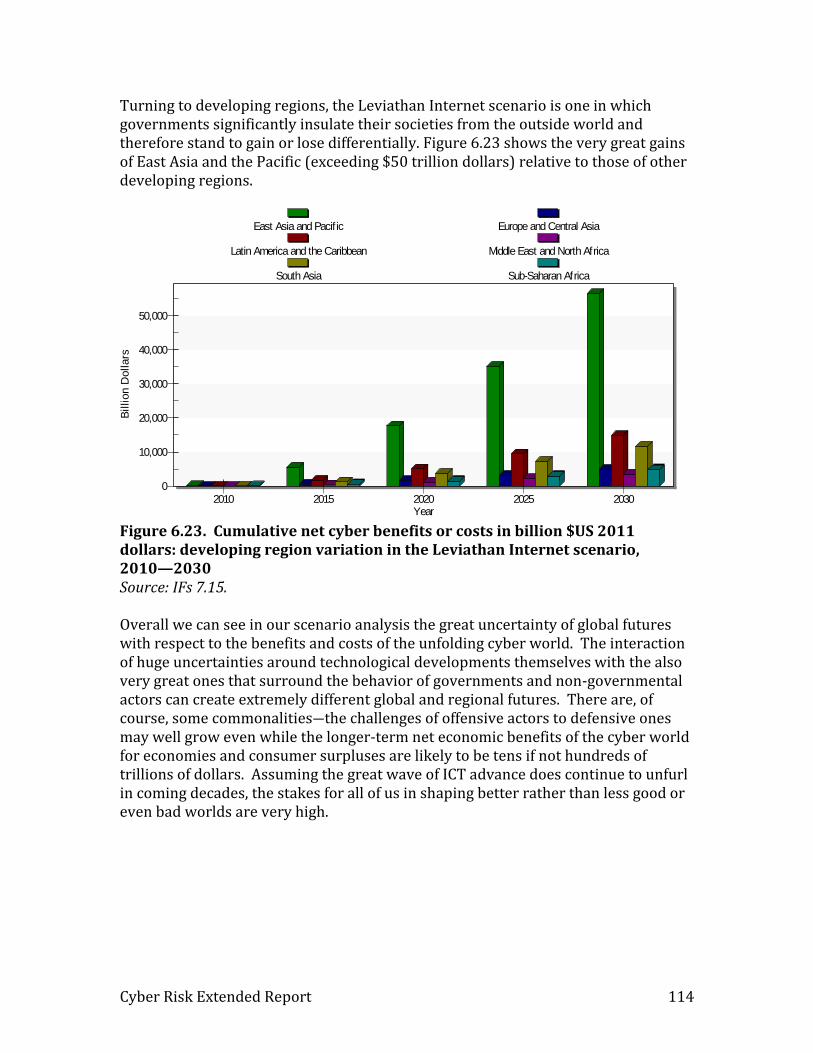
Cyber Risk Extended Report 114
Turning to developing regions, the Leviathan Internet scenario is one in which governments significantly insulate their societies from the outside world and therefore stand to gain or lose differentially. Figure 6.23 shows the very great gains of East Asia and the Pacific (exceeding $50 trillion dollars) relative to those of other developing regions.
Figure 6.23. Cumulative net cyber benefits or costs in billion $US 2011 dollars: developing region variation in the Leviathan Internet scenario, 2010—2030 Source: IFs 7.15. Overall we can see in our scenario analysis the great uncertainty of global futures with respect to the benefits and costs of the unfolding cyber world. The interaction of huge uncertainties around technological developments themselves with the also very great ones that surround the behavior of governments and non-governmental actors can create extremely different global and regional futures. There are, of course, some commonalities―the challenges of offensive actors to defensive ones may well grow even while the longer-term net economic benefits of the cyber world for economies and consumer surpluses are likely to be tens if not hundreds of trillions of dollars. Assuming the great wave of ICT advance does continue to unfurl in coming decades, the stakes for all of us in shaping better rather than less good or even bad worlds are very high.
0
10,000
20,000
30,000
40,000
50,000
Billion D
ollars
Year2010 2015 2020 2025 2030
East Asia and Pacific Europe and Central Asia
Latin America and the Caribbean Middle East and North Africa
South Asia Sub-Saharan Africa
Cyber Risk Extended Report 115
7. Conclusions Economic benefits of cyber technology or ICT include the direct contribution to economic growth of the sector’s own production, the indirect contributions of that sector to growth throughout the broader economy, and the benefits to consumers of cost reductions and capacity improvements not easily or typically captured in GDP growth. Yet use of the technology is also associated with risks from hactivism, cybercrime, espionage, and cyber terror or even war. Those risks give rise to economic costs including the spending to limit them, the costs incurred when such adverse events are not prevented, and the costs associated with foregoing potential benefits in order to eliminate or at least limit other costs. This report has surveyed and summarized much of the research and data on these benefits and costs and their variation across time and countries. In general the greatest benefits are the contribution of ICT, as a multipurpose technology like steam and electricity before it, to growth and productivity enhancements in all sectors of the economy. The greatest costs are those associated with adverse events not prevented by efforts and spending to do so. On a global basis the annual balance of benefits and costs has been changing and it appears quite likely that annual costs will come to outweigh benefits, as they appear already to do in high-income countries. The contribution of the technology and investment in it to the stock of capital and multifactor or total factor productivity means, however, that the benefits carry over and compound across time, making the contribution grow exponentially over time, just as economies grew exponentially across the twentieth century with the use of electricity and modern fossil fuels. Hence the cumulative sum of economic benefits has already come to be much larger than the cumulative but additive sum of costs, a situation all but certain to continue. The value of this study has been to quantify these conceptual elements, to initialize their value with the best data we could find, to build forecast formulations that seem consistent with theoretical understandings and past development, and to enhance our ability to explore alternative assumptions motivated by potentially very different scenario stories. We recognize the inevitable limitations associated with each of these contributions, but hope that the platform created can continue to be both used and refined so as to better understand and balance risk and reward in the cyber world.

Cyber Risk Extended Report 116
Acknowledgments The authors of this report thank Zurich Insurance for its financial and intellectual support (especially Benno Keller) and the Atlantic Council for its partnership in this cyber risk project (Mathew Burrows, Jay Healey, Barry Pavel, Carles Castello-Catchot , Klara Tothova Jordan, Anni Piparinen, and Aparajitha Vadlamannati). We benefited greatly from exploratory or extended conversations with and feedback from many people including Heather Roff (Josef Korbel School of International Studies), Kevin Sullivan (Principal Security Strategist with Microsoft’s Global Security Strategy and Diplomacy team in Trustworthy Computing), Erin English (Senior Security Strategist with Microsoft’s Global Security Strategy and Diplomacy team in Trustworthy Computing), Arnand Rao (Google Autonomous Vehicles), Jose Nazario (Cyber Conflict Studies Association, formerly Invincea Labs), Melissa Hathaway (Potomac Institute for Policy Studies, former leader of President Obama’s Cyberspace Policy Review), Peter Singer (Senior Fellow, The New America Foundation and author of Cybersecurity and Cyberwar: What Everyone Needs to Know, 2014), Manish Karir (QuadMetrics Inc. and formerly Department of Homeland Security, Science and Technology Directorate, Cyber Security Division), Michael Montecillo (NA Security Intelligence Director, IBM Security Services), Jakub Czyz (Graduate Student, University of Michigan), and JD Work (Research Director at the Cyber Conflict Documentation Project).. At the Frederick S. Pardee Center for International Studies we benefited from research support of Katherine Hill, Shelby Johnson, and Caleb Petry, as well as more general support from the entire organization.

Cyber Risk Extended Report 117
Bibliography
Works Cited Ashmore, William C. 2009. “Impact of Alleged Russian Cyber Attacks.” Monograph. Army Command and General Staff Coll., Fort Leavenworth KS School of Advanced Military Studies. Atkinson, Robert D. and Andrew S. McKay. 2007. Digital Prosperity: Understanding the Economic Benefits of the Information Technology Revolution. The Information Technology & Innovation Foundation, Washington DC. Atkinson, Robert D. and Luke A. Stewart. 2013. Just the Facts: The Economic Benefits of Information and Communication Technology. Information Technology & Innovation Foundation, Washington DC. Betterley Risk Consultants, Inc. 2014. The Betterley Report: Cyber/Privacy Insurance Market Survey, 2014. International Risk Management Institute. Bloom, Nicholas, Mirko Draca, Tobias Kreschmer and Raffaella Sadun. 2010. The Economic Impact of ICT. Final Report. Centre for Economic Performance, London School of Economics, London. Boston Consulting Group. 2012. The Internet Economy in the G-20: the $4.2 Trillion Growth Opportunity. Report. Boston Consulting Group, Boston. ----. 2011. Turning Local: From Madrid to Moscow, the Internet is Going Native. Report. Boston Consulting Group, Boston. ----. 2010. The Connected Kingdom: How the Internet is Transforming the UK Economy. Report. Boston Consulting Group, Boston. Brynjolfsson, Erik and Andrew McAfee. 2012. Race Against the Machine: How the Digital Revolution is Accelerating Innovation, Driving Productivity, and Irreversibly Transforming Employment and the Economy. The MIT Center for Digital Business, MIT Sloan School of Management, Cambridge, MA. Burt, David, Paul Nicholas, Kevin Sullivan, and Travis Scoles. 2014. The Cybersecurity Risk Paradox: Impact of Social, Economic, and Technological Factors on Rates of Malware. Microsoft Corporation. Byrne, David M., Stephen D. Oliner, and Daniel E. Sichel. 2013. Is the Information Technology Revolution Over? Finance and Economic Discussion Series Divisions of Research and Statistics and Monetary Affiars. Federal Reserve Board, Washington DC.
Cyber Risk Extended Report 118
Cardona, M., T, Kretschmer and T. Strobel. 2013. “ICT and productivity: conclusions from the empirical literature.” Information Economics and Policy 25: 109—125. doi:10.1016/j.infoecopol.2012.12.002 Cavelty, Myriam Dunn. 2012. “Cyber-Security.” In Allan Collins ed., Contemporary Security Studies. New York: Oxford University Press. Center for Strategic and International Studies (CSIS). 2014a. Net Losses: Estimating the Global Cost of Cybercrime. Economic Impact of Cybercrime II. Full Report. CSIS, Washington DC. ----. 2014b. Net Losses: Estimating the Global Cost of Cybercrime. Report Summary. CSIS, Washington DC. ----. 2013. The Economic Impact of Cybercrime and Cyber Espionage. Report. CSIS, Washington DC. Cette, Gilbert and Jimmy Lopez. 2008. “What Explains the ICT Diffusion Gap Between the Major Advanced Countries? An Empirical Analysis.” International Productivity Monitor no. 17: 28—39 Conference Board. Undated. “The Conference Board Total Economy Database Methodology Notes.” Available at: https://www.conference-board.org/retrievefile.cfm?filename=TED-Methodological-Notes.pdf&type=subsite [accessed on 5/12/15] -----. 2014a. The Conference Board Total Economy Database: Summary Statistics 1997—2014. Available at: https://www.conference-board.org/retrievefile.cfm?filename=TED-Summary-Tables-1997-2014.pdf&type=subsite [accessed on 5/12/15] -----. 2014b. Total Economy Database. Available at: https://www.conference-board.org/data/economydatabase/ [accessed on 5/12/15] Cowen, Tyler. 2011. The Great Stagnation: How America Ate All the Low-Hanging Fruit of Modern History, Got Sick, and Will (Eventually) Feel Better. eSpecial from Dutton. Czernich, Nina, Oliver Falck, Tobias Kretchmer, and Ludger Woessmann. 2011. “Broadband Infrastructure and Economic Growth.” Economic Journal 121: 505—532. Deighton, John and John Quelch. 2009. Economic value of the Advertising-Supported Internet Ecosystem. Full Report. Hamilton Consultants, Inc., Cambridge MA.

Cyber Risk Extended Report 119
Detica Limited. 2011. The Cost of Cyber Crime. A Detica Report In Partnership with the Office of Cyber Security and Information Assurance in the Cabinet Office. Detica Limited, Surrey, UK. Dübendorfer, Thomas, Arno Wagner, and Bernhard Plattner. “An Economic Damage Model for Large-Scale Internet Attacks.” Workshop for the Consortium “Risk Management and Modelling for Distributed Systems” September 7th, 2004, Zurich. Dutz, Mark, Jonathan Orszag and Robert Willig. 2009. The Substantial Consumer Benefits of Broadband Connectivity for U.S. Households. Compass Lexecon LLC. Commissioned by the Internet Innovation Alliance. Dynes, Scott, Eva Andrijcic, and M. Eric Johnson. No date. “Costs to the U.S. Economy of Information Infrastructure Failures: Estimates from Field Studies and Economic Data.” Proceedings of the Fifth Workshop on the Economics of Information Security, Cambridge University. European Commission (EC). 2013. The Socio-economic Impact of Bandwidth. Final Report. Luxembourg: Publications Office of the European Union. doi: 10.2759/95687 EIU. 2010. Digital economy rankings 2010: Beyond e-readiness. Economist Intelligence Unit and the IBM Institute for Business Value. Available at: Farwell, James and Rafal Rohozinski. 2011. “Stuxnet and the Future of Cyber War.” Survival: Global Politics and Strategy 53(1): 23—40. doi: 10.1080/00396338.2011.555586 Gartzke, Erik. 2013. “The Myth of Cyber War: Brining War in Cyberspace Back Down to Earth.” International Security 38(2): 41—73. doi:10.1162/ISEC_a_00136 Gordon, Robert J. 2014. “The Demise of U.S. Economic Growth: Restatement, Rebuttal, and Reflections.” NBER Working Paper series no. 19895. National Bureau of Economic Research, Cambridge MA. Gordon, Robert J. 2012. “Is US Economic Growth Over? Faltering Innovation Confronts the Six Headwinds.” NBER Working Paper series no. 18315. National Bureau of Economic Research, Cambridge MA. Greenburg, Michael, Nancy Mantell, Michael Lahr, Frank Felder, and Rae Zimmerman. 2007. “Short and intermediate economic impacts of a terrorist-initiated loss of electric power: Case study of New Jersey.” Energy Policy 35: 722—733. Greenstein, Shane and Ryan McDevitt. 2012. “Measuring the Broadband Bonus in Thirty OECD Countries.” OECD Digital Economy Papers no. 197. OECD Publishing,

Cyber Risk Extended Report 120
Geneva. doi: 10.1787/20716826
-----. 2010a. “The Global Broadband Bonus: Broadband Internet’s Impact on Seven Countries.” In The Linked World: How ICT is Transforming Societies, Cultures, and Economics. Research Report R-1476-11-RR. Conference Board Inc.
-----. 2010b. “The Broadband Bonus: Estimating Broadband Internet’s Economic Value.” Working Paper. Kellogg School of Management and Department of Economics, North Western University.
Gruber, H., J. Hätönen, P. Koutroumpus. 2014. “Broadband access in the EU: an assessment of future economic benefits.” Telecommunications Policy 38: 1046—1058. doi: 10.1016/j.telpol.2014.06.007
Hanclova, Jana, Petr Doucek, Jakub Fisher and Kristyna Vltavska. 2015. “Does ICT Capital Affect Economic growth in the EU-15 and EU-12 countries?” Journal of Business Economics and Management 16(2): 387—406. doi: 10.3846/16111699.2012.754375
IBM. 2013. The Economies of IT Risk and Reputation: What Business Continuity and IT Security Really Mean for Your Organization. Findings from the IBM Global Study on the Economic Impact of IT Risk. Somers, NY: IBM Global Technology Services.
Indepen. 2006. Restoring European economic and social progress: unleashing the potential of ICT. Appendices to Main Report. A report for the Brussels Round Table. Indepen, London. International Telecommunication Union (ITU). 2015. Global Cybersecurity Index & Cyberwellness Profiles. Report. Oyster Bay, New York: ABIresearch and ITU. -----. 2014a. Measuring the Information Society Report. International Telecommunication Union, Geneva. -----. 2014b. Global Cybersecurity Index. Oyster Bay, New York: ABIresearch and ITU. -----. 2012. Impact of Broadband on the Economy. Broadband Series. Telecommunication Development Sector. International Telecommunication Union, Geneva. Jiménez, Nancy, Lotfollah Najjar, Sajda Qureshi and Dwight Haworth. 2013. “Information and Communication Technologies Effects on Economic Growth.” Full report. Proceedings of the Nineteenth Americas Conference on Information Systems, Chicago, Illinois, August 15—17, 2013.

Cyber Risk Extended Report 121
Katz, R. I. and P. Koutroumpis. 2013. “Measuring digitization: a growth and welfare multiplier.” Technovation 33: 314—319. doi:10.1016/j.technovation.2013.06.004 Khalilzad, Zalmay M. and John P. White eds. 1999. The Changing Role of Information in Warfare. Strategic Appraisal. RAND Project Air Force. RAND, Santa Monica, CA. Kozlowski, Andrzej. 2014. “Comparative Analysis of Cyberattacks on Estonia, Georgia and Kyrgyzstan.” European Scientific Journal special edition 13: 237—245. Koutroumpis, P. 2009. “The economic impact of broadband on growth: a simultaneous approach.” Telecommunications Policy 33(9): 471—485. doi: 10.1016/j.telpol.2009.07.004 Krepinevich, Andrew F. 2012. Cyber Warfare: A “Nuclear Option”? Report. Center for Strategic and Budgetary Assessments, Washington DC. Krestchmer, T. 2012. “Information and Communication Technologies and Productivity Growth: a survey of the literature.” OECD Digital Economy Papers no. 195. OECD Publishing, Geneva. doi: 10.1787/20716826
Kurzweil, Ray. 2006. The Singularity is Near: When Humans Transcend Biology. New York: Penguin Books.
Kyriakidou, Vagia, Christos Michalakelis, and Thomas Sphicopoulos. “Assessment of information and communications technology maturity level.” Telecommunications Policy 37: 48—62. doi: 10.1016/j.telpol.2012.08.001 Lawson, Sean. 2011. “Beyond Cyber-Doom: Cyberattack Scenarios and the Evidence of History.” Working Paper no. 11-01. Mercatus Center, George Mason University, Fairfax, Virginia. Lee, Sang-Yong Tom, Roghieh Gholami and Tan Yit Tong. 2005. “Time series analysis in the assessment of ICT impact at the aggregate level: lessons and implications for the new economy.” Information Management 42(7): 1009—1022. doi: 10.1016/j.im.2004.11.005 Lachow, I. 2009. “Cyber Terrorism: Menace or Myth?” in F. D. Kramer, S. H. Starr, and L. K. Wentz eds., Cyberpower and National Security. Dulles, VA: Potomac Books. Lloyd’s of London. 2015. Business Blackout: the Insurance Implications of a Cyber-Attack on the US Power Grid. Emerging Risks Report 2015. London: Lloyd’s of London. Mandiant. 2013. M-Trends attack the security gap. 2013 Threat Report. Mandiant, Alexandria, VA.
Cyber Risk Extended Report 122
MGI. 2015. Global Growth: Can Productivity Save the Day in an Aging World? McKinsey Global Institute, Washington DC. -----. 2014. China’s digital transformation: the Internet’s impact on productivity and growth. McKinsey Global Institute, Washington DC. -----. 2013. Disruptive technologies: advances that will transform life, business, and the global economy. McKinsey Global Institute, Washington DC. -----. 2011. Internet matters: The Net’s sweeping impact on growth, jobs, and prosperity. McKinsey Global Institute, Washington DC. Niebel, Thomas. 2014. “ICT and economic growth: comparing developing, emerging, and developed countries.” ZEW Discussion Papers no. 14-117. Oulton, Nicholas. 2012. “Long term implications of the ICT revolution: Applying lessons of growth theory and growth accounting.” Economic Modelling 29: 1722—1736. doi: 10.1016/j.econmod.2012.04.025
OECD. 2013. “Measuring the Internet Economy: A Contribution to the Research Agenda.” OECD Digital Economy Papers no. 226. OECD Publishing, Paris. doi: 10.1787/20716826 Ponemon Institute. 2014. 2014 Cost of Data Breach Study: Global Analysis. Research Report. Ponemon Institute, North Traverse City, MI. Qiang, Christine Zhen-Wei. 2009. “Broadband infrastructure investment in stimulus packages: relevance for developing countries.” Working Paper. World Bank, Washington DC. Rid, Thomas. 2013. Cyber War Will Not Take Place. Oxford: Oxford University Press. Robinson, Neil, Luke Gribbon, Veronika Horvath, Kate Robertson. 2013. Cyber-security Threat Characterisation: a rapid comparative analysis. RAND Europe. RAND, Santa Monica, CA. Rohman, Ibrahim Kholilul and Bohlin, Erik. 2012. “Does Broadband Speed Really Matter for Driving Economic Growth? Investigating OECD Countries.” Working Paper. Chalmers University of Technology, Gothenburg, Sweden. Röller, Lars-Hendrick and Leonard Waverman. 2001. “Telecommunications Infrastructure and Economic Development: A Simultaneous Approach.” American Economic Review 4(91): 909—923. Rose, Adam, Gbadebo Oladosu, and Shu-Yi Liao. 2007. “Regional economic impacts of a terrorist attack on the water system of Los Angeles: a computable general
Cyber Risk Extended Report 123
disequilibrium analysis.” In Harry W. Richardson, Peter Gordon and James E. Moore II eds, The Economic Costs and Consequences of Terrorism. Cheltenham, UK: Edward Elgar Publishing Limited. Rosston, G., S. Savage, D. Waldman. 2010. Household demand for broadband services. Final report to Broadband.gov Task Force. Federal Communications Commission, Washington DC. Rothman, Dale S., Mohammod T. Irfan, Eli Margolese-Malin, Barry B. Hughes, Jonathan D. Moyer. 2014. Building Global Infrastructure. Patterns of Potential Human Progress volume 4. Denver and Boulder: Federick S. Pardee Center and Paradigm Publishers; New Delhi: Oxford University Press India. Shapiro, Robert J. and Aparna Mathur. 2011. The Contributions of Information and Communication Technologies to American Growth, Productivity, Jobs and Prosperity. Report on ICT and Innovation. Sonecon. Singer, P. W. and Allan Friedman. 2014. Cybersecurity and Cyberwar: What everyone needs to know. New York: Oxford University Press, Sosa, David. 2014. Early Evidence Suggests Gigabit Broadband Drives GDP. Analysis Group. Symantec. 2012. Norton Cybercrime Report 2012. Published online at: http://us.norton.com/cybercrimereport. US Government Office of the National Counterintelligence Executive (ONCIX). 2011. Foreign Spies Stealing US Economic Secrets in Cyberspace: Report to Congress on Foreign Economic Collection and Industrial Espionage, 2009—2011. Full report. US GOV, Washington DC. Venturini, Francesco. 2009. “The long-run impact of ICT.” Empirical Economics 37: 497—515. doi: 10.1007/s00181-008-0243-9 Verizon. 2014. 2014 Data Breach Investigations Report. Report. Verizon. Vu, Khuong M. 2011. “ICT as a source of economic growth in the information age: Empirical evidence from the 1996—2005 period.” Telecommunications Policy 35: 357—372. doi: 10.1016/j.telpol.2011.02.008 Waverman, Lenard. 2009. Economic Impact of Broadband: An Empirical Study. London: LECG. Waverman, Lenard, Meloria Meschi and Melvyn Fuss. 2005. The Impact of Telecoms on Economic Growth in Developing Countries. ICT Regulation Toolkit. ITU.

Cyber Risk Extended Report 124
World Economic Forum (WEF). 2014. The Global Information Technology Report 2014: Rewards and Risks of Big Data. Insight Report. Geneva: World Economic Forum and Insead. -----. 2009. ICT for Economic Growth: A Dynamic Ecosystem Driving The Global Recovery. Geneva: World Economic Forum. Yousefi, Ayoub. 2011. “The impact of information and communication technology on economic growth: evidence from developed and developing countries.” Economics of Innovation and New Technology 20(6): 581—596. doi: Ashmore, William C. 2009. “Impact of Alleged Russian Cyber Attacks.” Monograph. Army Command and General Staff Coll., Fort Leavenworth KS School of Advanced Military Studies. 10.1080/10438599.2010.544470 Zimmerman, Rae, Carlos E. Restrepo, Jeffrey S. Simonoff, and Lester B. Lave. 2007. “Risk and economic costs of a terrorist attack on the electric system.” In Harry W. Richardson, Peter Gordon and James E. Moore II eds, The Economic Costs and Consequences of Terrorism. Cheltenham, UK: Edward Elgar Publishing Limited.
Additional Works Consulted Atlantic Council and Zurich Insurance Group. 2014. Beyond Data Breaches: Global Interconnections of Cyber Risk. Risk Nexus Report. Washington, D.C. and Zurich, Switzerland: Atlantic Council and Zurich Insurance Group. Brynjolfsson, Erik. 1996. “The Contribution Of Information Technology to Consumer Welfare.” Information Systems Research 7(3): 281—300. Canabarro, Diego Rafael and Thiago Borne. 2013. “Reflections on The Fog of (Cyber)War.” NCDG Policy Working Paper no. 13-001. National Center for Digital Government, University of Massachusetts, Amherst. Crandall, Robert W. and Hal J. Singer. 2010. “The Economic Impact of Broadband Investment.” Brookings Institution, Washington DC. Deloitte LLP. 2012. What is the Impact of Mobile Telephony on Economic Growth? A Report for the GSM Association. Deloitte, London. Dutz, Mark. A., Jonathan M. Orszag, and Robert D. Willig. 2012. “The Liftoff of Consumer Benefits from the Broadband Revolution.” Review of Network Economics 11(4): article 2. doi: 10.1515/1446-9022.1355 Freedom House. 2014. Freedom on the Net 2014: Tightening the Net: Governments Expand Online Controls. Freedom House, Washington DC.
Cyber Risk Extended Report 125
Gupta, Abhay. 2013. “Estimating Direct Gains in Consumer Welfare in Telecommunications Sector.” Consumer Policy 36: 119—138. Doi: 10.1007/s10603-013-9220-6. Healey, Jason. 2011. “the Five Futures of Cyber Conflict and Cooperation.” Atlantic Council IssueBrief. Atlantic Council, Washington DC. Oranje-Nassau, Constantijn van, Joachim Krapels, Maarten Botterman and Jonathan Cave. 2009. “The Future of the Internet Economy: A Discussion Paper on Critical Issues.” RAND Europe working paper 548-EZ. RAND Europe, Cambridge, UK. Organization for Economic Co-operation and Development (OECD). 2013. The Internet Economy on the Rise: Progress Since the Seoul Declaration. Paris: OECD Publishing. United Nations Institute for Disarmament Research (UNIDIR). 2013. The Cyber Index: International Security Trends and Realities. New York and Geneva: UNIDIR. van Ark, Bart, ed. 2011. The Linked World: How ICT is transforming societies, cultures, and economies. Madrid, Spain: Fundaciόn Telefόnica. Welsum, Desiree van, Willem Overmeer, and Bart van Ark. 2012. Unlocking the ICT growth potential in Europe: Enabling people and businesses. Final Report. European Commission, Geneva.

Cyber Risk Extended Report 126
Appendices
Appendix A: The Cyber Risk Dashboard Concept (Final May Differ Somewhat)

Cyber Risk Extended Report 127
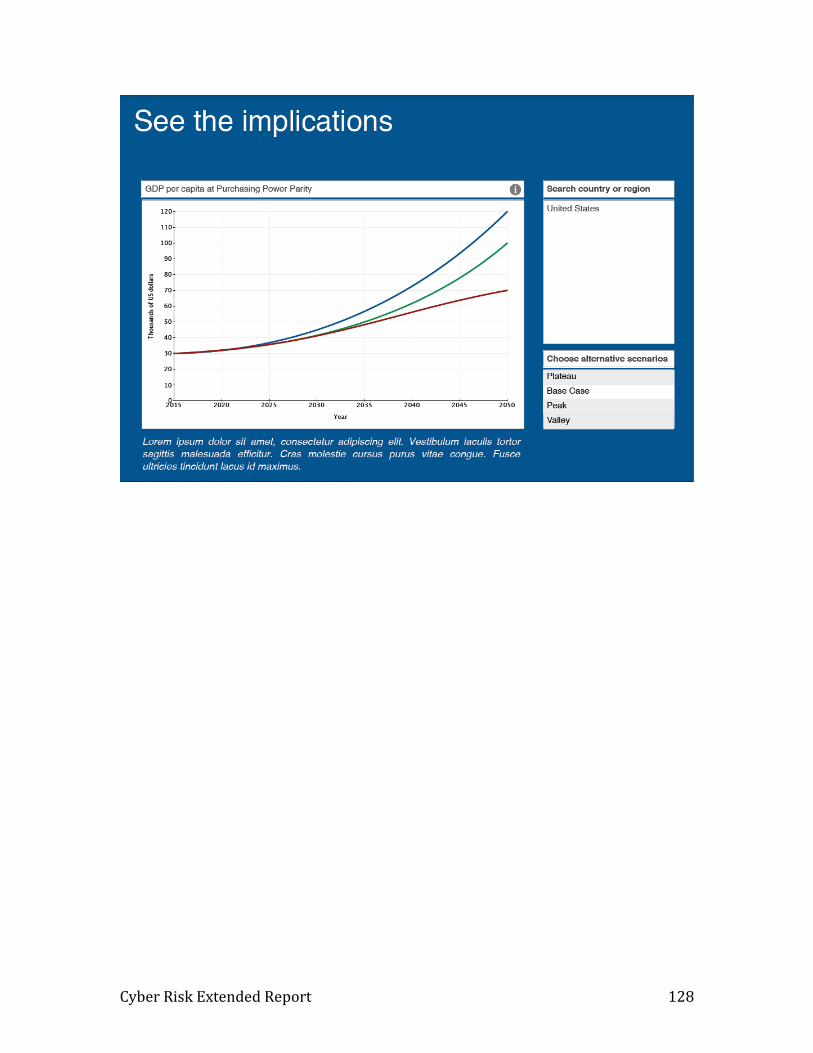
Cyber Risk Extended Report 128
Cyber Risk Extended Report 129
Appendix B: Productivity Impacts of ICT
In estimating the impact of infrastructure on MFP, we relate the impact to measures of physical infrastructure and not to measures of infrastructure spending. Because of the interaction effects across infrastructure types, we do not attempt to estimate the impact of individual forms of infrastructure but rather estimate the impact as a function of a composite index of infrastructure. Due to the very different historical and expected growth patterns of more traditional infrastructure—transportation, energy and water—vis-à-vis ICT, we create a separate index for ICT and link it to the physical capital component of MFP (MFPPC) in a different way.
The ICT Index, INFRAINDICT61, is calculated as a weighted average of the subscription rates for three of the four different kinds of ICT – mobile phones, fixed broadband, and mobile broadband. Since the subscription rates for mobile phones and mobile broadband saturate at 150 per 100 persons, their values are first multiplied by 2/3 so that they range from 0 to 100. Fixed broadband subscription rate
is capped at 50 percent based on the the historical rates of fixed phone subscription rates
in countries. The weights are given by the parameter infraindictcompwt, which is a vector with three entries, one for each of the component indices. By default, these values are set to 1, indicating equal weighting. The index can have a maximum value
of 250/3 or 83.33 when all weights are 1. When considering the impact of ICT infrastructure on MFP, using the same approach as for traditional infrastructure would be problematic. Our formulation for forecasting ICT infrastructure includes a technology shift factor. Therefore, any relationship between GDP per capita and the expected level of ICT would not remain stable over time; for example, a country with a GDP per capita of $5,000 in 2015 would be expected to have more ICT infrastructure than a country with a GDP per capita of $5,000 in 2010. We therefore associate the growth contribution from ICT advances with annual changes in the ICT Index, rather than with the level of the index as we do for traditional infrastructure. We multiply the annual unit change in the ICT Index by the parameter mfpinfrindict. Qiang, Rossotto and Kimura (2009: 45) estimated that each 10 percent increase in broadband penetration in developing countries increased the growth rate of per capita GDP by 1.38 percentage points (by 1.21 percentage points for developed countries) during the 1980 to 2006 period. We arbitrarily reduced the impact by using a default value of 0.8 because our index is a mixture of several types of ICT infrastructures, not all of which might have as strong an impact on economic productivity as does broadband. Thus, a 10 point increase in the value of the ICT index would result in a 0.8 addition to MFP, or an approximate increase of 0.8 percent in GDP per capita.
61 A separate index, INFRAINDICTZ, is also calculated following the same approach as for the component indices of traditional infrastructure. This is only used for display purposes.

Cyber Risk Extended Report 130
There is one obviously questionable implication of this approach. When a country reaches saturation in the ICT Index, it will no longer receive a productivity boost from ICT. Given the current rapid increase in mobile telephones and mobile broadband that together make up two-thirds of the ICT Index, we see in most scenarios a near-term boost to MFP from ICT in much of the world, followed by little or no contribution later in the horizon. Our uncertainty with respect to appropriate treatment of the longer-term contribution of ICT points to one of the limitations of trying to forecast rapidly changing technologies.
MFP Physical Capital Equations
The logic of the physical capital cluster is again parallel to that of the human and social capital clusters and involves the comparison of an actual (that is, IFs computed) with an expected value. The formulation for MFPPC can actually take several forms depending on the value of a switching parameter (inframfpsw) but the standard form involves four contributions, from traditional infrastructure (InfraTradContrib), ICT infrastructure (InfraICTContrib), other infrastructure spending level (InfOthSpenContrib), and the price of energy (EnPriceTerm). The last term is included because higher prices of energy can make some forms of capital plant no longer efficient or productive. In the case of this cluster only the expected value of the traditional infrastructure index (InfraIndTradComp) and the expected value of other infrastructure spending (InfraOthSpendComp) are computed as most other cluster elements are, namely as a function of GDP per capita at PPP. In the case of the ICT index contribution, the technology has been evolving so rapidly that there is not really a basis for an expected value with some stability over time. Instead the contribution from ICT is computed in terms of a moving average value of change over time, such that faster rates of change contribute more to MFP as the moving average expected value lags further behind the actual. In the case of the energy price term, the "expected" value is set equal to the energy price in the first year of the model run. As with other clusters and the variables in them, a single parameter links the discrepancy between actual and expected values to MFP.
𝑀𝐹𝑃𝑃𝐶𝑟 = 𝐼𝑛𝑓𝑟𝑎𝑇𝑟𝑎𝑑𝐶𝑜𝑛𝑡𝑟𝑖𝑏𝑟 + 𝐼𝑛𝑓𝑟𝑎𝐼𝐶𝑇𝐶𝑜𝑛𝑡𝑟𝑖𝑏𝑟 + 𝐼𝑛𝑓𝑂𝑡ℎ𝑆𝑝𝑛𝑑𝐶𝑜𝑛𝑡𝑟𝑖𝑏𝑟
+ 𝐸𝑛𝑃𝑟𝑖𝑐𝑒𝑇𝑒𝑟𝑚𝑟,𝑡−1
where
𝐼𝑛𝑓𝑟𝑎𝑇𝑟𝑎𝑑𝐶𝑜𝑛𝑡𝑟𝑖𝑏𝑟
= (𝐼𝑁𝐹𝑅𝐴𝐼𝑁𝐷𝑇𝑅𝐴𝐷𝑟,𝑡−1 − 𝐼𝑛𝑓𝑟𝑎𝐼𝑛𝑑𝑇𝑟𝑎𝑑𝐶𝑜𝑚𝑝𝑟)
∗ 𝒎𝒇𝒑𝒊𝒏𝒇𝒓𝒂𝒊𝒏𝒅𝒕𝒓𝒂𝒅

Cyber Risk Extended Report 131
𝐼𝑛𝑓𝑟𝑎𝐼𝐶𝑇𝐶𝑜𝑛𝑡𝑟𝑖𝑏𝑟
= (0.8 ∗ 𝐼𝑛𝑑𝐼𝐶𝑇𝐼𝑛𝑑𝐶ℎ𝑎𝑛𝑔𝑒𝑟,𝑡−1 + 0.2 ∗ 𝐼𝑛𝑑𝐼𝐶𝑇𝐼𝑛𝑑𝐶ℎ𝑎𝑛𝑔𝑒𝑟,𝑡)
∗ 𝒎𝒇𝒑𝒊𝒏𝒇𝒓𝒂𝒊𝒏𝒅𝒊𝒄𝒕
where
𝐼𝑛𝑑𝐼𝐶𝑇𝐼𝑛𝑑𝐶ℎ𝑎𝑛𝑔𝑒𝑟 = 𝐼𝑛𝑓𝑟𝑎𝐼𝑛𝑑𝐼𝐶𝑇𝑟,𝑡−1 − 𝐼𝑛𝑓𝑟𝑎𝐼𝑛𝑑𝐼𝐶𝑇𝑟,𝑡−2
𝐼𝑛𝑓𝑟𝑎𝑂𝑡ℎ𝑆𝑝𝑛𝑑𝐶𝑜𝑛𝑡𝑟𝑖𝑏𝑟
= (𝐺𝐷𝑆𝑟,𝑠=𝐼𝑛𝑓𝑟𝑎𝑂𝑡ℎ𝑒𝑟,𝑡−1 ∗ (1 + 𝐼𝐺𝐷𝑃𝑅𝐶𝑜𝑟𝑟)
𝐺𝐷𝑃𝑟,𝑡−1 ∗ (1 + 𝐼𝐺𝐷𝑃𝑅𝐶𝑜𝑟𝑟)∗ 100
𝑟
− 𝐼𝑁𝐹𝑅𝐴𝑂𝑡ℎ𝑆𝑝𝑛𝑑𝐶𝑜𝑚𝑝𝑟,) ∗ 𝒎𝒇𝒑𝒊𝒏𝒇𝒓𝒐𝒕𝒉𝒔𝒑𝒏𝒅
𝑃ℎ𝑦𝑠𝑖𝑐𝑎𝑙𝐶𝑎𝑝𝑖𝑡𝑎𝑙𝑇𝑒𝑟𝑚𝑟,𝑠 = 𝐸𝑛𝑃𝑟𝑖𝑐𝑒𝑇𝑒𝑟𝑚𝑡−1
𝐸𝑛𝑃𝑟𝑖𝑐𝑒𝑇𝑒𝑟𝑚𝑡−1 = (𝑊𝐸𝑃𝑡−1 − 𝑊𝐸𝑃𝑡=1
𝑊𝐸𝑃𝑡=1) ∗ 𝒎𝒇𝒑𝒆𝒏𝒑𝒓𝒊
Appendix C: Cyber Risk Form in IFs Stand-Alone Model Although most readers of this report who wish to undertake further analysis will want to use the web-based version of the model represented by the dashboard for analysis, some may turn to the stand-alone or installable version of IFs because it allows more extended analysis for those who go up a somewhat steeper learning curve. Figures below show the character of the specialized cyber risk form in that stand-alone model version.

Cyber Risk Extended Report 132

Cyber Risk Extended Report 133

Cyber Risk Extended Report 134

Cyber Risk Extended Report 135