cyanide destruction column studies report - yukon · cyanide ... degradation products by...
TRANSCRIPT

Cyanide Destruction Column Studies Report Eagle Gold Project
Prepared for:
80 Richmond St. West Suite 303 Toronto, Ontario M5H 2A4 Phone: (416) 866-8800 Fax: (416) 866-8801 Prepared by:
1576 Sherman Street, Suite 100 Denver, Colorado 80203 (303) 825-5999 Fax (303) 825-0642 Tetra Tech Project No. 133-77355-12001
March 13, 2014
Tetra Tech March 13, 2014
THIS PAGE INTENTIONALLY LEFT BLANK

Cyanide Destruction Column Studies Report Eagle Gold Project Certification of Author
DATE AND SIGNATURE PAGE
CERTIFICATE OF AUTHOR
Tiffany Thomas, Ph.D.
Senior Geochemist/Environmental Scientist TETRA TECH IMR
1576 Sherman Street, Suite 100
Denver, Colorado 80203
Telephone: 303-825-5999 Facsimile: 303-825-0642
Email: [email protected]
I Tiffany Thomas, Ph.D., do hereby certify that the Cyanide Destruction Column Studies Report was prepared by me (or under my direct supervision). Dated this 13th day of March, 2014. Tiffany Thomas Ph.D.


Cyanide Destruction Column Studies Report Eagle Gold Project Table of Contents
Tetra Tech March 13, 2014 i
TABLE OF CONTENTS
1.0 Introduction ........................................................................................................... 1
1.1. Goals and objectives.................................................................................. 1
1.2. Column Testing History .............................................................................. 1
2.0 Current Testing Methodology ............................................................................... 3
2.1. Metallurgical Testing and Initial Column Conditions .................................. 3
2.2. Column cyanide destruction Testing Methods ........................................... 3
Ex-situ Chemical Treatment ............................................................ 4 2.2.1.
In-situ Biological Treatment ........................................................... 14 2.2.2.
2.3. Closure (Long-Term Seepage) Phase ..................................................... 21
2.4. Data Analyses .......................................................................................... 21
Ex-Situ Chemical Treatment Procedure ........................................ 22 2.4.1.
In-Situ Biological Detoxification Procedure ................................... 24 2.4.2.
3.0 Conclusions and Recommendations .................................................................. 33
4.0 REFERENCES ................................................................................................... 37
LIST OF TABLES
Table 1-1: Historical Environmental Column Tests and Conditions ............................ 2 Table 2-1: Analytical Suite for Column Testing ........................................................... 3 Table 2-2: Initial Leachate Water Quality, Pre-cyanide Detoxification, All
Columns ..................................................................................................... 5 Table 2-3: Ex-situ Chemical Detoxification Data Summary, pH and WAD CN ............ 7 Table 2-4: Mid-Point Leachate Water Quality, Ex-Situ Chemical Detoxification
Columns ..................................................................................................... 9 Table 2-5: Final Detoxification Leachate Water Quality, Ex-Situ Chemical
Detoxification Columns ............................................................................ 11 Table 2-6: Mock MWTP Effluent Rinse Solution ....................................................... 13 Table 2-7: Rinsate Water Quality, Chemical Detoxification Columns ........................ 13 Table 2-8: In-Situ Biological Detoxification Data Summary, pH and WAD
Cyanide .................................................................................................... 16 Table 2-9: Mid-Point Detoxification Water Quality, In-Situ Biological
Detoxification Columns ............................................................................ 18

Tetra Tech March 13, 2014 ii
Table 2-10: Final Detoxification Water Quality, In-Situ Biological Detoxification Columns ................................................................................................... 20
Table 2-11: Comparison of Average Column Values, Room Temperature Ex-Situ Chemical Detoxification Columns ............................................................ 23
Table 2-12: Comparison of Average Column Values, Room Temperature In-Situ Biological Detoxification Columns ............................................................ 25
Table 3-1: Comparison of Final Treatment Solution Compositions ........................... 33
LIST OF FIGURES
Figure 2-1: Ex-Situ Chemical Treatment pH vs. Time ................................................ 27 Figure 2-2: Ex-Situ Chemical Treatment WAD CN vs. Time ...................................... 28 Figure 2-3: In-Situ Biological Treatment pH vs. Time ................................................. 29 Figure 2-4: In-Situ Biological Treatment WAD CN vs. Time ....................................... 30 Figure 2-5: Ex-Situ Chemical Treatment Nitrogen Species Evolution ........................ 31 Figure 2-6: In-Situ Biological Treatment Nitrogen Species Evolution ......................... 32 Figure 3-1: Selected Anion Comparisons between the Ex-situ Chemical and In-
situ Biological Treatment Methods ........................................................... 35 Figure 3-2: Selected Metal Comparisons between the Ex-situ Chemical and In-
situ Biological Treatment Methods ........................................................... 36
LIST OF ATTACHMENTS
Attachment A Ex-situ Chemical Treatment Procedure
Attachment B In-situ Biological Treatment Procedure

Cyanide Destruction Column Studies Report Eagle Gold Project Section 1.0 Introduction
Tetra Tech March 13, 2014 1
1.0 INTRODUCTION
1.1. Goals and objectives An environmental column testing program was conducted during 2012 and 2013 to evaluate several objectives regarding cyanide destruction, and to provide input to geochemical source predictions for spent ore associated with Stratagold’s proposed Eagle Gold Project heap leach facility (HLF). Kappes, Cassiday & Associates (KCA) in Reno, Nevada, conducted the first phase of the 2012/2013 column testing program, with input from geochemists from SRK, to evaluate the metallurgical testing of individual ore types and also evaluate the leachability of the ores based on the current heap design (i.e., primarily gold recovery). In June 2012, SRK recommended that sufficient information had been gathered for the metallurgical test purposes, and this phase of testing was concluded on June 26, 2012. The same test columns were then prepared by KCA, under the direction of geochemists from Tetra Tech, to evaluate two potential processes for cyanide destruction in the leached ore, including an ex-situ chemical and an in-situ biological treatment process. KCA (2013) prepared a report of the metallurgical test work, while this report summarizes relevant metallurgical test work to this study and focuses on the evaluation of processes for cyanide destruction.
The goals of the environmental column testing program were to:
• assess the relative performance of ex-situ chemical treatment and in-situ biological treatment in destructing cyanide within the heap and heap leachate. The test results characterize the number and concentration of cyanide degradation products (e.g., cyanate, ammonia, and nitrate) that form at various times or steps in the detoxification process;
• assess the duration (time, number of pore volumes exchanged, etc.) of the rinsing process;
• estimate the concentration/mass of cyanide, metals, etc. remaining in the heap at the end of the destruction processes; and,
• provide data and information to be used by others to help estimate the long-term quality of waters that will drain from the heap.
The objectives of the study were to generate data that will:
• Allow for an assessment of the most efficient and cost-effective cyanide destruction process for the heap; and,
• To provide data to others to develop a refined source term for the heap drainage as part of the process to predict post-closure water quality.
1.2. Column Testing History Previous column tests have been conducted to simulate heap leach characteristics including gold recovery and cyanide destruction. Environmental column tests were conducted by KCA in 1995/1996 (Dublin Gulch – Environmental and Metallurgical Laboratory Report, KCA, April 1997), 2009/2010 (Eagle Gold Project Proposal for Executive Committee Review, Pursuant to the Yukon Environmental and Socio-economic Assessment Act, Stantec, December 2010, specifically Appendix 8: Geochemical Characterization and Water Quality Predictions and Appendix 27: Leach Metallurgy and Neutralization Summary), and most recently in 2011 (KCA, 2012), following metallurgical testing for gold recovery. The 1995/1996 and 2011 environmental testing simulated the process for cyanide conversion to cyanate via the addition of hydrogen peroxide as an oxidant and copper sulphate pentahydrate as a catalyst. Cyanide destruction

Cyanide Destruction Column Studies Report Eagle Gold Project Section 1.0 Introduction
Tetra Tech March 13, 2014 2
continued until Weak Acid Dissociable (WAD) cyanide decreased to less than 0.2 milligrams per liter (mg/L). Column test conditions varied based on variable ore blends, particle size, crush type, and agglomeration as summarized in Table 1.1-1.
Table 1-1: Historical Environmental Column Tests and Conditions Year Sample No. Ore Type Crush size, mm Temperature Treatment
95/96 22652 A -50 Ambient* 1 kg/MT hydrated lime
95/96 22660 A -12.5 Ambient* 1 kg/MT hydrated lime
95/96 22685 A -50 Cold† 1 kg/MT hydrated lime
95/96 22687 A -12.5 Cold† 1 kg/MT hydrated lime
95/96 22662 B -12.5 Ambient* 1 kg/MT hydrated lime
95/96 22664 C -12.5 Ambient* 1 kg/MT hydrated lime
95/96 22666 A,B,C,D -12.5 Ambient* 1 kg/MT hydrated lime
2010 42979 A,B,C -5, Conventional P80 = 3.641
Ambient* 2 kg/MT cement
2011 48111 A,B,C HPGR P80 = 7
Ambient* 3 kg/MT cement
2011 48114 A,B,C HPGR P80 = 7
Ambient* 3 kg/MT cement
Ore Types as follows: A – weathered granodiorite, B – freshly to weakly altered granodiorite (<20% altered), C – Strongly altered (sericite, chlorite, carbonate) granodiorite, D – fine-grained granodiorite, and E – weathered metasediments.
*20 to 30° C †-2 to 2° C
Although multiple column studies with ores from the site were conducted prior to the 2012/2013 program (Table 1.1-1), those previous studies were not specifically based on the current heap design, including the final ore blend, crush size and type. Because of potential variations between the historic and current column testing ore preparation methods and because the historical least test column operation did not simulate heap operation through the rinsing stage, the 2012/2013 environmental testing program was initiated to simulate alternative heap leach treatment methodologies including rinsing and cyanide destruction (i.e., in-situ biological detoxification and ex-situ chemical detoxification methods).
Cyanide Destruction Column Studies Report Eagle Gold Project Section 2.0 Current Testing Methodology
Tetra Tech March 13, 2014 3
2.0 CURRENT TESTING METHODOLOGY
2.1. Metallurgical Testing and Initial Column Conditions The environmental testing of the columns was initiated immediately following the abbreviated phase of the gold recovery (leach) testing. The metallurgical leaching and subsequent column testing were designed so that the ore placed in the columns (e.g., ore preparation, ore type distribution, concentration and application rate of cyanide solution) would be representative of the conditions proposed for the Eagle Gold Project. Therefore, at the termination of the cyanide leaching period, the leached ore and pore fluids in the columns would be representative of those anticipated to be present in the heap at the start of the cyanide destruction and rinsing stage.
2.2. Column cyanide destruction Testing Methods A total of eight 40-kg columns [three for each cyanide destruction method to provide statistically viable data sets at room temperature, and an additional column for each method operated at approximately 4° C to simulate site-specific kinetic concerns (seasonal variability)] were prepared for the metallurgical leaching procedure.
The metallurgical phase of the column tests was completed on June 26, 2012. These columns were then re-purposed for cyanide destruction testing. Two approaches were considered as alternatives for cyanide destruction: ex-situ chemical treatment and in-situ biological treatment as described in the following sections.
Leached solutions were sampled and analyzed for pH every one to four days and for WAD CN every five to seven days. Additionally, the leached solutions were sampled and analyzed for a full suite of parameters at three different points during the column test work: at the initiation of the cyanide destruct phase, at the approximate mid-point of the cyanide destruct test phase and at the conclusion of the test.
The parameters that were monitored are listed in Table 2.2-1 below. Analytical results are provided in full in Tables 2.2-2 through 2.2-10 and Figures 2.2-1 through 2.2-4. Detection limits for each parameter are also provided in Tables 2.2-2 through 2.2-10; these were set to ensure that the results were sufficiently sensitive for use in future analyses, modeling and design applications.
Table 2-1: Analytical Suite for Column Testing pH Carbonate Manganese* Sulphate Alkalinity Chloride Mercury* Thallium* Aluminum* Chromium* Molybdenum* Thiocyanate Ammonia Cobalt* Nickel* TKN Antimony* Copper* Nitrate Uranium* Arsenic* Cyanate Nitrite Vanadium* Barium* Cyanide, Total Phosphorus Zinc* Beryllium* Cyanide, WAD Potassium* Bicarbonate Fluoride Selenium* Boron* Iron* Silver* Cadmium* Lead* Sodium* Calcium* Magnesium* Strontium* *Analyzed in the dissolved form.

Cyanide Destruction Column Studies Report Eagle Gold Project Section 2.0 Current Testing Methodology
Tetra Tech March 13, 2014 4
Ex-situ Chemical Treatment 2.2.1.Ex-situ chemical treatment was used to provide destruction of cyanide into less toxic degradation products by copper-catalyzed oxidation with hydrogen peroxide. A detailed discussion of this treatment procedure has been provided in Attachment A of this appendix and is summarized below.
Ex-situ treatment was administered in two phases to a total of four columns (IDs 63310, 63313, and 63316 operated at room temperature, and 63322 operated at approximately 4°C). The initial phase was initiated on July 19, 2012 via the application of a chemical treatment process using a single dose of hydrogen peroxide (with copper catalyst) to oxidize cyanide to cyanate in the water circulated through the column. The treated water was recirculated through the column at a rate of approximately one pore volume per week (or as slowly as possible to maintain saturation), flushing additional cyanide from the pore waters until the WAD cyanide concentration in the column drainage decreased to <0.2 mg/L (the target WD CN concentration that was assumed to achieve compliance for free CN 1).
Prior to treatment, the final barren solution drained from the columns was submitted for analysis of all parameters listed in Table 2.2-1. The analytical results are provided in Table 2.2-2. During the circulation of the copper/hydrogen peroxide treated solution, the effluent was sampled daily for pH, and sampled approximately weekly for WAD cyanide analysis, as summarized in Table 2.2-3 and Figures 2.2-1 and 2.2-2. An additional sample was collected after three weeks of this phase of testing, and that analytical data are provided in Table 2.2-4.
Once the WAD cyanide in the column effluent decreased to < 0.2 mg/L (and additional testing confirmed that free cyanide had decreased to <0.015 mg/L) the hydrogen peroxide treatment process was discontinued. This goal was met on September 24, 2012 in the column operated in cold conditions (ID 63322, approximately 4° C), and on October 2, 2012 for the columns operated at room temperature conditions. Once the target concentrations were met, the columns were gravity drained and the water was tested for the full analytical suite listed in Table 2.2-1. The results of which are provided in Table 2.2-5.
1 Cyanide may be analyzed for free, WAD (which includes free plus weak complexes), or total (including strongly complexed with iron or cobalt). However, the concentration of free cyanide tends to drop to below the detection limit very rapidly so is not very useful for determining progress of cyanide destruction. Strongly complexed cyanide is not treated with peroxide oxidation, but is also very unreactive and is, therefore, not susceptible to leaching. Therefore, WAD cyanide is the most useful measure of cyanide destruction progress. Although water quality standards are based on free cyanide, the weak complexes of cyanide have the potential to break down to free cyanide so are a more appropriate indicator of compliance with the Water Quality Standards.

Cyanide Destruction Column Studies Report Eagle Gold Project Section 2.0 Current Testing Methodology
Tetra Tech March 13, 2014 5
Table 2-2: Initial Leachate Water Quality, Pre-cyanide Detoxification, All Columns
Constituent Unit 63310 63313 63316 63301 63304 63307 63322* 63319* Average Median STD DEV
pH pH Units 9.36 9.48 9.51 9.51 9.45 9.57 9.81 9.91 9.58 9.51 0.188 Bicarbonate (HCO3) mg/L 540 650 690 460 470 590 330 320 506 505 137 Carbonate (CO3) mg/L 100 140 190 150 130 180 180 220 161 165 38 Hydroxide (OH) mg/L <1.0 <1.0 <1.0 <1.0 <1.0 <1.0 <1.0 <1.0 <1.0 <1.0 N/A
Total Alkalinity mg/L as CaCO3 620 770 890 620 600 780 560 620 683 620 116
Total Kjeldahl Nitrogen mg/L 120 110 140 89 120 130 78 70 107 115 25
Total Nitrogen mg/L 120 120 140 89 120 130 81 180 123 120 31 Total Dissolved Solids (TDS) mg/L 1900 2200 2300 1700 1800 2100 2000 1300 1913 1950 318
Chloride mg/L 25 42 30 32 24 28 390 55 78 31 126 Fluoride mg/L 4.4 4.8 4.4 4.1 4.4 4.7 2.8 3.1 4.1 4.4 0.7 Sulfate mg/L 290 290 270 210 260 280 260 340 275 275 37 Nitrate Nitrogen mg/L
0.82 0.87 0.76 0.75 0.71 0.90 2.6 3.3 1.34 0.85 1.01 Nitrite Nitrogen mg/L Aluminum mg/L 1.4 2.1 2.0 1.8 1.5 1.8 0.71 0.94 1.53 1.65 0.50 Barium mg/L 0.051 0.100 0.058 0.037 0.033 0.051 0.047 0.059 0.055 0.051 0.021 Beryllium mg/L <0.0010 <0.0010 <0.0010 <0.0010 <0.0010 <0.0010 <0.0010 <0.0010 <0.0010 <0.0010 N/A Bismuth mg/L <0.10 <0.10 <0.10 <0.10 <0.10 <0.10 <0.10 <0.10 <0.10 <0.10 N/A Boron mg/L 0.11 0.11 0.12 0.16 0.17 0.18 0.24 0.05 0.14 0.14 0.06 Cadmium mg/L 0.0067 0.0097 0.0055 0.01 0.01 0.01 0.0082 0.0099 0.0088 0.0090 0.0026 Calcium mg/L 65 240 58 29.00 29.00 57.00 100 120 87 62 69 Chromium mg/L 0.0053 0.0081 0.0067 0.0053 0.0025 0.0068 0.0095 0.011 0.0069 0.0068 0.0027 Cobalt mg/L 0.26 0.25 0.27 0.17 0.21 0.21 0.13 0.13 0.20 0.21 0.06 Copper mg/L 4.0 4.7 3.9 3.2 4.8 5.0 2.2 3 3.9 4.0 1.0 Gallium mg/L <0.10 <0.10 <0.10 <0.10 <0.10 <0.10 <0.10 <0.10 <0.10 <0.10 N/A Iron mg/L 8.7 7.6 7 11 8.9 12 4.7 3.4 7.9 8.2 2.9 Lithium mg/L <0.10 <0.10 <0.10 <0.10 <0.10 <0.10 <0.10 <0.10 <0.10 <0.10 N/A Magnesium mg/L 0.25 0.65 0.25 0.25 0.25 0.25 1.7 0.57 0.52 0.25 0.50 Manganese mg/L 0.022 0.0025 0.032 0.04 0.02 0.04 0.23 0.027 0.052 0.030 0.073 Molybdenum mg/L 0.15 0.15 0.14 0.09 0.13 0.14 0.08 0.058 0.117 0.135 0.036 Nickel mg/L 0.029 0.048 0.035 0.030 0.061 0.053 0.056 0.14 0.057 0.051 0.036 Phosphorus mg/L 0.25 0.98 0.70 0.25 0.25 0.56 1 1 0.52 0.57 0.26

Cyanide Destruction Column Studies Report Eagle Gold Project Section 2.0 Current Testing Methodology
Tetra Tech March 13, 2014 6
Constituent Unit 63310 63313 63316 63301 63304 63307 63322* 63319* Average Median STD DEV
Potassium mg/L 7.6 9.1 12 7.3 8.1 8.2 8.6 6 8.4 8.2 1.7 Scandium mg/L <0.10 <0.10 <0.10 <0.10 <0.10 <0.10 <0.10 <0.10 <0.10 <0.10 N/A Silver mg/L <0.0050 <0.0050 <0.0050 <0.0050 <0.0050 <0.0050 <0.0050 <0.0050 <0.0050 <0.0050 N/A Sodium mg/L 710 800 840 610 680 760 750 490 705 730 112 Strontium mg/L 0.99 3.8 0.92 0.45 0.49 0.86 1.8 2.1 1.43 0.96 1.12 Tin mg/L <0.10 <0.10 <0.10 <0.10 <0.10 <0.10 <0.10 <0.10 <0.10 <0.10 N/A Titanium mg/L <0.10 <0.10 0.1 <0.10 <0.10 <0.10 <0.10 <0.10 <0.10 <0.10 N/A Vanadium mg/L 0.18 0.24 0.23 0.20 0.20 0.22 0.16 0.19 0.20 0.20 0.03 Zinc mg/L 1.4 2.3 1.2 1.3 4.5 3.7 4.5 3.7 2.8 3.0 1.4 Mercury mg/L 0.0035 0.0041 0.0041 0.0034 0.0037 0.0037 0.0032 0.0026 0.0035 0.0036 0.0005 Antimony mg/L 1.4 1.4 1.4 1.2 1.3 1.3 0.63 0.62 1.16 1.30 0.34 Arsenic mg/L 17 19 17 15 17 17 11 12 16 17 3 Lead mg/L 0.21 0.32 0.26 0.23 0.18 0.24 0.082 0.17 0.212 0.220 0.070 Selenium mg/L 0.044 0.052 0.041 0.040 0.048 0.046 0.023 0.031 0.041 0.043 0.009 Thallium mg/L <0.0010 <0.0010 <0.0010 <0.0010 <0.0010 <0.0010 <0.0010 <0.0010 <0.0010 <0.0010 N/A Cyanate mg/L 170 160 220 120 160 180 160 120 161 160 32 Thiocyanate mg/L 56 55 60 41 54 56 42 37 50 55 9 Ammonia, as Nitrogen mg/L 29 78 28 71 67 75 74 60 60 69 20
WAD CN** mg/L 12.37 22.2 23.53 13.56 13.56 8.64 14.62 19.68 16.02 14.09 5.21 * Columns will be refrigerated during detoxification, but have been operated at room temperature to this point. **All analytes are reported for sampled collected on or about June 30, 2012. WAD CN analysis was performed on a sample collected the first day of detoxification on July 13, 2012. Text in RED is reported at one-half of the detection limit to allow for calculation of average, mean, and standard deviation. For analytes where all analyses were below laboratory detection limits, the concentration, average, and mean were reported as less than the method detection limit.

Cyanide Destruction Column Studies Report Eagle Gold Project Section 2.0 Current Testing Methodology
Tetra Tech March 13, 2014 7
Table 2-3: Ex-situ Chemical Detoxification Data Summary, pH and WAD CN
pH WAD CN, mg/L Detox Days 63310 63313 63316 63322* 63310 63313 63316 63322*
0 9.8 9.9 9.9 10.0 13.56 13.56 8.64 14.62
1 9.5 9.7 9.5 10.2 -- -- -- -- 4 9.5 9.6 9.7 10.0 -- -- -- -- 5 9.4 9.6 9.7 10.0 -- -- -- -- 6 9.6 9.7 9.7 10.0 -- -- -- -- 7 9.3 9.4 9.5 9.7 0.80 2.26 1.60 9.57
8 9.3 9.3 9.6 9.8 -- -- -- -- 10 9.1 9.2 9.8 9.7 -- -- -- -- 11 9.4 9.5 9.5 9.8 -- -- -- -- 12 9.4 9.5 9.5 9.7 -- -- -- -- 13 9.1 9.3 9.4 9.5 1.33 0.53 0.93 9.04
14 9.0 9.2 9.3 9.5 -- -- -- -- 17 8.9 9.1 9.1 9.5 -- -- -- -- 18 9.0 9.1 9.0 9.5 -- -- -- -- 19 8.9 8.9 9.0 9.3 -- -- -- -- 20 8.9 9.0 9.0 9.3 0.83 0.31 0.31 7.34
21 8.8 8.9 9.0 9.3 -- -- -- -- 24 9.0 9.1 9.0 9.3 -- -- -- -- 25 8.8 8.8 8.9 9.4 -- -- -- -- 26 8.8 8.9 8.9 9.3 -- -- -- -- 27 8.9 9.0 9.1 9.3 0.47 0.31 0.26 6.4
28 8.9 9.0 9.1 9.3 -- -- -- -- 31 9.0 9.1 9.1 9.2 -- -- -- -- 32 8.9 8.9 9.0 9.2 -- -- -- -- 33 8.9 8.9 8.9 9.2 -- -- -- -- 34 8.9 8.9 8.9 9.1 0.42 0.31 0.36 5.83
35 8.8 8.9 8.9 9.1 -- -- -- --

Cyanide Destruction Column Studies Report Eagle Gold Project Section 2.0 Current Testing Methodology
Tetra Tech March 13, 2014 8
pH WAD CN, mg/L Detox Days 63310 63313 63316 63322* 63310 63313 63316 63322*
38 8.9 9.0 9.0 9.1 -- -- -- -- 39 8.9 9.0 9.1 9.2 -- -- -- -- 40 8.8 8.8 9.0 9.0 0.31 0.26 0.31 2.13
42 8.9 9.0 9.1 9.2 -- -- -- -- 46 9.0 9.1 9.2 9.1 -- -- -- -- 48 8.8 8.9 8.9 9.0 0.26 0.26 0.26 1.04
52 9.0 9.0 9.1 9.0 -- -- -- -- 54 8.9 9.0 9.0 9.0 0.21 0.26 0.26 0.88
56 8.8 8.9 8.9 8.9 -- -- -- -- 59 9.0 9.1 9.1 9.0 0.24 0.26 0.24 0.73
61 8.9 9.0 9.0 9.0 -- -- -- -- 63 9.0 9.0 9.0 9.0 -- -- 0.26 --
66 9.0 9.1 9.0 9.0 0.26 0.21 -- 0.16
68 8.9 9.0 9.1 8.9 -- -- <0.10 --
74 9.0 9.2 -- 8.9 0.16 0.10 0.16 0.16
80 -- -- -- -- <0.10 <0.10 -- -- * Operated at 4° C.

Cyanide Destruction Column Studies Report Eagle Gold Project Section 2.0 Current Testing Methodology
Tetra Tech March 13, 2014 9
Table 2-4: Mid-Point Leachate Water Quality, Ex-Situ Chemical Detoxification Columns
Constituent Unit 63310 63313 63316 Average Median STD DEV 63322* % Difference
From Room Temp. Columns pH pH Units 9.1 9.3 9.4 9.3 9.3 0.2 9.5 2.15 Total Kjeldahl Nitrogen mg/L 100 100 100 100 100 0 85 -15.00 Total Nitrogen mg/L 140 140 150 143 140 6 130 -7.14 Nitrate Nitrogen mg/L 32 33 41 35 33 5 36 9.09 Nitrite Nitrogen mg/L 3.1 1.9 2.0 2.3 2.0 0.7 4.1 105.00 Aluminum mg/L 5.6 5.9 5.5 5.7 5.6 0.2 1.4 -75.00 Barium mg/L 0.068 0.078 0.079 0.075 0.078 0.006 0.025 -67.95 Beryllium mg/L <0.0010 <0.0010 <0.0010 <0.0010 <0.0010 N/A <0.0010 0 Bismuth mg/L <0.10 <0.10 <0.10 <0.10 <0.10 N/A <0.10 0 Boron mg/L 0.19 0.17 0.15 0.17 0.17 0.02 0.22 29.41 Cadmium mg/L 0.0012 0.0021 0.0015 0.0016 0.0015 0.0005 0.0005 -66.67 Calcium mg/L 17 16 16 16 16 1 11 -31.25 Chromium mg/L 0.0093 0.010 0.010 0.010 0.010 0.000 0.0055 -45.00 Cobalt mg/L 0.41 0.42 0.40 0.41 0.41 0.01 0.18 -56.10 Copper mg/L 0.15 0.18 0.23 0.19 0.18 0.04 7.0 3788.89 Gallium mg/L <0.10 <0.10 <0.10 <0.10 <0.10 N/A <0.10 0 Iron mg/L 3.5 4.6 3.9 4.0 3.9 0.6 1.2 -69.23 Lithium mg/L <0.10 <0.10 <0.10 <0.10 <0.10 N/A 0.12 140.00 Magnesium mg/L 0.55 0.62 1.25 0.81 0.62 0.39 0.58 -6.45 Manganese mg/L 0.065 0.085 0.068 0.073 0.068 0.011 0.016 -76.47 Molybdenum mg/L 0.18 0.20 0.18 0.19 0.18 0.01 0.10 -44.44 Nickel mg/L <0.010 <0.010 <0.010 <0.010 <0.010 N/A 0.18 3500.00 Phosphorus mg/L 0.52 0.66 0.70 0.63 0.66 0.09 0.56 -15.15 Potassium mg/L 7.2 9.6 12 10 10 2 9.3 -3.12 Scandium mg/L <0.10 <0.10 <0.10 <0.10 <0.10 N/A <0.10 0 Silver mg/L <0.0050 <0.0050 <0.0050 <0.0050 <0.0050 N/A 0.0053 112.00 Sodium mg/L 780 890 880 850 880 61 860 -2.27 Strontium mg/L 0.25 0.25 0.26 0.25 0.25 0.01 0.20 -20.00 Tin mg/L <0.10 <0.10 <0.10 <0.10 <0.10 N/A <0.10 0 Titanium mg/L 0.25 0.26 0.27 0.26 0.26 0.01 <0.10 -80.77

Cyanide Destruction Column Studies Report Eagle Gold Project Section 2.0 Current Testing Methodology
Tetra Tech March 13, 2014 10
Constituent Unit 63310 63313 63316 Average Median STD DEV 63322* % Difference
From Room Temp. Columns Vanadium mg/L 0.065 0.083 0.096 0.081 0.083 0.016 0.058 -30.12 Zinc mg/L 0.093 0.14 0.13 0.12 0.13 0.02 0.067 -48.46 Mercury mg/L 0.010 0.0095 0.0090 0.0095 0.0095 0.0005 0.0073 -23.16 Antimony mg/L 1.9 2.0 2.0 2.0 2.0 0.1 0.74 -63.00 Arsenic mg/L 18 20 19 19 19 1 11 -42.11 Lead mg/L 0.61 0.62 0.57 0.60 0.61 0.03 0.19 -68.85 Selenium mg/L 0.063 0.067 0.062 0.064 0.063 0.003 0.045 -28.57 Thallium mg/L <0.010 <0.010 <0.010 <0.010 <0.010 N/A <0.010 0 Cyanate mg/L 140 140 170 150 140 17 170 21.43 Thiocyanate mg/L 70 68 66 68 68 2 82 20.59 Ammonia, as Nitrogen mg/L 99 81 91 90 91 9 81 -10.99 WAD CN mg/L 1.33 0.53 0.93 0.93 0.93 0.40 9.04 872.04 Data collected 8/2/2012 * Operated at 4° C. Text in RED is reported at one-half of the detection limit to allow for calculation of average, mean, and standard deviation. For analytes where all analyses were below laboratory detection limits, the concentration, average, and mean were reported as less than the method detection limit.

Cyanide Destruction Column Studies Report Eagle Gold Project Section 2.0 Current Testing Methodology
Tetra Tech March 13, 2014 11
Table 2-5: Final Detoxification Leachate Water Quality, Ex-Situ Chemical Detoxification Columns
Constituent Unit 63310 63313 63316 Average Median STD DEV 63322* % Difference from
Room Temp. Columns
pH pH Units 8.85 9.12 8.96 8.98 8.96 0.14 8.80 -1.79 Acidity (Titrimetric) mg/L as CaCO3 -1.4 -- -111 -56.2 -56.2 77.5 -- N/A Bicarbonate (HCO3) mg/L 690 710 640 680 690 36 590 -14.49 Carbonate (CO3) mg/L 58 110 69 79 69 27 32 -53.62 Hydroxide (OH) mg/L <1.0 <1.0 <1.0 <1.0 <1.0 N/A <1.0 0 Total Alkalinity mg/L as CaCO3 660 770 640 690 660 70 540 -18.18 Redox Potential mV 250 -- -- 250 250 0 -- N/A Total Kjeldahl Nitrogen mg/L 23 -- 36 29.5 29.5 9.2 100 238.98 Total Nitrogen mg/L 260 -- -- 260 260 0 310 19.23 Total Dissolved Solids (TDS) mg/L 4100 -- 3900 4000 4000 141 3500 -12.50 Electrical Conductivity µmhos/cm 5600 7600 5800 6333 5800 1102 -- N/A Chloride mg/L 45 90 58 64 58 23 560 865.52 Fluoride mg/L 3.6 3.6 4.3 3.8 3.6 0.4 1.8 -50.00 Sulfate mg/L 1000 1400 1200 1200 1200 200 470 -60.83 Nitrate Nitrogen mg/L 250 350 300 300 300 50 -- N/A Nitrite Nitrogen mg/L 4 0.61 5.1 3.2 4.0 2.3 -- N/A Aluminum mg/L 1.3 0.93 0.75 0.99 0.93 0.28 0.15 -83.87 Barium mg/L 0.038 0.053 0.027 0.039 0.038 0.013 0.022 -42.11 Beryllium mg/L <0.0010 <0.0010 <0.0010 <0.0010 <0.0010 N/A <0.0010 0 Bismuth mg/L <0.10 <0.10 <0.10 <0.10 <0.10 N/A <0.10 0 Boron mg/L 0.18 0.19 0.16 0.18 0.18 0.02 0.25 38.89 Cadmium mg/L <0.0010 -- <0.0010 <0.0010 <0.0010 N/A <0.0010 0 Calcium mg/L 14 14 7.2 12 14 4 11 -21.43 Chromium mg/L <0.0050 <0.0050 <0.0050 <0.0050 <0.0050 N/A <0.0050 0 Cobalt mg/L 0.57 0.66 0.48 0.57 0.57 0.09 0.19 -66.67 Copper mg/L 0.09 0.09 0.071 0.08 0.09 0.01 0.078 -13.33 Gallium mg/L <0.10 <0.10 <0.10 <0.10 <0.10 N/A <0.10 0 Iron mg/L 0.48 0.49 0.43 0.47 0.48 0.03 0.16 -66.67 Lithium mg/L <0.10 <0.10 <0.10 <0.10 <0.10 N/A 0.22 340.00 Magnesium mg/L 2 -- 1.6 1.8 1.8 0.3 3.7 105.56 Manganese mg/L 0.017 0.015 0.011 0.014 0.015 0.003 <0.0050 -83.33

Cyanide Destruction Column Studies Report Eagle Gold Project Section 2.0 Current Testing Methodology
Tetra Tech March 13, 2014 12
Constituent Unit 63310 63313 63316 Average Median STD DEV 63322* % Difference from
Room Temp. Columns
Molybdenum mg/L 0.27 0.32 0.24 0.28 0.27 0.04 0.12 -55.56 Nickel mg/L <0.010 <0.010 <0.010 <0.010 <0.010 N/A <0.010 0 Phosphorus mg/L <0.50 <0.50 <0.50 <0.50 <0.50 N/A <0.50 0 Potassium mg/L 14 21 17 17 17 4 16 -5.88 Scandium mg/L <0.10 <0.10 <0.10 <0.10 <0.10 N/A <0.10 0 Silver mg/L <0.0050 <0.0050 <0.0050 <0.0050 <0.0050 N/A <0.0050 0 Sodium mg/L 1200 1800 1300 1433 1300 321 1500 15.38 Strontium mg/L 0.46 0.63 0.34 0.48 0.46 0.15 0.40 -13.04 Tin mg/L <0.10 <0.10 <0.10 <0.10 <0.10 N/A <0.10 0 Titanium mg/L <0.10 <0.10 <0.10 <0.10 <0.10 N/A <0.10 0 Vanadium mg/L 0.024 0.024 0.029 0.026 0.024 0.003 0.016 -33.33 Zinc mg/L 0.026 0.031 0.017 0.025 0.026 0.007 <0.010 -80.77 Mercury mg/L 0.0057 0.004 0.0041 0.0046 0.0041 0.0010 0.0023 -43.90 Antimony mg/L 1.6 2 1.7 1.8 1.7 0.2 0.63 -62.94 Arsenic mg/L 5.4 4.7 5.1 5.1 5.1 0.4 2.7 -47.06 Lead mg/L 0.13 0.081 0.054 0.088 0.081 0.039 0.018 -77.78 Selenium mg/L 0.039 0.044 0.038 0.040 0.039 0.003 <0.0050 -93.59 Thallium mg/L <0.0010 <0.0010 <0.0010 <0.0010 <0.0010 N/A <0.0010 0 Cyanate mg/L 19 11 31 20 19 10 170 794.74 Thiocyanate mg/L 69 93 59 74 69 17 45 -34.78 Ammonia, as Nitrogen mg/L 26 12 29 22 26 9 97 273.08 WAD CN mg/L <0.10 <0.10 <0.10 <0.10 <0.10 N/A 0.16 68.75 Data collected 11/11/2012 * Operated at 4° C. Text in RED is reported at one-half of the detection limit to allow for calculation of average, mean, and standard deviation. For analytes where all analyses were below laboratory detection limits, the concentration, average, and mean were reported as less than the method detection limit.

Cyanide Destruction Column Studies Report Eagle Gold Project Section 2.0 Current Testing Methodology
Tetra Tech March 13, 2014 13
The second phase involved the addition of simulated rinse water to further flush metals and other compounds from the columns. After the columns had been drained following the first phase of treatment, two mock rinse solutions were used to compare their rinse effectiveness.
Two columns (ID 63310 and 63313) were subjected to rinsate solution consisting of deionized water. The rinsing phase was initiated immediately after the initial treatment solutions were drained and completed. The other two columns (ID 63316 and 63322) were subjected to a mock rinse solution consisting of various major ions as listed in Table 2.2-6 as a surrogate for water available at the site.
Rinsing was continuous until a target WAD cyanide concentration of <0.1 mg/L and a target ammonia concentration of <10 mg/L were attained. At that time, the columns were again drained and the rinsate solution tested for the full analytical suite as listed in Table 2.1-2, the results of which are provided in Table 2.2-7.
Table 2-6: Mock MWTP Effluent Rinse Solution Constituent Concentration in mg/L
Cl- 100 SO4
2- 1300 Ca2+ 20 Na+ 930
HCO3- 700
In a full scale application, excess water would be drained from the heap and treated as described above as the rinse water is added to the top of the heap.
Table 2-7: Rinsate Water Quality, Chemical Detoxification Columns
Constituent Unit Distilled Water Rinse Mock Rinse Solution
63310 63313 63316 63322* pH pH Units 8.56 8.80 8.68 8.77 Acidity (Titrimetric) mg/L as CaCO3 -188 -135 -158 -179 Bicarbonate (HCO3) mg/L 550 530 680 740 Carbonate (CO3) mg/L 14 33 36 50 Hydroxide (OH) mg/L <1.0 <1.0 <1.0 <1.0 Total Alkalinity mg/L as CaCO3 470 490 620 690 Redox Potential mV 280 280 300 250 Total Kjeldahl Nitrogen mg/L 13 24 30 29 Total Nitrogen mg/L 130 110 31 31 Total Dissolved Solids (TDS) mg/L 1600 1500 2800 2900 Electrical Conductivity µmhos/cm 2400 2400 4200 4500 Chloride mg/L 9.1 17 79 160 Fluoride mg/L 2.1 3.1 2.2 1.5 Sulfate mg/L 220 310 1000 1000 Nitrate Nitrogen mg/L
110 84 58 33
Nitrite Nitrogen mg/L 1.8 1.8 Aluminum mg/L 0.74 0.88 1.7 0.94 Barium mg/L 0.016 0.014 0.040 0.035 Beryllium mg/L <0.0010 <0.0010 <0.0004 <0.0004 Bismuth mg/L <0.10 <0.10 <0.075 <0.075 Boron mg/L 0.11 0.11 0.11 0.20

Cyanide Destruction Column Studies Report Eagle Gold Project Section 2.0 Current Testing Methodology
Tetra Tech March 13, 2014 14
Constituent Unit Distilled Water Rinse Mock Rinse Solution
63310 63313 63316 63322* Cadmium mg/L <0.0010 <0.0010 <0.0002 <0.0002 Calcium mg/L 6.7 3.7 24 31 Chromium mg/L <0.0050 <0.0050 0.0026 0.0030 Cobalt mg/L 0.10 0.13 0.095 0.043 Copper mg/L 0.54 0.84 23 1.3 Gallium mg/L <0.10 <0.10 <0.020 <0.020 Iron mg/L 0.36 0.51 0.92 0.78 Lithium mg/L <0.10 <0.10 0.02 0.19 Magnesium mg/L 0.72 <0.50 1.2 3.6 Manganese mg/L 0.0093 0.011 0.028 0.030 Molybdenum mg/L 0.059 0.071 0.068 0.024 Nickel mg/L <0.010 <0.010 0.004 0.009 Phosphorus mg/L <0.50 <0.50 0.57 0.32 Potassium mg/L 5.8 5.9 12 12 Scandium mg/L <0.10 <0.10 0.0010 <0.0010 Silver mg/L <0.0050 <0.0050 0.0008 0.0027 Sodium mg/L 500 480 1000 1000 Strontium mg/L 0.15 <0.10 0.43 0.57 Tin mg/L <0.10 <0.10 <0.010 <0.010 Titanium mg/L <0.10 <0.10 0.04 0.02 Vanadium mg/L 0.011 0.026 0.034 0.021 Zinc mg/L 0.050 0.027 0.087 0.075 Mercury mg/L 0.0016 <0.0010 <0.0007 <0.0007 Antimony mg/L 0.87 0.91 0.99 0.47 Arsenic mg/L 4.1 5.2 7.3 3.3 Lead mg/L 0.064 0.073 0.18 0.090 Selenium mg/L 0.0085 0.020 0.019 0.010 Thallium mg/L <0.0010 <0.0010 <0.0002 <0.0002 Cyanate mg/L 7.1 4.9 2.5 28 Thiocyanate mg/L 17 20 18 9.0 Ammonia, as Nitrogen mg/L 0.95 3.7 13 13 Cyanide, Total mg/L 0.38 1.1 0.60 0.34 Cyanide, WAD mg/L 0.047 <0.025 0.040 0.090 Silicon mg/L — — 17 16 Uranium mg/L — — 0.24 0.17 Total Organic Carbon mg/L 13.0 15.0 — — Data collected 12/12/2012 after approximately 30 days of rinsing. * Operated at 4° C.
In-situ Biological Treatment 2.2.2.The objective of in-situ biological treatment is the destruction of cyanide into less toxic degradation products, using microbially mediated processes. A detailed discussion of this treatment procedure has been provided in Attachment B of this appendix and is summarized below.
In-situ treatment uses a biologically mediated process in which a supplemental reduced carbon syrup is added to the heap to degrade cyanide and to generate microbial growth within the heap. The reduced carbon promotes a direct consumption of free cyanide and some weak

Cyanide Destruction Column Studies Report Eagle Gold Project Section 2.0 Current Testing Methodology
Tetra Tech March 13, 2014 15
cyanide complexes by the formation of non-toxic cyanohydrins. Subsequent degradation of the cyanohydrins and other nitrogen forms is supported by excess carbon (over what is required to react with free and weak complexes of cyanide) because the additional carbon generates a fine biofilm on the heap particles that incorporates the reduced nitrogen compounds (cyanohydrins, ammonia). Reduction in metal concentrations is also commonly observed as a result of the reducing conditions established during microbial metabolic processes, because many metals are less soluble in a reduced state (chromium, copper, selenium, uranium, for instance). Other metals that preferentially sorb to iron or manganese oxides in a more neutral pH range created during the cyanide destruction process will generally decrease, including trace metals such as arsenic and antimony.
A total of four columns were treated biologically (IDs 63301, 63304, and 63307 were operated at room temperature; ID 63319 was operated at approximately 4°C). The material in the columns used for biological treatment were sampled prior to initiating the test phase and the sample subjected to a hot water rinse which was analyzed for initial quantities of total nitrogen and metals compounds. The results of the initial sampling event are provided in Table 2.2-2. The biological process was initiated on July 13, 2012 by the addition of 24.25 g of the reduced carbon syrup (as GWS-BCY3 syrup, a blend of molasses, fructose, ethanol, methanol, and trace phosphorous) at the end of the leaching cycle. The flow rate in the column was no greater than one pore volume exchanged per week, to allow for consumption of the supplemental carbon within the column. During the circulation of the solution, the effluent was sampled typically daily for pH, and sampled approximately weekly for WAD cyanide analysis, as summarized in Table 2.2-8 and Figures 2.2-3 and 2.2-4.

Cyanide Destruction Column Studies Report Eagle Gold Project Section 2.0 Current Testing Methodology
Tetra Tech March 13, 2014 16
Table 2-8: In-Situ Biological Detoxification Data Summary, pH and WAD Cyanide
pH WAD CN, mg/L Detox Days 63301 63304 63307 63319* 63301 63304 63307 63319*
0 9.9 9.9 9.9 10.1 12.37 22.2 23.53 19.68 3 9.8 9.3 9.4 10.1 -- -- -- -- 4 9.5 9.3 9.5 9.9 -- -- -- -- 5 9.5 9.4 9.5 10.0 -- -- -- -- 6 9.6 9.4 9.6 9.9 -- -- -- -- 7 9.5 9.2 9.5 10.0 -- -- -- -- 10 9.4 9.1 9.3 9.8 -- -- -- -- 11 9.5 9.3 9.6 9.7 -- -- -- -- 12 9.8 9.6 9.8 10.0 -- -- -- -- 13 9.4 9.3 9.4 9.8 -- -- -- -- 14 9.4 9.3 9.4 9.7 -- -- -- -- 17 9.4 9.3 9.4 9.4 2.66 2.66 2.13 9.31 18 9.2 9.3 9.4 9.4 -- -- -- -- 19 9.0 9.1 9.2 9.4 -- -- -- -- 20 9.0 9.1 9.2 9.3 -- -- -- -- 21 9.1 9.2 9.3 9.3 -- -- -- -- 24 9.2 9.2 9.2 9.4 -- -- -- -- 25 9.2 9.2 9.2 9.3 -- -- -- -- 26 9.1 9.1 9.2 9.1 -- -- -- -- 27 9.0 9.1 9.2 9.1 -- -- -- -- 28 9.0 9.1 9.1 9.0 -- -- -- -- 31 9.1 9.1 9.2 9.1 -- -- -- -- 32 9.0 9.1 9.2 9.1 -- -- -- -- 33 9.0 9.1 9.2 9.0 -- -- -- -- 34 9.1 9.2 9.2 9.1 -- -- -- -- 35 9.0 9.0 9.2 9.1 -- -- -- -- 38 9.1 9.2 9.2 9.1 0.88 0.73 2.26 2.86 39 9.1 9.1 9.2 9.1 -- -- -- -- 40 9.0 9.1 9.2 9.0 -- -- -- -- 41 9.0 9.1 9.2 9.1 -- -- -- -- 42 9.0 9.1 9.2 9.1 -- -- -- -- 45 9.1 9.1 9.3 9.2 0.57 0.62 0.73 2.71 46 9.1 9.1 9.2 9.2 -- -- -- -- 47 8.9 9.0 9.0 9.0 -- -- -- -- 49 9.1 9.1 9.2 9.1 -- -- -- -- 53 8.8 9.2 9.3 9.2 -- -- -- -- 55 9.0 9.1 9.1 9.1 0.57 0.31 0.52 1.20 59 9.1 9.1 9.3 9.1 -- -- -- -- 61 9.2 9.2 9.2 9.1 0.57 0.73 1.14 2.03 63 8.9 9.1 9.2 9.0 -- -- -- -- 66 9.0 8.9 9.3 9.1 0.48 0.66 0.73 1.73 68 9.1 9.1 9.3 9.1 -- -- -- -- 73 9.0 9.3 9.3 9.2 0.78 0.62 0.62 0.42 75 9.1 8.8 9.3 9.2 -- -- -- -- 80 9.3 9.1 9.3 9.0 0.68 0.52 0.42 0.31 84 9.3 9.1 9.3 9.1 -- -- -- -- 87 -- 9.2 9.3 8.8 0.52 0.42 0.42 0.31
Cyanide Destruction Column Studies Report Eagle Gold Project Section 2.0 Current Testing Methodology
Tetra Tech March 13, 2014 17
pH WAD CN, mg/L Detox Days 63301 63304 63307 63319* 63301 63304 63307 63319*
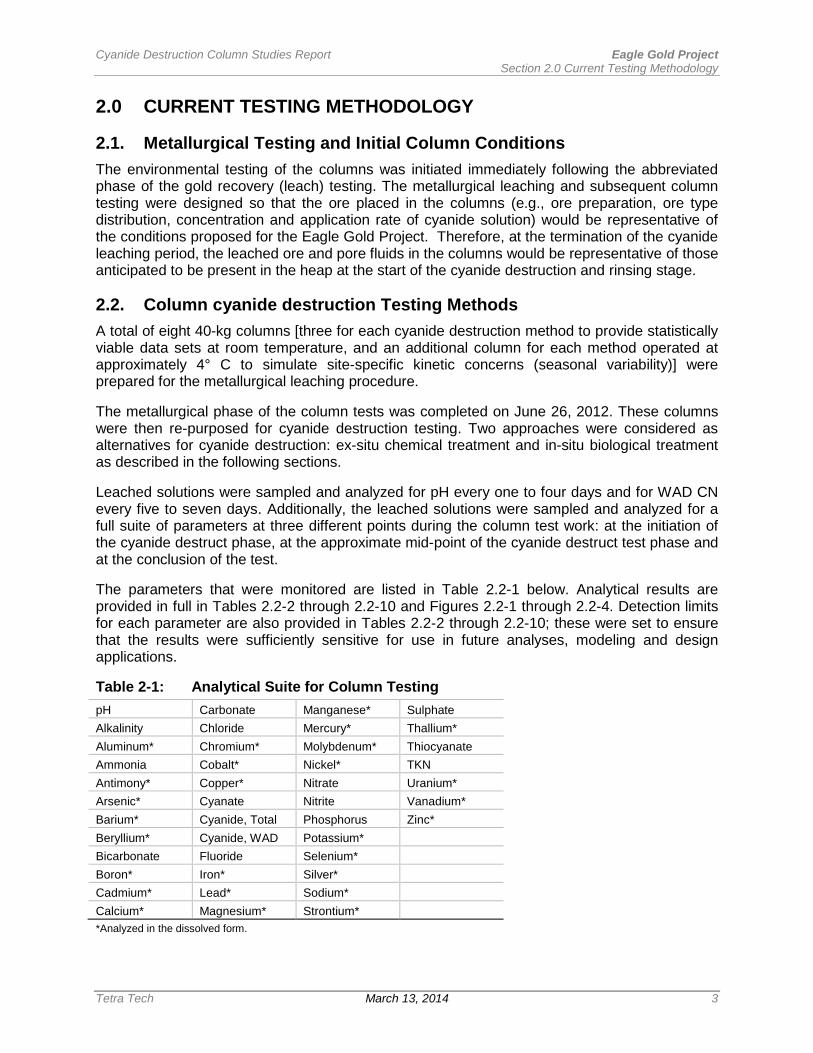
102 -- -- -- -- 1.3 0.62 0.84 0.26 143 -- -- -- -- 0.24 0.25 0.32 0.1 181 -- -- -- -- -- 0.14 0.14 0.24 188 -- -- -- -- -- 0.43 0.62 0.24 193 -- -- -- -- -- 0.08 0.068 0.032 202 -- -- -- -- -- 0.26 0.32 0.065 210 -- -- -- -- -- 0.33 1.1 0.47 218 -- -- -- -- -- 0.345 -- --
* Operated at 4° C. Because target WAD CN concentrations were not attained after approximately four months of column operation, a second dose of supplemental carbon was added to each of the columns on November 15, 2012 to provide additional metabolites to the microbial population and further reduce the WAD CN concentration to <0.2 mg/L as follows:
ID 63301 – 17 mLs ID 63304 – 22 mLs ID 63307 – 25 mLs • ID 63319 – 7 mLs
Due to time constraints, one of the columns (ID 63301) was drained and submitted for humidity cell testing on December 3, 2012 prior to reaching the target WAD CN concentration. Column 63301 contained 0.26 mg/L WAD CN at the time the column was drained. The remaining two room temperature columns (IDs 63304 and 63307) and the cold temperature column (ID 63319) continued to operate. An additional sample was collected for analysis, as provided in Table 2.2-9.

Cyanide Destruction Column Studies Report Eagle Gold Project Section 2.0 Current Testing Methodology
Tetra Tech March 13, 2014 18
Table 2-9: Mid-Point Detoxification Water Quality, In-Situ Biological Detoxification Columns
Constituent Unit 63301 63304 63307 Average Median STD DEV 63319* % Difference
from Room Temp. Columns
pH pH Units 8.8 8.66 8.71 8.72 8.71 0.07 8.77 0.69 Acidity (Titrimetric) mg/L as CaCO3 -163 -- -- -163 -163 N/A -- N/A Bicarbonate (HCO3) mg/L 1200 1100 1500 1267 1200 208 910 -24.17 Carbonate (CO3) mg/L 65 47 69 60 65 12 47 -27.69 Hydroxide (OH) mg/L <1.0 <1.0 <1.0 <1.0 <1.0 N/A <1.0 0 Total Alkalinity mg/L as CaCO3 1100 1000 1300 1133 1100 153 820 -25.45 Redox Potential mV 230 240 210 227 230 0 140 -39.13 Total Kjeldahl Nitrogen mg/L 0.15 7.6 15 7.6 7.6 7.4 7.1 -6.58 Total Nitrogen mg/L 0.15 9 17 9 9 0 0.76 -91.56 Total Dissolved Solids (TDS) mg/L 2600 2500 2800 2633 2600 153 2000 -23.08 Electrical Conductivity µmhos/cm 4100 4100 4400 4200 4100 173 3700 -9.76 Chloride mg/L 27 22 26 25 26 3 650 2400.00 Fluoride mg/L 1.6 2.1 2.3 2.0 2.1 0.4 1.8 -14.29 Sulfate mg/L 950 1100 1000 1017 1000 76 190 -81.00 Nitrate Nitrogen mg/L 0.5 0.5 2.1 1.0 0.5 0.9 0.5 0 Nitrite Nitrogen mg/L 0.125 9 0.29 3.1 0.3 5.1 0.76 162.07 Aluminum mg/L 0.7 1.1 0.73 0.84 0.73 0.22 0.23 -68.49 Barium mg/L 0.031 0.036 0.031 0.033 0.031 0.003 0.016 -48.39 Beryllium mg/L <0.0010 <0.0010 <0.0010 <0.0010 <0.0010 N/A <0.0010 0 Bismuth mg/L <0.10 <0.10 <0.10 <0.10 <0.10 N/A <0.10 0 Boron mg/L 0.12 0.15 -- 0.14 0.135 0.02 0.53 292.59 Cadmium mg/L <0.0010 <0.0010 <0.001 <0.0010 <0.0010 N/A <0.0010 0 Calcium mg/L 17 17 15 16 17 1 8.2 -51.76 Chromium mg/L <0.0050 <0.0050 <0.0050 <0.0050 <0.0050 N/A <0.0050 0 Cobalt mg/L 0.17 0.23 0.22 0.21 0.22 0.03 0.092 -58.18 Copper mg/L <0.050 <0.050 <0.050 <0.050 <0.050 N/A <0.050 0 Gallium mg/L <0.10 <0.10 <0.10 <0.10 <0.10 N/A <0.10 0 Iron mg/L 3.6 3.2 5.3 4.03 3.6 1.12 0.77 -78.61 Lithium mg/L <0.10 <0.10 <0.10 <0.10 <0.10 N/A 0.32 540.00 Magnesium mg/L 3.3 3.2 3.4 3.3 3.3 0.1 2.3 -30.30 Manganese mg/L 0.036 0.068 0.044 0.049 0.044 0.017 0.011 -94.32

Cyanide Destruction Column Studies Report Eagle Gold Project Section 2.0 Current Testing Methodology
Tetra Tech March 13, 2014 19
Constituent Unit 63301 63304 63307 Average Median STD DEV 63319* % Difference
from Room Temp. Columns
Molybdenum mg/L 0.11 0.12 0.13 0.12 0.12 0.01 <0.10 -97.92 Nickel mg/L <0.010 <0.010 <0.010 <0.010 <0.010 N/A <0.010 0 Phosphorus mg/L <0.50 0.53 0.65 <0.50 <0.50 N/A 0.71 184.0 Potassium mg/L 13 12 12 12 12 1 11 -8.33 Scandium mg/L <0.10 <0.10 <0.10 <0.10 <0.10 N/A <0.10 0 Silver mg/L <0.0050 <0.0050 <0.0050 <0.0050 <0.0050 N/A <0.0050 0 Sodium mg/L 960 1000 1200 1053 1000 129 830 -17.00 Strontium mg/L 0.44 0.48 0.44 0.45 0.44 0.02 0.25 -43.18 Tin mg/L <0.10 <0.10 <0.10 <0.10 <0.10 N/A <0.10 0 Titanium mg/L <0.10 <0.10 <0.10 <0.10 <0.10 N/A <1.0 0 Vanadium mg/L 0.019 0.021 0.027 0.022 0.021 0.004 0.027 28.57 Zinc mg/L <0.010 <0.010 <0.010 <0.010 <0.010 N/A <0.010 0 Mercury mg/L <0.0010 <0.0010 <0.0010 <0.0010 <0.0010 N/A <0.010 0 Antimony mg/L 1.3 1.3 1.3 1.3 1.3 0.0 0.68 -47.69 Arsenic mg/L 2.2 3 3.9 3.0 3 0.9 5.5 83.33 Lead mg/L 0.057 0.09 0.059 0.069 0.059 0.019 0.028 -52.54 Selenium mg/L 0.016 0.02 0.019 0.018 0.019 0.002 <0.050 -86.84 Thallium mg/L <0.0010 <0.0010 <0.0010 <0.0010 <0.0010 N/A <0.0010 0 Cyanate mg/L 5.3 5.5 3.8 5 5.3 1 2.7 -49.06 Thiocyanate mg/L 2.2 2.7 4.4 3 2.7 1 12 344.44 Data collected 12/3/2012 * Operated at 4° C. Text in RED is reported at one-half of the detection limit to allow for calculation of average, mean, and standard deviation.
Cyanide Destruction Column Studies Report Eagle Gold Project Section 2.0 Current Testing Methodology
Tetra Tech March 13, 2014 20
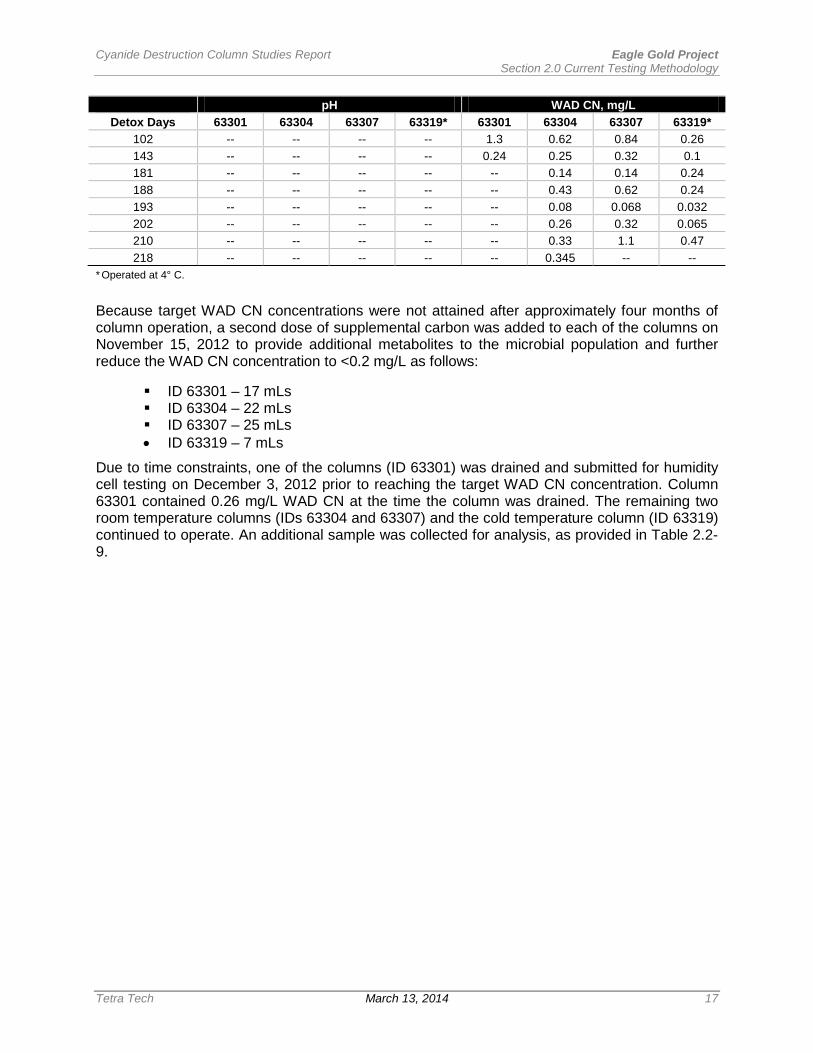
After several additional months of cycling, the columns had not yet attained the target WAD CN concentration. A third and final dose (65 g) of carbon syrup was added to each of the remaining three columns on March 7, 2013. The target WAD CN concentrations were attained on March 15, 2013 and the columns were immediately drained. A post-treatment rinsing phase was not required for the biological columns. Effluent solutions were submitted for final analysis of an abbreviated list of parameters due to available sample volume, as presented in Table 2.2-10.
Table 2-10: Final Detoxification Water Quality, In-Situ Biological Detoxification Columns Constituent* Unit Blended Final Solution
pH pH Units --
Acidity (Titrimetric) mg/L as CaCO3 --
Bicarbonate (HCO3) mg/L --
Carbonate (CO3) mg/L --
Hydroxide (OH) mg/L --
Total Alkalinity mg/L as CaCO3 --
Redox Potential mV --
Total Kjeldahl Nitrogen mg/L --
Total Nitrogen mg/L --
Total Dissolved Solids (TDS) mg/L --
Electrical Conductivity µmhos/cm --
Chloride mg/L 99
Fluoride mg/L 1.9
Sulfate mg/L 1000
Nitrate Nitrogen mg/L 0.30
Nitrite Nitrogen mg/L --
Aluminum mg/L --
Barium mg/L --
Beryllium mg/L --
Bismuth mg/L --
Boron mg/L --
Cadmium mg/L <0.0009
Calcium mg/L --
Chromium mg/L 0.0085
Cobalt mg/L --
Copper mg/L 0.089
Gallium mg/L --
Iron mg/L 2.9
Lithium mg/L --
Magnesium mg/L --
Manganese mg/L --
Molybdenum mg/L 0.14

Cyanide Destruction Column Studies Report Eagle Gold Project Section 2.0 Current Testing Methodology
Tetra Tech March 13, 2014 21
Constituent* Unit Blended Final Solution
Nickel mg/L 0.033
Phosphorus mg/L --
Potassium mg/L --
Scandium mg/L --
Silver mg/L <0.0015
Sodium mg/L --
Strontium mg/L --
Tin mg/L --
Titanium mg/L --
Vanadium mg/L --
Zinc mg/L 0.12
Mercury mg/L <0.0010
Antimony mg/L 0.68
Arsenic mg/L 2.6
Lead mg/L 0.53
Selenium mg/L 0.013
Thallium mg/L <0.0004
Uranium mg/L 0.52
Cyanate mg/L 1.6
Thiocyanate mg/L 0.79
Ammonia, as Nitrogen mg/L <0.050 * Insufficient volume from columns to do individual samples, limited analyte list Data collected 3/20/2013
2.3. Closure (Long-Term Seepage) Phase Upon completion of the cyanide destruction test work, four columns from the ex-situ treatment (IDs 63310, 63313, 63316, and 63322) and one column from the in-situ treatment (ID 63301) were repurposed to serve as a humidity test cell (HTC) for long-term kinetic testing. The results of the HTC test work are summarized in SRK (2014). The remaining columns were sealed and refrigerated for potential future study purposes. After the HTCs were initiated, operation of two columns (IDs 63310 and 63313) were suspended until further notice due to redundancies with other columns selected for testing.
2.4. Data Analyses The results of the column tests were evaluated with respect to the goals of the environmental testing summarized below:
To assess the relative performance of ex-situ chemical treatment and in-situ biological treatment in destructing cyanide within the heap and heap leachate, including the number and concentration of cyanide degradation products (e.g., cyanate, ammonia, and nitrate) that form at various times or steps in the detoxification process.

Cyanide Destruction Column Studies Report Eagle Gold Project Section 2.0 Current Testing Methodology
Tetra Tech March 13, 2014 22
To assess the duration (time, number of pore volumes exchanged, etc.) of the rinsing and cyanide destruction process.
To estimate the concentration/mass of cyanide, metals, etc. remaining in the heap at the end of the detoxification processes.
To provide data to help estimate the long-term quality of waters that will drain from the heap.
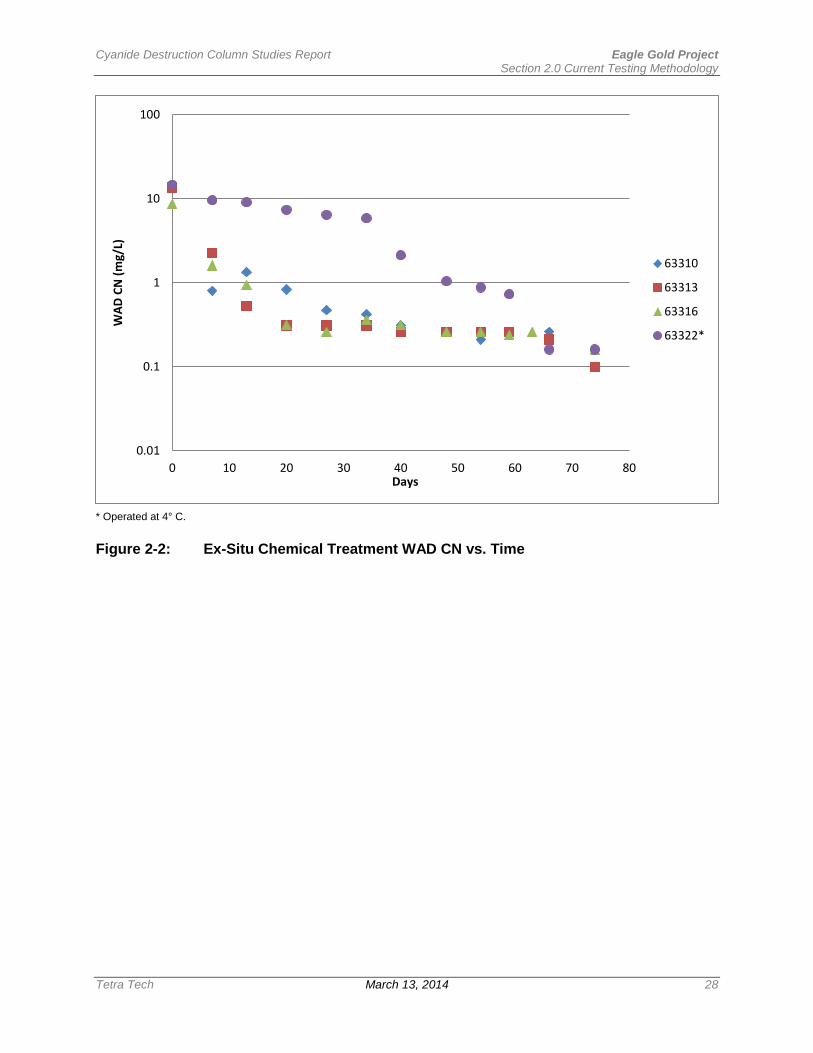
Ex-Situ Chemical Treatment Procedure 2.4.1.Data indicate that on day 0 the WAD Cyanide concentrations in the columns to be treated with the ex-situ chemical treatment procedure ranged from 8.64 mg/L to 14.62 mg/L, with an average of 12.60 mg/L. Almost 98% removal of WAD CN was attained in the first 48 days of treatment, reaching the target WAD CN concentration of <0.2 mg/L after 74 days of treatment in the three room temperature columns and after 68 days in the cold temperature column (ID 63322). These results suggest that the kinetics of the cyanide destruction using the ex-situ chemical procedure do not have a significant temperature dependence. Other species of concern, such as ammonia and cyanate, had 63% and 87% reductions in concentration, respectively. Nitrate in particular increased almost 300 fold during the test work as the nitrogen component of the cyanate, cyanide, and TKN (organic nitrogen and ammonia) was oxidized. A summary of results is presented in Table 2.4-1 and Figure 2.4-1.
In addition to the monitored decreases in WAD CN concentrations, the concentrations of the majority of other aqueous species also decreased during this testing phase as shown in Table 2.4-1. For example, concentration of As decreased by an average of 68% in the four columns. Other species of concern, such as cadmium, chromium, copper, iron, manganese, nickel, strontium, vanadium, zinc, and lead, had similar reductions in concentration. A few species, including selenium, thallium, and titanium, remained relatively constant. A limited number of species (including cobalt, magnesium, molybdenum, and sulfate) exhibited greater than two-fold increases in concentration.
Variations in solution composition due to temperature were limited to a few select species. The percent difference between the average room temperature water quality and the low temperature water quality is calculated in Tables 2.2-4 and 2.2-5. Concentrations of sulfate roughly doubled in the low temperature column, but increased three- or four-fold in the room temperature columns. Contrary to observations in the room temperature columns, concentrations of cyanate did not decrease while selenium concentrations decreased by at least a factor of four in the low temperature columns. However, the vast majority of aqueous species behaved similarly in the low temperature as in the room temperature columns.
The second phase of the testing procedure required that the columns be drained of the reactive cyanide destruction solution and rinsed with either DI or mock rinsate solution. Table 2.4-1 provides a comparison of the average room temperature final detoxification solution with the rinsate solution from column 63316. The concentrations of a majority of the aqueous species decreased during the rinsing phase, as was expected. It is worth noting, however, that concentrations of several elements of concern (such as arsenic, copper, lead, and zinc) increased during the rinsing process, possibly indicating the presence of a continuing source of metals in the column.

Cyanide Destruction Column Studies Report Eagle Gold Project Section 2.0 Current Testing Methodology
Tetra Tech March 13, 2014 23
Table 2-11: Comparison of Average Column Values, Room Temperature Ex-Situ Chemical Detoxification Columns
Constituent Unit Pre-Detox
Mid- Point
Final Detox
Mock Effluent Rinse, Colum
n 63316 only
% Differenc
e Pre-Detox
to Final
% Differenc
e Final to Rinse
pH pH Units 9.58 9.27 8.98 8.68 -6% -3%
Acidity (Titrimetric) mg/L as CaCO3
-- -- -56 -158 N/A 181%
Bicarbonate (HCO3) mg/L 506 -- 680 680 34% 0% Carbonate (CO3) mg/L 161 -- 79 36 -51% -54% Hydroxide (OH) mg/L 0.5 -- 0.5 0.5 0% 0%
Total Alkalinity mg/L as CaCO3
683 -- 690 620 1% -10%
Redox Potential mV -- -- 250 300 N/A 20% Total Kjeldahl Nitrogen mg/L 107 100 30 30 -72% 2% Total Nitrogen mg/L 123 143 260 31 112% -88% Total Dissolved Solids (TDS)
mg/L 1913 -- 4000 2800 109% -30%
Electrical Conductivity µmhos/cm -- -- 6333 4200 N/A -34% Chloride mg/L 78 -- 64 79 -18% 23% Fluoride mg/L 4 -- 3.8 2.2 -6% -43% Sulfate mg/L 275 -- 1200 1000 336% -17% Nitrate Nitrogen mg/L 1.3 35.3 300 58 22309% -81% Nitrite Nitrogen mg/L -- 2.3 3.2 1.8 39% -44% Aluminum mg/L 1.5 5.67 0.99 1.7 -35% 71% Barium mg/L 0.05 0.075 0.039 0.04 -28% 2%
Beryllium mg/L 0.0005 0.000
5 0.000
5 0.0002 0% 0%
Bismuth mg/L 0.05 0.05 0.05 0.0375 0% 0% Boron mg/L 0.143 0.17 0.18 0.11 24% -38%
Cadmium mg/L 0.0088 0.001
6 0.000
5 0.0001 -94% -80%
Calcium mg/L 87 16 12 24 -87% 105%
Chromium mg/L 0.01 0.009
8 0.002
5 0.0026 -64% 4%
Cobalt mg/L 0.2037
5 0.410 0.570 0.095 180% -83%
Copper mg/L 3.85 0.19 0.08 23 -98% 27390% Gallium mg/L 0.05 0.05 0.05 0.01 0% -80% Iron mg/L 7.91 4 0.47 0.92 -94% 97% Lithium mg/L 0.05 0.05 0.05 0.02 0% -60% Magnesium mg/L 0.52 0.81 1.8 1.2 245% -33% Manganese mg/L 0.06 0.073 0.014 0.028 -76% 95% Molybdenum mg/L 0.12 0.187 0.277 0.068 136% -75% Nickel mg/L 0.06 0.005 0.005 0.004 -91% -20% Phosphorus mg/L 0.613 0.63 0.25 0.57 -59% 128% Potassium mg/L 8.363 9.6 17 12 107% -31% Scandium mg/L 0.05 0.05 0.05 0.001 0% -98%
Cyanide Destruction Column Studies Report Eagle Gold Project Section 2.0 Current Testing Methodology
Tetra Tech March 13, 2014 24
Constituent Unit Pre-Detox
Mid- Point
Final Detox
Mock Effluent Rinse, Colum
n 63316 only
% Differenc
e Pre-Detox
to Final
% Differenc
e Final to Rinse
Silver mg/L 0.0025 0.002
5 0.002
5 0.0008 0% -68%
Sodium mg/L 705 850 1433 1000 103% -30% Strontium mg/L 1.43 0.25 0.48 0.43 -67% -10% Tin mg/L 0.05 0.05 0.05 0.005 0% 0% Titanium mg/L 0.05 0.26 0.05 0.04 0% -20% Vanadium mg/L 0.20 0.081 0.026 0.034 -87% 32% Zinc mg/L 2.825 0.121 0.025 0.087 -99% 253%
Mercury mg/L 0.00 0.009
5 0.004
6 0.00035 30% -92%
Antimony mg/L 1.156 1.97 1.77 0.99 53% -44% Arsenic mg/L 16 19 5.1 7.3 -68% 44% Lead mg/L 0.21 0.60 0.09 0.18 -58% 104% Selenium mg/L 0.04 0.064 0.040 0.019 -1% -53%
Thallium mg/L 0.0005 0.005 0.000
5 0.0001 0% 0%
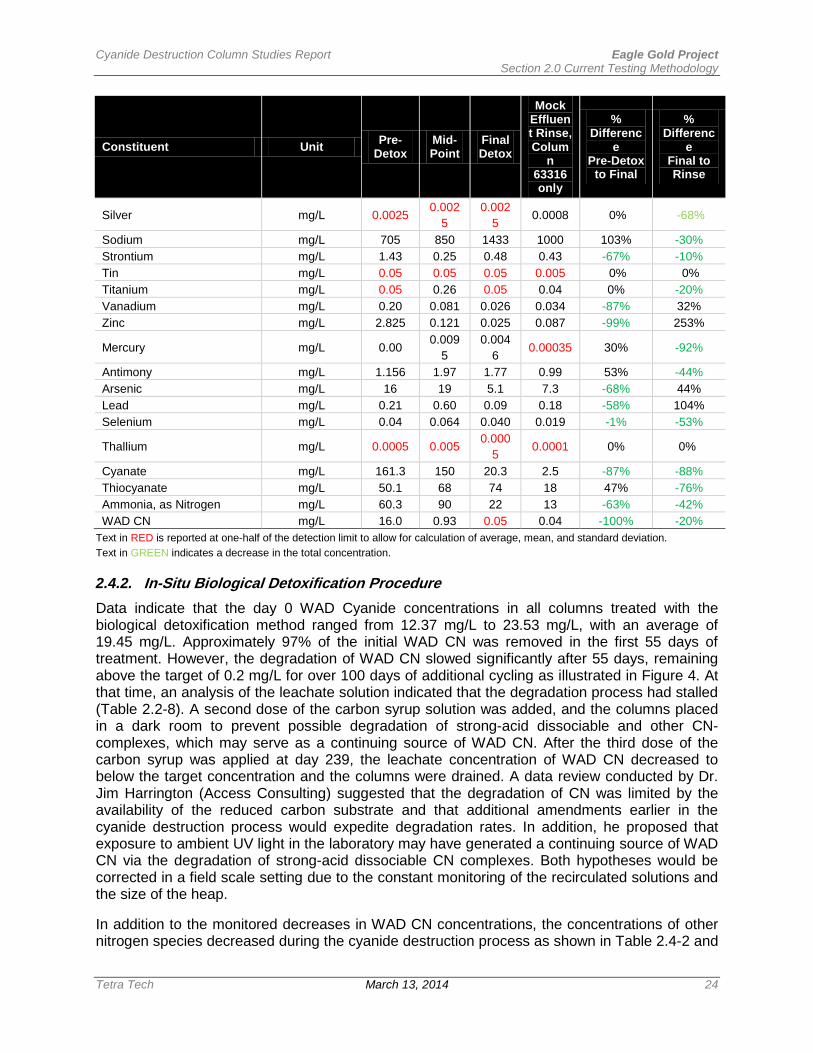
Cyanate mg/L 161.3 150 20.3 2.5 -87% -88% Thiocyanate mg/L 50.1 68 74 18 47% -76% Ammonia, as Nitrogen mg/L 60.3 90 22 13 -63% -42% WAD CN mg/L 16.0 0.93 0.05 0.04 -100% -20%
Text in RED is reported at one-half of the detection limit to allow for calculation of average, mean, and standard deviation. Text in GREEN indicates a decrease in the total concentration.
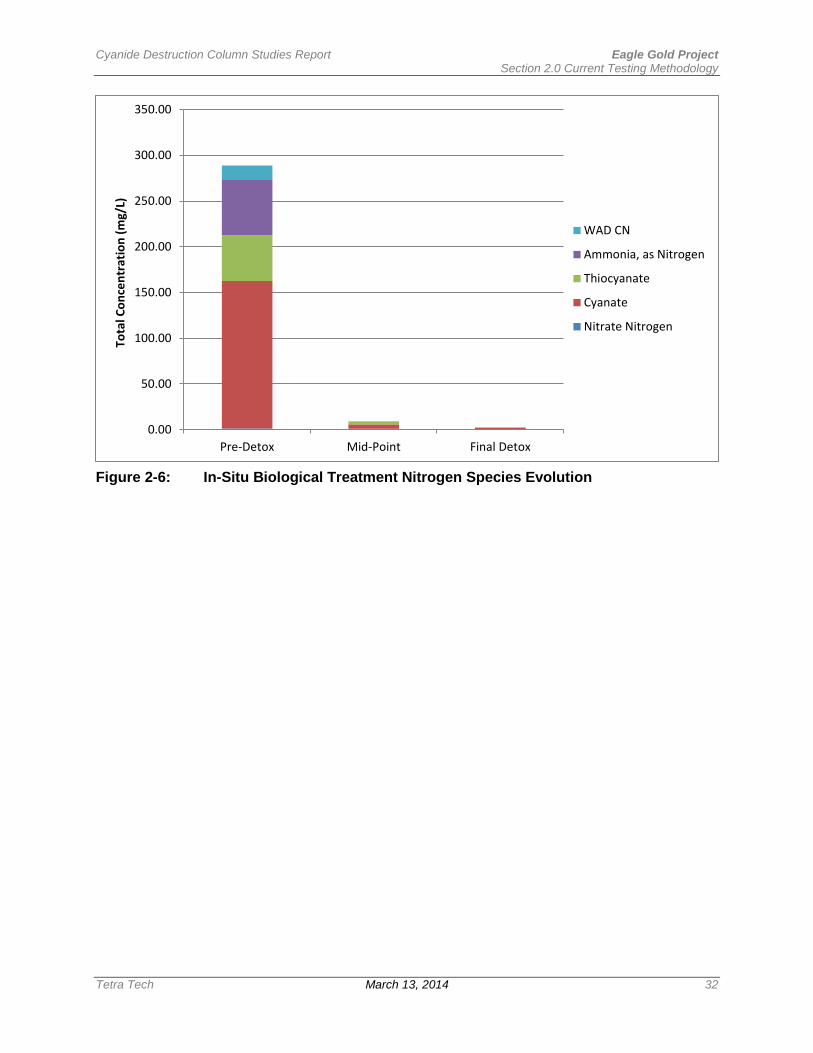
In-Situ Biological Detoxification Procedure 2.4.2.Data indicate that the day 0 WAD Cyanide concentrations in all columns treated with the biological detoxification method ranged from 12.37 mg/L to 23.53 mg/L, with an average of 19.45 mg/L. Approximately 97% of the initial WAD CN was removed in the first 55 days of treatment. However, the degradation of WAD CN slowed significantly after 55 days, remaining above the target of 0.2 mg/L for over 100 days of additional cycling as illustrated in Figure 4. At that time, an analysis of the leachate solution indicated that the degradation process had stalled (Table 2.2-8). A second dose of the carbon syrup solution was added, and the columns placed in a dark room to prevent possible degradation of strong-acid dissociable and other CN-complexes, which may serve as a continuing source of WAD CN. After the third dose of the carbon syrup was applied at day 239, the leachate concentration of WAD CN decreased to below the target concentration and the columns were drained. A data review conducted by Dr. Jim Harrington (Access Consulting) suggested that the degradation of CN was limited by the availability of the reduced carbon substrate and that additional amendments earlier in the cyanide destruction process would expedite degradation rates. In addition, he proposed that exposure to ambient UV light in the laboratory may have generated a continuing source of WAD CN via the degradation of strong-acid dissociable CN complexes. Both hypotheses would be corrected in a field scale setting due to the constant monitoring of the recirculated solutions and the size of the heap.
In addition to the monitored decreases in WAD CN concentrations, the concentrations of other nitrogen species decreased during the cyanide destruction process as shown in Table 2.4-2 and

Cyanide Destruction Column Studies Report Eagle Gold Project Section 2.0 Current Testing Methodology
Tetra Tech March 13, 2014 25
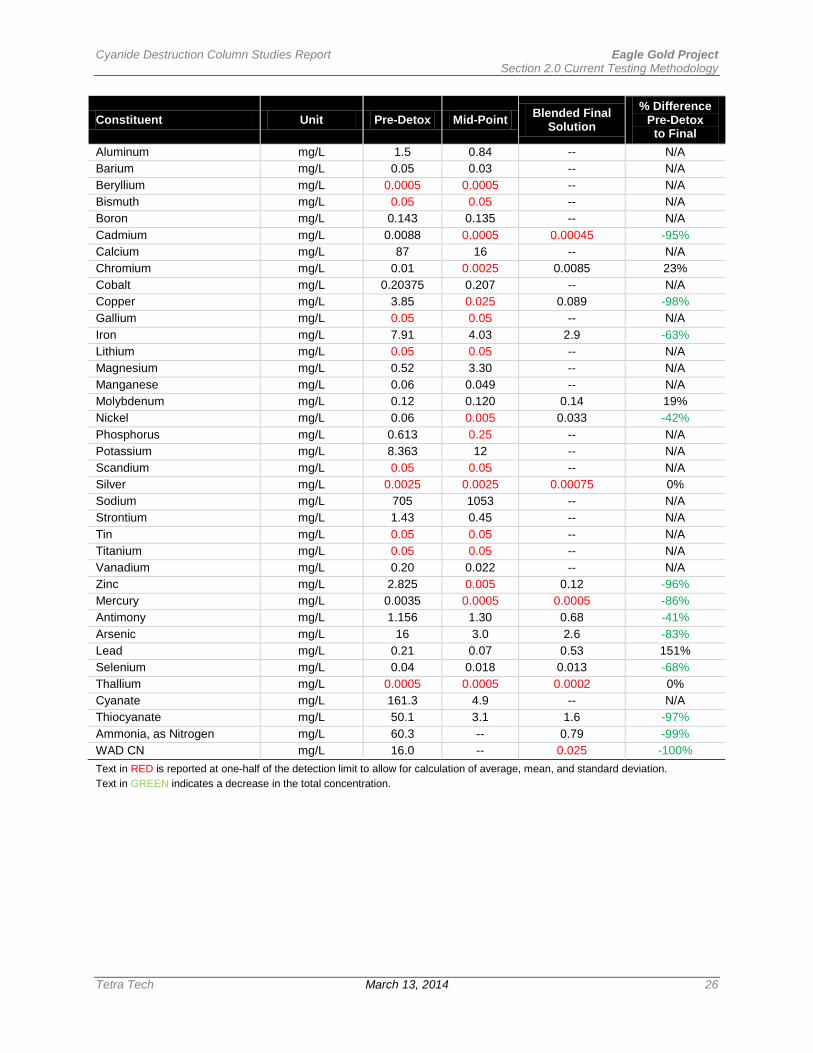
Figure 2.4-2. Concentrations of thiocyanate and ammonia were reduced by 97% and 99%, respectively, from the pre-treatment to the final solution.
Concentrations of the majority of other aqueous species also decreased during the testing process as shown in Table 2.4-2. For example, the concentration of As decreased by an average of 83%. Other species of concern, such as cadmium, copper, iron, nickel, zinc, mercury, antimony, and selenium had similar reductions in concentration. A limited number of species (including chromium, molybdenum, lead, and sulfate) had increases in concentration. Due to the limited amount of solution available for analysis, a limited selection of analytes was requested; therefore a discussion regarding other analytes not listed in Table 2.4-2 is not possible.
Also, because of the limited solution available, the cold temperature column solution was blended with the room temperature solutions after the final column drain-down. Consequently, a comparison of temperature effects is not possible with the final biological columns. However, samples analyzed at the midpoint of the testing process were collected discretely and are the focus of this discussion. Unlike the ex-site chemically treated columns, variations in solution composition due to temperature were observed to some degree in all species. Table 2.2-9 provides a calculation of the percent difference between the cold temperature column and the average of the room temperature columns. Concentrations of arsenic, chloride, boron, lithium, and thiocyanate were elevated a minimum of 83% in the low temperature column compared to the room temperature columns. The elevation of arsenic at low temperatures warrants additional monitoring in the field setting due to implications of arsenic treatment requirements. The remaining aqueous species were present at lower concentrations in the low temperature column than the room temperature columns.
The data presented in Table 2.4-2 are representative of anticipated concentrations of all analytes remaining in the pore water within the heap at the end of the in-situ biological treatment process. The results of subsequent humidity cell testing performed on the columns after the cyanide destruction phase of testing is described and summarized in SRK (2014).
Table 2-12: Comparison of Average Column Values, Room Temperature In-Situ Biological Detoxification Columns
Constituent Unit Pre-Detox Mid-Point Blended Final Solution
% Difference Pre-Detox
to Final pH pH Units 9.58 8.72 -- N/A Acidity (Titrimetric) mg/L as CaCO3 -- -163 -- N/A Bicarbonate (HCO3) mg/L 506 1267 -- N/A Carbonate (CO3) mg/L 161 60 -- N/A Hydroxide (OH) mg/L 0.5 0.5 -- N/A Total Alkalinity mg/L as CaCO3 683 1133 -- N/A Redox Potential mV -- 227 -- N/A Total Kjeldahl Nitrogen mg/L 107 8 -- N/A Total Nitrogen mg/L 123 9 -- N/A Total Dissolved Solids (TDS) mg/L 1913 2633 -- N/A Electrical Conductivity µmhos/cm -- 4200 -- N/A Chloride mg/L 78 25 99 27% Fluoride mg/L 4 2 1.9 -54% Sulfate mg/L 275 1017 1000 264% Nitrate Nitrogen mg/L 1.3 1.0 0.30 -78% Nitrite Nitrogen mg/L -- 3.1 -- N/A
Cyanide Destruction Column Studies Report Eagle Gold Project Section 2.0 Current Testing Methodology
Tetra Tech March 13, 2014 26
Constituent Unit Pre-Detox Mid-Point Blended Final Solution
% Difference Pre-Detox
to Final Aluminum mg/L 1.5 0.84 -- N/A Barium mg/L 0.05 0.03 -- N/A Beryllium mg/L 0.0005 0.0005 -- N/A Bismuth mg/L 0.05 0.05 -- N/A Boron mg/L 0.143 0.135 -- N/A Cadmium mg/L 0.0088 0.0005 0.00045 -95% Calcium mg/L 87 16 -- N/A Chromium mg/L 0.01 0.0025 0.0085 23% Cobalt mg/L 0.20375 0.207 -- N/A Copper mg/L 3.85 0.025 0.089 -98% Gallium mg/L 0.05 0.05 -- N/A Iron mg/L 7.91 4.03 2.9 -63% Lithium mg/L 0.05 0.05 -- N/A Magnesium mg/L 0.52 3.30 -- N/A Manganese mg/L 0.06 0.049 -- N/A Molybdenum mg/L 0.12 0.120 0.14 19% Nickel mg/L 0.06 0.005 0.033 -42% Phosphorus mg/L 0.613 0.25 -- N/A Potassium mg/L 8.363 12 -- N/A Scandium mg/L 0.05 0.05 -- N/A Silver mg/L 0.0025 0.0025 0.00075 0% Sodium mg/L 705 1053 -- N/A Strontium mg/L 1.43 0.45 -- N/A Tin mg/L 0.05 0.05 -- N/A Titanium mg/L 0.05 0.05 -- N/A Vanadium mg/L 0.20 0.022 -- N/A Zinc mg/L 2.825 0.005 0.12 -96% Mercury mg/L 0.0035 0.0005 0.0005 -86% Antimony mg/L 1.156 1.30 0.68 -41% Arsenic mg/L 16 3.0 2.6 -83% Lead mg/L 0.21 0.07 0.53 151% Selenium mg/L 0.04 0.018 0.013 -68% Thallium mg/L 0.0005 0.0005 0.0002 0% Cyanate mg/L 161.3 4.9 -- N/A Thiocyanate mg/L 50.1 3.1 1.6 -97% Ammonia, as Nitrogen mg/L 60.3 -- 0.79 -99% WAD CN mg/L 16.0 -- 0.025 -100% Text in RED is reported at one-half of the detection limit to allow for calculation of average, mean, and standard deviation. Text in GREEN indicates a decrease in the total concentration.

Cyanide Destruction Column Studies Report Eagle Gold Project Section 2.0 Current Testing Methodology
Tetra Tech March 13, 2014 27
* Operated at 4 ° C.
Figure 2-1: Ex-Situ Chemical Treatment pH vs. Time
8.6
8.8
9
9.2
9.4
9.6
9.8
10
10.2
10.4
0 10 20 30 40 50 60 70 80
pH
Days
63310
63313
63316
63322*
Cyanide Destruction Column Studies Report Eagle Gold Project Section 2.0 Current Testing Methodology
Tetra Tech March 13, 2014 28
* Operated at 4° C. Figure 2-2: Ex-Situ Chemical Treatment WAD CN vs. Time
0.01
0.1
1
10
100
0 10 20 30 40 50 60 70 80
WAD
CN
(mg/
L)
Days
63310
63313
63316
63322*
Cyanide Destruction Column Studies Report Eagle Gold Project Section 2.0 Current Testing Methodology
Tetra Tech March 13, 2014 29
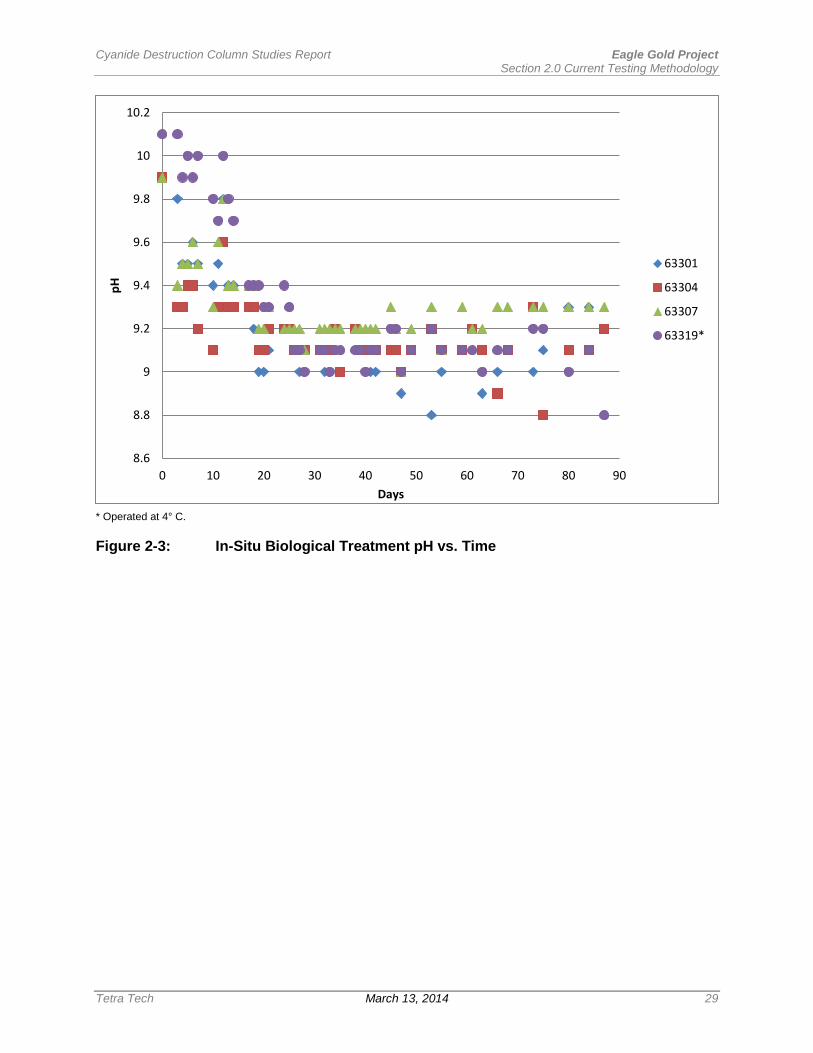
* Operated at 4° C. Figure 2-3: In-Situ Biological Treatment pH vs. Time
8.6
8.8
9
9.2
9.4
9.6
9.8
10
10.2
0 10 20 30 40 50 60 70 80 90
pH
Days
63301
63304
63307
63319*

Cyanide Destruction Column Studies Report Eagle Gold Project Section 2.0 Current Testing Methodology
Tetra Tech March 13, 2014 30
Additional doses of carbon added at days 143 and 239. * Operated at 4° C. Figure 2-4: In-Situ Biological Treatment WAD CN vs. Time
0.01
0.1
1
10
100
0 50 100 150 200
WAD
CN
(mg/
L)
Days
63301
63304
63307
63319*
Target

Cyanide Destruction Column Studies Report Eagle Gold Project Section 2.0 Current Testing Methodology
Tetra Tech March 13, 2014 31
Figure 2-5: Ex-Situ Chemical Treatment Nitrogen Species Evolution
0.00
50.00
100.00
150.00
200.00
250.00
300.00
350.00
Pre-Detox Mid-Point Final Detox
Tota
l Con
cent
ratio
n (m
g/L)
WAD CN
Ammonia, as Nitrogen
Thiocyanate
Cyanate
Nitrate Nitrogen
Cyanide Destruction Column Studies Report Eagle Gold Project Section 2.0 Current Testing Methodology
Tetra Tech March 13, 2014 32
Figure 2-6: In-Situ Biological Treatment Nitrogen Species Evolution
0.00
50.00
100.00
150.00
200.00
250.00
300.00
350.00
Pre-Detox Mid-Point Final Detox
Tota
l Con
cent
ratio
n (m
g/L)
WAD CN
Ammonia, as Nitrogen
Thiocyanate
Cyanate
Nitrate Nitrogen

Cyanide Destruction Column Studies Report Eagle Gold Project Section 3.0 Conclusions and Recommendations
Tetra Tech March 13, 2014 33
3.0 CONCLUSIONS AND RECOMMENDATIONS
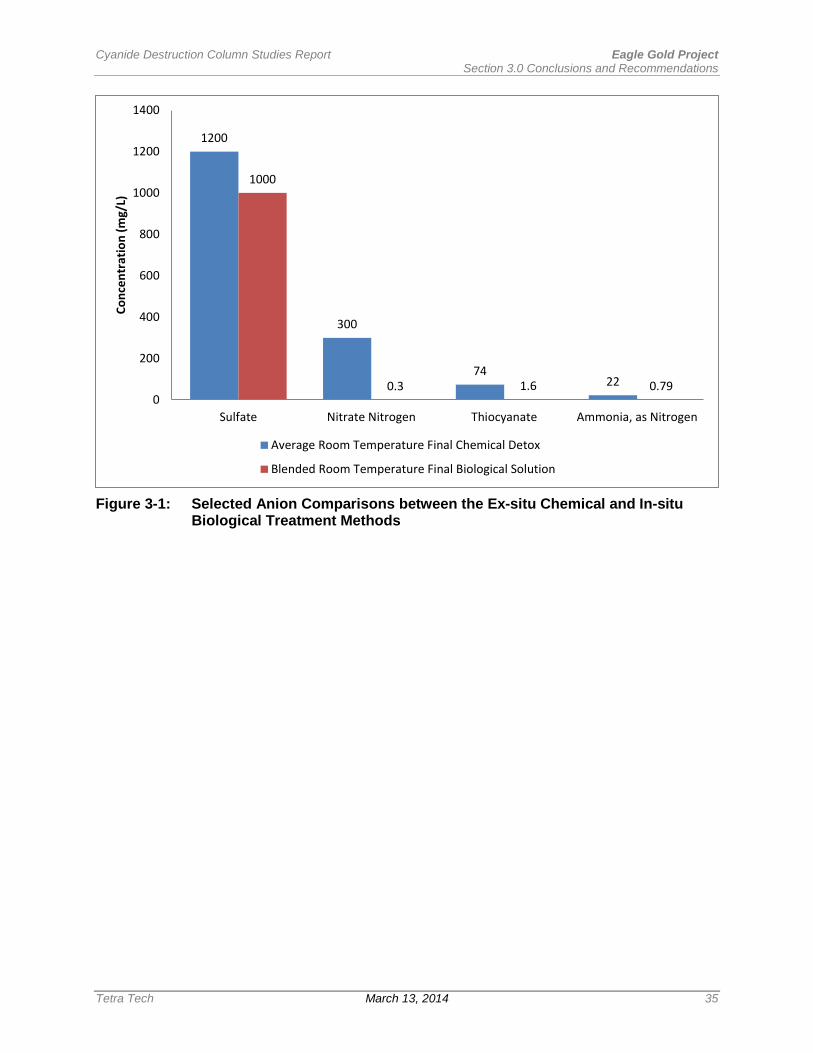
Both cyanide destruction procedures attained the target WAD CN concentration of <0.2 mg/L during the column test, provided sufficient reactive solution was applied to the columns as needed. However, the final leachate water quality produced from the two methodologies present different water treatment challenges for any mine water treatment plant design. Table 3-1 and Figures 3-1 and 3-2 summarize the percent differences in final leachate water quality between the ex-situ chemical treatment and the in-situ biological treatment options.
Although the ex-situ chemical treatment method effectively removed the WAD CN in a relatively short time, the degradation of CN was incomplete. Instead of innocuous end-products, a build-up of cyanate, thiocyanate, ammonia, and nitrate was observed. These nitrogen species would require additional water treatment to produce effluent compliant with discharge standards.
The biological detox method reduced concentrations of all nitrogen species, including cyanate, thiocyanate, ammonia, and nitrate, to levels that would likely be managed via blending with other site waters. The removal of environmentally-significant metals such as lead, zinc, iron, nickel, and chromium is less efficient in the bacterial treatment process, however these metals are typically readily removed by standard mine water treatment technologies. Due to the limited volume of the final solution, a complete chemical analysis was not possible.
Based on the above-described test work, in-situ biological treatment is the preferred method to achieve cyanide destruction within the heap. The chemical treatment method would be needed to provide an efficient CN-destruction technology for handling such events. Bench scale studies would be necessary to optimize the treatment of the excess heap solution during operations using the ex-situ chemical treatment methodology.
The final detox solution analytical results are available to use as a refined source term for the heap drainage in the post-closure water quality and geochemical model, as appropriate.
Table 3-1: Comparison of Final Treatment Solution Compositions
Constituent Unit Average Room
Temperature Final Ex-Situ Chemical
Detox Solution
Blended Room Temperature Final In-Situ Biological
Detox Solution
% Difference of In-situ Compared to Ex-Situ
pH pH Units 8.98 -- N/A
Acidity (Titrimetric) mg/L as CaCO3
-56.2 -- N/A
Bicarbonate (HCO3) mg/L 680 -- N/A Carbonate (CO3) mg/L 79 -- N/A Hydroxide (OH) mg/L <1.0 -- N/A
Total Alkalinity mg/L as CaCO3
690 -- N/A
Redox Potential mV 250 -- N/A Total Kjeldahl Nitrogen mg/L 29.5 -- N/A Total Nitrogen mg/L 260 -- N/A Total Dissolved Solids (TDS)
mg/L 4000 -- N/A
Electrical Conductivity µmhos/cm 6333 -- N/A Chloride mg/L 64 99 54% Fluoride mg/L 3.8 1.9 -50% Sulfate mg/L 1200 1000 -17%

Cyanide Destruction Column Studies Report Eagle Gold Project Section 3.0 Conclusions and Recommendations
Tetra Tech March 13, 2014 34
Constituent Unit Average Room
Temperature Final Ex-Situ Chemical
Detox Solution
Blended Room Temperature Final In-Situ Biological
Detox Solution
% Difference of In-situ Compared to Ex-Situ
Nitrate Nitrogen mg/L 300 0.30 -100% Nitrite Nitrogen mg/L 3.2 -- N/A Aluminum mg/L 0.99 -- N/A Barium mg/L 0.039 -- N/A Beryllium mg/L <0.0010 -- N/A Bismuth mg/L <0.10 -- N/A Boron mg/L 0.18 -- N/A Cadmium mg/L 0.0005 0.00045 -10% Calcium mg/L 12 -- N/A Chromium mg/L 0.0025 0.0085 240% Cobalt mg/L 0.57 -- N/A Copper mg/L 0.08 0.089 6% Gallium mg/L <0.10 -- N/A Iron mg/L 0.47 2.9 521% Lithium mg/L <0.10 -- N/A Magnesium mg/L 1.8 -- N/A Manganese mg/L 0.014 -- N/A Molybdenum mg/L 0.28 0.14 -49% Nickel mg/L 0.005 0.033 560% Phosphorus mg/L <0.50 -- N/A Potassium mg/L 17 -- N/A Scandium mg/L <0.10 -- N/A Silver mg/L 0.0025 0.00075 -70% Sodium mg/L 1433 -- N/A Strontium mg/L 0.48 -- N/A Tin mg/L <0.10 -- N/A Titanium mg/L <0.10 -- N/A Vanadium mg/L 0.026 -- N/A Zinc mg/L 0.025 0.12 386% Mercury mg/L 0.0046 0.0005 -89% Antimony mg/L 1.8 0.68 -62% Arsenic mg/L 5.1 2.6 -49% Lead mg/L 0.088 0.53 500% Selenium mg/L 0.040 0.013 -68% Thallium mg/L 0.0005 0.0002 -60% Cyanate mg/L 20 -- N/A Thiocyanate mg/L 74 1.6 -98% Ammonia, as Nitrogen mg/L 22 0.79 -96% WAD CN mg/L 0.05 0.025 -50% Text in RED is reported at one-half of the detection limit to allow for calculation of average, mean, and standard deviation.
Cyanide Destruction Column Studies Report Eagle Gold Project Section 3.0 Conclusions and Recommendations
Tetra Tech March 13, 2014 35
Figure 3-1: Selected Anion Comparisons between the Ex-situ Chemical and In-situ
Biological Treatment Methods
1200
300
74 22
1000
0.3 1.6 0.79 0
200
400
600
800
1000
1200
1400
Sulfate Nitrate Nitrogen Thiocyanate Ammonia, as Nitrogen
Conc
entr
atio
n (m
g/L)
Average Room Temperature Final Chemical Detox
Blended Room Temperature Final Biological Solution

Cyanide Destruction Column Studies Report Eagle Gold Project Section 3.0 Conclusions and Recommendations
Tetra Tech March 13, 2014 36
Figure 3-2: Selected Metal Comparisons between the Ex-situ Chemical and In-situ
Biological Treatment Methods
0.00
25
0.08
0.28
0.00
5
0.02
5
0.00
46
1.8
5.1
0.08
8
0.04
0
0.00
85
0.08
9
0.14
0.03
3
0.12
0.00
05
0.68
2.6
0.53
0.01
3
0
1
2
3
4
5
6Co
ncen
trat
ion
(mg/
L)
Average Room Temperature Final Chemical Detox
Blended Room Temperature Final Biological Solution

Cyanide Destruction Column Studies Report Eagle Gold Project Section 4.0 REFERENCES
Tetra Tech March 13, 2014 37
4.0 REFERENCES
KCA 2012. Eagle Gold Project, Report of Metallurgical Test Work October 2012; prepared by Kappes Cassiday & Associates (Reno, Nevada) for Stratagold Corporation (Vancouver, BC).
KCA 2014. Eagle Gold Project, Report of Metallurgical Test Work January 2014; prepared by Kappes Cassiday & Associates (Reno, Nevada) for Stratagold Corporation (Vancouver, BC).
SRK 2014. Geochemical Characterization – Eagle Gold Project; prepared for Victoria Gold Corp., by SRK Consulting, Vancouver, BC, March 2014.

Cyanide Destruction Column Studies Report Eagle Gold Project Attachment A
Tetra Tech March 13, 2014 38
ATTACHMENT A Ex-situ Chemical Treatment Procedure

Cyanide Destruction Column Studies Report Eagle Gold Project Attachment A
THIS PAGE INTENTIONALLY LEFT BLANK

Cyanide Destruction Column Studies Report Eagle Gold Project Attachment A
Column Testing for Ex-situ Chemical Treatment for Cyanide Destruction Ex-situ treatment applied a chemical dosage of hydrogen peroxide (with copper catalyst) to oxidize cyanide to cyanate in the water circulated through the column. The following provides a step-wise Standard Operating Procedure for the ex-situ chemical treatment process:
1. Upon conclusion of the metallurgical testing, analyze the final metallurgical test solution for all parameters listed in Table 2.2-1 including total and weak acid dissociable (WAD) cyanide. Immediately prepare the 40-kg columns for cyanide detoxification testing.
2. Convert the total cyanide concentration to total cyanide by mass and calculate the approximate quantity of peroxide required for treatment. Total oxidation requires 1.26 kg peroxide per kilogram cyanide and a concentration of 5 to 50 mg/L soluble copper (as copper nitrate)2.
3. Prepare the treatment solution of 10% peroxide (or a minimum stoichiometric excess of 20%) in a 10 mg/L copper nitrate solution, adjusted to a pH greater than 9 to prevent the formation of hydrogen cyanide gas (HCN).
4. Add the treatment solution to the column effluent, which will be recirculated to the top of the column at a rate equivalent to the infiltration/drainage rate so as to maintain saturation and constant peroxide and copper dosages.
5. Collect and sample the effluent solution for WAD cyanide every pore volume for the first five cycles, with decreased sampled frequency depending on the results of the initial analysis3.
6. Repeat steps 2-5 as needed until the WAD cyanide in the column effluent has decreased to <0.2 mg/L and additional testing has confirmed that free cyanide has decreased to < 0.005 mg/L.
7. Sample and submit the leachate for all parameters listed in Table 2.2-1. 8. Once the WAD and free cyanide concentrations have reached <0.2 mg/L and <0.005
mg/L, respectively, allow the columns to gravity drain and replace the full volume of the rinsate solution with RO water or mock rinsate solution (as described in Table 2.2-6) to begin rinsing metals and other non-cyanide compounds from the heap. Note: heap leachate chemistry is expected to change over time due to continued recycling through the system. However, the primary purpose of this column test is to evaluate the changes in cyanide concentration over time with rinsing. Resulting changes in other water quality parameters are not expected to change significantly over the time frame considered during this short-term column test and will, therefore, not be considered.
9. Sample leachate and submit the leachate for all parameters listed in Table 2.2-1. 10. Continue rinsing with the serial dilutions until the WAD cyanide concentration
decreases to <0.1 mg/L and ammonia concentration is <10 mg/L.
2 U.S. Patent No. 3,510,424 and U.S. Patent No. 3,617,567. 3 Cyanide may be analyzed for free, WAD (which includes free plus weak complexes), or total (including strongly complexed with iron or cobalt). However, the concentration of free cyanide tends to drop to below the detection limit very rapidly so is not very useful for determining progress of cyanide destruction. Strongly complexed cyanide is not treated with peroxide oxidation, but is also very unreactive and is, therefore, not susceptible to leaching. Therefore, WAD cyanide is the most useful measure of cyanide destruction progress. Although water quality standards are based on free cyanide, the weak complexes of cyanide have the potential to break down to free cyanide so are a more appropriate indicator of compliance with the Water Quality Standards.
Cyanide Destruction Column Studies Report Eagle Gold Project Attachment B
ATTACHMENT B In-situ Biological Treatment Procedure

Cyanide Destruction Column Studies Report Eagle Gold Project Attachment B
THIS PAGE INTENTIONALLY LEFT BLANK

Cyanide Destruction Column Studies Report Eagle Gold Project Attachment B
Column Testing for In-Situ Biological Treatment for Cyanide Destruction and Metals Reduction In situ microbial treatment is accomplished in two phases, a rapid reaction of sugars with free or weakly complexed cyanide, and the slower reaction of microbes that are naturally present in the ore materials growing up and utilizing cyanide as a nitrogen source, or destroying cyanide to render the pore water environment more benign from a microbial perspective. Microbial growth is stimulated by the addition of a carbon source at a typical molar ratio of 0.5:1 sugars to cyanide (i.e., 4:1 C:N ratio). In prior cyanide destruction experience with a heap, this ratio has been highly variable, and other nitrogen species (nitrate/nitrite or ammonia) can be a bigger control on carbon demand; however, in a test column the WAD and free cyanide are typically the driver of a carbon demand.
In order to calculate specific ranges of reagents that will be required, previous columns’ water quality results (specifically cyanide-related concentrations) were evaluated for planning purposes. For purposes of this discussion, barren solution is assumed to have cyanide at a concentration of 0.33 g/L based on prior KCA test columns. However, as in situ biological treatment will improve water quality with respect to metals and other anions that affect water quality, the columns will be operated to optimize the extent of biological treatment to minimize metals loading.
Based on the initial concentration of CN, 457 mg total organic carbon (TOC) as sugars will be added per liter to the barren solution (in practice this would also include the volume contained in the barren solution reservoir as well as in the pore spaces of the heap materials). Columns will be recirculated at a rate half as fast as was used for leaching the ore, or a rate targeted to exchange a column pore volume no faster than once every 3.5 days. This slower rate is more conducive to enhancement of microbial growth and supporting biological mechanisms.
The following steps comprise the Standard Operating Procedure for testing microbial destruction of cyanide and other constituents that affect water quality:
1. Ensure that a complete water quality assay is completed for barren leach solution with respect to cyanide forms (free, WAD, and total cyanide), related nitrogen forms (ammonia, cyanate, thiocyanate, nitrate, and nitrite), and project-specific anions, metals, and metalloids of concerns as listed in Table 2.2-1. (If column solids will be tested afterwards, a sample of column solids should be removed before the biological treatment to provide a comparison sample.)
2. Amend barren leach solution (total volume includes the calculated saturated porosity) with sugar solution to achieve 0.5:1 molar ratio of glucose/glucose equivalents to total CN in solution. Estimated volume in prior KCA column test was approximately 12.7 liters, including the volume held in the column and the reservoir. At 12.7 liters and that dosage rate, approximately 5.83 grams TOC or 14.57 grams sugars will be added to the barren leach solution reservoir. Review the final metallurgical column analytical data and perform this calculation to confirm the actual dose used in the test column operation.
3. Mix the barren leach solution with the organic carbon dosage, and let react at room temperature for 1 hour. At the end of one hour, sample for WAD CN, total CN, and nitrogen species (ammonia, nitrate, nitrite). This test determines the extent of abiotic reaction of the sugars with the free and WAD CN.
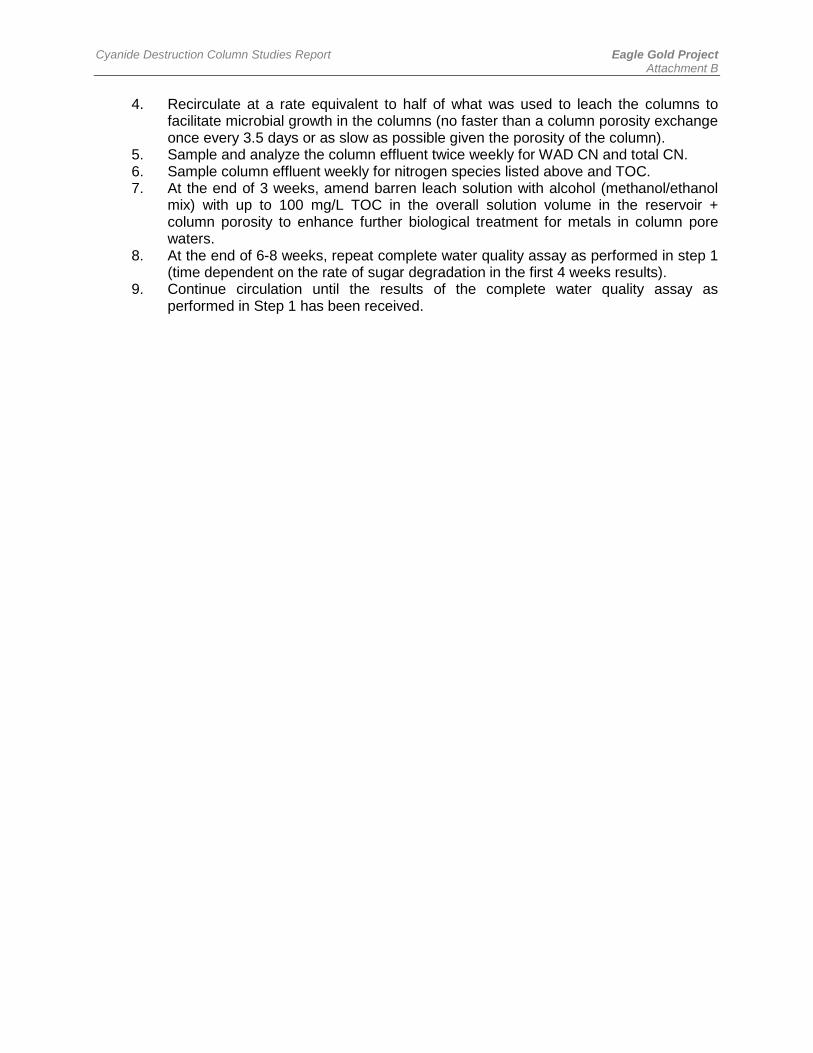
Cyanide Destruction Column Studies Report Eagle Gold Project Attachment B
4. Recirculate at a rate equivalent to half of what was used to leach the columns to facilitate microbial growth in the columns (no faster than a column porosity exchange once every 3.5 days or as slow as possible given the porosity of the column).
5. Sample and analyze the column effluent twice weekly for WAD CN and total CN. 6. Sample column effluent weekly for nitrogen species listed above and TOC. 7. At the end of 3 weeks, amend barren leach solution with alcohol (methanol/ethanol
mix) with up to 100 mg/L TOC in the overall solution volume in the reservoir + column porosity to enhance further biological treatment for metals in column pore waters.
8. At the end of 6-8 weeks, repeat complete water quality assay as performed in step 1 (time dependent on the rate of sugar degradation in the first 4 weeks results).
9. Continue circulation until the results of the complete water quality assay as performed in Step 1 has been received.