cyan r 0 black fy2016 gray mar. 31, 2016) financial … › ir › library › report ›...
TRANSCRIPT

Cyan
White
Gray
Magenta
Turquoise
Green
Yellow
R 255 G 255 B 255
R 45 G 45 B 45
R 0 G 169 B 224
R 218 G 24 B 132
R 0 G 178 B 169
R 120 G 190 B 32
R 238 G 220 B 0
Orange
R 255 G 106 B 19
Purple
R 128 G 49 B 167
Black
R 20 G 20 B 20
FY2016 (Apr. 1, 2015 – Mar. 31, 2016) Financial Announcement
April 26, 2016
Agenda:
FY2016 Consolidated Financial Summary
Tetsuro Hori, Corporate Director, Senior Vice President & General Manager
Business Environment and Actions to Drive the New TEL Toshiki Kawai, Representative Director, President & CEO

Cyan
White
Gray
Magenta
Turquoise
Green
Yellow
R 255 G 255 B 255
R 45 G 45 B 45
R 0 G 169 B 224
R 218 G 24 B 132
R 0 G 178 B 169
R 120 G 190 B 32
R 238 G 220 B 0
Orange
R 255 G 106 B 19
Purple
R 128 G 49 B 167
Black
R 20 G 20 B 20
FY2016 Consolidated Financial Summary
April 26, 2016
Tetsuro Hori
Corporate Director, Senior Vice President & General Manager
FY2016: April 1, 2015 - March 31, 2016

CORP IR / April 26, 2016
Cyan
White
Gray
Magenta
Turquoise
Green
Yellow
R 255 G 255 B 255
R 45 G 45 B 45
R 0 G 169 B 224
R 218 G 24 B 132
R 0 G 178 B 169
R 120 G 190 B 32
R 238 G 220 B 0
Orange
R 255 G 106 B 19
Purple
R 128 G 49 B 167
Black
R 20 G 20 B 20
Increased sales of both semiconductor and
FPD production equipment
Highest-ever gross profit margin of 40.2%
Operating margin improved 3.2pts YoY to 17.6%
FY2016 Highlights
3

CORP IR / April 26, 2016
Cyan
White
Gray
Magenta
Turquoise
Green
Yellow
R 255 G 255 B 255
R 45 G 45 B 45
R 0 G 169 B 224
R 218 G 24 B 132
R 0 G 178 B 169
R 120 G 190 B 32
R 238 G 220 B 0
Orange
R 255 G 106 B 19
Purple
R 128 G 49 B 167
Black
R 20 G 20 B 20
4
FY2016 Business Highlights
Net Sales and Gross Profit Margin (Billion Yen)
Sales up 8.3% YoY, achieved highest-ever GPM,
ROE improved to 13%
Net Income Attributable to Owners of Parent and ROE
ROE = (Net income attributable to owners of parent /
Average total equity) x 100(%)
612.1 613.1 663.9
33.0%
39.6% 40.2%
0
200
400
600
800
FY2014 FY2015 FY2016
Net Sales
Gross Profit Margin
-19.4
71.8 77.8
-3.3%
11.8%
13.0%
-30
0
30
60
90
FY2014 FY2015 FY2016
Net income attributable toowners of parent
ROE
(Billion Yen)

CORP IR / April 26, 2016
Cyan
White
Gray
Magenta
Turquoise
Green
Yellow
R 255 G 255 B 255
R 45 G 45 B 45
R 0 G 169 B 224
R 218 G 24 B 132
R 0 G 178 B 169
R 120 G 190 B 32
R 238 G 220 B 0
Orange
R 255 G 106 B 19
Purple
R 128 G 49 B 167
Black
R 20 G 20 B 20
5
FY2016 Business Highlights
Free Cash Flow (FCF)
33.3
64.2 60.3
0
25
50
75
100
FY2014 FY2015 FY2016
Generated FCF of 60.3 billion yen,
conducted repurchase of 15.4 million shares of treasury stock,
plan to pay our highest-ever dividend
Free cash flow = (Cash flow from operating activities) + (Cash flow from investing
activities excluding term deposits over 3 months)
Shareholder Returns
FY2016: Interim dividend of 125 yen per share, plan to pay year-end dividend of
112 yen per share for an annual dividend of 237 yen
8.9 25.6
39.1
105.5
0
50
100
150
200
FY2014 FY2015 FY2016
Share Repurchase
Dividend144.7
(Billion Yen) (Billion Yen)

CORP IR / April 26, 2016
Cyan
White
Gray
Magenta
Turquoise
Green
Yellow
R 255 G 255 B 255
R 45 G 45 B 45
R 0 G 169 B 224
R 218 G 24 B 132
R 0 G 178 B 169
R 120 G 190 B 32
R 238 G 220 B 0
Orange
R 255 G 106 B 19
Purple
R 128 G 49 B 167
Black
R 20 G 20 B 20
Financial Summary
6
FY2015 FY2016 YoY
Change
(Reference)
FY2016 estimates
announced on
October 28
Net sales 613.1 663.9 +8.3% 660.0
Gross profit Gross profit margin
242.7 39.6%
267.2 40.2%
+10.1% +0.6pts
SG&A expenses 154.6 150.4 -2.7%
Operating income Operating margin
88.1 14.4%
116.7 17.6%
+32.5% +3.2pts
105.0 15.9%
Income before
income taxes 86.8 106.4 +22.6% 100.0
Net income attributable to
owners of parent 71.8 77.8 +8.4% 72.0
EPS(Yen) 401.08 461.10 +60.02
R&D expenses 71.3 76.2 +6.9% 78.0
Capital expenditures 13.1 13.3 +1.2% 15.0
Depreciation and amortization 20.8 19.2 -7.8% 21.0
1. In principle, export sales of Tokyo Electron’s mainstay semiconductor and FPD production equipment are denominated in yen. While some settlements are denominated
in dollars, exchange risk is hedged as forward exchange contracts are made individually at the time of booking.
2. Profit ratios are calculated using full amounts, before rounding.
(Billion Yen)

CORP IR / April 26, 2016
Cyan
White
Gray
Magenta
Turquoise
Green
Yellow
R 255 G 255 B 255
R 45 G 45 B 45
R 0 G 169 B 224
R 218 G 24 B 132
R 0 G 178 B 169
R 120 G 190 B 32
R 238 G 220 B 0
Orange
R 255 G 106 B 19
Purple
R 128 G 49 B 167
Black
R 20 G 20 B 20
Financial Summary
7
FY2015 FY2016
4Q 1Q 2Q 3Q 4Q YoY
Change
Net Sales 181.8 155.7 185.1 158.7 164.2 -9.7%
SPE 171.6 140.3 176.6 146.5 149.5 -12.9%
FPD 9.9 10.0 8.2 11.7 14.6 +47.9%
PVE 0.1 Others 0.1 5.3 0.3 0.5 0.0 -
Gross profit Gross profit margin
77.6 42.7%
65.7 42.2%
70.3 38.0%
62.0 39.1%
69.1 42.1%
-11.0% -0.6pts
SG&A expenses 41.7 35.4 39.3 36.5 39.1 -6.4%
Operating income Operating margin
35.9 19.8%
30.2 19.4%
30.9 16.7%
25.5 16.1%
30.0 18.3%
-16.4% -1.5pts
Income before income taxes 32.9 29.0 28.4 25.1 23.8 -27.8%
Net income attributable to
owners of parent 34.4 19.4 21.8 17.8 18.6 -45.8%
R&D expenses 19.5 17.5 20.0 18.3 20.3 +4.1%
Capital expenditures 3.2 2.1 2.6 2.8 5.6 +74.3%
Depreciation and amortization 5.6 4.6 4.7 4.9 4.9 -12.5%
1. In principle, export sales of Tokyo Electron’s mainstay semiconductor and FPD production equipment are denominated in yen. While some settlements are
denominated in dollars, exchange risk is hedged as forward exchange contracts are made individually at the time of booking.
2. Profit ratios are calculated using full amounts, before rounding.
3. As of 1Q FY2016, the PV production equipment business was no longer material as stipulated in the Accounting Standard for Disclosures about Segments
of an Enterprise and Related Information. Therefore, it has been excluded from segmental reporting.
(Billion Yen)

CORP IR / April 26, 2016
Cyan
White
Gray
Magenta
Turquoise
Green
Yellow
R 255 G 255 B 255
R 45 G 45 B 45
R 0 G 169 B 224
R 218 G 24 B 132
R 0 G 178 B 169
R 120 G 190 B 32
R 238 G 220 B 0
Orange
R 255 G 106 B 19
Purple
R 128 G 49 B 167
Black
R 20 G 20 B 20
Financial Performance
8
663.9
116.7 77.8
17.6%
40.2%
-10%
0%
10%
20%
30%
40%
50%
-100
0
100
200
300
400
500
600
700
FY12 FY13 FY14 FY15 FY16
Net sales 633.0 497.2 612.1 613.1 663.9
Operating income 60.4 12.5 32.2 88.1 116.7 Net income attributable
to owners of parent 36.7 6.0 -19.4 71.8 77.8
Gross profit margin 33.4% 31.9% 33.0% 39.6% 40.2%
Operating margin 9.5% 2.5% 5.3% 14.4% 17.6%
(Billion Yen)

CORP IR / April 26, 2016
Cyan
White
Gray
Magenta
Turquoise
Green
Yellow
R 255 G 255 B 255
R 45 G 45 B 45
R 0 G 169 B 224
R 218 G 24 B 132
R 0 G 178 B 169
R 120 G 190 B 32
R 238 G 220 B 0
Orange
R 255 G 106 B 19
Purple
R 128 G 49 B 167
Black
R 20 G 20 B 20
576.2 613.0
135.9 123.1
23.6% 20.1%
-10%
0%
10%
20%
30%
40%
50%
60%
70%
80%
(100)
0
100
200
300
400
500
600
700
800
Segment Information
9
1. Segment income is based on income before income taxes.
2. R&D expenses such as fundamental research and element research are not included in above reportable segments.
3. Composition of net sales figures is based on the sales to customers.
32.7
44.6
-1.3
4.7
-4.0%
10.6%
-10%
0%
10%
20%
30%
40%
50%
60%
70%
80%
-10
0
10
20
30
40
50
60
70
80
94 92
5 7 1 1
0%
50%
100%
FY15 FY16 FY15 FY16
FY15 FY16
(Billion Yen) (Billion Yen)
SPE (Semiconductor Production Equipment)
FPD (Flat Panel Display Production Equipment)
Composition of Net Sales
Sales
Segment income
Segment profit margin
Sales
Segment income
Segment profit margin
SPE
FPD Others

CORP IR / April 26, 2016
Cyan
White
Gray
Magenta
Turquoise
Green
Yellow
R 255 G 255 B 255
R 45 G 45 B 45
R 0 G 169 B 224
R 218 G 24 B 132
R 0 G 178 B 169
R 120 G 190 B 32
R 238 G 220 B 0
Orange
R 255 G 106 B 19
Purple
R 128 G 49 B 167
Black
R 20 G 20 B 20
SPE Sales by Region
10
87.7
116.2
0
50
100
150
200
FY15 FY16
135.3
103.4
0
50
100
150
200
FY15 FY16
58.7 51.0
0
50
100
150
200
FY15 FY16
97.3 99.5
0
50
100
150
200
FY15 FY16
139.4
161.9
0
50
100
150
200
FY15 FY16
39.7
63.6
0
50
100
150
200
FY15 FY16
17.8 17.0
0
50
100
150
200
FY15 FY16
15 19
24 17
10 8
17 16
24 27
7 10 3 3
0%
50%
100%
FY15 FY16
(Billion Yen)
Japan U.S. Europe Korea (Billion Yen) (Billion Yen) (Billion Yen)
Taiwan China S.E. Asia, Others Region Composition (Billion Yen) (Billion Yen) (Billion Yen)
S.E. Asia,
Others China
Taiwan
Korea
Europe
U.S.
Japan

CORP IR / April 26, 2016
Cyan
White
Gray
Magenta
Turquoise
Green
Yellow
R 255 G 255 B 255
R 45 G 45 B 45
R 0 G 169 B 224
R 218 G 24 B 132
R 0 G 178 B 169
R 120 G 190 B 32
R 238 G 220 B 0
Orange
R 255 G 106 B 19
Purple
R 128 G 49 B 167
Black
R 20 G 20 B 20
11
Quarterly Orders, Order Backlog
0
50
100
150
200
250
300
SPE Orders FPD Orders
January-March 2016
SPE 187.8B (+18%)
FPD 12.2B (-12%)
Total 200.0B (+15%)
( ): change from October-December 2015
% is calculated using full amounts
14/1-3 4-6 7-9 10-12 15/1-3 4-6 7-9 10-12 16/1-3
SPE Orders 154.4 137.2 142.4 167.2 179.7 156.6 122.4 159.3 187.8
FPD Orders 16.6 14.2 4.8 3.4 12.6 11.8 12.5 13.9 12.2
SPE Order backlog 209.9 211.0 217.0 252.3 260.4 276.7 222.6 235.4 273.7
FPD Order backlog 29.0 29.3 29.1 28.8 31.6 33.3 37.6 39.9 37.4
SPE orders up 18% YoY driven by orders for logic and non-volatile memory
(Billion Yen)

CORP IR / April 26, 2016
Cyan
White
Gray
Magenta
Turquoise
Green
Yellow
R 255 G 255 B 255
R 45 G 45 B 45
R 0 G 169 B 224
R 218 G 24 B 132
R 0 G 178 B 169
R 120 G 190 B 32
R 238 G 220 B 0
Orange
R 255 G 106 B 19
Purple
R 128 G 49 B 167
Black
R 20 G 20 B 20
12
Composition of SPE Orders by Application: Equipment Only
27 25 31 35 32 27 30 25
12
13 9
14 17
16 28 19 22
32
28 31
20
20 21
25
15 27
19
32 35 35 28 31
20
36 26
37
0%
20%
40%
60%
80%
100%
14/1-3 4-6 7-9 10-12 15/1-3 4-6 7-9 10-12 16/1-3
DRAM Non-volatile memory Logic Foundry Logic & others (MPU, AP, Others)
Higher proportion of logic and non-volatile memory

CORP IR / April 26, 2016
Cyan
White
Gray
Magenta
Turquoise
Green
Yellow
R 255 G 255 B 255
R 45 G 45 B 45
R 0 G 169 B 224
R 218 G 24 B 132
R 0 G 178 B 169
R 120 G 190 B 32
R 238 G 220 B 0
Orange
R 255 G 106 B 19
Purple
R 128 G 49 B 167
Black
R 20 G 20 B 20
13
SPE Orders by Region
154.4
137.2 142.4
167.2 179.7
156.6
122.4
159.3
187.8
0
50
100
150
200
14/1-3 4-6 7-9 10-12 15/1-3 4-6 7-9 10-12 16/1-3
Japan 19.8 20.4 24.9 24.0 40.8 29.0 29.0 20.4 25.1
U.S. 38.9 35.1 34.7 39.5 30.7 23.9 22.6 26.1 32.1
Europe 17.0 15.0 19.0 10.8 12.7 8.9 9.4 7.9 29.1
Korea 29.5 17.3 22.1 40.8 35.1 14.8 9.3 35.5 19.4
Taiwan 41.8 37.0 30.5 34.5 41.3 48.3 37.8 34.6 35.1
China 4.8 4.7 4.5 14.2 14.2 25.7 10.4 26.9 28.2
S.E. Asia, Others 2.2 7.5 6.4 3.2 4.5 5.6 3.7 7.5 18.5
Logic increased in Europe and
non-volatile memory increased in Southeast Asia
(Billion Yen)

CORP IR / April 26, 2016
Cyan
White
Gray
Magenta
Turquoise
Green
Yellow
R 255 G 255 B 255
R 45 G 45 B 45
R 0 G 169 B 224
R 218 G 24 B 132
R 0 G 178 B 169
R 120 G 190 B 32
R 238 G 220 B 0
Orange
R 255 G 106 B 19
Purple
R 128 G 49 B 167
Black
R 20 G 20 B 20
Balance Sheet
14
*Cash and cash equivalents: Cash and deposits + Short-term investments, etc. (Securities in B/S).
70.8 62.0 27.5 17.6
106.8 96.3
66.7 69.1
175.5 195.0
110.8 116.5
317.6 236.6
876.1
793.3
FY15 FY16
641.1 564.2
234.9
229.1
876.1
793.3
FY15 FY16
Other current assets
Tangible assets
Intangible assets
Cash & cash
equivalents*
Inventories
Trade notes, accounts
receivables
Investment & other assets
(Billion Yen) (Billion Yen)
Assets Liabilities & Net Assets
Liabilities
Net assets

CORP IR / April 26, 2016
Cyan
White
Gray
Magenta
Turquoise
Green
Yellow
R 255 G 255 B 255
R 45 G 45 B 45
R 0 G 169 B 224
R 218 G 24 B 132
R 0 G 178 B 169
R 120 G 190 B 32
R 238 G 220 B 0
Orange
R 255 G 106 B 19
Purple
R 128 G 49 B 167
Black
R 20 G 20 B 20
Inventory Turnover and Accounts Receivable Turnover
15
164.2
77
54 57
60 66
58 61
55
64
100
78 80
94
105
115
100 99
107
0
25
50
75
100
125
150
0
50
100
150
200
250
300
4QFY14
1QFY15
2Q 3Q 4Q 1QFY16
2Q 3Q 4Q
Turnover days = Inventory or accounts receivable at the end of each quarter / last 12 months sales x 365
Net Sales
Accounts Receivable turnover
Inventory Turnover
(Billion Yen) (Days)

CORP IR / April 26, 2016
Cyan
White
Gray
Magenta
Turquoise
Green
Yellow
R 255 G 255 B 255
R 45 G 45 B 45
R 0 G 169 B 224
R 218 G 24 B 132
R 0 G 178 B 169
R 120 G 190 B 32
R 238 G 220 B 0
Orange
R 255 G 106 B 19
Purple
R 128 G 49 B 167
Black
R 20 G 20 B 20
Cash Flow
16
7.9
-2.9
-64.6
5.0
-80
-60
-40
-20
0
20
40
60
*Cash flow from investing activities excludes changes in deposits with periods to maturity of over 3 months.
**Free cash flow = cash flow from operating activities + cash flow from investing activities excluding changes in deposits with periods to maturity of over 3 months.
***Cash on hand includes the total of cash + deposits with periods to maturity of over 3 months.
-12.1
-24.1
-20.8
-16.7
Share Repurchase
4Q
FY14
1Q
FY15
2Q
3Q
4Q
1Q
FY16
2Q
3Q
4Q
Cash flow from operating activities 56.5 16.4 26.8 -3.2 31.7 17.3 30.1 13.8 7.9 Cash flow from investing activities* -2.3 -1.2 -2.7 -2.6 -0.9 -2.0 -1.2 -2.7 -2.9 Cash flow from financing activities -0.4 -4.6 -1.8 -5.4 -6.2 -36.3 -64.6 -37.5 0.0 Free cash flow** 54.1 15.2 24.1 -5.9 30.7 15.3 28.8 11.1 5.0 Cash on hand*** 268.1 280.0 299.1 285.3 317.6 298.9 260.7 233.8 236.6
(Billion Yen)

CORP IR / April 26, 2016
Cyan
White
Gray
Magenta
Turquoise
Green
Yellow
R 255 G 255 B 255
R 45 G 45 B 45
R 0 G 169 B 224
R 218 G 24 B 132
R 0 G 178 B 169
R 120 G 190 B 32
R 238 G 220 B 0
Orange
R 255 G 106 B 19
Purple
R 128 G 49 B 167
Black
R 20 G 20 B 20
17
Appendix

CORP IR / April 26, 2016
Cyan
White
Gray
Magenta
Turquoise
Green
Yellow
R 255 G 255 B 255
R 45 G 45 B 45
R 0 G 169 B 224
R 218 G 24 B 132
R 0 G 178 B 169
R 120 G 190 B 32
R 238 G 220 B 0
Orange
R 255 G 106 B 19
Purple
R 128 G 49 B 167
Black
R 20 G 20 B 20
Financial Performance
18
164.2
30.0 18.6
18.3%
42.1%
-10%
0%
10%
20%
30%
40%
50%
-50
0
50
100
150
200
250
4Q
FY14
1Q
FY15
2Q
3Q
4Q
1Q
FY16
2Q
3Q
4Q
Net sales 219.2 151.3 142.9 137.0 181.8 155.7 185.1 158.7 164.2
Operating income 24.9 17.0 13.0 22.0 35.9 30.2 30.9 25.5 30.0 Net income attributable
to owners of parent 16.2 11.8 8.1 17.4 34.4 19.4 21.8 17.8 18.6
Gross profit margin 32.6% 36.6% 36.4% 42.1% 42.7% 42.2% 38.0% 39.1% 42.1%
Operating margin 11.4% 11.3% 9.1% 16.1% 19.8% 19.4% 16.7% 16.1% 18.3%
(Billion Yen)

CORP IR / April 26, 2016
Cyan
White
Gray
Magenta
Turquoise
Green
Yellow
R 255 G 255 B 255
R 45 G 45 B 45
R 0 G 169 B 224
R 218 G 24 B 132
R 0 G 178 B 169
R 120 G 190 B 32
R 238 G 220 B 0
Orange
R 255 G 106 B 19
Purple
R 128 G 49 B 167
Black
R 20 G 20 B 20
171.6
140.3
176.6
146.5 149.5
41.5 32.2 33.6 31.1 26.1
24.2% 23.0%
19.1% 21.3%
17.5%
-10%
0%
10%
20%
30%
40%
50%
(50)
0
50
100
150
200
250
Segment Information
19
9.9 10.0
8.2
11.7
14.6
-0.7
1.3 1.0 0.6 1.7
-7.1%
13.3% 12.4% 5.3%
12.1%
-10%
0%
10%
20%
30%
40%
50%
-5
0
5
10
15
20
25
94 90 95 92 91
6 7
5 8 9 3
0%
50%
100%
4Q
FY15
1Q
FY16
2Q
3Q
4Q
4Q
FY15
1Q
FY16
2Q
3Q
4Q
4Q
FY15
1Q
FY16
2Q
3Q
4Q
(Billion Yen) (Billion Yen)
SPE (Semiconductor Production Equipment)
FPD (Flat Panel Display Production Equipment)
Composition of Net Sales
Sales
Segment income
Segment profit margin
Sales
Segment income
Segment profit margin
SPE
FPD Others
1. Segment income is based on income before income taxes.
2. R&D expenses such as fundamental research and element research are not included in above reportable segments.
3. Composition of net sales figures is based on the sales to customers.
CORP IR / April 26, 2016
Cyan
White
Gray
Magenta
Turquoise
Green
Yellow
R 255 G 255 B 255
R 45 G 45 B 45
R 0 G 169 B 224
R 218 G 24 B 132
R 0 G 178 B 169
R 120 G 190 B 32
R 238 G 220 B 0
Orange
R 255 G 106 B 19
Purple
R 128 G 49 B 167
Black
R 20 G 20 B 20
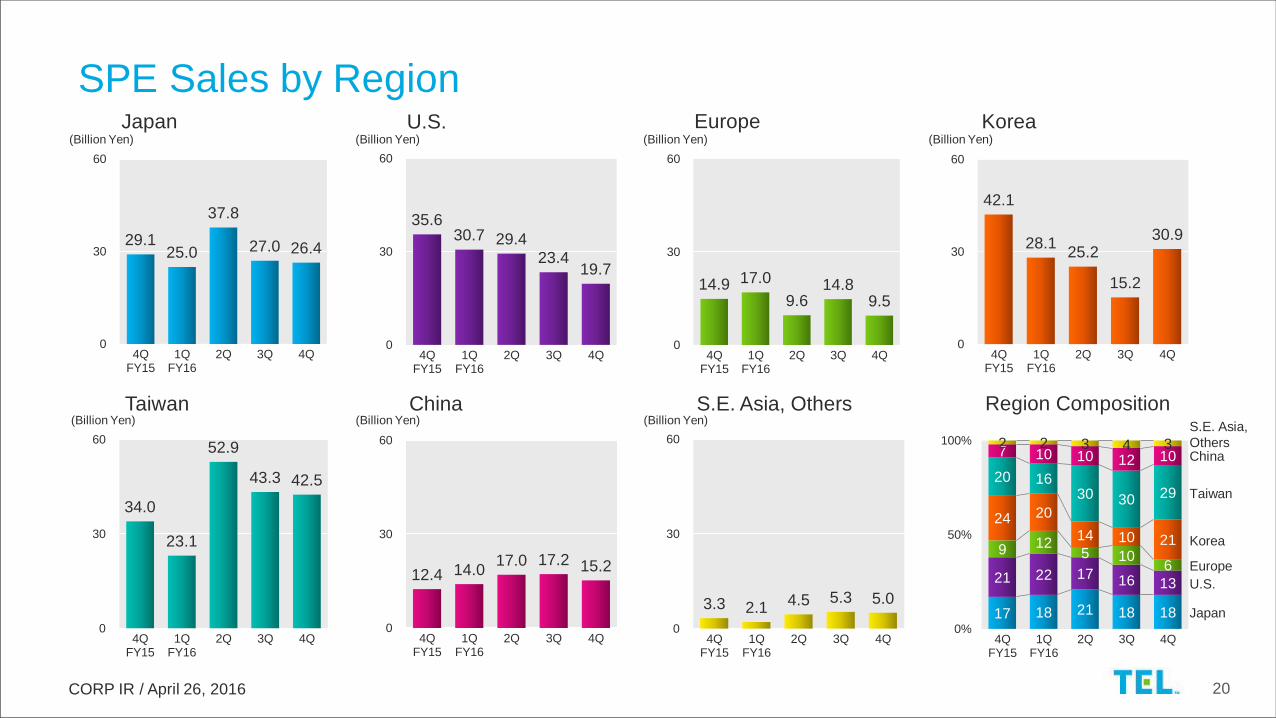
SPE Sales by Region
20
29.1 25.0
37.8
27.0 26.4
0
30
60
4QFY15
1QFY16
2Q 3Q 4Q
35.6 30.7 29.4
23.4 19.7
0
30
60
4QFY15
1QFY16
2Q 3Q 4Q
14.9 17.0
9.6 14.8
9.5
0
30
60
4QFY15
1QFY16
2Q 3Q 4Q
42.1
28.1 25.2
15.2
30.9
0
30
60
4QFY15
1QFY16
2Q 3Q 4Q
34.0
23.1
52.9
43.3 42.5
0
30
60
4QFY15
1QFY16
2Q 3Q 4Q
12.4 14.0 17.0 17.2 15.2
0
30
60
4QFY15
1QFY16
2Q 3Q 4Q
3.3 2.1 4.5 5.3 5.0
0
30
60
4QFY15
1QFY16
2Q 3Q 4Q
17 18 21 18 18
21 22 17 16 13
9 12 5 10
6
24 20
14 10 21
20 16 30 30 29
7 10 10 12 10 2 2 3 4 3
0%
50%
100%
4QFY15
1QFY16
2Q 3Q 4Q
(Billion Yen)
Japan U.S. Europe Korea (Billion Yen) (Billion Yen) (Billion Yen)
Taiwan China S.E. Asia, Others Region Composition (Billion Yen) (Billion Yen) (Billion Yen)
S.E. Asia,
Others China
Taiwan
Korea
Europe
U.S.
Japan

CORP IR / April 26, 2016
Cyan
White
Gray
Magenta
Turquoise
Green
Yellow
R 255 G 255 B 255
R 45 G 45 B 45
R 0 G 169 B 224
R 218 G 24 B 132
R 0 G 178 B 169
R 120 G 190 B 32
R 238 G 220 B 0
Orange
R 255 G 106 B 19
Purple
R 128 G 49 B 167
Black
R 20 G 20 B 20
Balance Sheet
21
*Cash and cash equivalents: Cash and deposits + Short-term investments, etc. (Securities in B/S).
70.8 69.1 65.4 67.7 62.0 27.5 27.1 21.4 20.7 17.6
106.8 105.3 101.8 100.3 96.3
66.7 48.5 54.0 59.2 69.1
175.5 194.8 180.7 183.9 195.0
110.8 97.9 110.2 102.8 116.5
317.6 298.9
260.7 233.8 236.6
876.1 841.9
794.6 768.6
793.3
4QFY15
1QFY16
2Q 3Q 4Q
641.1 627.3 576.0 557.7 564.2
234.9 214.5
218.6 210.9 229.1
876.1 841.9
794.6 768.6
793.3
4QFY15
1QFY16
2Q 3Q 4Q
(Billion Yen) (Billion Yen)
Assets Liabilities & Net Assets
Liabilities
Net assets
Other current assets
Tangible assets
Intangible assets
Cash & cash
equivalents*
Inventories
Trade notes, accounts
receivables
Investment & other assets
CORP IR / April 26, 2016
Cyan
White
Gray
Magenta
Turquoise
Green
Yellow
R 255 G 255 B 255
R 45 G 45 B 45
R 0 G 169 B 224
R 218 G 24 B 132
R 0 G 178 B 169
R 120 G 190 B 32
R 238 G 220 B 0
Orange
R 255 G 106 B 19
Purple
R 128 G 49 B 167
Black
R 20 G 20 B 20
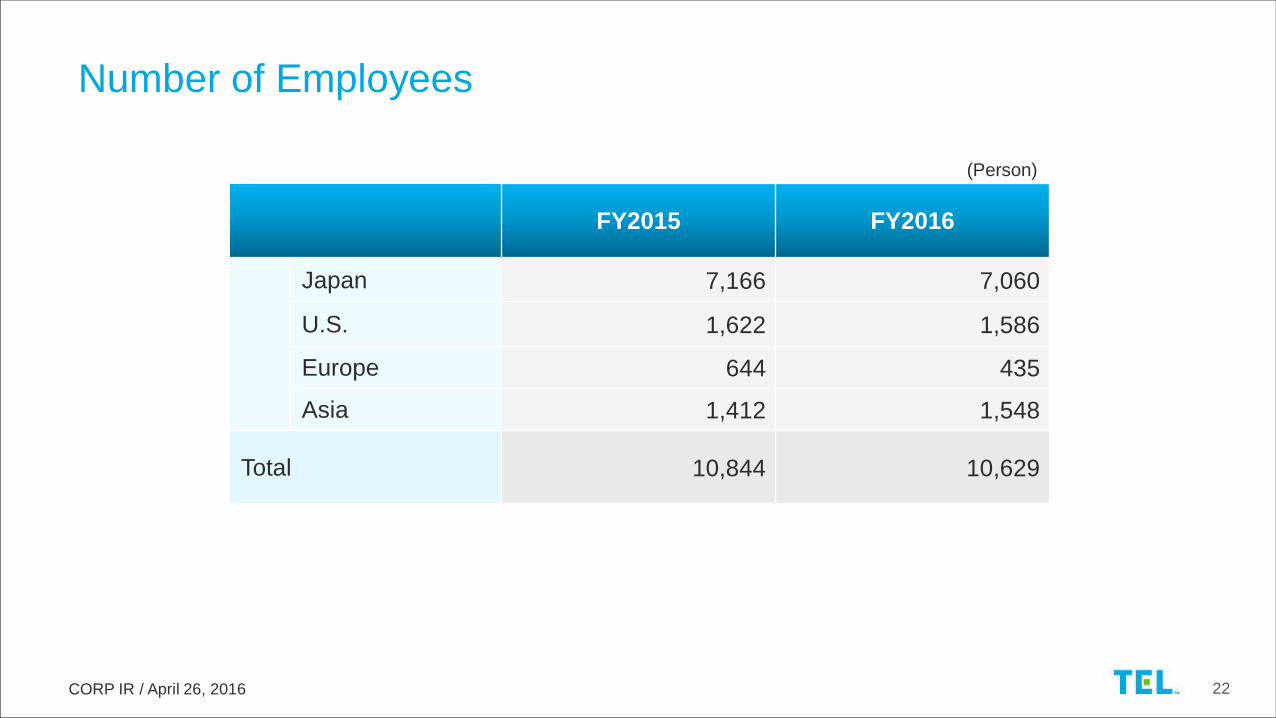
Number of Employees
22
FY2015 FY2016
Japan 7,166 7,060
U.S. 1,622 1,586
Europe 644 435
Asia 1,412 1,548
Total 10,844 10,629
(Person)

Cyan
White
Gray
Magenta
Turquoise
Green
Yellow
R 255 G 255 B 255
R 45 G 45 B 45
R 0 G 169 B 224
R 218 G 24 B 132
R 0 G 178 B 169
R 120 G 190 B 32
R 238 G 220 B 0
Orange
R 255 G 106 B 19
Purple
R 128 G 49 B 167
Black
R 20 G 20 B 20
Business Environment and Actions to Drive the New TEL
April 26, 2016
Toshiki Kawai
Representative Director, President & CEO

CORP IR / April 26, 2016
Cyan
White
Gray
Magenta
Turquoise
Green
Yellow
R 255 G 255 B 255
R 45 G 45 B 45
R 0 G 169 B 224
R 218 G 24 B 132
R 0 G 178 B 169
R 120 G 190 B 32
R 238 G 220 B 0
Orange
R 255 G 106 B 19
Purple
R 128 G 49 B 167
Black
R 20 G 20 B 20
Since the 2008 global financial crisis improved operating income to over ¥100.0B
Achieved a +8.3% sales increase YoY, GPM of 40.2% and an OPM of 17.6%
Announced Medium-term Plan toward FY2020 and began deploying new structure
Announced new shareholder return policy, cancelled 15.4 million shares* of treasury
stock, plan to pay highest-ever dividend
Steady progress in acquisition of PORs** (certification of technology) in our SPE
focus areas as part of Medium-term Plan
Announced that we are building a proactive governance structure with emphasis on
linkage to Medium-term Plan
FY2016 Business Highlights
* 8.53% of outstanding shares prior to cancellation
** POR (Process of Record): Certification of the equipment used in customers’ semiconductor production processes
24

CORP IR / April 26, 2016
Cyan
White
Gray
Magenta
Turquoise
Green
Yellow
R 255 G 255 B 255
R 45 G 45 B 45
R 0 G 169 B 224
R 218 G 24 B 132
R 0 G 178 B 169
R 120 G 190 B 32
R 238 G 220 B 0
Orange
R 255 G 106 B 19
Purple
R 128 G 49 B 167
Black
R 20 G 20 B 20
Advanced patterning technology combining multiple etching steps, expanded 3D-NAND
HARC processes*
Improved position in ALD** in both batch and semi-batch system
Being adopted in key processes for logic and memory, expanded dry cleaning applications
FY2016 SPE Business Summary
Market share CY2014 CY2015
Etching System 26% 19%
Thermal Processing System 55% 54%
Single Wafer Deposition System 5% 6%
Cleaning System 25% 24%
Sales FY2015 FY2016
Field Solutions Business >¥170.0B >¥185.0B
* HARC (High Aspect Ratio Contact) processes: Advanced processing technology required for deep hole etching
** ALD (Atomic Layer Deposition): An atomic level film deposition technique
Etching System
ALD System
Cleaning System
CY2019 goals
>36%
>65%
>10%
>35%
FY2020 goal
>¥200.0B
Progress in acquiring POR in focus areas, no change in Medium-term Plan goals
25

CORP IR / April 26, 2016
Cyan
White
Gray
Magenta
Turquoise
Green
Yellow
R 255 G 255 B 255
R 45 G 45 B 45
R 0 G 169 B 224
R 218 G 24 B 132
R 0 G 178 B 169
R 120 G 190 B 32
R 238 G 220 B 0
Orange
R 255 G 106 B 19
Purple
R 128 G 49 B 167
Black
R 20 G 20 B 20
Maintain 85%+ share in leading-edge immersion and EUV
Expand applications in 3D-NAND processes, expand patterning processes with new
products
Improve position in ALD products, increase PORs in semi-batch ALD system
Expand SAMs* with new products, establish volume production process for STT-MRAM**
Expand sales of batch system for 3D-NAND, strengthen single wafer & dry system
Increase penetration of CellciaTM for 3D-NAND
FY2017 Key Issues for the SPE Business
Coater/Developer
Etching System
Thermal Processing
System
Single Wafer
Deposition System
Cleaning System
Test System
* SAM : Served Available Market
** STT-MRAM (Spin Transfer Torque-Magnetoresistive Random Access Memory): Magnetic memory that shows promise for low power consumption
26

CORP IR / April 26, 2016
Cyan
White
Gray
Magenta
Turquoise
Green
Yellow
R 255 G 255 B 255
R 45 G 45 B 45
R 0 G 169 B 224
R 218 G 24 B 132
R 0 G 178 B 169
R 120 G 190 B 32
R 238 G 220 B 0
Orange
R 255 G 106 B 19
Purple
R 128 G 49 B 167
Black
R 20 G 20 B 20
Unify development framework,
create leading next generation products
Optimally allocate development resources to focus areas
Unite TEL’s diverse technologies (wet/dry/atmospheric pressure/low pressure/
plasma/temperature control) and create solutions for equipment for the next
generation and beyond
Strategic business collaboration with consortia, materials producers
Respond to multi-generational, diverse semiconductor technology in the
IoT*/AI** era
Actions to Drive Forward the New TEL
27
* IoT : Internet of Things
** AI : Artificial Intelligence
CORP IR / April 26, 2016
Cyan
White
Gray
Magenta
Turquoise
Green
Yellow
R 255 G 255 B 255
R 45 G 45 B 45
R 0 G 169 B 224
R 218 G 24 B 132
R 0 G 178 B 169
R 120 G 190 B 32
R 238 G 220 B 0
Orange
R 255 G 106 B 19
Purple
R 128 G 49 B 167
Black
R 20 G 20 B 20
5
7
,
0
0
0
Back-
ground
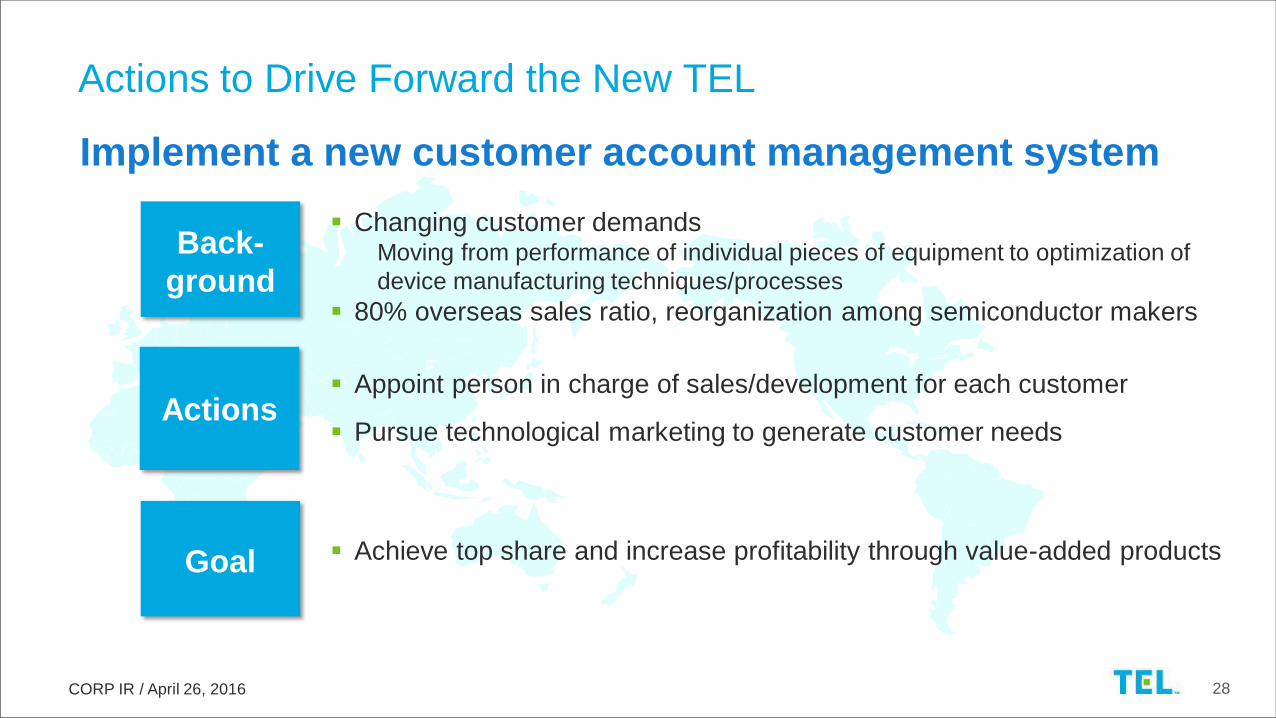
Implement a new customer account management system
Actions to Drive Forward the New TEL
Actions
Changing customer demands Moving from performance of individual pieces of equipment to optimization of
device manufacturing techniques/processes
80% overseas sales ratio, reorganization among semiconductor makers
Appoint person in charge of sales/development for each customer
Pursue technological marketing to generate customer needs
Achieve top share and increase profitability through value-added products
Goal
28

CORP IR / April 26, 2016
Cyan
White
Gray
Magenta
Turquoise
Green
Yellow
R 255 G 255 B 255
R 45 G 45 B 45
R 0 G 169 B 224
R 218 G 24 B 132
R 0 G 178 B 169
R 120 G 190 B 32
R 238 G 220 B 0
Orange
R 255 G 106 B 19
Purple
R 128 G 49 B 167
Black
R 20 G 20 B 20
► SPE Capex
CY2016 WFE* capex expected to be similar level to CY2015
Memory: DRAM investment past its peak, 3D-NAND investment expanding
Foundry/logic: Expand investment in advanced nodes from second half of 2016
► FPD Capex
CY2016 demand for TFT Array Process** FPD manufacturing equipment forecast to
increase 20% YoY, primarily for small/medium panels for mobile devices
Business Environment
(Outlook as of April 2016)
29
* WFE (Wafer Fab Equipment): The semiconductor production process can be divided into two sequential sub-processes: front-end (wafer fabrication) and back-end (assembly and test)
production. WFE is used in the front-end production process.
** TFT Array Process: Process for manufacturing substrate that realizes display images
Despite an unstable macroeconomic environment, the equipment market
is expected to be firm as it rides a wave of technological innovation

CORP IR / April 26, 2016
Cyan
White
Gray
Magenta
Turquoise
Green
Yellow
R 255 G 255 B 255
R 45 G 45 B 45
R 0 G 169 B 224
R 218 G 24 B 132
R 0 G 178 B 169
R 120 G 190 B 32
R 238 G 220 B 0
Orange
R 255 G 106 B 19
Purple
R 128 G 49 B 167
Black
R 20 G 20 B 20
FY2016 results
– Grew sales 37% YoY, achieved segment profit margin of 10.6%
– Began accepting orders for G10.5 substrate size equipment,
ImpressioTM 3300 etching system, ExcelinerTM 3300 coater/developer
FY2017 key issues
– Grow share in mobile panel market through our new PICPTM* etching system
– Establish OLED panel volume production process with inkjet printing system
FPD Business Strategy
*PICP (Planer Inductively Coupled Plasma): Plasma source for producing extremely uniform high density plasma on substrate
30

CORP IR / April 26, 2016
Cyan
White
Gray
Magenta
Turquoise
Green
Yellow
R 255 G 255 B 255
R 45 G 45 B 45
R 0 G 169 B 224
R 218 G 24 B 132
R 0 G 178 B 169
R 120 G 190 B 32
R 238 G 220 B 0
Orange
R 255 G 106 B 19
Purple
R 128 G 49 B 167
Black
R 20 G 20 B 20
Effects of and responses to the Kumamoto earthquake
– There was no major effect on TEL buildings and facilities
– Currently, a delay of approximately 4 weeks is expected on production.
However, we will implement a program to reduce delays through special
shifts, including on weekends and holidays, and will also aim to reduce
start-up time upon delivery to customers.
Overall, a return to normal production is expected by the end of June
For our business results forecast for FY2017, we expect TEL sales to grow
faster than the market. However, in order to properly assess the impact of the
earthquake we plan to announce our business results forecast on May 12,
2016
FY2017 Forecasts for Business Results and Dividend
31

CORP IR / April 26, 2016
Cyan
White
Gray
Magenta
Turquoise
Green
Yellow
R 255 G 255 B 255
R 45 G 45 B 45
R 0 G 169 B 224
R 218 G 24 B 132
R 0 G 178 B 169
R 120 G 190 B 32
R 238 G 220 B 0
Orange
R 255 G 106 B 19
Purple
R 128 G 49 B 167
Black
R 20 G 20 B 20
A real global company generating high added-value and
profits to Semiconductor and FPD industries through
innovative technologies and groundbreaking proactive
solutions with integrated diverse technologies
32

CORP IR / April 26, 2016
Cyan
White
Gray
Magenta
Turquoise
Green
Yellow
R 255 G 255 B 255
R 45 G 45 B 45
R 0 G 169 B 224
R 218 G 24 B 132
R 0 G 178 B 169
R 120 G 190 B 32
R 238 G 220 B 0
Orange
R 255 G 106 B 19
Purple
R 128 G 49 B 167
Black
R 20 G 20 B 20
Disclaimer regarding forward-looking statement Forecast of TEL’s performance and future prospects and other sort of information published are made
based on information available at the time of publication. Actual performance and results may differ
significantly from the forecast described here due to changes in various external and internal factors,
including the economic situation, semiconductor/FPD/PV market conditions, intensification of sales
competition, safety and product quality management, and intellectual property-related risks.
Processing of numbers For the amount listed, because fractions are rounded down, there may be the cases where the total for
certain account titles does not correspond to the sum of the respective figures for account titles.
Percentages are calculated using full amounts, before rounding.
Exchange Risk
In principle, export sales of Tokyo Electron’s mainstay semiconductor and FPD/PV panel production
equipment are denominated in yen. While some settlements are denominated in dollars, exchange risk
is hedged as forward exchange contracts are made individually at the time of booking. Accordingly, the
effect of exchange rates on profits is negligible.
33
FPD/PV: Flat panel display/Photovoltaic

Cyan
White
Gray
Magenta
Turquoise
Green
Yellow
R 255 G 255 B 255
R 45 G 45 B 45
R 0 G 169 B 224
R 218 G 24 B 132
R 0 G 178 B 169
R 120 G 190 B 32
R 238 G 220 B 0
Orange
R 255 G 106 B 19
Purple
R 128 G 49 B 167
Black
R 20 G 20 B 20