cvs corporation 2003 annual report - cvs health...
TRANSCRIPT

CVS Corporation 2003 Annual Report
CVSCorporation
2003AnnualReport
H_Narr_Cvrs 3/24/04 11:41 AM Page 3

H_Narr_Cvrs 3/24/04 11:41 AM Page 4
CVS is one of the nation’s largest and fastest-growing drugstore chains, with 4,179 stores in 32 states
and the District of Columbia. The mission of our 110,000 associates can be summed up in two words:
CVS easy™. We want to be nothing less than the easiest pharmacy retailer for customers to use. That
means convenient locations, drive-thru pharmacies, 24- and extended-hour stores, and 1-hour photo
labs with digital capabilities. It also means clean, neat stores with superior customer service and
prescriptions that are ready when promised.
Sales in 2003 reached a record-breaking $26.6 billion, generated by our retail locations and by
PharmaCare Management Services, our PBM and specialty pharmacy division. With retail sales
exceeding $800 per square foot, CVS averages approximately $100 more per square foot than our
nearest competitor and $200 more per square foot than the industry average. We hold the #1 market
position in seven of the top 10 U.S. drugstore markets and the #1 or #2 market rank in nearly
two-thirds of the top 100 U.S. drugstore markets in which we operate.
CVS trades on the New York Stock Exchange under the symbol “CVS” and at year-end had a market
capitalization of more than $14 billion.
On the cover: The Titusville CVS/pharmacy location that opened in November 2003 is one of our new
stores in the fast-growing Florida markets.
Message from our Chairman
H_Narr_Cvrs 3/24/04 11:41 AM Page 1
TO OUR CVS can look back over 2003 with a great sense of accomplishment. We turned in the best performance in
SHAREHOLDERS: our 40-year history, with sales hitting an all-time high of $26.6 billion. Our sales results improved steadily
throughout the year, finishing with a record-breaking holiday season. Same-store sales grew by 5.8 percent,
while diluted earnings per share rose a healthy 17.7 percent, to $2.06. Much of the credit for these results
can be attributed to the success of our associates’ efforts to make CVS the easiest pharmacy for customers
to use. Our research shows that customers are noticing the difference.
Our pharmacy business, which accounts for roughly 70 percent of overall sales, turned in a tremendous year.
Pharmacy same-store sales jumped 8.1 percent, with CVS filling more than one in every 10 U.S. retail drug
prescriptions. Front-end same-store sales increased 1.2 percent. We also saw improvements in gross
margins, due largely to increased generic drug sales, a significant reduction in inventory losses, and a more
profitable product mix in the front of the store. These are just some of the strong underlying fundamentals
that helped CVS’ share price increase 45 percent in 2003 versus a 23 percent increase for the S&P 500.
Our balance sheet remained among the best in our industry, with low leverage and excellent working capital
ratios. We generated a significant amount of cash and continued to put this money to use on a number of
fronts—opening stores, investing in technology, and increasing our dividend payout. In fact, the 15 percent
dividend hike we announced in October was the largest since we went public in 1996, reflecting our strong
results and confidence in our future. Our return on invested capital increased to 9.9 percent, with the spread
above our weighted average cost of capital once again demonstrating economic value creation.
GROWING OUR STORE BASE We continued our successful expansion, opening 275 convenient new stores in 2003. After factoring in
relocations and closings, we achieved a 3.5 percent expansion in square footage and net unit growth of 92
stores. Of these, more than 80 are located in fast-growing new CVS markets such as Florida, Texas, Chicago,
Phoenix, and Las Vegas. We also broke ground for a distribution center in Ennis, Texas, scheduled to open
in late 2004. The first facility of its kind in North America, it will utilize state-of-the-art storage and retrieval
systems that are 30 percent more productive and require half the space of traditional distribution centers.
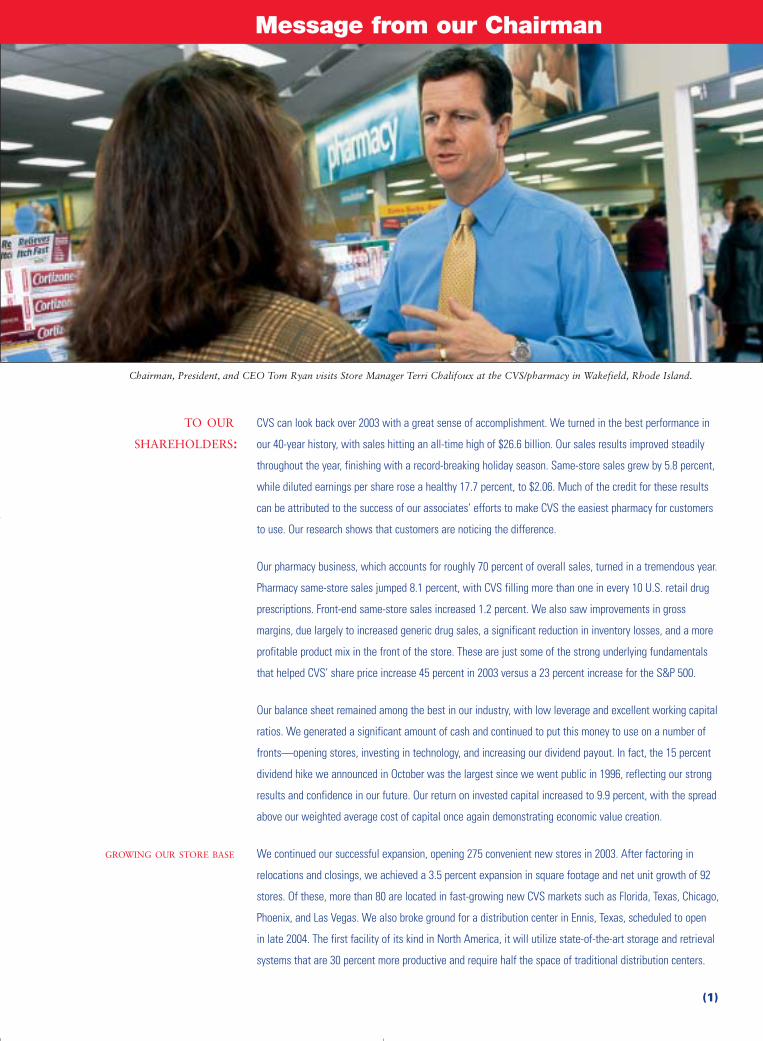
Chairman, President, and CEO Tom Ryan visits Store Manager Terri Chalifoux at the CVS/pharmacy in Wakefield, Rhode Island.
(1)

(2)
’99 ’00 ’01 ’02 ’03
18.1
20.1
22.2
24.2
26.6
Sal
’99 ’00 ’01 ’02 ’03
Test
Beg
ins
1.9
Pi
lot B
egin
s
25.8
C
hain
wid
e
34.3
44.4
Forty percent of all U.S. householdsparticipate in theCVS ExtraCare loyalty program.
H_Narr_Cvrs 3/24/04 11:41 AM Page 2
REAPING THE BENEFITS Through our “CVS easy” initiatives, we’ve worked hard to make ours the easiest stores to shop among all
OF “CVS EASY” drug retailers. Take our Pharmacy Service Initiative, which we rolled out during the year. Based on tracking
studies, we have seen substantial improvements in service levels and have received overwhelmingly
positive customer feedback. Our ExtraCare® program, with more than 44 million cardholders, is the largest
and most successful U.S. retail loyalty program. Three years after ExtraCare’s rollout, cardholders account
for a remarkable 55 percent of all transactions and are enjoying the program’s many benefits.
Assisted Inventory Management (AIM), the computerized inventory tracking system we introduced in 2002,
has dramatically improved our in-stock position in the front of the store. AIM helped us exceed our inventory-
turn goal in 2003, making us the leader among national drugstore chains in this important productivity
measure. We achieved inventory turns of 5.0 times for the year, up from 4.6 times in 2002. Furthermore,
we rolled out AIM for the pharmacy in 2003 and anticipate substantial benefits as 2004 progresses.
In July 2003, CVS also became the first national drug retailer to offer self-service digital photo printing.
Customers have noted their approval of our easy-to-use kiosks by printing more than 25 million images
through year-end. This has reversed the downward trend in the overall photo category caused by the drop
in traditional overnight processing.
Our “CVS easy” mission even drives the way we design our stores, with a focus on enabling customers
to get what they want as conveniently as possible. They appreciate our more than 1,700 drive-thru
pharmacies, carpeted floors, good lighting, and five-foot shelf heights that make it easy to find and reach
every product. We’ve expanded store hours as well, with 1,600 stores—double last year’s level—now
offering 24- or extended-hour service. This strategy is paying off. CVS boasts the highest sales per retail
square foot of any national drugstore chain, hitting more than $800 in 2003. More than 50 percent of our
stores were freestanding at the end of 2003, and we expect that figure to reach 70–80 percent over the
long term. On the pages that follow this letter, I invite you to witness “CVS easy” in action.
es (In billions of dollars) ExtraCare Cardholders (In millions)

Financial Highlights
2003 2002In millions, except per share (53 weeks) (52 weeks) % Change
Sales $ 26,588.0 $ 24,181.5 10.0
Operating profit 1,423.6 1,206.2 18.0
Net earnings 847.3 716.6 18.2
Diluted earnings per common share 2.06 1.75 17.7
Stock price at year end 36.12 24.97 44.7
Market capitalization at year end 14,281 9,814 45.5
H_Narr_Cvrs 3/24/04 11:41 AM Page 3
OFFERING A UNIQUE We’ve distinguished ourselves in other ways as well. For example, CVS offers a unique front-end focus on
FRONT-END EXPERIENCE cosmetics, health, and beauty. We carry France’s Avène® and Vichy® beauty care lines and are currently
the exclusive U.S. distributor of Finland’s Lumene® brand. It’s worth noting that 40 percent of our Lumene
customers are new to the skin care category at CVS, a clear indicator that such offerings help drive front-of-
store sales growth. In addition, customers value the way we tailor our stores with merchandise targeted to
ethnic preferences and the other needs of distinct neighborhoods. Our web site, CVS.com, offers the ability
to order unique products online.
With our PharmaCare® subsidiary, which celebrates its 10th anniversary in 2004, we’ve built one of the
most comprehensive U.S. pharmacy benefit management (PBM) and specialty pharmacy companies. The
fourth-largest PBM overall with 15 million members, PharmaCare is recognized as the leader in offering a full-
service solution for small and mid-sized clients. Its 17 percent jump in revenue in 2003 pushed PharmaCare’s
annual sales past $1.3 billion. I’m happy to note that PharmaCare also continues to benefit from enhanced
sales and marketing efforts following the integration of ProCare, our specialty pharmacy division.
CVS also tries to make it easy for doctors to maximize their time spent with patients. We are a charter member
of SureScripts, an organization formed to provide an electronic link between doctors and pharmacies. This
should help make the prescription-filling process faster and more efficient, and a highly promising beta test
is currently underway in Rhode Island. We expect the necessary connections to be deployed nationwide by
year-end 2004, with acceptance by prescribers occurring over time.
EXPECTING MORE We are committed to steady, long-term, profitable growth. As we enter 2004, I have reason to feel very
GOOD NEWS IN 2004 optimistic about CVS’ prospects. For starters, we’ve built a top-notch management team that is focused on
AND BEYOND transforming a good retailer into a great one. Our team includes a number of individuals who have spent close
to two decades with CVS, as well as professionals who have joined us from other industries. The resulting
breadth of our executive talent has made us a stronger organization, ready to seize new opportunities.
Moreover, we have clarity of mission among the 110,000 associates who are putting our “CVS easy”
(3)

CVS/pharmacy and ProCare Markets (In blue)
H_Narr_Cvrs 3/24/04 11:41 AM Page 4
initiatives into action every day and helping us unlock our enormous potential. It’s worth noting that length
of service averages 10 years for our 4,000-plus store managers and nine years for our more than 12,000
pharmacists. Extensive experience and our Emerging Leaders development program help prepare our top talent
for broader field management roles.
EXPANDING OUR PRESENCE We fully expect sales to pass $28 billion in 2004. Some 225–250 new or relocated stores are slated to
IN NEWER MARKETS open during the year, and total square footage should grow by approximately 4 percent again. Nearly all
of the net store growth will come from increased penetration in our newer markets. After only three years,
these newer markets will contribute more than $1 billion in revenue in 2004. We also plan to enter other
high-growth areas such as Minneapolis, Los Angeles, and Orange County, California.
The retail pharmacy industry is expected to more than double to about $450 billion in annual sales by 2012.
Our pharmacies stand to benefit from a strong drug discovery pipeline as well as the FDA’s accelerated
approval of generic drugs. Some $50 billion in pharmaceuticals will be coming off patent over the next four
years. Demographics also continue to work in our favor. The population is aging, and prescription drug
therapy remains a cost-effective approach to meeting health care needs. People aged 65 and over use
almost four times as many prescriptions as other individuals. According to government estimates, this
portion of the population will spend $1.8 trillion on prescriptions over the next decade.
The competitive threat of mail order pharmacy has been a much debated issue, with consumer resistance
growing against benefit plans that force patients to order maintenance medications through the mail. We
are encouraged by the overwhelmingly positive response to benefit plans that allow customers to fill their
90-day prescriptions in retail stores. Let me stress that CVS does not oppose dispensing medication through
mail order. However, we are opposed to a small number of PBMs implementing plan designs that not only
force patients to use mail, but also dictate that patients use their captive mail order services. At best, this
practice is harmful to patients because it eliminates choice and deprives them of the opportunity to obtain
personal counseling from a community pharmacist. At worst, it is unfair and anti-competitive.
(4)

C
’99 ’00 ’01 ’02 ’03
58.7 62
.7 66.1 67
.6 68.8
Rx Sales/Total Sales (In percent)
’99 ’00 ’01 ’02 ’03
4.0 4.1 4.
3
4.6
5.0
Inventory Turns
Inventory turns improved 7 percent onaverage for fiveconsecutiveyears, making CVS #1amongnational chains.
H_Narr_Cvrs 3/24/04 11:41 AM Page 5
In November, we watched Congress pass a long-awaited prescription drug law that goes into effect in 2006.
Many of its details have yet to be worked out, and we will monitor them closely. However, we believe that
this kind of legislation will ultimately be good for senior citizens, good for this country’s uninsured, and good
for CVS. IMS Health predicts that a Medicare prescription benefit would add 75–100 million incremental
prescriptions to the market annually.
BUILDING ON A STRONG Another piece of federal legislation, the Sarbanes-Oxley Act, has garnered a great deal of attention of late.
ORPORATE GOVERNANCE Enacted to improve corporate governance standards, you may be wondering what impact it will have on
TRADITION CVS. Thanks to a strong corporate governance tradition, built over our 40 years in business, CVS has had to
make very few changes. In fact, we are largely formalizing and documenting already existing practices. As
for our Board of Directors, it has always included talented leaders from corporate America, academia, and
the non-profit world. Among them, I want to extend a special thanks to Ivan Seidenberg and Eugene
Applebaum. Both men served faithfully for many years and retired following our last annual meeting.
In closing, I want to thank long-standing shareholders for the continued confidence you place in our efforts.
If you’re new to CVS, then you’ve become a shareholder during a most exciting period. We are a company
with a long history, to be sure, but “CVS easy” and the other initiatives I’ve described above demonstrate
that we are not encumbered by old ways or old ideas. The eagerness to challenge ourselves and our
passion for extraordinary customer service drive everything we do. I believe that CVS has the talent, the
focus, and the financial strength to create new growth opportunities for years to come.
Thomas M. Ryan
Chairman of the Board, President, and Chief Executive Officer
February 12, 2004
(5)

ExtraCare Loyalty Program
H_Narr_Cvrs 3/24/04 11:41 AM Page 6

H_Narr_Cvrs 3/24/04 11:41 AM Page 7
Making it easy to save.At this CVS/pharmacy in Jamaica Plain, Massachusetts, customers love to flash their ExtraCare® cards for Shift
Supervisor Eve Rodriguez—with good reason. ExtraCare lets customers at every location enjoy advertised discounts
without the hassle of clipping coupons. Cardholders also get a little something back with their sales receipts every
quarter: ExtraBucks™. Customers can apply these cash rewards toward just about any front-of-store purchase—and
keep a few more dollars in their pockets. They may receive tailored promotional offers as well. How successful
have our ExtraCare/ExtraBucks efforts been? With more than 44 million cardholders, CVS has the largest retail loyalty
program in the United States.

Drive-Thru Pharmacy
H_Narr_Cvrs 3/24/04 11:41 AM Page 8
An Rx for customer convenience.At our CVS/pharmacy in Wakefield, Rhode Island, customers appreciate the great service they receive—even when
they don’t enter the store. For many, the store’s double drive-thru pharmacy is just what the doctor ordered. It’s one of
more than 1,700 drive-thrus found at CVS locations, allowing customers to drop off prescriptions or pick them up
without ever leaving their cars. Parents with children napping in the back love the convenience. So do customers
who are feeling under the weather. By making life easier for them, we know that our customers will come inside the
next time they need to find a birthday card, try out the latest trend in cosmetics, or grab a bag of everyone’s favorite—
CVS Gold Emblem® Chocolate Chip Cookies.

H_Narr_Cvrs 3/24/04 11:41 AM Page 9

Pharmacy Service Initiative
H_Narr_Cvrs 3/24/04 11:42 AM Page 10

H_Narr_Cvrs 3/24/04 11:42 AM Page 11
Ready when promised.At one of our newest locations—in Coconut Grove, Florida—customers have come to expect a high level of service at
the pharmacy. And we wouldn’t have it any other way. Thanks to the Pharmacy Service Initiative (PSI) we rolled out in
every CVS/pharmacy in 2003, our pharmacy teams are able to make the prescription-filling process easier by verifying
insurance, medication availability, or refill authorization on the spot. As a result, we resolve potential problems while
customers are still at drop-off. PSI also gives them a high degree of confidence that prescriptions will be filled and
“ready when promised.” For Cristina Fueyo (left), Nicole Povich, and our other 12,000-plus pharmacists, PSI also
means that they have more time to spend counseling customers and providing the best service possible.

Photo Leadership
H_Narr_Cvrs 3/24/04 11:42 AM Page 12

H_Narr_Cvrs 3/24/04 11:42 AM Page 13
Developing a digital solution.Printing digital photos has never been easier (or more fun) for this mother and child in Dallas, Texas. That’s because
they’re using one of our self-service digital photo kiosks now found in more than 3,200 CVS/pharmacy locations
around the country. In July 2003, CVS became the first national retailer to offer this service. We’re making it a snap
for customers to retrieve images from their digital cameras, film, CDs, or camera phones—and to crop, enlarge,
and print them on high-quality Kodak paper while they shop. All for just 29 cents a shot. The response? We’ve sold
25 million images and counting.

Assisted Inventory Management
H_Narr_Cvrs 3/24/04 11:42 AM Page 14

H_Narr_Cvrs 3/24/04 11:42 AM Page 15
AIMing to be the best.When customers at this CVS/pharmacy in Washington, D.C., ask store manager Hobart Banks for help finding a
product, he’s confident that the items are on the shelf. After all, we’ve taken the guesswork out of inventory tracking
at all locations with our computerized Assisted Inventory Management (AIM) system. Introduced in 2002, AIM has
since helped to dramatically improve our in-stock position and the CVS shopping experience. More good news is
coming in 2004 as we reap the benefits of the recent AIM rollout in the pharmacy.

CVS in the Community
H_Narr_Cvrs 3/24/04 11:42 AM Page 16
Always ready to help.In Seminole, Florida, Pharmacy Supervisor Alan Obringer and Pharmacy Manager Susan Villella recently found themselves
back in grade school. That’s because both are part of a team of CVS associates who volunteer their time in Bauder
Elementary School’s Science Lab. Through our Volunteer Challenge Grants Program, the school also received funding for
supplies and experiments. The CVS Charitable Trust awarded 200 such grants in 2003 to non-profit organizations where
CVS associates volunteer. This is just one of the many ways in which we support our communities. Over the past year,
the CVS Charitable Trust also awarded grants to nearly three-dozen organizations across the country working to improve
children’s health care and quality of life for people in need. The CVS Charity Classic, our largest single philanthropic
event, distributed more than $1 million in 2003 to nonprofits. Our associates provide supplies during natural disasters and
other emergencies as well, as they did by distributing bottled water, flashlights, and batteries during the blackout of 2003.

H_17_48 3/24/04 10:18 AM Page 17
Management’s Discussion and Analysis of Financial Condition and Results of Operation 18
Consolidated Statements of Operations 26
Consolidated Balance Sheets 27
Consolidated Statements of Shareholders’ Equity 28
Consolidated Statements of Cash Flows 29
Notes to Consolidated Financial Statements 30
Five-Year Financial Summary 46
Management’s Responsibility for Financial Reporting 47
Independent Auditors’ Report 47
2003 Financial Report
(17)

ancial Condition
H_17_48 3/24/04 10:18 AM Page 18
The following discussion should be read in conjunction with our audited consolidated financial statements and our Cautionary Statement Concerning Forward-LookingStatements that are presented in this Annual Report.
OUR BUSINESS
Our company is a leader in the retail drugstore industry in the United States. We sell prescription drugs and a wide assortment of general merchandise, including over-the-counter drugs, greeting cards, film and photofinishing services, beauty products and cosmetics, seasonal merchandise and convenience foods through our CVS/pharmacy® retail stores and online throughCVS.com®. We also provide Pharmacy Benefit Managementand Specialty Pharmacy services through PharmaCareManagement Services. As of January 3, 2004, we operated4,179 retail and specialty pharmacy stores in 32 states and the District of Columbia. Please see Note 10 to ourconsolidated financial statements for further informationon our business segments.
RESULTS OF OPERATIONS AND INDUSTRY ANALYSIS
The Company’s fiscal year is a 52 or 53 week periodending on the Saturday nearest to December 31. Fiscal2003, which ended on January 3, 2004, included 53weeks. Fiscal 2002 and 2001, which ended on December28, 2002 and December 29, 2001, respectively, included 52 weeks. Unless otherwise noted, all references to yearsrelate to these fiscal years.
Net sales ~ The following table summarizes our salesperformance:
2003 2002 2001Net sales (in billions) $ 26.6 $ 24.2 $ 22.2Net sales increase:
Total 10.0% 8.7% 10.7%Pharmacy 11.9% 11.2% 14.5%Front store 5.7% 3.8% 3.9%
Same store sales increase:Total 5.8% 8.4% 8.6%Pharmacy 8.1% 11.7% 13.0%Front store 1.2% 2.3% 1.2%
Pharmacy % of total sales 68.8% 67.6% 66.1%Third party % of
pharmacy sales 93.2% 92.3% 90.9%Prescriptions filled
(in millions) 335 316 309
Management’s Discussion & Analysis of Finand Results of Operation
(18) CVS Corporation 2003 Annual Report(18) CVS Corporation 2003 Annual Report
As you review our net sales performance, we believe youshould consider the following important information:
— Total net sales from new stores accounted forapproximately 350 basis points of our total net salesincrease in 2003 and 210 basis points in 2002.
— Total net sales continued to benefit from our ongoingrelocation program, which moves existing shoppingcenter stores to larger, more convenient, freestandinglocations. Historically, we have achieved significantimprovements in customer count and net sales when we do this. Our relocation strategy remains animportant component of our overall growth strategy, as only 51% of our existing stores were freestanding as of January 3, 2004.
— Total net sales benefited from the 53rd week in 2003,which generated $530.8 million in net sales. If youexclude the impact of the 53rd week, net sales on acomparable 52-week basis, increased 7.8% in 2003when compared to 2002.
— Pharmacy sales continued to benefit from new marketexpansions, increased penetration in existing markets,our ability to attract and retain managed care customersand favorable industry trends. These trends include anaging American population that is consuming moreprescription drugs, the availability of new prescriptiondrugs, and the increased use of pharmaceuticals as thefirst line of defense for individual healthcare. We believethese favorable industry trends will continue.
— Pharmacy sales were negatively impacted in all years by the conversion of brand named drugs to equivalentgeneric drugs, which typically have a lower selling price.However, our gross margins on generic drug sales aregenerally higher than our gross margins on equivalentbrand named drug sales.
— Front store sales benefited from an increase inpromotional programs in 2002 that were designed to respond to competitive and economic conditions, and from the implementation of our Assisted Inventory Management system, which increased our in-stock positions.
— Total net sales were negatively impacted in 2002 by the 229 stores that were closed as part of a strategicrestructuring program. We estimate that the impact ofclosing these stores reduced our total net sales growthby approximately 120 basis points in 2002. We furtherestimate that sales transferred from these stores tonearby CVS stores and increased our total same storesales growth by approximately 60 basis points in 2002.

H_17_48 3/24/04 10:18 AM Page 19
— In recent years, the growth in mail order pharmacy has outpaced the growth in retail pharmacy. Recently, anumber of payors have changed their pharmacy benefitplan designs to require maintenance medications to befilled exclusively through mail order pharmacies. Toaddress this trend, we have dropped and/or renegotiateda number of third party programs that have adopted a plan of this kind. In the event this trend continues,and we elect to withdraw from current pharmacybenefit plans, and/or decide not to participate in futureprograms, we may not be able to sustain our currentrate of sales growth.
Gross margin, which includes net sales less the cost of merchandise sold during the reporting period and therelated purchasing costs, warehousing costs, delivery costsand actual and estimated inventory losses, as a percentageof net sales was 25.8% in 2003. This compares to 25.1%in 2002 and 25.6% in 2001. As you review our grossmargin performance, we believe you should consider the following important information:
— Inventory losses were 0.92% of total net sales in 2003, compared to 1.19% in 2002 and 1.52% in 2001. During 2002, we initiated a number of programsthat reduced inventory losses during the second half of2002 and we continued to see improvements in 2003.While we believe our programs will continue to providefuture operational benefits, we expect the financialimprovement trend realized in 2003 will be less significantin 2004. In addition, we cannot guarantee that ourprograms will continue to reduce inventory losses.
— Our front store gross margin rate benefited from a moreprofitable front store sales mix in 2003, which includedincreased sales of higher gross margin categories such as health and beauty.
— Our pharmacy gross margin rate benefited from an increase in generic drug sales in 2003, whichnormally yield a higher gross margin than brand namedrug sales.
— Our total gross margin rate benefited from an earlierand more severe flu season in 2003, which increasedover-the-counter product sales such as cough and coldand flu-related prescription sales, both of whichgenerally yield higher gross margins.
— Our gross margin rate continues to be adverselyaffected by pharmacy sales growing at a faster pace than front store sales. On average, our gross margin on pharmacy sales is lower than our gross margin on front store sales. Pharmacy sales were 68.8% of total sales in 2003, compared to 67.6% in 2002 and66.1% in 2001. In addition, sales to customers covered
by third party insurance programs have continued toincrease and, thus, have become a larger component of our total pharmacy business. On average, our grossmargin on third party pharmacy sales is lower than ourgross margin on non-third party pharmacy sales. Thirdparty pharmacy sales were 93.2% of pharmacy sales in2003, compared to 92.3% in 2002 and 90.9% in 2001.We expect these negative trends to continue.
— Our gross margin rate in 2002, was negatively impacted by higher markdowns associated withincreased promotional programs that were designed to respond to competitive and economic conditions.
— Our third party gross margin rates have been adverselyaffected by the efforts of managed care organizations,pharmacy benefit managers, governmental and otherthird party payors to reduce their prescription drugcosts. To address this trend, we have dropped and/orrenegotiated a number of third party programs that fell below our minimum profitability standards. To date, these efforts have helped stabilize our third party reimbursement rates. However, numerousstate legislatures have proposed or, at least, appear to be considering further reductions in pharmacyreimbursement rates for Medicaid and othergovernmental programs as well as other measures aimedat reducing their prescription drug costs. In the eventthis trend continues and we elect to, for any reason,withdraw from current third party programs and/ordecide not to participate in future programs, we maynot be able to sustain our current rate of sales growthand gross margin dollars could be adversely impacted.
Total operating expenses, which include store andadministrative payroll, employee benefits, store andadministrative occupancy costs, selling expenses,advertising expenses, administrative expenses anddepreciation and amortization expense were 20.5% of net sales in 2003. This compares to 20.1% of net sales in 2002 and 22.1% in 2001. As you review ourperformance in this area, we believe you should considerthe following items, which management removes in itsassessment of total operating expenses because their impact affects year-to-year comparability:
— As a result of adopting Statement of FinancialAccounting Standards (“SFAS”) No. 142 at thebeginning of 2002, we no longer amortize goodwill.Goodwill amortization totaled $31.4 million in 2001. Please see Note 4 to the consolidated financialstatements for further information on the impact of adopting SFAS No. 142.
(19)

Management’s Discussion & Analysis of Financial Condition and Results of Operation
H_17_48 3/24/04 10:18 AM Page 20
— During 2001, we recorded a $346.8 million pre-tax($226.9 million after-tax) restructuring and assetimpairment charge to total operating expenses inconnection with our 2001 strategic restructuring. We also recorded a $5.7 million pre-tax ($3.6 millionafter-tax) charge to cost of goods sold to reflect themarkdown of certain inventory contained in the stores to be closed to its net realizable value. In total,the restructuring and asset impairment charge was$352.5 million pre-tax ($230.5 million after-tax), the (“Restructuring Charge”). Please see Note 11 to the consolidated financial statements for furtherinformation on the 2001 strategic restructuring.
— During 2001, we received $50.3 million of settlementproceeds from various lawsuits against certainmanufacturers of brand name prescription drugs. Weelected to contribute $46.8 million of the settlementproceeds to the CVS Charitable Trust, Inc. to fundfuture charitable giving. The net effect of thesenonrecurring items was a $3.5 million pre-tax ($2.1 million after-tax) increase in net earnings.
If you exclude the impact of the items discussed above,comparable total operating expenses as a percentage of net sales were 20.5% in 2003, 20.1% in 2002 and20.4% in 2001.
As you review our comparable total operating expenses, we believe you should consider the following importantinformation:
— Total operating expenses as a percentage of net sales increased during 2003 as a result of increasedadvertising expense, higher payroll and benefit costs and lower sales growth resulting, in part, from highergeneric drug sales. The increase in payroll and benefitcosts were driven by an increase in the number of 24-hour stores, new stores and the implementation costs associated with strategic initiatives such as thePharmacy Service Initiative and Assisted InventoryManagement. Whereas we do not believe the increase in total operating expenses as a percentage of net salesthat occurred in 2003 will continue in 2004, we cannotguarantee that total operating expenses will decrease as a percentage of net sales in 2004.
— Total operating expenses as a percentage of net salesdecreased during 2002 primarily due to completing the 2001 strategic restructuring and implementingtechnology initiatives such as the Excellence inPharmacy Innovation and Care initiative (“EPIC”) that helped improve customer service while loweringoperating costs, particularly at the store level.
(20) CVS Corporation 2003 Annual Report
Interest expense, net consisted of the following:
In millions 2003 2002 2001Interest expense $ 53.9 $ 54.5 $ 65.2Interest income (5.8) (4.1) (4.2)Interest expense, net $ 48.1 $ 50.4 $ 61.0
The decrease in interest expense, net during 2003 primarilyresulted from an increase in interest income resulting from higher average cash balances. The decline in interestexpense, net in 2002 primarily resulted from lower averageinterest rates on our outstanding borrowings and loweraverage debt requirements due to improved working capital management.
Income tax provision ~ Our effective income tax rate was 38.4% in 2003, 38.0% in 2002 and 41.8% in 2001.The increase in our effective income tax rate in 2003 wasprimarily due to higher state income taxes. The decrease in our effective income tax rate in 2002 was primarily dueto the elimination of goodwill amortization that was notdeductible for income tax purposes. Our effective incometax rate was higher in 2001 because certain components ofthe Restructuring Charge were not deductible for incometax purposes. To better assess year-to-year performance,management removes the impact of the RestructuringCharge and uses 39.4% as a comparable 2001 effective tax rate.
Net earnings increased $130.7 million or 18.2% to $847.3 million (or $2.06 per diluted share) in 2003. This compares to $716.6 million (or $1.75 per dilutedshare) in 2002 and $413.2 million (or $1.00 per dilutedshare) in 2001. To better assess year-to-year performance,management removes the impact of the RestructuringCharge and the $2.1 million net nonrecurring gain in2001, and uses $641.6 million (or $1.56 per diluted share)for comparable net earnings results in 2001.
LIQUIDITY & CAPITAL RESOURCES
We anticipate that our cash flow from operations,supplemented by debt borrowings and sale-leasebacktransactions, will continue to fund the growth of our business.
Net cash provided by operating activities decreased to$968.9 million in 2003. This compares to $1,204.8 millionin 2002 and $680.6 million in 2001. The decrease in netcash provided by operations during 2003 primarily resultedfrom higher accounts receivable and lower accounts payable

H_17_48 3/24/04 10:18 AM Page 21
offset, in part, by higher net earnings. Accounts receivableincreased in 2003 primarily because our January 3, 2004year-end ended in the middle of many of our third partypayors’ biweekly payment cycles. Accounts payabledecreased primarily due to the timing of vendor payments.
Net cash used in investing activities increased to $753.6million in 2003. This compares to $735.8 million in 2002and $536.8 million in 2001. The increase in net cash usedin investing activities during 2003 was primarily due toacquisitions by our Pharmacy Benefit Management segmentand increased acquisitions of customer lists. Capitalexpenditures totaled $1,121.7 million during 2003,compared to $1,108.8 million in 2002 and $713.6 millionin 2001. During 2003, approximately 60% of our totalcapital expenditures were for new store construction, 22% for store expansion and improvements, 14% fortechnology and other corporate initiatives and 4% for a new distribution center in Texas, which is expected to be completed during the first quarter of 2004.
We finance a portion of our new store developmentprogram through sale-leaseback transactions. Proceeds from sale-leaseback transactions totaled $487.8 million in 2003. This compares to $448.8 million in 2002 and$323.3 million in 2001. Under the transactions, theproperties are sold at net book value and the resultingleases qualify and are accounted for as operating leases.During 2001, we also completed a sale-leasebacktransaction on five of our distribution centers. Thedistribution centers were sold at fair market value resultingin a $35.5 million gain, which was deferred and is beingamortized to offset rent expense over the life of the newoperating leases.
During 2004, we currently plan to invest over $1.1 billionin capital expenditures, which will include spending forapproximately 225-250 new or relocated stores, includingapproximately 100 in new markets.
Following is a summary of our store development activityfor the respective years:
2003 2002 2001Total stores
(beginning of year) 4,087 4,191 4,133New stores 150 174 126Closed stores (58) (278) (68)Total stores (end of year) 4,179 4,087 4,191Relocated stores(1) 125 92 122
(1) Relocated stores are not included in new or closed store totals.
Net cash used in financing activities increased to $72.5million in 2003. This compares to $4.9 million in 2002and $244.8 million in 2001. The increase in net cash usedin financing activities during 2003 was primarily becausewe issued no new long-term debt in 2003. Our net debt(i.e., our total debt less our cash and cash equivalents),decreased to $233.1 million, compared to $412.7 millionin 2002 and $836.3 million in 2001. During 2003, wepaid common stock dividends totaling $90.6 million or$0.23 per common share. In October 2003, our Board ofDirectors authorized a 15% increase in our common stockdividend to $0.265 per share for 2004.
We believe that our current cash on hand, cash providedby operations and sale-leaseback transactions, together withour ability to obtain additional short-term and long-termfinancing, will be sufficient to cover our working capitalneeds, capital expenditures, debt service and dividendrequirements for at least the next several years.
We had no commercial paper borrowings outstanding as ofJanuary 3, 2004. In connection with our commercial paperprogram, we maintain a $650 million, five-year unsecuredback-up credit facility, which expires on May 21, 2006 anda $600 million, 364-day unsecured back-up credit facility,which expires on May 17, 2004. We are currently evaluatingour long-term financing needs in connection with theexpiration of the 364-day facility. As of January 3, 2004,we had not borrowed against the back-up credit facilities.
Our credit facilities and unsecured senior notes containcustomary restrictive financial and operating covenants.These covenants do not include a requirement for theacceleration of our debt maturities in the event of adowngrade in our credit rating. We do not believe that the restrictions contained in these covenants materiallyaffect our financial or operating flexibility.
Our liquidity is based, in part, on maintaining stronginvestment-grade debt ratings. As of January 3, 2004, our long-term debt was rated “A2” by Moody’s and “A” by Standard & Poor’s, and our commercial paper programwas rated “P-1” by Moody’s and “A-1” by Standard andPoor’s, each on a negative outlook. In assessing our creditstrength, both Moody’s and Standard & Poor’s consider our capital structure and financial policies as well as ourconsolidated balance sheet and other financial information.We do not currently foresee any reasonable circumstancesunder which we believe we would lose our investment-gradedebt ratings. However, if our debt ratings were downgradedit could adversely impact, among other things, our futureborrowing costs, access to capital markets and new storeoperating lease costs.
(21)(21)

H_17_48 3/24/04 10:18 AM Page 22
Management’s Discussion & Analysis of Financial Condition and Results of Operation
The following table summarizes our significant contractual obligations as of January 3, 2004:
PAYMENTS DUE BY PERIOD
WITHIN 1-3 3-5 AFTERIn millions TOTAL 1 YEAR YEARS YEARS 5 YEARS
Operating leases $ 10,788.9 $ 855.9 $ 1,574.0 $ 1,366.1 $ 6,992.9Long-term debt 1,075.0 323.0 361.9 387.0 3.1Purchase obligations 163.0 32.6 65.2 65.2 —Other long-term liabilities reflected in
our consolidated balance sheet 173.0 36.6 87.7 18.6 30.1Capital lease obligations 1.3 0.2 0.4 0.4 0.3
$ 12,201.2 $ 1,248.3 $ 2,089.2 $ 1,837.3 $ 7,026.4
OFF-BALANCE SHEET ARRANGEMENTS
Other than in connection with executing operating leases,we do not participate in transactions that generaterelationships with unconsolidated entities or financialpartnerships, including variable interest entities, nor do we have or guarantee any off-balance sheet debt. We finance a portion of our new store developmentthrough sale-leaseback transactions, which involve sellingstores to unrelated parties at net book value and thenleasing the stores back under leases that qualify and areaccounted for as operating leases. We do not have anyretained or contingent interests in the stores nor do weprovide any guarantees, other than a corporate levelguarantee of the lease payments, in connection with thesale-leasebacks. In accordance with generally acceptedaccounting principles, our operating leases are not reflected in our consolidated balance sheet.
Between 1991 and 1997, the Company sold or spun off a number of subsidiaries, including Bob’s Stores, Linens ’n Things, Inc., Marshalls, Kay-Bee Toys, Wilsons,This End Up and Footstar, Inc. In many cases, when aformer subsidiary leased a store, the Company provided a corporate level guarantee of the store’s lease obligations.When the subsidiaries were disposed of, the Company’sguarantees remained in place, although each purchaserindemnified the Company for any lease obligations theCompany was required to satisfy. If any of the purchaserswere to become insolvent and failed to make the requiredpayments under a store lease, the Company could berequired to satisfy these obligations. As of January 3, 2004,the Company guaranteed approximately 706 stores withleases extending through 2018. Assuming that eachrespective purchaser became insolvent, and the Companywas required to assume all of these lease obligations, weestimate that the Company could settle the obligations for approximately $592 million as of January 3, 2004.
(22) CVS Corporation 2003 Annual Report
During 2003, Bob’s Stores and affiliates filed a voluntarypetition for bankruptcy under Chapter 11 of the U.S.Bankruptcy Code. Subsequent to the Bob’s Stores filing,The TJX Companies, Inc. (“TJX”) purchased substantiallyall of the assets of Bob’s Stores. Pursuant to the terms ofthe purchase, a subsidiary of TJX has assumed each of the Bob’s Stores leases that the Company has guaranteed.Furthermore, TJX has agreed to indemnify the Companyfor any liability the Company incurs or suffers in respect of lease obligations during the time TJX or its affiliateowns and operates these store locations.
In early 2004, KB Toys, Inc. and affiliates (“Kay-Bee Toys”) and Footstar, Inc. and affiliates (“Footstar”) eachfiled a voluntary petition for bankruptcy under Chapter 11of the U.S. Bankruptcy Code. Due to the preliminarynature of the Kay-Bee Toys and the Footstar proceedings,the Company is unable to determine at this time thepotential liability the Company may have under the Kay-BeeToys and Footstar leases it has guaranteed. However, theCompany believes that any potential liability with respectto these lease guarantee obligations would be mitigated by the indemnification the Company received fromConsolidated Stores Corporation (now known as Big Lots,Inc.) as purchaser of Kay-Bee Toys from the Company, andfrom Footstar in connection with the 1996 spin-off ofFootstar from the Company.
We believe the ultimate disposition of any of the corporatelevel guarantees will not have a material adverse effect onthe Company’s consolidated financial condition, results of operations or future cash flows.
The Company issues letters of credit for insuranceprograms and import purchases. The fair value of theoutstanding letters of credit was $72.0 million as ofJanuary 3, 2004.

H_17_48 3/24/04 10:18 AM Page 23
CRITICAL ACCOUNTING POLICIES
We prepare our consolidated financial statements inconformity with generally accepted accounting principles,which requires management to make certain estimates and apply judgment. We base our estimates and judgmentson historical experience, current trends and other factorsthat management believes to be important at the time theconsolidated financial statements are prepared. On aregular basis, we review our accounting policies and howthey are applied and disclosed in our consolidated financialstatements. While we believe that the historical experience,current trends and other factors considered support thepreparation of our consolidated financial statements inconformity with generally accepted accounting principles,actual results could differ from our estimates, and suchdifferences could be material.
Our significant accounting policies are discussed in Note 1to our consolidated financial statements. We believe thefollowing accounting policies include a higher degree ofjudgment and/or complexity and, thus, are considered to be critical accounting policies. The critical accountingpolicies discussed below are applicable to both of ourbusiness segments. We have discussed the development and selection of our critical accounting policies with theAudit Committee of our Board of Directors and the AuditCommittee has reviewed our disclosures relating to them.
Impairment of Long-Lived AssetsWe evaluate the recoverability of long-lived assets, includingintangible assets with finite lives, but excluding goodwill,which is tested for impairment using a separate test,annually or whenever events or changes in circumstancesindicate that the carrying value of an asset may not berecoverable. We group and evaluate long-lived assets forimpairment at the individual store level, which is the lowestlevel at which individual cash flows can be identified. When evaluating long-lived assets for potential impairment,we first compare the carrying amount of the asset to theindividual store’s estimated future cash flows (undiscountedand without interest charges). If the estimated future cashflows are less than the carrying amount of the asset, animpairment loss calculation is prepared. The impairmentloss calculation compares the carrying amount of the asset to the individual store’s estimated future cash flows(discounted and with interest charges). If required, animpairment loss is recorded for the portion of the asset’scarrying value that exceeds the asset’s estimated future cash flow (discounted and with interest charges).
Our impairment loss calculation contains uncertainty since we must use judgment to estimate each store’s future sales, profitability and cash flows. When preparingthese estimates, we consider each store’s historical resultsand current operating trends and our consolidated sales,profitability and cash flow results and forecasts. Theseestimates can be affected by a number of factors including,but not limited to, general economic conditions, the cost ofreal estate, the continued efforts of third party organizationsto reduce their prescription drug costs, the continuedefforts of competitors to gain market share and consumerspending patterns. Effective for fiscal 2002, we adoptedSFAS No. 144, “Accounting for Impairment or Disposal ofLong-Lived Assets.” The adoption did not have a materialimpact on our impairment loss methodology and we havenot made any other material changes to our impairmentloss assessment methodology during the past three years.
Closed Store Lease LiabilityWe account for closed store lease termination costs inaccordance with SFAS No. 146, “Accounting for CostsAssociated with Exit or Disposal Activities.” As such, when a leased store is closed, we record a liability for theestimated present value of the remaining obligation underthe noncancelable lease, which includes future real estatetaxes, common area maintenance and other charges, ifapplicable. The liability is reduced by estimated futuresublease income.
The calculation of our closed store lease liability containsuncertainty since we must use judgment to estimate thetiming and duration of future vacancy periods, the amountand timing of future lump sum settlement payments andthe amount and timing of potential future sublease income.When estimating these potential termination costs andtheir related timing, we consider a number of factors,which include, but are not limited to, historical settlementexperience, the owner of the property, the location andcondition of the property, the terms of the underlying lease,the specific marketplace demand and general economicconditions. We have not made any material changes in the reserve methodology used to record closed store leasereserves during the past three years.
Self-Insurance LiabilitiesWe are self insured for certain losses related to generalliability, worker’s compensation and auto liability althoughwe maintain stop loss coverage with third party insurers tolimit our total liability exposure.
(23)

Management’s Discussion & Analysis of Financial Condition and Results of Operation
H_17_48 3/24/04 10:18 AM Page 24
The estimate of our self-insurance liability containsuncertainty since we must use judgment to estimate theultimate cost that will be incurred to settle reported claimsand unreported claims for incidents incurred but notreported as of the balance sheet date. When estimating our self-insurance liability, we consider a number of factors, which include, but are not limited to, historicalclaim experience, demographic factors, severity factors andvaluations provided by independent third-party actuaries.On a quarterly basis, we review our assumptions with our independent third party actuaries to determine that our self-insurance liability is adequate. We have not madeany material changes in the accounting methodology usedto establish our self-insurance liability during the past three years.
InventoryOur inventory is stated at the lower of cost or market on a first-in, first-out basis using the retail method ofaccounting to determine cost of sales and inventory in ourstores, and the cost method of accounting to determineinventory in our distribution centers. Under the retailmethod, inventory is stated at cost, which is determined by applying a cost-to-retail ratio to the ending retail valueof our inventory. Since the retail value of our inventory is adjusted on a regular basis to reflect current marketconditions, our carrying value should approximate thelower of cost or market. In addition, we reduce the value of our ending inventory for estimated inventory losses thathave occurred during the interim period between physicalinventory counts. Physical inventory counts are taken on a regular basis in each location to ensure that the amountsreflected in the consolidated financial statements areproperly stated.
The accounting for inventory contains uncertainty since we must use judgment to estimate the inventory losses that have occurred during the interim period betweenphysical inventory counts. When estimating these losses, we consider a number of factors, which include but are not limited to, historical physical inventory results on alocation-by-location basis and current inventory loss trends.We have not made any material changes in the accountingmethodology used to establish our inventory loss reservesduring the past three years.
Although we believe that the estimates discussed above arereasonable and the related calculations conform to generallyaccepted accounting principles, actual results could differfrom our estimates, and such differences could be material.
(24) CVS Corporation 2003 Annual Report
RECENT ACCOUNTING PRONOUNCEMENTS
We adopted Emerging Issues Task Force (“EITF”) Issue No. 02-16, “Accounting by a Reseller for Cash ConsiderationReceived from a Vendor,” on a prospective basis effectiveDecember 29, 2002. This pronouncement requires vendorallowances be treated as a reduction in inventory costsunless specifically identified as a reimbursement for otherservices. In addition, any vendor allowances received inexcess of the cost incurred for such services should also betreated as a reduction of inventory costs. The adoption ofthis pronouncement resulted in a $13.3 million reductionin net earnings during 2003.
We adopted SFAS No. 150, “Accounting for CertainFinancial Instruments with Characteristics of BothLiabilities and Equity,” effective June 15, 2003. ThisStatement requires certain instruments previously classifiedas equity on a company’s consolidated balance sheet to nowbe classified as liabilities. The adoption of this Statementdid not have a material impact on our consolidated resultsof operations or financial position.
We adopted SFAS No. 132, (revised 2003) “Employer’sDisclosures about Pensions and Other PostretirementBenefits,” effective December 15, 2003. This Statementrequires disclosures in addition to those required in theoriginal Statement 132 about the assets, obligations, cashflows, and net periodic benefit cost of defined benefitpension plans and other defined benefit postretirement plans.
In November 2003, the EITF reached a consensus on Issue 03-10, “Application of EITF Issue No. 02-16,Accounting by a Customer (Including a Reseller) forCertain Consideration Received from a Vendor, by Resellers to Sales Incentives Offered to Consumers byManufacturers,” effective in fiscal periods beginning afterNovember 26, 2003. We do not expect the adoption of thisStatement will have a material impact on our consolidatedresults of operations or financial position.

H_17_48 3/24/04 10:18 AM Page 25
CAUTIONARY STATEMENT CONCERNING
FORWARD-LOOKING STATEMENTS
The Private Securities Litigation Reform Act of 1995 (the“Reform Act”) provides a safe harbor for forward-lookingstatements made by or on behalf of CVS Corporation. The Company and its representatives may, from time totime, make written or verbal forward-looking statements,including statements contained in the Company’s filingswith the Securities and Exchange Commission and in itsreports to stockholders. Generally, the inclusion of thewords “believe,” “expect,” “intend,” “estimate,” “project,”“anticipate,” “will” and similar expressions identifystatements that constitute forward-looking statements. All statements addressing operating performance of CVSCorporation or any subsidiary, events or developments that the Company expects or anticipates will occur in the future, including statements relating to sales growth,earnings or earnings per common share growth, free cash flow, debt rating, inventory levels, inventory turn and loss rates, store development, relocations and newmarket entries, as well as statements expressing optimismor pessimism about future operating results or events, are forward-looking statements within the meaning of the Reform Act. The forward-looking statements are and will be based upon management’s then-current viewsand assumptions regarding future events and operatingperformance, and are applicable only as of the dates of such statements. The Company undertakes no obligation toupdate or revise any forward-looking statements, whetheras a result of new information, future events, or otherwise.By their nature, all forward-looking statements involve risksand uncertainties. Actual results may differ materially fromthose contemplated by the forward-looking statements for a number of reasons, including, but not limited to:
— The continued efforts of health maintenanceorganizations, managed care organizations, pharmacybenefit management companies, governmental entitiesand other third party payors to reduce prescription drugcosts and pharmacy reimbursement rates;
— The growth of mail order pharmacies and changes to pharmacy benefit plans requiring maintenancemedications to be filled exclusively through mail order pharmacies;
— Increased competition from other drugstore chains,supermarkets, discount retailers, membership clubs, and internet companies as well as changes in consumerpreferences or loyalties;
— The frequency and rate of introduction of successfulnew prescription drugs;
— Our ability to generate sufficient cash flows to supportcapital expansion and general operating activities;
— Interest rate fluctuations and changes in capital marketconditions or other events affecting our ability to obtainnecessary financing on favorable terms;
— Our ability to identify, implement and successfullymanage and finance strategic expansion opportunitiesincluding entering new markets, acquisitions and joint ventures;
— Our ability to establish effective advertising, marketingand promotional programs (including pricing strategiesand price reduction programs implemented in responseto competitive pressures and/or to drive demand);
— Our ability to continue to secure suitable new storelocations under acceptable lease terms;
— Our ability to attract, hire and retain suitablepharmacists and management personnel;
— Our ability to achieve cost efficiencies and other benefitsfrom various operational initiatives and technologicalenhancements;
— Litigation risks as well as changes in laws andregulations, including changes in accounting standardsand taxation requirements (including tax rate changes,new tax laws and revised tax law interpretations);
— The creditworthiness of the purchasers of businessesformerly owned by CVS and whose leases areguaranteed by CVS;
— Fluctuations in inventory cost, availability and loss levelsand our ability to maintain relationships with supplierson favorable terms;
— Our ability to implement successfully and to managenew computer systems and technologies;
— The strength of the economy in general or in themarkets served by CVS, including changes in consumerpurchasing power and/or spending patterns; and
— Other risks and uncertainties detailed from time to time in our filings with the Securities and ExchangeCommission.
The foregoing list is not exhaustive. There can be noassurance that the Company has correctly identified andappropriately assessed all factors affecting its business.Additional risks and uncertainties not presently known tothe Company or that it currently believes to be immaterialalso may adversely impact the Company. Should any risks and uncertainties develop into actual events, thesedevelopments could have material adverse effects on theCompany’s business, financial condition and results ofoperations. For these reasons, you are cautioned not toplace undue reliance on the Company’s forward-lookingstatements.
(25)(25)

H_17_48 3/24/04 10:18 AM Page 26
FISCAL YEAR ENDED
JAN. 3, DEC. 28, DEC. 29,2004 2002 2001
In millions, except per share amounts (53 WEEKS) (52 WEEKS) (52 WEEKS)
Net sales $ 26,588.0 $ 24,181.5 $ 22,241.4Cost of goods sold, buying and warehousing costs 19,725.0 18,112.7 16,550.4
Gross margin 6,863.0 6,068.8 5,691.0Selling, general and administrative expenses 5,097.7 4,552.3 4,599.6Depreciation and amortization 341.7 310.3 320.8
Total operating expenses 5,439.4 4,862.6 4,920.4Operating profit 1,423.6 1,206.2 770.6Interest expense, net 48.1 50.4 61.0Earnings before income tax provision 1,375.5 1,155.8 709.6Income tax provision 528.2 439.2 296.4Net earnings 847.3 716.6 413.2Preference dividends, net of income tax benefit 14.6 14.8 14.7Net earnings available to common shareholders $ 832.7 $ 701.8 $ 398.5BASIC EARNINGS PER COMMON SHARE:
Net earnings $ 2.11 $ 1.79 $ 1.02Weighted average common shares outstanding 394.4 392.3 392.2
DILUTED EARNINGS PER COMMON SHARE:Net earnings $ 2.06 $ 1.75 $ 1.00Weighted average common shares outstanding 407.7 405.3 408.3
DIVIDENDS DECLARED PER COMMON SHARE $ 0.230 $ 0.230 $ 0.230
See accompanying notes to consolidated financial statements.
Consolidated Statements of Operations
(26) CVS Corporation 2003 Annual Report(26) CVS Corporation 2003 Annual Report

H_17_48 3/24/04 10:18 AM Page 27
JAN. 3, DEC. 28,In millions, except shares and per share amounts 2004 2002
ASSETS:Cash and cash equivalents $ 843.2 $ 700.4Accounts receivable, net 1,349.6 1,019.3Inventories 4,016.5 4,013.9Deferred income taxes 252.1 216.4Other current assets 35.1 32.1
TOTAL CURRENT ASSETS 6,496.5 5,982.1
Property and equipment, net 2,542.1 2,215.8Goodwill 889.0 878.9Intangible assets, net 403.7 351.4Deferred income taxes — 6.6Other assets 211.8 210.5
TOTAL ASSETS $ 10,543.1 $ 9,645.3
LIABILITIES:Accounts payable $ 1,666.4 $ 1,707.9Accrued expenses 1,499.6 1,361.2Short-term debt — 4.8Current portion of long-term debt 323.2 32.0
TOTAL CURRENT LIABILITIES 3,489.2 3,105.9
Long-term debt 753.1 1,076.3Deferred income taxes 41.6 —Other long-term liabilities 237.4 266.1
Commitments and contingencies (Note 9)
SHAREHOLDERS’ EQUITY:Preferred stock, $0.01 par value: authorized 120,619 shares;
no shares issued or outstanding — —Preference stock, series one ESOP convertible, par value $1.00: authorized
50,000,000 shares; issued and outstanding 4,541,000 shares at January 3, 2004 and 4,685,000 shares at December 28, 2002 242.7 250.4
Common stock, par value $0.01: authorized 1,000,000,000 shares; issued 410,187,000 shares at January 3, 2004 and 409,286,000 shares at December 28, 2002 4.1 4.1
Treasury stock, at cost: 14,803,000 shares at January 3, 2004 and 16,215,000 shares at December 28, 2002 (428.6) (469.5)
Guaranteed ESOP obligation (163.2) (194.4)Capital surplus 1,557.2 1,546.6Retained earnings 4,846.5 4,104.4Accumulated other comprehensive loss (36.9) (44.6)
TOTAL SHAREHOLDERS’ EQUITY 6,021.8 5,197.0TOTAL LIABILITIES AND SHAREHOLDERS’ EQUITY $ 10,543.1 $ 9,645.3
See accompanying notes to consolidated financial statements.
Consolidated Balance Sheets
(27)(27)

H_17_48 3/24/04 10:18 AM Page 28
SHARES DOLLARS
JAN. 3, DEC. 28, DEC. 29, JAN. 3, DEC. 28, DEC. 29,In millions 2004 2002 2001 2004 2002 2001
PREFERENCE STOCK:Beginning of year 4.7 4.9 5.0 $ 250.4 $ 261.2 $ 267.5Conversion to common stock (0.2) (0.2) (0.1) (7.7) (10.8) (6.3)End of year 4.5 4.7 4.9 242.7 250.4 261.2
COMMON STOCK:Beginning of year 409.3 408.5 407.4 4.1 4.1 4.1Stock options exercised and awards 0.9 0.8 1.1 — — —End of year 410.2 409.3 408.5 4.1 4.1 4.1
TREASURY STOCK:Beginning of year (16.2) (17.6) (15.1) (469.5) (510.8) (404.9)Purchase of treasury shares — — (3.4) (0.5) — (129.0)Conversion of preference stock 0.3 0.5 0.3 9.6 13.5 7.5Employee stock purchase plan issuance 1.1 0.9 0.6 31.8 27.8 15.6End of year (14.8) (16.2) (17.6) (428.6) (469.5) (510.8)
GUARANTEED ESOP OBLIGATION:Beginning of year (194.4) (219.9) (240.6)Reduction of guaranteed ESOP obligation 31.2 25.5 20.7End of year (163.2) (194.4) (219.9)
CAPITAL SURPLUS:Beginning of year 1,546.6 1,539.6 1,493.8Conversion of preference stock (1.9) (2.7) (1.2)Stock option activity and awards 9.2 6.7 33.9Tax benefit on stock options and awards 3.3 3.0 13.1End of year 1,557.2 1,546.6 1,539.6
ACCUMULATED OTHER COMPREHENSIVE LOSS:Beginning of year (44.6) — —Minimum pension liability adjustment 7.7 (44.6) —End of year (36.9) (44.6) —
RETAINED EARNINGS:Beginning of year 4,104.4 3,492.7 3,184.7Net earnings 847.3 716.6 413.2Preference stock dividends (17.7) (18.3) (19.1)Tax benefit on preference stock dividends 3.1 3.5 4.4Common stock dividends (90.6) (90.1) (90.5)End of year 4,846.5 4,104.4 3,492.7
TOTAL SHAREHOLDERS’ EQUITY $ 6,021.8 $ 5,197.0 $ 4,566.9
COMPREHENSIVE INCOME:Net earnings $ 847.3 $ 716.6 $ 413.2Minimum pension liability, net of income tax 7.7 (44.6) —
Comprehensive income $ 855.0 $ 672.0 $ 413.2
See accompanying notes to consolidated financial statements.
Consolidated Statements of Shareholders’ Equity
(28) CVS Corporation 2003 Annual Report(28) CVS Corporation 2003 Annual Report

H_17_48 3/24/04 10:18 AM Page 29
FISCAL YEAR ENDED
JAN. 3, DEC. 28, DEC. 29,2004 2002 2001
In millions (53 WEEKS) (52 WEEKS) (52 WEEKS)
CASH FLOWS FROM OPERATING ACTIVITIES:Net earnings $ 847.3 $ 716.6 $ 413.2Adjustments required to reconcile net earnings to net cash
provided by operating activities:Restructuring charge — — 352.5Depreciation and amortization 341.7 310.3 320.8Deferred income taxes and other noncash items 41.1 71.8 (83.5)
Change in operating assets and liabilities providing/(requiring) cash, net of effects from acquisitions:Accounts receivable, net (311.1) (53.1) (141.7)Inventories 2.1 (95.3) (366.8)Other current assets (3.0) 12.5 4.1Other assets (0.4) (35.3) (13.9)Accounts payable (41.5) 172.0 184.4Accrued expenses 116.5 105.0 11.6Other long-term liabilities (23.8) 0.3 (0.1)
NET CASH PROVIDED BY OPERATING ACTIVITIES 968.9 1,204.8 680.6
CASH FLOWS FROM INVESTING ACTIVITIES:Additions to property and equipment (1,121.7) (1,108.8) (713.6)Proceeds from sale-leaseback transactions 487.8 448.8 323.3Acquisitions, net of cash and investments (133.1) (93.5) (159.1)Proceeds from sale or disposal of assets 13.4 17.7 12.6
NET CASH USED IN INVESTING ACTIVITIES (753.6) (735.8) (536.8)
CASH FLOWS FROM FINANCING ACTIVITIES:Reductions in long-term debt (0.8) (3.1) (1.0)Additions to long-term debt — 300.0 296.9Proceeds from exercise of stock options 38.3 34.0 47.3Dividends paid (105.2) (104.9) (105.2)Purchase of treasury shares — — (129.0)Reductions in short-term borrowings (4.8) (230.9) (353.8)
NET CASH USED IN FINANCING ACTIVITIES (72.5) (4.9) (244.8)
Net increase (decrease) in cash and cash equivalents 142.8 464.1 (101.0)Cash and cash equivalents at beginning of year 700.4 236.3 337.3CASH AND CASH EQUIVALENTS AT END OF YEAR $ 843.2 $ 700.4 $ 236.3
See accompanying notes to consolidated financial statements.
Consolidated Statements of Cash Flows
(29)(29)

ts
H_17_48 3/24/04 10:18 AM Page 30
1— SIGNIFICANT ACCOUNTING POLICIES
Description of business ~ CVS Corporation (the“Company”) is a leader in the retail drugstore industry in the United States. The Company sells prescription drugs and a wide assortment of general merchandise,including over-the-counter drugs, greeting cards, film and photofinishing services, beauty products and cosmetics,seasonal merchandise and convenience foods, through itsCVS/pharmacy® stores and online through CVS.com®. TheCompany also provides Pharmacy Benefit Management and Specialty Pharmacy services through PharmaCareManagement Services. As of January 3, 2004, the Companyoperated 4,179 retail and specialty pharmacy stores in 32 states and the District of Columbia. See Note 10 for further information about the Company’s business segments.
Basis of presentation ~ The consolidated financialstatements include the accounts of the Company and itswholly-owned subsidiaries. All material intercompanybalances and transactions have been eliminated.
Fiscal Year ~ The Company’s fiscal year is a 52 or 53 weekperiod ending on the Saturday nearest to December 31.Fiscal 2003, which ended on January 3, 2004, included 53 weeks, while fiscal years 2002 and 2001 which ended on December 28, 2002 and December 29, 2001,respectively, included 52 weeks. Unless otherwise noted, all references to years relate to the Company’s fiscal year.
Reclassifications ~ Certain reclassifications have been madeto the consolidated financial statements of prior years toconform to the current year presentation.
Use of estimates ~ The preparation of financial statementsin conformity with generally accepted accounting principlesrequires management to make estimates and assumptionsthat affect the reported amounts in the consolidatedfinancial statements and accompanying notes. Actual results could differ from those estimates.
Cash and cash equivalents ~ Cash and cash equivalentsconsist of cash and temporary investments with maturitiesof three months or less when purchased.
Accounts receivable ~ Accounts receivable are stated net of an allowance for uncollectible accounts of $58.4 millionand $64.2 million as of January 3, 2004 and December 28,2002, respectively. The balance primarily includes amountsdue from third party providers (e.g., pharmacy benefitmanagers, insurance companies and governmental agencies)and vendors.
Notes to Consolidated Financial Statemen
(30) CVS Corporation 2003 Annual Report
Fair value of financial instruments ~ As of January 3,2004, the Company’s financial instruments include cashand cash equivalents, accounts receivable, accounts payableand debt. Due to the short-term nature of these instruments,the Company’s carrying value approximates fair value. Thecarrying amount of long-term debt was $1.1 billion andthe estimated fair value was $1.1 billion as of January 3,2004 and December 28, 2002. The fair value of long-termdebt was estimated based on rates currently offered to theCompany for debt with similar maturities. The Companyalso had outstanding letters of credit, which guaranteedforeign trade purchases, with a fair value of $6.5 million as of January 3, 2004, and $5.8 million as of December 28,2002. The Company also has outstanding letters of creditassociated with insurance programs with a fair value of$65.5 million as of January 3, 2004 and $53.1 million as of December 28, 2002. There were no investments inderivative financial instruments as of January 3, 2004 or December 28, 2002.
Inventories ~ Inventory is stated at the lower of cost ormarket on a first-in, first-out basis using the retail methodof accounting to determine cost of sales and inventory inour stores and the cost method of accounting to determineinventory in our distribution centers. Independent physicalinventory counts are taken on a regular basis in each storeand distribution center location to ensure that the amountsreflected in the accompanying consolidated financialstatements are properly stated. During the interim periodbetween physical inventory counts, the Company accruesfor anticipated physical inventory losses on a location-by-location basis based on historical results and current trends.
Property and equipment ~ Property, equipment andimprovements to leased premises are depreciated using the straight-line method over the estimated useful lives of the assets, or when applicable, the term of the lease,whichever is shorter. Estimated useful lives generally rangefrom 10 to 40 years for buildings, building improvementsand leasehold improvements and 5 to 10 years for fixturesand equipment. Repair and maintenance costs are chargeddirectly to expense as incurred. Major renewals orreplacements that substantially extend the useful life of an asset are capitalized and depreciated.

H_17_48 3/24/04 10:18 AM Page 31
Following are the components of property and equipmentincluded in the consolidated balance sheets as of therespective balance sheet dates:
In millions JAN. 3, 2004 DEC. 28, 2002Land $ 180.7 $ 132.3Building and improvements 492.8 479.2Fixtures and equipment 2,123.3 1,769.3Leasehold improvements 1,012.8 899.0Capitalized software 149.5 124.5Capital leases 1.3 1.3
3,960.4 3,405.6Accumulated depreciation
and amortization (1,418.3) (1,189.8)$ 2,542.1 $ 2,215.8
In accordance with Statement of Position No. 98-1,“Accounting for the Costs of Computer Software Developedor Obtained for Internal Use,” the Company capitalizesapplication stage development costs for significantinternally developed software projects. These costs areamortized over a 5-year period. Unamortized costs were$90.6 million as of January 3, 2004 and $89.5 million as of December 28, 2002.
Impairment of long-lived assets ~ The Company groupsand evaluates fixed and intangible assets excludinggoodwill, for impairment at the individual store level,which is the lowest level at which individual cash flows can be identified. When evaluating assets for potentialimpairment, the Company first compares the carryingamount of the asset to the asset’s estimated future cashflows (undiscounted and without interest charges). If theestimated future cash flows used in this analysis are lessthan the carrying amount of the asset, an impairment losscalculation is prepared. The impairment loss calculationcompares the carrying amount of the asset to the asset’sestimated future cash flows (discounted and with interestcharges). If the carrying amount exceeds the asset’sestimated future cash flows (discounted and with interestcharges), the loss is allocated to the long-lived assets of the group on a pro rata basis using the relative carryingamounts of those assets.
Intangible assets ~ Purchased customer lists are amortizedon a straight-line basis over their estimated useful lives of up to 10 years. Purchased leases are amortized on a straight-line basis over the remaining life of the lease. See Note 4 for further information on intangible assets.
Revenue recognition ~ The Company recognizes revenuefrom the sale of merchandise at the time the merchandise issold. Service revenue from the Company’s pharmacy benefit
management segment, which is recognized using the net method under Emerging Issues Task Force (“EITF”)No. 99-19, “Reporting Revenue Gross as a Principal VersusNet as an Agent,” is recognized at the time the service isprovided. Service revenue totaled $96.0 million in 2003,$84.9 million in 2002 and $82.1 million in 2001. TheCompany offers sales incentives that entitle customers toreceive a reduction in the price of a product or service. Forsales incentives in which the Company is the obligor, thereduction in revenue is recognized at the time the productor service is sold. Customer returns are immaterial.
Vendor allowances ~ The Company accounts for vendorallowances under the guidance provided by EITF No. 02-16, “Accounting by a Reseller for Cash ConsiderationReceived from a Vendor.” Vendor allowances reduce thecarrying cost of inventory unless they are specificallyidentified as a reimbursement for promotional programsand/or other services provided. Funds that are directlylinked to advertising commitments are recognized as areduction of advertising expense in the selling, general andadministrative expenses line when the related advertisingcommitment is satisfied. Any such allowances received inexcess of the actual cost incurred also reduce the carryingcost of inventory. The total value of any upfront paymentsreceived from vendors that are linked to purchasecommitments is initially deferred. The deferred amountsare then amortized to reduce cost of goods sold over thelife of the contract based upon purchase volume. The totalvalue of any upfront payments received from vendors thatare not linked to purchase commitments is also initiallydeferred. The deferred amounts are then amortized toreduce cost of goods sold on a straight-line basis over thelife of the related contract. The total amortization of theseupfront payments was not material to the accompanyingconsolidated financial statements.
Store opening and closing costs ~ New store opening costs, other than capital expenditures, are charged directlyto expense when incurred. When the Company closes astore, the present value of estimated unrecoverable costs,including the remaining lease obligation less estimatedsublease income and the book value of abandoned propertyand equipment, are charged to expense.
Insurance ~ The Company is self-insured for certain lossesrelated to general liability, workers’ compensation andautomobile liability. The Company obtains third partyinsurance coverage to limit exposure from these claims.The Company’s self-insurance accruals, which includereported claims and claims incurred but not reported, are calculated using standard insurance industry actuarial assumptions and the Company’s historical claims experience.
(31)

uffefASc
H_17_48 3/24/04 10:18 AM Page 32
Stock-based compensation ~ The Company accounts for its stock-based compensation plans under the recognitionand measurement principles of Accounting Principles Board(“APB”) Opinion No. 25, “Accounting for Stock Issued to Employees,” and related interpretations. As such, nostock-based employee compensation cost is reflected in netearnings for options granted under those plans since theyhad an exercise price equal to the market value of the
Notes to Consolidated Financial Statements
In millions, except per share amounts 2003 2002 2001Net earnings, as reported $ 847.3 $ 716.6 $ 413.2
Add: Stock-based employee compensation expense included in reported net earnings, net of related tax effects(1) 2.2 2.7 3.3
Deduct: Total stock-based employee compensation expense determined under fair value based method for all awards, net of related tax effects 52.4 56.8 59.4
Pro forma net earnings $ 797.1 $ 662.5 $ 357.1Basic EPS: As reported $ 2.11 $ 1.79 $ 1.02
Pro forma 1.98 1.65 0.87Diluted EPS: As reported $ 2.06 $ 1.75 $ 1.00
Pro forma 1.95 1.62 0.86
(1) Amounts represent the after-tax compensation costs for restricted stock grants.
(32) CVS Corporation 2003 Annual Report
Advertising costs ~ Advertising costs are expensed whenthe related advertising takes place. Advertising costs, net of vendor funding, which is included in selling, general and administrative expenses, were $178.2 million in 2003,$152.2 million in 2002 and $126.9 million in 2001.
Interest expense, net ~ Interest expense was $53.9 million,$54.5 million and $65.2 million and interest income was$5.8 million, $4.1 million and $4.2 million in 2003, 2002and 2001, respectively. Capitalized interest totaled $11.0million in 2003, $6.1 million in 2002 and $10.1 million in 2001. Interest paid totaled $64.9 million in 2003, $60.7 million in 2002 and $75.2 million in 2001.
Nonrecurring items ~ During 2001, the Company received$50.3 million of settlement proceeds from various lawsuitsagainst certain manufacturers of brand name prescriptiondrugs. The Company elected to contribute $46.8 million of the settlement proceeds to the CVS Charitable Trust, Inc. The net effect of the two nonrecurring items was a$3.5 million pre-tax ($2.1 million after-tax) increase in net earnings (the “Net Litigation Gain”). The Companyalso recorded a $352.5 million pre-tax ($230.5 millionafter-tax) restructuring and asset impairment charge inconnection with the 2001 strategic restructuring, whichresulted from a comprehensive business review designed to streamline operations and enhance operating efficiencies.See Note 11 for further information on the 2001 strategicrestructuring and resulting charge.
nderlying common stock on the date of grant. See Note 7or further information on stock-based compensation. Theollowing table summarizes the effect on net earnings andarnings per common share if the company had applied theair value recognition provisions of Statement of Financialccounting Standards (“SFAS”) No. 123, “Accounting fortock-Based Compensation,” to stock-based employeeompensation for the respective years:
Income taxes ~ The Company provides for federal and state income taxes currently payable, as well as for thosedeferred because of timing differences between reportingincome and expenses for financial statement purposesversus tax purposes. Federal and state incentive tax creditsare recorded as a reduction of income taxes. Deferred tax assets and liabilities are recognized for the future tax consequences attributable to differences between the carrying amount of assets and liabilities for financialreporting purposes and the amounts used for income taxpurposes. Deferred tax assets and liabilities are measuredusing the enacted tax rates expected to apply to taxableincome in the years in which those temporary differencesare expected to be recoverable or settled. The effect of a change in tax rates is recognized as income or expense in the period of the change.
Accumulated other comprehensive loss ~ Accumulatedother comprehensive loss consists of a $36.9 million and$44.6 million minimum pension liability, net of a $22.5and $27.3 million income tax benefit, as of January 3,2004 and December 28, 2002, respectively. There was no accumulated other comprehensive income or loss as of December 29, 2001.
Earnings per common share ~ Basic earnings per common share is computed by dividing: (i) net earnings,after deducting the after-tax ESOP preference dividends, by (ii) the weighted average number of common shares
H_17_48 3/24/04 10:18 AM Page 33
outstanding during the year (the “Basic Shares”). When computing diluted earnings per common share, the Company assumes that the ESOP preference stock isconverted into common stock and all dilutive stock optionsare exercised. After the assumed ESOP preference stockconversion, the ESOP trust would hold common stockrather than ESOP preference stock and would receivecommon stock dividends (currently $0.23 per share) ratherthan ESOP preference stock dividends (currently $3.90 pershare). Since the ESOP Trust uses the dividends it receivesto service its debt, the Company would have to increase itscontribution to the ESOP trust to compensate it for thelower dividends. This additional contribution would reducethe Company’s net earnings, which in turn, would reducethe amounts that would be accrued under the Company’sincentive compensation plans.
Diluted earnings per common share is computed bydividing: (i) net earnings, after accounting for thedifference between the dividends on the ESOP preferencestock and common stock and after making adjustments for the incentive compensation plans by (ii) Basic Sharesplus the additional shares that would be issued assumingthat all dilutive stock options are exercised and the ESOPpreference stock is converted into common stock. Optionsto purchase 18.5 million and 20.0 million shares ofcommon stock were outstanding as of January 3, 2004 and December 28, 2002, respectively, but were not includedin the calculation of diluted earnings per share because the options’ exercise prices were greater than the averagemarket price of the common shares and, therefore, theeffect would be antidilutive.
New Accounting Pronouncements ~ The Company adopted SFAS No. 143, “Accounting for Asset RetirementObligations,” effective December 29, 2002. This statementapplies to legal obligations associated with the retirement of certain tangible long-lived assets. The adoption of thisStatement did not have a material impact on the Company’sconsolidated results of operations or financial position.
The Company adopted SFAS No. 145, “Rescission of FASB Statements No. 4, 44 and 64, Amendment of FASB Statement No. 13, and Technical Corrections,”effective December 29, 2002. This statement (i) eliminatesextraordinary accounting treatment for a gain or lossreported on the extinguishment of debt, (ii) eliminatesinconsistencies in the accounting required for sale-leasebacktransactions and certain lease modifications with similareconomic effects and (iii) amends other existingauthoritative pronouncements to make technicalcorrections, clarify meanings or describe their applicabilityunder changed conditions. The adoption of this Statement
did not have a material impact on the Company’sconsolidated results of operations or financial position.
The Company adopted SFAS No. 146, “Accounting for Costs Associated with Exit or Disposal Activities,”effective December 29, 2002. This Statement nullifiesexisting guidance related to the accounting and reportingfor costs associated with exit or disposal activities andrequires that the fair value of a liability associated with anexit or disposal activity be recognized when the liability isincurred. Under previous guidance, certain exit costs werepermitted to be accrued upon management’s commitmentto an exit plan, which is generally before an actual liabilityhas been incurred. The adoption of this Statement did nothave a material impact on the Company’s consolidatedresults of operations or financial position.
The Company adopted Emerging Issues Task Force Issue No. 02-16, “Accounting by a Reseller for CashConsideration Received from a Vendor,” on a prospectivebasis effective December 29, 2002. This pronouncementrequires vendor allowances be treated as a reduction in inventory costs unless specifically identified as areimbursement for other services. In addition, any vendorallowances received in excess of the cost incurred for suchservices should also be treated as a reduction of inventorycosts. The adoption of this pronouncement resulted in a$13.3 million reduction in net earnings during 2003.
The Company adopted FASB Interpretation No. 45,“Guarantor’s Accounting and Disclosure Requirements for Guarantees, Including Indirect Guarantees ofIndebtedness of Others,” effective December 29, 2002. This interpretation requires certain guarantees to berecorded at fair value as opposed to the current practice of recording a liability only when a loss is probable andreasonably estimable. It also requires a guarantor to makeenhanced disclosures concerning guarantees, even when the likelihood of making any payments under the guaranteeis remote. The adoption of this Statement did not have amaterial impact on the Company’s consolidated results of operations or financial position.
The Company adopted FASB Interpretation No. 46,“Consolidation of Variable Interest Entities,” effectiveDecember 29, 2002. This interpretation requires a companyto consolidate variable interest entities (“VIE”) if theenterprise is a primary beneficiary (holds a majority of thevariable interest) of the VIE and the VIE possesses specificcharacteristics. It also requires additional disclosures forparties involved with VIEs. The adoption of this Statementdid not have a material impact on the Company’sconsolidated results of operations or financial position.
(33)

H_17_48 3/24/04 10:18 AM Page 34
The Company adopted FASB Interpretation No. (“FIN”)46, (revised December 2003), “Consolidation of VariableInterest Entities,” effective December 24, 2003. Thisinterpretation addresses how a business should evaluatecontrolling financial interest in an entity. FIN 46R replacesFASB Interpretation No. 46. The adoption of this Statementdid not have a material impact on the Company’sconsolidated results of operations or financial position.
The Company adopted SFAS No. 150, “Accounting forCertain Financial Instruments with Characteristics of Both Liabilities and Equity,” effective June 15, 2003. ThisStatement requires certain instruments previously classifiedas equity on a company’s statement of financial positionnow be classified as liabilities. The adoption of thisStatement did not have a material impact on the Company’sconsolidated results of operations or financial position.
The Company adopted SFAS No. 132, (revised 2003),“Employer’s Disclosures about Pensions and OtherPostretirement Benefits,” effective December 15, 2003. This Statement requires additional disclosures to those inthe original Statement 132 about the assets, obligations,cash flows, and net periodic benefit cost of defined benefitpension plans and other defined benefit postretirementplans. The adoption of this Statement did not have amaterial impact on the Company’s consolidated results of operations or financial position.
2—LEASES
The Company leases most of its retail locations and five of its distribution centers under noncancelableoperating leases, whose initial terms typically range from 15 to 25 years, along with options that permit renewals for additional periods. The Company also leases certainequipment and other assets under noncancelable operatingleases, whose initial terms typically range from 3 to 10years. Minimum rent is expensed on a straight-line basisover the term of the lease. In addition to minimum rentalpayments, certain leases require additional payments basedon sales volume, as well as reimbursements for real estatetaxes, maintenance and insurance.
Following is a summary of the Company’s net rentalexpense for operating leases for the respective years:
In millions 2003 2002 2001Minimum rentals $ 838.4 $ 790.4 $ 758.2Contingent rentals 62.0 65.6 67.6
900.4 856.0 825.8Less: sublease income (10.1) (9.3) (9.1)
$ 890.3 $ 846.7 $ 816.7
Notes to Consolidated Financial Statements
(34) CVS Corporation 2003 Annual Report
Following is a summary of the future minimum lease paymentsunder capital and operating leases as of January 3, 2004:
CAPITAL OPERATINGIn millions LEASES LEASES
2004 $ 0.2 $ 855.92005 0.2 816.32006 0.2 757.72007 0.2 704.52008 0.2 661.6Thereafter 0.3 6,992.9
1.3 $ 10,788.9Less: imputed interest (0.4)Present value of capital lease obligations $ 0.9
The Company finances a portion of its store developmentprogram through sale-leaseback transactions. Theproperties are sold at net book value and the resultingleases qualify and are accounted for as operating leases.The Company does not have any retained or contingentinterests in the stores nor does the Company provide anyguarantees, other than a corporate level guarantee of leasepayments, in connection with the sale-leasebacks. Proceedsfrom sale-leaseback transactions totaled $487.8 million in2003, $448.8 million in 2002 and $323.3 million in 2001.During 2001, the Company completed a sale-leasebacktransaction involving five of its distribution centers. Thedistribution centers were sold at fair market value resultingin a $35.5 million gain, which was deferred and is beingamortized to offset rent expense over the life of the newoperating leases. The operating leases that resulted fromthese transactions are included in the above table.
3—BORROWING AND CREDIT AGREEMENTS
Following is a summary of the Company’s borrowings as ofthe respective balance sheet dates:
In millions JAN. 3, 2004 DEC. 28, 2002Commercial paper $ — $ 4.85.5% senior notes due 2004 300.0 300.05.625% senior notes due 2006 300.0 300.03.875% senior notes due 2007 300.0 300.08.52% ESOP notes due 2008(1) 163.2 194.4Mortgage notes payable 12.2 13.0Capital lease obligations 0.9 0.9
1,076.3 1,113.1Less:
Short-term debt — (4.8)Current portion of long-term debt (323.2) (32.0)
$ 753.1 $ 1,076.3
(1) See Note 5 for further information about the Company’s ESOP Plan.

H_17_48 3/24/04 10:18 AM Page 35
In connection with our commercial paper program, theCompany maintains a $650 million, five-year unsecuredback-up credit facility, which expires on May 21, 2006 anda $600 million, 364-day unsecured back-up credit facility,which expires on May 17, 2004. The credit facilities allowfor borrowings at various rates depending on the Company’spublic debt ratings and require the Company to pay aquarterly facility fee of 0.08%, regardless of usage. As ofJanuary 3, 2004, the Company had not borrowed against thecredit facilities. There was no short-term debt outstandingas of January 3, 2004. The weighted average interest ratefor short-term debt was 1.9% as of December 28, 2002.
In October 2002, the Company issued $300 million of 3.875% unsecured senior notes. The notes are dueNovember 1, 2007, and pay interest semi-annually. TheCompany may redeem these notes at any time, in whole orin part, at a defined redemption price plus accrued interest.Net proceeds from the notes were used to repayoutstanding commercial paper.
The Credit Facilities and unsecured senior notes containcustomary restrictive financial and operating covenants.The covenants do not materially affect the Company’sfinancial or operating flexibility.
The aggregate maturities of long-term debt for each of the five years subsequent to January 3, 2004 are $323.2million in 2004, $27.9 million in 2005, $334.4 million in2006, $341.7 million in 2007 and $45.8 million in 2008.
4— GOODWILL AND OTHER INTANGIBLES
Goodwill represents the excess of the purchase price overthe fair value of net assets acquired. Effective December 30,2001, the Company adopted SFAS No. 142, “Goodwill and Other Intangible Assets.” As a result of the adoption,goodwill is no longer being amortized, but is subject toannual impairment reviews, or more frequent reviews ifevents or circumstances indicate there may be an impairment.The Company groups and evaluates goodwill for impairmentat the reporting unit level annually, or whenever events orcircumstances indicate there may be an impairment. Whenevaluating goodwill for potential impairment, the Companyfirst compares the fair value of the reporting unit, based on
estimated future discounted cash flows, with its carryingamount. If the estimated fair value of the reporting unit isless than its carrying amount, an impairment loss calculationis prepared. The impairment loss calculation compares the implied fair value of reporting unit goodwill with thecarrying amount of that goodwill. If the carrying amountof reporting unit goodwill exceeds the implied fair value ofthat goodwill, an impairment loss is recognized in an amountequal to that excess. During the third quarter of 2003, theCompany performed its required annual goodwill impairmenttest, which concluded there was no impairment of goodwill.
The following summary details the after-tax impact, on a pro forma basis, of discontinuing the amortization of goodwill on net earnings and earnings per commonshare (“EPS”) for the respective years:
In millions,
except per share amounts 2003 2002 2001Net Earnings:
As reported $ 847.3 $ 716.6 $ 413.2Goodwill amortization — — 28.2As adjusted 847.3 716.6 441.4
Basic EPS:As reported $ 2.11 $ 1.79 $ 1.02Goodwill amortization — — 0.07As adjusted 2.11 1.79 1.09
Diluted EPS:As reported $ 2.06 $ 1.75 $ 1.00Goodwill amortization — — 0.07As adjusted 2.06 1.75 1.07
The carrying amount of goodwill was $889.0 million and$878.9 million as of January 3, 2004 and December 28,2002, respectively. During 2003, gross goodwill increased$10.1 million, primarily due to acquisitions by theCompany’s PBM segment. There was no impairment of goodwill during 2003.
Intangible assets other than goodwill are required to beseparated into two categories: finite-lived and indefinite-lived. Intangible assets with finite useful lives are amortizedover their estimated useful life, while intangible assets withindefinite useful lives are not amortized. The Companycurrently has no intangible assets with indefinite lives.
(35)

H_17_48 3/24/04 10:18 AM Page 36
Notes to Consolidated Financial Statements
JAN. 3, 2004 DEC. 28, 2002GROSS GROSS
CARRYING ACCUMULATED CARRYING ACCUMULATEDIn millions AMOUNT AMORTIZATION AMOUNT AMORTIZATION
Customer lists and Covenants not to compete(1) $ 571.3 $ (241.4) $ 464.5 $ (194.1)Favorable leases and Other(2) 152.3 (78.5) 153.1 (72.1)
$ 723.6 $ (319.9) $ 617.6 $ (266.2)
(1) The increase in the gross carrying amount during 2003 was primarily due to the acquisition of customer lists.(2) The decrease in the gross carrying amount during 2003 resulted from the write-off of fully amortized favorable leases.
Following is a summary of the Company’s amortizable intangible assets as of the respective balance sheet dates:
The amortization expense for these intangible assets totaled$63.2 million in 2003, $53.3 million in 2002 and $52.7million in 2001. The anticipated annual amortizationexpense for these intangible assets is $66.7 million in2004, $59.6 million in 2005, $54.5 million in 2006, $49.0 million in 2007 and $45.0 million in 2008.
5—EMPLOYEE STOCK OWNERSHIP PLAN
The Company sponsors a defined contribution EmployeeStock Ownership Plan (the “ESOP”) that covers full-timeemployees with at least one year of service.
In 1989, the ESOP Trust issued and sold $357.5 million of20-year, 8.52% notes due December 31, 2008 (the “ESOPNotes”). The proceeds from the ESOP Notes were used topurchase 6.7 million shares of Series One ESOP ConvertiblePreference Stock (the “ESOP Preference Stock”) from theCompany. Since the ESOP Notes are guaranteed by theCompany, the outstanding balance is reflected as long-termdebt and a corresponding guaranteed ESOP obligation isreflected in shareholders’ equity in the accompanyingconsolidated balance sheets.
Each share of ESOP Preference Stock has a guaranteedminimum liquidation value of $53.45, is convertible into2.314 shares of common stock and is entitled to receive an annual dividend of $3.90 per share. The ESOP Trustuses the dividends received and contributions from theCompany to repay the ESOP Notes. As the ESOP Notes arerepaid, ESOP Preference Stock is allocated to participantsbased on (i) the ratio of each year’s debt service payment to total current and future debt service payments multipliedby (ii) the number of unallocated shares of ESOP PreferenceStock in the plan. As of January 3, 2004, 4.5 million sharesof ESOP Preference Stock were outstanding, of which 2.7 million shares were allocated to participants and the remaining 1.8 million shares were held in the ESOPTrust for future allocations.
(36) CVS Corporation 2003 Annual Report
Annual ESOP expense recognized is equal to (i) the interestincurred on the ESOP Notes plus (ii) the higher of (a) theprincipal repayments or (b) the cost of the shares allocated,less (iii) the dividends paid. Similarly, the guaranteed ESOPobligation is reduced by the higher of (i) the principalpayments or (ii) the cost of shares allocated.
Following is a summary of the ESOP activity for therespective years:
In millions 2003 2002 2001ESOP expense recognized $ 30.1 $ 26.0 $ 22.1Dividends paid 17.7 18.3 19.1Cash contributions 30.1 26.0 22.1Interest payments 16.6 18.7 20.5ESOP shares allocated 0.4 0.4 0.4
6—PENSION PLANS AND OTHER
POSTRETIREMENT BENEFITS
Defined Contribution PlansThe Company sponsors a voluntary 401(k) Savings Planthat covers substantially all employees who meet planeligibility requirements. The Company makes matchingcontributions consistent with the provisions of the plan. At the participant’s option, account balances, including theCompany’s matching contribution, can be moved withoutrestriction among various investment options, including theCompany’s common stock. The Company also maintains a nonqualified, unfunded Deferred Compensation Plan for certain key employees. This plan provides participantsthe opportunity to defer portions of their compensationand receive matching contributions that they would haveotherwise received under the 401(k) Savings Plan if not for certain restrictions and limitations under the InternalRevenue Code. The Company’s contributions under theabove defined contribution plans totaled $46.9 million in2003, $29.1 million in 2002 and $26.7 million in 2001.The Company also sponsors an Employee Stock OwnershipPlan. See Note 5 for further information about this plan.

H_17_48 3/24/04 10:18 AM Page 37
Other Postretirement BenefitsThe Company provides postretirement healthcare and lifeinsurance benefits to certain retirees who meet eligibilityrequirements. The Company’s funding policy is generally to pay covered expenses as they are incurred. For retireemedical plan accounting, the Company reviews externaldata and its own historical trends for healthcare costs to determine the healthcare cost trend rates.
For measurement purposes, future healthcare costs areassumed to increase at an annual rate of 10.0%, decreasingto an annual growth rate of 5.0% in 2009 and thereafter. A one percent change in the assumed healthcare cost trendrate would change the accumulated postretirement benefitobligation by $0.7 million and the total service and interestcosts by $0.1 million.
In 2003, the Medicare Prescription Drug, Improvement and Modernization Act (the “Act”) was signed into law in the United States. The Company has elected to defer the accounting for the effect of the Act as permitted by FASB Staff Position No. FAS 106-1 and, therefore, thebenefit obligations reported below for the Company’s postretirement benefit plans do not reflect the impact of the Act. Specific authoritative guidance on the accountingfor the federal subsidy related to the Act is pending and, when issued, could require the Company to changepreviously reported information.
Pension PlansThe Company sponsors a noncontributory defined benefitpension plan that covers certain full-time employees ofRevco, D.S., Inc. who were not covered by collectivebargaining agreements. On September 20, 1997, theCompany suspended future benefit accruals under this plan.Benefits paid to retirees are based upon age at retirement,
years of credited service and average compensation duringthe five-year period ending September 20, 1997. The plan is funded based on actuarial calculations and applicablefederal regulations.
Pursuant to various labor agreements, the Company is also required to make contributions to certain union-administered pension and health and welfare plans thattotaled $13.2 million in 2003, $12.1 million in 2002 and$11.1 million in 2001. The Company also has nonqualifiedsupplemental executive retirement plans in place for certainkey employees for whom it has purchased cost recoveryvariable life insurance.
The Company uses an investment strategy whichemphasizes equities in order to produce higher expectedreturns, and in the long run, lower expense and cashcontribution requirements. The pension plan assetsallocation targets 70% equity and 30% fixed income.
Following is the pension plan assets allocation by majorcategory for the respective years:
2003 2002Equity 72% 68%Fixed Income 27% 31%Other 1% 1%
100% 100%
The equity investments primarily consist of large cap value and international value equity funds. The fixedincome investments primarily consist of intermediate-termbond funds. The other category consists of cash and cashequivalents held for benefit payments.
(37)

H_17_48 3/24/04 10:18 AM Page 38
Notes to Consolidated Financial Statements
The Company utilized a measurement date of December 31st to determine pension and other postretirement benefitmeasurements. Following is a summary of the net periodic pension cost for the defined benefit and other postretirementbenefit plans for the respective years:
DEFINED BENEFIT PLANS OTHER POSTRETIREMENT BENEFITS
In millions 2003 2002 2001 2003 2002 2001Service cost $ 0.8 $ 0.8 $ 0.5 $ — $ — $ —Interest cost on benefit obligation 20.5 20.4 20.9 0.8 0.9 0.9Expected return on plan assets (18.4) (19.3) (20.2) — — —Amortization of net loss (gain) 1.5 0.1 (0.3) (0.1) (0.2) (0.2)Amortization of prior service cost 0.1 0.1 0.1 (0.1) (0.1) (0.1)Settlement gain — — (0.2) — — —Net periodic pension cost $ 4.5 $ 2.1 $ 0.8 $ 0.6 $ 0.6 $ 0.6
ACTUARIAL ASSUMPTIONS:Discount rate 6.25% 6.50% 7.50% 6.25% 6.50% 7.25%Expected return on plan assets(1) 8.50% 8.75% 9.25% — — —Rate of compensation increase 4.00% 4.00% 4.00% — — —
(1) The expected long-term rate of return is determined by using the target allocation and historical returns for each asset class.
Following is a reconciliation of the benefit obligation, fair value of plan assets and funded status of the Company’s definedbenefit and other postretirement benefit plans as of the respective balance sheet dates:
DEFINED BENEFIT PLANS OTHER POSTRETIREMENT BENEFITS
JAN. 3, DEC. 28, JAN. 3, DEC. 28,In millions 2004 2002 2004 2002
CHANGE IN BENEFIT OBLIGATION:Benefit obligation at beginning of year $ 322.8 $ 283.1 $ 13.8 $ 12.9Service cost 0.8 0.8 — —Interest cost 20.5 20.4 0.8 0.9Actuarial loss (gain) 11.0 34.8 (0.3) 1.0Benefits paid (16.0) (16.3) (1.0) (1.0)Benefit obligation at end of year $ 339.1 $ 322.8 $ 13.3 $ 13.8
CHANGE IN PLAN ASSETS:Fair value at beginning of year $ 186.8 $ 218.4 $ — $ —Actual return on plan assets 38.4 (24.1) — —Company contributions 17.4 8.8 1.0 1.0Benefits paid (16.0) (16.3) (1.0) (1.0)Fair value at end of year $ 226.6 $ 186.8 $ — $ —
FUNDED STATUS:Funded status $ (112.5) $ (136.0) $ (13.3) $ (13.8)Unrecognized prior service cost 0.6 0.7 (0.5) (0.6)Unrecognized loss 64.2 74.7 0.7 0.9Net liability recognized $ (47.7) $ (60.6) $ (13.1) $ (13.5)
AMOUNTS RECOGNIZED IN THE CONSOLIDATED BALANCE SHEET:Accrued benefit liability $ (107.1) $ (132.5) $ (13.1) $ (13.5)Minimum pension liability 59.4 71.9 — —Net liability recognized $ (47.7) $ (60.6) $ (13.1) $ (13.5)
$17.1 million of the accrued benefit liability was includedin accrued expenses, while the remaining amount wasrecorded in other long-term liabilities, as of January 3,2004 and December 28, 2002. The accumulated benefit
(38) CVS Corporation 2003 Annual Report(38) CVS Corporation 2003 Annual Report
obligation for the defined benefit pension plans was $333.5and $318.0 million at January 3, 2004 and December 28,2002, respectively. The Company estimates it will makecash contributions to the plan during the next fiscal

,
9
d
H_17_48 3/24/04 10:18 AM Page 39
year of approximately $17.5 million. Estimated futurebenefit payments for the defined benefit plans and otherpostretirement benefit plans, respectively, are $14.8 millionand $1.1 million in 2004, $15.2 and $1.1 million in 2005$15.9 million and $1.1 million in 2006, $16.7 and $1.1million in 2007, $17.7 and $1.1 million in 2008, and $105.million and $4.7 million in aggregate for the following fiveyears. The Company recorded a minimum pension liabilityof $59.4 million as of January 3, 2004, and $71.9 millionas of December 28, 2002, as required by SFAS No. 87. Aminimum pension liability is required when the accumulatebenefit obligation exceeds the combined fair value of theunderlying plan assets and accrued pension costs. Theminimum pension liability adjustment is reflected in otherlong-term liabilities, long-term deferred income taxes and accumulated other comprehensive loss, included inshareholders’ equity, in the consolidated balance sheet.
7— STOCK INCENTIVE PLANS
The 1997 Incentive Compensation Plan provides for thegranting of up to 42.9 million shares of common stock in the form of stock options and other awards to selectedofficers and employees of the Company. All grants under
the plan are awarded at fair market value on the date ofgrant. Generally, options become exercisable over a four-year period from the grant date and expire ten years afterthe date of grant. As of January 3, 2004, there were 16.7 million shares available for future grants. The 1997Incentive Compensation Plan allows for up to 3.6 millionrestricted shares to be issued. The Company granted213,000, 26,000 and 76,000 shares of restricted stock with a weighted average per share grant date fair value of $25.26, $31.20 and $59.98, in 2003, 2002 and 2001,respectively. The fair value of the restricted shares isexpensed over the period during which the restrictionslapse. Compensation costs for restricted shares totaled $3.6 million in 2003, $4.3 million in 2002 and $5.4 million in 2001.
The 1996 Directors Stock Plan provides for the granting ofup to 346,000 shares of common stock to the Company’snonemployee directors. The plan allows the nonemployeedirectors to elect to receive shares of common stock orstock options in lieu of cash compensation. As of January 3, 2004, there were 46,000 shares available for future grants under the plan.
Following is a summary of the stock option activity for the respective years:
2003 2002 2001WEIGHTED WEIGHTED WEIGHTED
AVERAGE AVERAGE AVERAGEShares in thousands SHARES EXERCISE PRICE SHARES EXERCISE PRICE SHARES EXERCISE PRICE
Outstanding at beginning of year 23,390 $ 36.42 17,627 $ 39.48 14,647 $ 31.11Granted 6,401 25.21 8,022 29.89 5,381 59.55Exercised (707) 20.26 (517) 18.31 (1,084) 23.13Canceled (2,005) 35.84 (1,742) 41.66 (1,317) 43.14Outstanding at end of year 27,079 34.22 23,390 36.42 17,627 39.48Exercisable at end of year 14,870 $ 35.53 8,048 $ 30.21 4,609 $ 25.09
Following is a summary of the stock options outstanding and exercisable as of January 3, 2004:
Shares in thousands OPTIONS OUTSTANDING OPTIONS EXERCISABLE
NUMBER WEIGHTED AVERAGE WEIGHTED AVERAGE NUMBER WEIGHTED AVERAGERANGE OF EXERCISE PRICES OUTSTANDING REMAINING LIFE EXERCISE PRICE EXERCISABLE EXERCISE PRICE
$ 1.81 to $ 15.00 248 1.9 $ 13.23 248 $ 13.2315.01 to 25.00 2,330 2.3 18.93 2,290 18.8325.01 to 30.00 12,752 8.3 27.69 3,569 29.8730.01 to 35.00 3,434 6.2 31.90 2,480 31.9135.01 to 50.00 4,335 4.6 40.64 4,224 40.6750.01 to 61.23 3,980 6.9 60.44 2,059 60.42
Total 27,079 6.7 $ 34.22 14,870 $ 35.53
(39)(39)

H_17_48 3/24/04 10:18 AM Page 40
The Company applies APB Opinion No. 25 to account for its stock incentive plans. Accordingly, no compensationcost has been recognized for stock options granted. Hadcompensation cost been recognized based on the fair valueof stock options granted consistent with SFAS No. 123, net earnings and net earnings per common share (“EPS”)would approximate the pro forma amounts shown below:
In millions, except per share amounts 2003 2002 2001Net earnings:
As reported $ 847.3 $ 716.6 $ 413.2Pro forma 797.1 662.5 357.1
Basic EPS:As reported $ 2.11 $ 1.79 $ 1.02Pro forma 1.98 1.65 0.87
Diluted EPS:As reported $ 2.06 $ 1.75 $ 1.00Pro forma 1.95 1.62 0.86
The per share weighted average fair value of stock optionsgranted during 2003, 2002 and 2001 was $9.01, $10.46and $25.12, respectively.
The fair value of each stock option grant was estimatedusing the Black-Scholes Option Pricing Model with thefollowing assumptions:
2003 2002 2001
Dividend yield 0.85% 0.96% 0.77%Expected volatility 29.63% 29.50% 29.79%Risk-free interest rate 3.5% 4.0% 5.0%Expected life 7.0 7.0 7.0
The 1999 Employee Stock Purchase Plan provides for the purchase of up to 7.4 million shares of common stock.Under the plan, eligible employees may purchase commonstock at the end of each six-month offering period, at a purchase price equal to 85% of the lower of the fairmarket value on the first day or the last day of the offeringperiod. During 2003, 1.1 million shares of common stockwere purchased at an average price of $21.34 per share. Asof January 3, 2004, 3.3 million shares of common stockhave been issued since inception of the plan.
Notes to Consolidated Financial Statements
(40) CVS Corporation 2003 Annual Report
8—INCOME TAXES
The provision for income taxes consisted of the followingfor the respective years:
In millions 2003 2002 2001Current:
Federal $ 421.5 $ 347.1 $ 360.3State 77.3 57.0 53.9
498.8 404.1 414.2Deferred:
Federal 31.0 32.0 (111.8)State (1.6) 3.1 (6.0)
29.4 35.1 (117.8)Total $ 528.2 $ 439.2 $ 296.4
Following is a reconciliation of the statutory income tax rateto the Company’s effective tax rate for the respective years:
2003 2002 2001Statutory income tax rate 35.0% 35.0% 35.0%State income taxes, net of
federal tax benefit 3.6 3.4 3.4Goodwill and other(1) (0.2) (0.4) 1.0Effective tax rate before
Restructuring Charge 38.4 38.0 39.4Restructuring Charge — — 2.4Effective tax rate 38.4% 38.0% 41.8%
(1) Decrease in goodwill and other was primarily due to theelimination of goodwill amortization during 2002 that was not deductible for income tax purposes.
Following is a summary of the significant components ofthe Company’s deferred tax assets and liabilities as of therespective balance sheet dates:
In millions JAN. 3, 2004 DEC. 28, 2002Deferred tax assets:
Inventory $ 65.5 $ 36.3Restructuring Charge 64.7 73.1Employee benefits 55.9 46.3Lease and rents 47.0 43.9Retirement benefits 44.8 53.9Allowance for bad debt 25.2 27.1Amortization method 20.4 29.9Other 82.0 62.7
Total deferred tax assets 405.5 373.2Deferred tax liabilities:
Accelerated depreciation (195.0) (150.2)Total deferred tax liabilities (195.0) (150.2)Net deferred tax assets $ 210.5 $ 223.0

H_17_48 3/24/04 10:18 AM Page 41
Income taxes paid were $510.4 million, $319.5 million and $397.0 million for 2003, 2002 and 2001, respectively.The Company believes it is more likely than not that thedeferred tax assets included in the above table will berealized during future periods in which the Companygenerates taxable earnings.
9—COMMITMENTS & CONTINGENCIES
Between 1991 and 1997, the Company sold or spun off a number of subsidiaries, including Bob’s Stores, Linens ’n Things, Inc., Marshalls, Kay-Bee Toys, Wilsons,This End Up and Footstar, Inc. In many cases, when aformer subsidiary leased a store, the Company provided a corporate level guarantee of the store’s lease obligations.When the subsidiaries were disposed of, the Company’sguarantees remained in place, although each purchaserindemnified the Company for any lease obligations theCompany was required to satisfy. If any of the purchaserswere to become insolvent and failed to make the requiredpayments under a store lease, the Company could berequired to satisfy these obligations. As of January 3, 2004,the Company guaranteed approximately 706 stores withleases extending through 2018. Assuming that eachrespective purchaser became insolvent, and the Companywas required to assume all of these lease obligations,management estimates that the Company could settle the obligations for approximately $592 million as ofJanuary 3, 2004.
Management believes the ultimate disposition of any of thecorporate level guarantees will not have a material adverseeffect on the Company’s consolidated financial condition,results of operations or future cash flows.
As of January 3, 2004, the Company had outstandingcommitments to purchase $163 million of merchandiseinventory for use in the normal course of business. TheCompany currently expects to satisfy these purchasecommitments by 2008.
Beginning in August 2001, a total of nine actions were filed against the Company in the United States DistrictCourt for the District of Massachusetts asserting claimsunder the federal securities laws. The actions weresubsequently consolidated under the caption In re CVS Corporation Securities Litigation, No. 01-CV-11464(D. Mass.) and a consolidated and amended complaint was filed on April 8, 2002. The consolidated amendedcomplaint names as defendants the Company, its chiefexecutive officer and its chief financial officer and assertsclaims for alleged securities fraud under sections 10(b) and 20(a) of the Securities Exchange Act of 1934 and Rule 10b-5 thereunder on behalf of a purported class of
persons who purchased shares of the Company’s commonstock between February 6, 2001 and October 30, 2001. On June 7, 2002, all defendants moved to dismiss theconsolidated amended complaint. This motion was deniedby the court on December 18, 2002. The parties arecurrently engaged in discovery. The Company believes theconsolidated action is without merit and intends to defendagainst it vigorously.
The Company is also a party to other litigation arising in the normal course of its business, none of which isexpected to be material to the Company.
10—BUSINESS SEGMENTS
The Company currently operates two business segments,Retail Pharmacy and Pharmacy Benefit Management (“PBM”).
The operating segments are segments of the Company forwhich separate financial information is available and forwhich operating results are evaluated regularly by executivemanagement in deciding how to allocate resources and inassessing performance.
As of January 3, 2004, the Retail Pharmacy segmentincluded 4,132 retail drugstores and the Company’s onlineretail website, CVS.com. The retail drugstores are locatedin 27 states and the District of Columbia and operate underthe CVS/pharmacy name. The Retail Pharmacy segment isthe Company’s only reportable segment.
The PBM segment provides a full range of prescriptionbenefit management services to managed care providers andother organizations. These services include plan design andadministration, formulary management, mail order pharmacyservices, claims processing and generic substitution. The PBMsegment also includes the Company’s specialty pharmacybusiness, which focuses on supporting individuals thatrequire complex and expensive drug therapies. The PBMsegment operates under the PharmaCare ManagementServices name, while the specialty pharmacy mail orderfacilities and 47 retail pharmacies, located in 19 states and theDistrict of Columbia, operate under the CVS ProCare name.
Following is a reconciliation of the significant componentsof the Company’s net sales for the respective years:
2003 2002 2001Pharmacy 68.8% 67.6% 66.1%Front store 31.2 32.4 33.9
100.0% 100.0% 100.0%
(41)

H_17_48 3/24/04 10:18 AM Page 42
Notes to Consolidated Financial Statements
Following is a reconciliation of the Company’s business segments to the consolidated financial statements:
RETAIL PHARMACY PBM OTHER CONSOLIDATEDIn millions SEGMENT SEGMENT ADJUSTMENTS(1) TOTALS
2003:Net sales $ 25,280.7 $ 1,307.3 $ — $ 26,588.0Operating profit 1,323.1 100.5 — 1,423.6Depreciation and amortization 326.5 15.2 — 341.7Total assets 9,975.0 568.1 — 10,543.1Goodwill 690.4 198.6 — 889.0Additions to property and equipment 1,114.2 7.5 — 1,121.7
2002:Net sales $ 23,060.2 $ 1,121.3 $ — $ 24,181.5Operating profit 1,134.6 71.6 — 1,206.2Depreciation and amortization 297.6 12.7 — 310.3Total assets 9,132.1 513.2 — 9,645.3Goodwill 690.4 188.5 — 878.9Additions to property and equipment 1,104.5 4.3 — 1,108.8
2001:Net sales $ 21,328.7 $ 912.7 $ — $ 22,241.4Operating profit 1,079.9 39.7 (349.0) 770.6Depreciation and amortization 301.7 19.1 — 320.8Total assets 8,131.8 504.5 — 8,636.3Goodwill 688.7 186.2 — 874.9Additions to property and equipment 705.3 8.3 — 713.6
(1) In 2001, other adjustments relate to the $352.5 million Restructuring Charge and the $3.5 million Net Litigation Gain. See Note 11 forfurther information on the Restructuring Charge and Note 1 for further information on the Net Litigation Gain. Nonrecurring chargesand gains are not considered when management assesses the stand-alone performance of the Company’s business segments.
The Company evaluates segment performance based on operating profit before the effect of nonrecurring charges and gainsand certain intersegment activities and charges. The accounting policies of the segments are substantially the same as thosedescribed in Note 1.
11—RESTRUCTURING & ASSET IMPAIRMENT CHARGE
During the fourth quarter of 2001, management approved a strategic restructuring, which resulted from a comprehensive business review designed to streamlineoperations and enhance operating efficiencies.
Following is a summary of the specific initiatives containedin the 2001 strategic restructuring:
1. 229 CVS/pharmacy and CVS ProCare store locations(the “Stores”) would be closed by no later than March 2002. Since these locations were leased facilities,management planned to either return the premises tothe respective landlords at the conclusion of the currentlease term or negotiate an early termination of thecontractual obligations. As of March 31, 2002, all of the Stores had been closed.
(42) CVS Corporation 2003 Annual Report(42) CVS Corporation 2003 Annual Report
2. The Henderson, North Carolina distribution center (the “D.C.”) would be closed and its operations wouldbe transferred to the Company’s remaining distributioncenters by no later than May 2002. Since this locationwas owned, management planned to sell the propertyupon closure. The D.C. was closed in April 2002 andsold in May 2002.
3. The Columbus, Ohio mail order facility (the “MailFacility”) would be closed and its operations would betransferred to the Company’s Pittsburgh, Pennsylvaniamail order facility by no later than April 2002. Sincethis location was a leased facility, management plannedto either return the premises to the landlord at theconclusion of the lease or negotiate an early terminationof the contractual obligation. The Mail Facility wasclosed in March 2002.

H_17_48 3/24/04 10:18 AM Page 43
4. Two satellite office facilities (the “Satellite Facilities”)would be closed and their operations would beconsolidated into the Company’s Woonsocket, Rhode Island corporate headquarters by no later than December 2001. Since these locations were leased facilities, management planned to either returnthe premises to the landlords at the conclusion of the leases or negotiate an early termination of thecontractual obligations. The Satellite Facilities wereclosed in December 2001.
5. Approximately 1,500 managerial, administrative andstore employees in the Company’s Woonsocket, RhodeIsland corporate headquarters; Columbus Mail Facility;Henderson D.C. and the Stores would be terminated. As of April 30, 2002, all of these employees had been terminated.
In accordance with Emerging Issues Task Force (“EITF”)Issue 94-3, “Liability Recognition for Certain EmployeeTermination Benefits and Other Costs to Exit an Activity(Including Certain Costs Incurred in a Restructuring),”SFAS No. 121 and Staff Accounting Bulletin No. 100,“Restructuring and Impairment Charges,” the Companyrecorded a $346.8 million pre-tax charge ($226.9 millionafter-tax) to operating expenses during the fourth quarterof 2001 for restructuring and asset impairment costs. In accordance with Accounting Research Bulletin No. 43,“Restatement and Revision of Accounting ResearchBulletins,” the Company also recorded a $5.7 million pre-tax charge ($3.6 million after-tax) to cost of goods sold during the fourth quarter of 2001 to reflect themarkdown of certain inventory contained in the Stores to its net realizable value. In total, the restructuring and asset impairment charge was $352.5 million pre-tax($230.5 million after-tax), or $0.56 per diluted share in2001 (the “Restructuring Charge”). The aggregate impactof the 229 stores on the Company’s consolidated financialstatements for the year ended December 29, 2001, totaled$585.3 million in net sales and $13.7 million in operatinglosses, which included depreciation and amortization of $12.4 million, incremental markdowns incurred inconnection with liquidating inventory and incrementalpayroll and other store-related costs incurred in connectionwith closing and/or preparing the 229 stores for closing.Whenever possible, the Company attempts to transfer thecustomer base of its closed stores to adjacent CVS storelocations. The Company’s success in retaining customersand the related impact on the above revenue and operatingincome or loss, however, cannot be precisely calculated.
Following is a summary of the significant components ofthe Restructuring Charge:
In millions
Noncancelable lease obligations $ 227.4Asset write-offs 105.6Employee severance and benefits 19.5Total(1) $ 352.5
(1) The Restructuring Charge is comprised of $5.7 millionrecorded in cost of goods sold and $346.8 million recorded in selling, general and administrative expenses.
The Restructuring Charge will require total cash paymentsof $246.9 million. The remaining Restructuring Chargeliability totaled $168.9 million as of January 3, 2004 and$192.1 million as of December 28, 2002. The remainingliability in both years primarily consisted of future cashpayments for noncancelable lease obligations extendingthrough 2024. The Company believes that the reservebalances as of January 3, 2004 are adequate to cover theremaining liabilities associated with the Restructuring Charge.
Noncancelable lease obligations included $227.4 millionfor the estimated continuing lease obligations of the Stores,the Mail Facility and the Satellite Facilities. As required by EITF Issue 88-10, “Costs Associated with LeaseModification or Termination,” the estimated continuinglease obligations were reduced by estimated probablesublease rental income.
Asset write-offs included $59.0 million for fixed assetwrite-offs, $40.9 million for intangible asset write-offs and $5.7 million for the markdown of certain inventory to its net realizable value. The fixed asset and intangibleasset write-offs relate to the Stores, the Mail Facility and the Satellite Facilities. Management’s decision to close the above locations was considered to be an event or change in circumstances as defined in SFAS No. 121.Since management intended to use the Stores and the MailFacility on a short-term basis during the shutdown period,impairment was measured using the “Assets to Be Held and Used” provisions of SFAS No. 121. The analysis was prepared at the individual location level, which is the lowest level at which individual cash flows can beidentified. The analysis first compared the carrying amountof the location’s assets to the location’s estimated futurecash flows (undiscounted and without interest charges)through the anticipated closing date. If the estimated futurecash flows used in this analysis were less than the carryingamount of the location’s assets, an impairment losscalculation was prepared. The impairment loss calculationcompared the carrying value of the location’s assets to thelocation’s estimated future cash flows (discounted and with
(43)

H_17_48 3/24/04 10:18 AM Page 44
interest charges). Since these locations will continue to beoperated until closed, any remaining net book value afterthe impairment write-down was depreciated over theirrevised useful lives. Impairment of the Satellite Facilitieswas measured using the “Assets to Be Disposed Of”provisions of SFAS No. 121, since management intended to vacate the locations immediately. The entire $3.5 millionnet book value of the Satellite Facilities was considered tobe impaired since management intended to discard theassets located in the facilities. The inventory markdownresulted from the liquidation of certain front storeinventory contained in the Stores. Since managementintended to liquidate the inventory below its cost, an
adjustment was made to reduce the inventory’s cost to its net realizable value.
Employee severance and benefits included $19.5 million for severance pay, healthcare continuation costs andoutplacement service costs related to approximately 1,500 managerial, administrative and store employees in the Company’s Woonsocket, Rhode Island corporateheadquarters; Columbus, Mail Facility; Henderson D.C.and the Stores. As of April 30, 2002, all these employeeshad been terminated.
Notes to Consolidated Financial Statements
12—RECONCILIATION OF EARNINGS PER COMMON SHARE
Following is a reconciliation of basic and diluted earnings per common share for the respective years:
In millions, except per share amounts 2003 2002 2001NUMERATOR FOR EARNINGS PER COMMON SHARE CALCULATION:
Net earnings $ 847.3 $ 716.6 $ 413.2Preference dividends, net of income tax benefit (14.6) (14.8) (14.7)Net earnings available to common shareholders, basic $ 832.7 $ 701.8 $ 398.5
Net earnings $ 847.3 $ 716.6 $ 413.2Dilutive earnings adjustment (6.3) (6.7) (4.8)Net earnings available to common shareholders, diluted $ 841.0 $ 709.9 $ 408.4
DENOMINATOR FOR EARNINGS PER COMMON SHARE CALCULATION:Weighted average common shares, basic 394.4 392.3 392.2Effect of dilutive securities:
Preference stock 10.6 10.7 10.8Stock options 2.7 2.3 5.3
Weighted average common shares, diluted 407.7 405.3 408.3BASIC EARNINGS PER COMMON SHARE:
Net earnings $ 2.11 $ 1.79 $ 1.02DILUTED EARNINGS PER COMMON SHARE:
Net earnings $ 2.06 $ 1.75 $ 1.00
(44) CVS Corporation 2003 Annual Report

H_17_48 3/24/04 10:18 AM Page 45
13—QUARTERLY FINANCIAL INFORMATION (UNAUDITED)
Dollars in millions, except per share amounts FIRST QUARTER SECOND QUARTER THIRD QUARTER FOURTH QUARTER FISCAL YEAR
2003:Net sales $ 6,312.8 $ 6,444.9 $ 6,378.1 $ 7,452.2 $ 26,588.0Gross margin 1,605.5 1,633.8 1,658.6 1,965.1 6,863.0Operating profit 331.3 337.0 316.7 438.6 1,423.6Net earnings 196.3 199.8 187.8 263.4 847.3Net earnings per common share, basic 0.49 0.50 0.47 0.66 2.11Net earnings per common share, diluted 0.48 0.49 0.46 0.64 2.06Dividends per common share 0.0575 0.0575 0.0575 0.0575 0.2300Stock price: (New York Stock Exchange)
High 26.67 28.50 32.60 37.46 37.46Low 21.99 23.08 27.43 31.06 21.99
Registered shareholders at year-end 9,3002002:
Net sales $ 5,970.7 $ 5,989.5 $ 5,876.4 $ 6,344.9 $ 24,181.5Gross margin 1,493.7 1,481.1 1,481.3 1,612.7 6,068.8Operating profit 296.5 298.3 276.5 334.9 1,206.2Net earnings 175.7 176.4 164.4 200.1 716.6Net earnings per common share, basic 0.44 0.44 0.41 0.50 1.79Net earnings per common share, diluted 0.43 0.43 0.40 0.49 1.75Dividends per common share 0.0575 0.0575 0.0575 0.0575 0.2300Stock price: (New York Stock Exchange)
High 35.40 35.58 31.30 28.70 35.58Low 25.80 30.60 24.42 23.99 23.99
(45)(45)

H_17_48 3/24/04 10:18 AM Page 46
2003 2002 2001 2000 1999In millions, except per share amounts (53 WEEKS) (52 WEEKS) (52 WEEKS) (52 WEEKS) (53 WEEKS)
STATEMENT OF OPERATIONS DATA:Net sales $ 26,588.0 $ 24,181.5 $ 22,241.4 $ 20,087.5 $ 18,098.3Gross margin(1) 6,863.0 6,068.8 5,691.0 5,361.7 4,861.4Selling, general and
administrative expenses 5,097.7 4,552.3 4,256.3 3,761.6 3,488.0Depreciation and amortization(2) 341.7 310.3 320.8 296.6 277.9Merger, restructuring and other
nonrecurring charges and (gains) — — 343.3 (19.2) —Total operating expenses 5,439.4 4,862.6 4,920.4 4,039.0 3,725.9Operating profit(3) 1,423.6 1,206.2 770.6 1,322.7 1,135.5Interest expense, net 48.1 50.4 61.0 79.3 59.1Income tax provision 528.2 439.2 296.4 497.4 441.3Net earnings(4) $ 847.3 $ 716.6 $ 413.2 $ 746.0 $ 635.1
PER COMMON SHARE DATA:Net earnings:(4)
Basic $ 2.11 $ 1.79 $ 1.02 $ 1.87 $ 1.59Diluted 2.06 1.75 1.00 1.83 1.55
Cash dividends per common share 0.230 0.230 0.230 0.230 0.230
Five-Year Financial Summary
BALANCE SHEET AND OTHER DATA:Total assets $ 10,543.1 $ 9,645.3 $ 8,636.3 $ 7,949.5 $ 7,275.4Long-term debt 753.1 1,076.3 810.4 536.8 558.5Total shareholders’ equity 6,021.8 5,197.0 4,566.9 4,304.6 3,679.7Number of stores (at end of period) 4,179 4,087 4,191 4,133 4,098
(1) Gross margin includes the pre-tax effect of the following nonrecurring charges: (i) in 2001, $5.7 million ($3.6 million after-tax) relatedto the markdown of certain inventory contained in the stores closing as part of the strategic restructuring, discussed in Note 11 to theconsolidated financial statements, to its net realizable value.
(2) As a result of adopting SFAS No. 142, “Goodwill and Other Intangible Assets,” at the beginning of 2002, the Company no longeramortizes goodwill and other indefinite-lived intangible assets. Goodwill amortization totaled $31.4 million pre-tax ($28.2 millionafter-tax) in 2001, $33.7 million pre-tax ($31.9 million after-tax) in 2000 and $38.9 million pre-tax ($38.1 million after-tax) in 1999.
(3) Operating profit includes the pre-tax effect of the charges discussed in Note (1) above and the following merger, restructuring and othernonrecurring charges and gains: (i) in 2001, $346.8 million ($226.9 million after-tax) related to restructuring and asset impairmentcosts associated with the strategic restructuring and the $3.5 million ($2.1 million after-tax) net nonrecurring gain resulting from thenet effect of the $50.3 million of settlement proceeds received from various lawsuits against certain manufacturers of brand nameprescription drugs and the Company’s contribution of $46.8 million of these settlement proceeds to the CVS Charitable Trust, Inc. tofund future charitable giving, and (ii) in 2000, $19.2 million ($11.5 million after-tax) nonrecurring gain representing partial paymentof our share of the settlement proceeds from a class action lawsuit against certain manufacturers of brand name prescription drugs.
(4) Net earnings and net earnings per common share include the after-tax effect of the charges and gains discussed in Notes (1) and (3) above.
(46) CVS Corporation 2003 Annual Report(46) CVS Corporation 2003 Annual Report

H_17_48 3/24/04 10:18 AM Page 47
We are responsible for the preparation and integrity of theconsolidated financial statements appearing in this AnnualReport. The financial statements were prepared in conformitywith accounting principles generally accepted in the UnitedStates of America and include certain amounts based on ourbest estimates and judgments.
We are responsible for maintaining a system of internalaccounting controls and procedures to provide reasonableassurance, at an appropriate cost/benefit relationship, that assetsare safeguarded and that transactions are authorized, recordedand reported properly. Our internal accounting control systemis enhanced by periodic reviews by our internal auditors andindependent auditors, written policies and procedures and awritten Code of Conduct adopted by our Company’s Board of Directors, applicable to all employees of our Company. Inaddition, we have an internal Disclosure Committee, comprisedof management from each functional area within the Company,which performs a separate review of our disclosure controls.
In our opinion, our Company’s internal accounting controlsprovide reasonable assurance that assets are safeguarded andthat the financial records are reliable for preparing financialstatements.
The Audit Committee of our Board of Directors, consistingsolely of independent directors, is responsible for monitoringthe Company’s accounting and reporting practices. The AuditCommittee meets periodically with management, the internalauditors and the independent auditors to review mattersrelating to the Company’s financial reporting, the adequacy of internal accounting controls and the scope and results ofaudit work. The internal auditors and independent auditorshave full and free access to the Audit Committee.
KPMG LLP, independent auditors, are appointed by the Board of Directors and ratified by our Company’s shareholders.They were engaged to render an opinion regarding the fairpresentation of our consolidated financial statements. Theiraccompanying report is based upon an audit conducted inaccordance with auditing standards generally accepted in theUnited States of America and included a review of the systemof internal accounting controls to the extent they considerednecessary to support their opinion.
Thomas M. RyanChairman of the Board, President and Chief Executive Officer
David B. RickardExecutive Vice President, Chief Financial Officer and Chief Administrative Officer
February 6, 2004
Management’s Responsibility for Financial Reporting
KPMG LLPBoard of Directors and ShareholdersCVS Corporation:
We have audited the accompanying consolidated balance sheets of CVS Corporation and subsidiaries as of January 3,2004 and December 28, 2002, and the related consolidatedstatements of operations, shareholders’ equity, and cash flowsfor the fifty-three week period ended January 3, 2004 and the fifty-two week periods ended December 28, 2002 andDecember 29, 2001. These consolidated financial statementsare the responsibility of the Company’s management. Ourresponsibility is to express an opinion on these consolidatedfinancial statements based on our audits.
We conducted our audits in accordance with auditingstandards generally accepted in the United States of America.Those standards require that we plan and perform the audit to obtain reasonable assurance about whether the financialstatements are free of material misstatement. An audit includesexamining, on a test basis, evidence supporting the amounts anddisclosures in the financial statements. An audit also includesassessing the accounting principles used and significantestimates made by management, as well as evaluating theoverall financial statement presentation. We believe that ouraudits provide a reasonable basis for our opinion.
In our opinion, the consolidated financial statements referredto above present fairly, in all material respects, the financialposition of CVS Corporation and subsidiaries as of January 3,2004, and December 28, 2002, and the results of theiroperations and their cash flows for the fifty-three week periodended January 3, 2004 and the fifty-two week periods endedDecember 28, 2002 and December 29, 2001, in conformitywith accounting principles generally accepted in the UnitedStates of America.
As discussed in Note 4 to the consolidated financialstatements, CVS Corporation and subsidiaries adopted theprovisions of Statement of Financial Accounting Standards No. 142, Goodwill and Other Intangible Assets, in 2002. Asdiscussed in Note 1 to the consolidated financial statements,CVS Corporation and subsidiaries adopted the provisions ofEmerging Issues Task Force Issue No. 02-16, Accounting by a Reseller for Cash Consideration received from a Vendor, in 2003.
KPMG
KPMG LLPProvidence, Rhode IslandFebruary 6, 2004
Independent Auditors’ Report
(47)(47)

s
Des
ign:
RK
C!
(Rob
inso
n K
urti
n C
omm
unic
atio
ns!
Inc.
) P
hoto
grap
hy: B
ob D
ay, B
urk
Uzz
le
Prin
ting
: Hen
nega
n
H_17_48 3/24/04 10:18 AM Page 48
OFFICERS
Thomas M. RyanChairman of the Board, President andChief Executive Officer
David B. RickardExecutive Vice President, Chief Financial Officer and Chief Administrative Officer
Chris W. BodineExecutive Vice President–Merchandising and Marketing
Larry J. MerloExecutive Vice President–Stores
Douglas A. SgarroExecutive Vice President–Strategy and Chief Legal Officer
PresidentCVS Realty Co.
V. Michael FerdinandiSenior Vice President–Human Resourceand Corporate Communications
Philip C. GalboSenior Vice President and Treasurer
Larry D. SolbergSenior Vice President–Finance and Controller
Nancy R. ChristalVice President–Investor Relations
Gregory S. WeisharVice PresidentPresident and Chief Executive OfficerPharmaCare
Zenon P. LankowskySecretary
(48) CVS Corporation 2003 Annual Repo
DIRECTORS
W. Don Cornwell(2)(3)
Chairman of the Board and Chief Executive Officer Granite Broadcasting Corporation
Thomas P. Gerrity(1)
Professor of Management The Wharton School of the University of Pennsylvania
Stanley P. GoldsteinRetired; formerly Chairman of the Boardand Chief Executive Officer CVS Corporation
Marian L. Heard(1)(3)
President and Chief Executive OfficerUnited Way of Massachusetts Bay
Chief Executive OfficerUnited Ways of New England
William H. Joyce(1)(3)
Chairman of the Board and Chief Executive OfficerNalco Company
Terry R. Lautenbach(2)(3)
Retired; formerly Senior Vice PresidentInternational Business MachinesCorporation
Terrence MurrayRetired; formerly Chairman of the Boardand Chief Executive OfficerFleetBoston Financial Corporation
Sheli Z. Rosenberg(2)(3)
Retired; formerly President, ChiefExecutive Officer and Vice ChairmanEquity Group Investments, LLC
Thomas M. RyanChairman of the Board, President andChief Executive OfficerCVS Corporation
(1) Member of the Audit Committee.
(2) Member of the Management Planning andDevelopment Committee.
(3) Member of the Nominating and Corporate Governance Committee.
rt
SHAREHOLDER INFORMATION
Corporate HeadquartersCVS CorporationOne CVS Drive, Woonsocket, RI 02895(401) 765-1500
Annual Shareholders’ Meeting11:00 a.m. May 12, 2004CVS Corporate Headquarters
Stock Market ListingNew York Stock ExchangeSymbol: CVS
Transfer Agent and RegistrarQuestions regarding stock holdings,certificate replacement/transfer, dividendsand address changes should be directed to:The Bank of New YorkShareholder Relations DepartmentP.O. Box 11258Church Street StationNew York, NY 10286Toll-free: (877) CVSPLAN (287-7526)E-mail: [email protected]
Direct Stock Purchase/DividendReinvestment ProgramBuyDIRECTSM provides a convenient and economical way for you to purchaseyour first shares or additional shares of CVS common stock. The program is sponsored and administered by The Bank of New York. For moreinformation, including an enrollmentform, please contact:The Bank of New York at (877) 287-7526
Financial and Other CompanyInformationThe Company’s Annual Report on Form10-K will be sent without charge to anyshareholder upon request by contacting:Nancy R. ChristalVice President–Investor RelationsCVS Corporation670 White Plains Road–Suite 210Scarsdale, NY 10583(800) 201-0938
In addition, financial reports and recentfilings with the Securities and ExchangeCommission, including our Form 10-K, as well as other Company information, are available via the Internet athttp://investor.cvs.com.

H_Narr_Cvrs 3/24/04 11:42 AM Page 19
Our Vision:We help people live longer, healthier, happier lives.
Our Mission:We will be the easiest pharmacy retailer for customers to use.
Our Values for Success:Respect for individuals
IntegrityTeamwork
Openness to new ideasCommitment to flawless execution
Passion for extraordinary customer service

H_Narr_Cvrs 3/24/04 11:41 AM Page 2
CVS Corporation, One CVS Drive, Woonsocket, RI 02895