cvd prevention & management: a new approach for primary care rod jackson school of population...
TRANSCRIPT


CVD prevention & management: a new
approach for primary care
Rod JacksonSchool of Population Health
University of AucklandNew Zealand
CVD prevention & management: a new
approach for primary care
Rod JacksonSchool of Population Health
University of AucklandNew Zealand

Why bother about CVD in 1°care?Why bother about CVD in 1°care?
In a population of 10,000 primary care patients, every year there are about:
• 10 coronary & stroke deaths• 1 diabetic death• 1 breast cancer death• 1 prostate cancer death• 1 suicide every year• 1 road traffic death• (1 cervical cancer death every 5 years)
NZHIS annual mortality statistics

Blood pressure and CHDBlood pressure and CHD
Law & Wald BMJ 2002;324:1570-6

PSC.

Reduction in stroke with combination BP lowering therapy in PROGRESS, regardless of
baseline BP
Reduction in stroke with combination BP lowering therapy in PROGRESS, regardless of
baseline BP

There is no such thing as hypertension
There is no such thing as hypertension

16 20 24 28 32 36
0.5
1.0
2.0
4.0
CHD and SBP or Total cholesterolCHD and SBP or Total cholesterol
110 120 130 140 150 160 170
0.5
1.0
2.0
4.0
Blood pressure
Systolic blood pressure (mmHg)
Risk of coronary disease
0.5
1.0
2.0
4.0
“Hyper-tension”
“Hyperchol-
esterolaemia”
4.0 5.0 6.0 7.0 8.0
Total cholesterol (mmol/l)
Cholesterol

Reduction in CV events with cholesterol lowering in Heart Protection Study, regardless of baseline
cholesterol
Reduction in CV events with cholesterol lowering in Heart Protection Study, regardless of baseline
cholesterol

There is no such thing as hypercholesterolaemia
There is no such thing as hypercholesterolaemia

Smoking and the risk of stroke
Smoking and the risk of stroke
7.2
12
3.54
0
2
4
6
8
Reference Passive Ex-smoker Active Active
Source: Bonita, 1999
Odds Ratio

‘Diabetes’ & body mass index‘Diabetes’ & body mass index

There is no such thing as obesity
There is no such thing as obesity

Stroke, CHD, CVD & blood glucose Stroke, CHD, CVD & blood glucose
Total stroke
4.5 5.0 5.5 6.0 6.5 7.0 7.5
4.0
2.0
1.0
0.5
Hazard ratio & 95% CI
4.5 5.0 5.5 6.0 6.5 7.0 7.5
4.0
2.0
1.0
0.54.5 5.0 5.5 6.0 6.5 7.0 7.5
4.0
2.0
1.0
0.5
Total ischaemic heart diseaseCardiovascular death
Usual fasting glucose (mmol/l)Asia Pacific Cohort Studies Collaboration

HbA1c and microalbuminuria: Auckland, NZ
HbA1c and microalbuminuria: Auckland, NZ
Metcalf et al (unpublished)excl. diagnosed diabetics

There is no such thing as non-insulin dependant
diabetes
There is no such thing as non-insulin dependant
diabetes

Message Number 1:
there is no such thing as hypertension
or hypercholesterolaemia or obesity or type 2
diabetes
Message Number 1:
there is no such thing as hypertension
or hypercholesterolaemia or obesity or type 2
diabetes
and we all have CHDand we all have CHDQuickTime™ and a
TIFF (Uncompressed) decompressorare needed to see this picture.

a new paradigm:
‘risk factors’
‘CVD risk factors interact’

Impact of multiple risk factors on CVD risk
Impact of multiple risk factors on CVD risk
Jackson et al. Lancet 2005. 365:434-41

Relative Risk and 95% CI
34%
25%
0% 5% 10% 15% 20%
Few or no participantshad a history of stroke
Estimated 5 year stroke event rate
TreatmentControl
Most or all participantshad a history ofstroke or TIA
1.4%
5.1%
Relative Reduction in strokesAbsolute Reduction in strokes / 5 years
1.00.5 1.5
Absolute Effects Relative Effects
‘The bigger the CVD risk the bigger the benefit’: trials of BP lowering &
stroke
‘The bigger the CVD risk the bigger the benefit’: trials of BP lowering &
stroke

15% 5 yr risk
NZ threshold for CVD risk drugsNZ threshold for CVD risk drugs

Message Number 2:Message Number 2:
Measure risk, not risk factors

Estimating clinical risk:Framingham Heart Study
•Sex•Age•Diabetes•Smoking•BP•TC•HDL•(LVH)
Anderson et al. Am Heart J. 1991;121:293-8

45 yr old manBP 150/90 mmHg non smokerTC 6.0 mmol/LHDLC 1.2 mmol/Lnew ‘diabetes’
60 yr old manBP 150/90 mmHgsmokerTC 6.0 mmol/LHDLC 1.0 mmol/LNo ‘diabetes’
5 yr CVD risk ≈ 10%
5 yr CVD risk ≈ 25%
Are lipid +/or BP-lowering drugs indicated?
Are lipid +/or BP-lowering drugs indicated?

Clinical risk:
short-term vs life-time?
Clinical risk:
short-term vs life-time?

Lifetime risk is clinically irrelevant
The risk of death is 1 / person (100%)
What’s clinically relevant is when it happens
The lifetime CVD risk chart

Who should we treat?
Everybody - because we all have CHD
BUT the intensity of treatment should be directly proportional to the clinical risk and to the costs
of treatment QuickTime™ and a
TIFF (Uncompressed) decompressorare needed to see this picture.

Clinical risk treatment thresholds?
Clinical risk treatment thresholds?
$$$$$$$$$$$$$$$$$$$$$$$
At the clinical (absolute) risk that is affordable to individuals
or populationsCheaper interventions should be initiated at lower risk levels

risk threshold for high cost treatment
SBP treatment threshold for equal Rx benefit
Clinical CVD risk (% per yr)
low high
high
Patient 1 Patient 2 Patient 3
130 150 170
risk threshold for low cost treatment
Treatment goals?Treatment goals?
Based on clinical risk and the ‘costs’ of
lowering risk

CVD risk threshold for drug treatment
SBP target for equal Rx benefit
Clinical CVD risk (% per yr)
low high
high
Patient 1 Patient 2 Patient 3
130 150 170
CVD risk target for treatment
155135115

Message Number 3:Message Number 3:
Treat risk, not risk factors

The polypillThe polypill
Aspirin
Statin
Diuretic ± ACEI ± BB ± CCB
metformin?


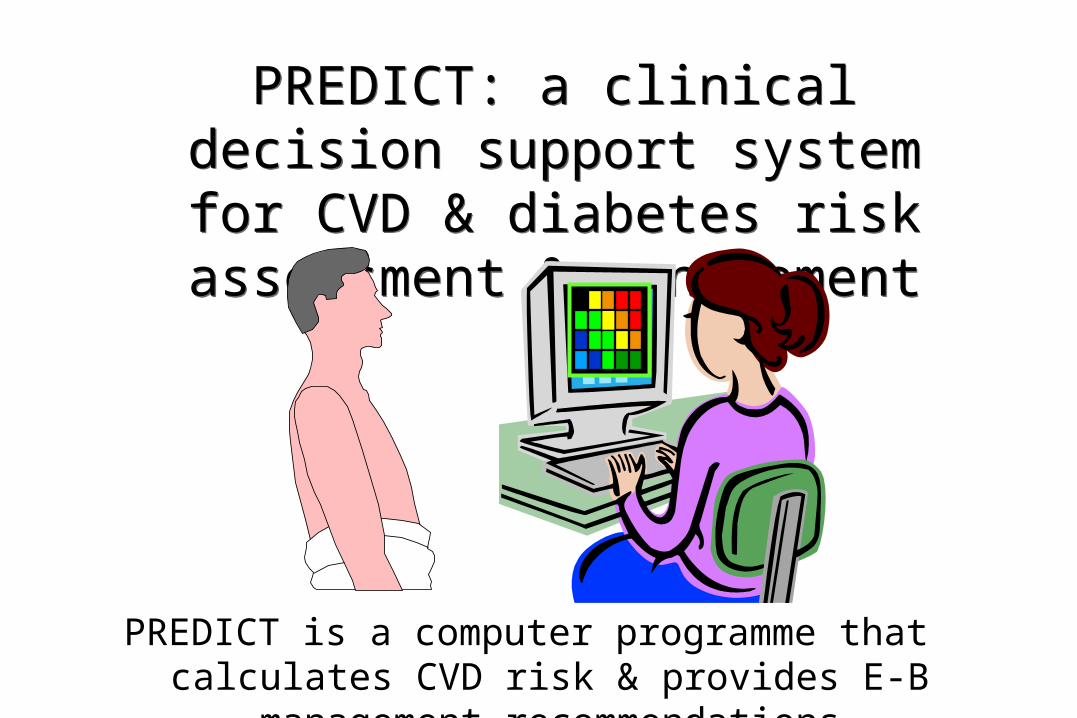
PREDICT: a clinical decision support system for CVD & diabetes
risk assessment & management
PREDICT: a clinical decision support system for CVD & diabetes
risk assessment & management
PREDICT is a computer programme that calculates CVD risk & provides E-B management recommendations


(Please note – dates are not representative as this is a test case)
Workflow: Individual Patient TrackingWorkflow: Individual Patient Tracking

Sample Report –Group DataSample Report –Group Data

Patient populations
All clinical data is made non-
identifiable with encrypted NHI and sent via
secure internet connection for
analyses
Combining information on patients Combining information on patients
Stored anonymous
CVD risk profiles
Practice/PHO/DHB population needs assessment & service planning

patient-specific outcomes: hospital admissions, deaths
Electronic medical recordEnrolled
population
patient-specific CVD risk factor profiles
NHI
NHI (encrypted)
Making new risk prediction chartsMaking new risk prediction charts

patient-specific outcomes: hospital admissions, deaths
Electronic medical record
Enrolled population
patient-specific CVD risk factor profiles
NHI
NHI (encrypted)
Link with encrypted NHI
Making new prediction chartsMaking new prediction charts

Risk groups in first 30,878 patients from PREDICT
Risk groups in first 30,878 patients from PREDICT

Results: estimated 5-year incidence of CVD event
For prior CVD 5-year risk is: 20 + 1.3*Framingham score Mean est. 5-year incidence for Hx CVD is 28.4% (95%CI 26.3 to 30.4)

Results: events in risk groups in first 30,878 patients from PREDICT
Results: events in risk groups in first 30,878 patients from PREDICT
47%
26%
63% of events occur in 21% of the people (high risk)
16%
11%

The potential magnitude of the population
evidence base
The potential magnitude of the population
evidence base
• One assessment per practitioner every other day for 46 weeks/year = 115 per year
• A practitioner can assess all appropriate patients in less than 5 years
• 1000 practitioners could assess more than 100,000 patients per year
‘one every other day is ok’‘one every other day is ok’

Message Number 4:
The next revolution in medicine will be electronic, not genomic
Message Number 4:
The next revolution in medicine will be electronic, not genomic
The future is already here, its just not widely distributed
It will be led by primary care

metabolic syndrome:
‘metabollocks!’
metabolic syndrome:
‘metabollocks!’
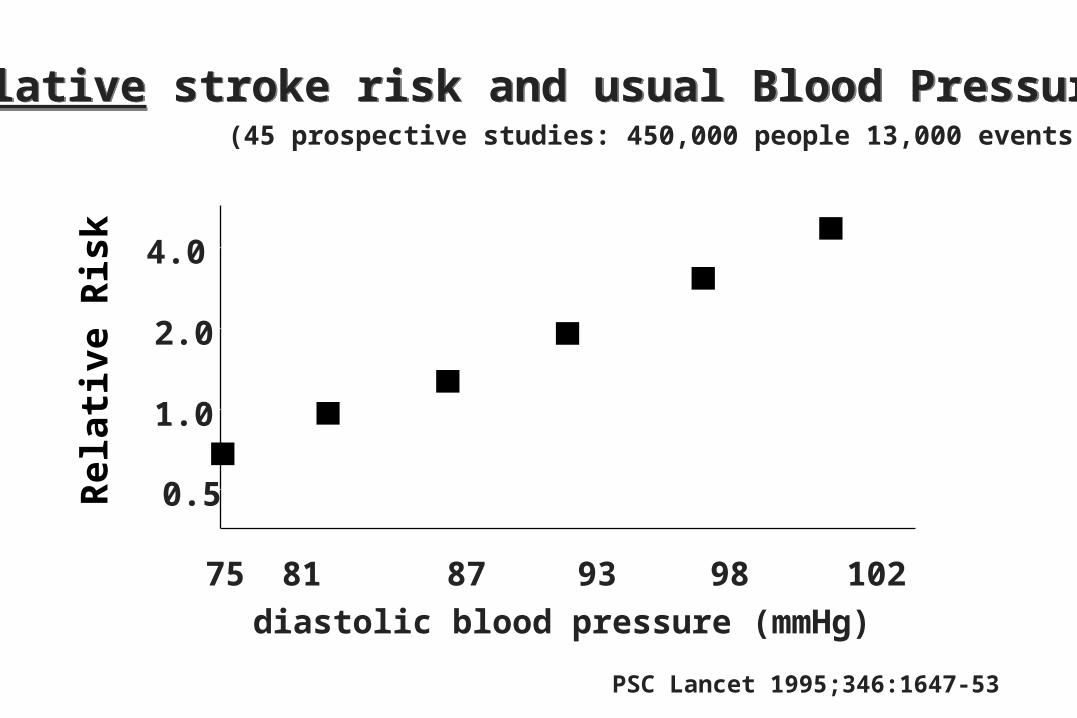
Relative stroke risk and usual Blood PressureRelative stroke risk and usual Blood Pressure
0.5
1.0
2.0
4.0
75 81 87 93 98 102diastolic blood pressure (mmHg)
PSC Lancet 1995;346:1647-53
(45 prospective studies: 450,000 people 13,000 events)Relative Risk

Relative stroke risk and usual Blood PressureRelative stroke risk and usual Blood Pressure
0.5
1.0
2.0
4.0
75 81 87 93 98 102diastolic blood pressure (mmHg)
PSC Lancet 1995;346:1647-53
(45 prospective studies: 450,000 people 13,000 events)
Relative Risk
DBP > 100 mmHg
DBP > 95 mmHg
DBP > 90 mmHgDBP > 80 mmHg