customized printing with proc report (chapter 15)math.unm.edu/~james/sas8.pdfcustomized printing...
TRANSCRIPT

Customized printing with PROC REPORT (Chapter 15)
PROC PRINT is fairly limited in terms of how much you can customizeoutput. PROC REPORT is more difficult to use but also more flexible.Default behavior is similar to PROC PRINT.
SAS Programming October 7, 2014 1 / 50

PROC REPORT
SAS Programming October 7, 2014 2 / 50

PROC REPORT
SAS Programming October 7, 2014 3 / 50
PROC REPORT
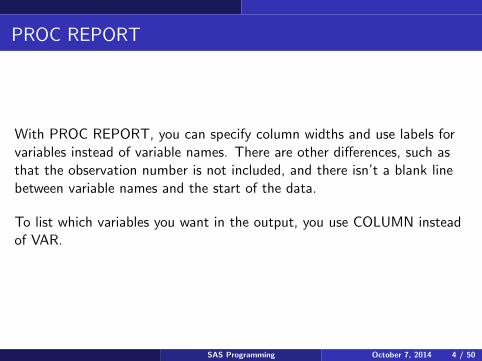
With PROC REPORT, you can specify column widths and use labels forvariables instead of variable names. There are other differences, such asthat the observation number is not included, and there isn’t a blank linebetween variable names and the start of the data.
To list which variables you want in the output, you use COLUMN insteadof VAR.
SAS Programming October 7, 2014 4 / 50
PROC REPORT
SAS Programming October 7, 2014 5 / 50

PROC REPORT
SAS Programming October 7, 2014 6 / 50

PROC REPORT: output in SAS Studio
SAS Programming October 7, 2014 7 / 50

PROC REPORT: writing to Word file
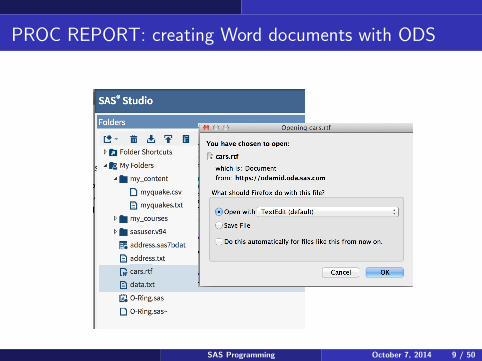
You can make your output generated by PROC REPORT (or any otherprocedure) saved as an .rtf (WORD) file by using the Output DeliverySystem. This is also the way to generate PDFs of your graphs fromSGPLOT and similar procedures.
SAS Programming October 7, 2014 8 / 50
PROC REPORT: creating Word documents with ODS
SAS Programming October 7, 2014 9 / 50
PROC REPORT: creating Word documents with ODS
SAS Programming October 7, 2014 10 / 50

PROC REPORT: creating Word documents with ODS
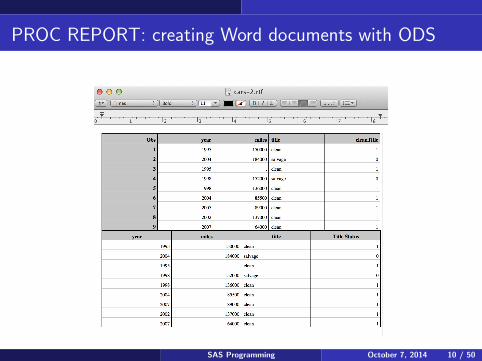
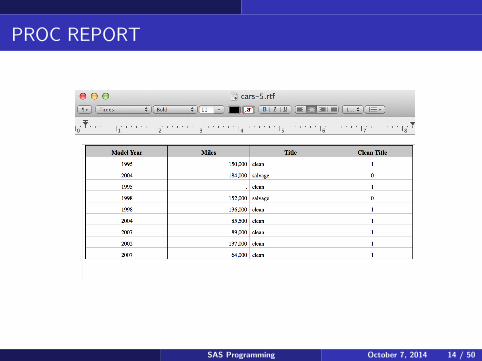
The Word Document isn’t pretty. It has just concatenated the outputfrom PROC PRINT and PROC REPORT.SAS seems to fill up the entire width of the Word Document with theoutput, so to some extent it ignores the widths that you specify, but therelative widths for the different columns will still matter.
SAS Programming October 7, 2014 11 / 50

Creating .csv files to be read in by Excel
You can also use ODS to create Excel-readable files using a similarapproach. E.g.,
ods csv file="myfile.csv"
proc report data=mydata;
run;
ods csv close;
This is quite useful in consulting situations. You might consult withsomeone who wants you to use SAS but doesn’t use SAS themselves. Ifthey want you to clean up the data and send the processed data back asan Excel file, this is a good way to do it.
SAS Programming October 7, 2014 12 / 50

PROC REPORT
SAS Programming October 7, 2014 13 / 50
PROC REPORT
SAS Programming October 7, 2014 14 / 50
PROC REPORT
SAS Programming October 7, 2014 15 / 50

PROC REPORT: grouping variables
you can also group variables into arbitrary categories.
SAS Programming October 7, 2014 16 / 50

PROC REPORT: grouping variables with blanks forrepeated values
SAS Programming October 7, 2014 17 / 50
PROC REPORT: computing variables
You can also do computations within PROC REPORT that you wouldnormally only expect to be able to do within DATA STEPS. The idea hereis to use “Computing Blocks”.
SAS Programming October 7, 2014 18 / 50
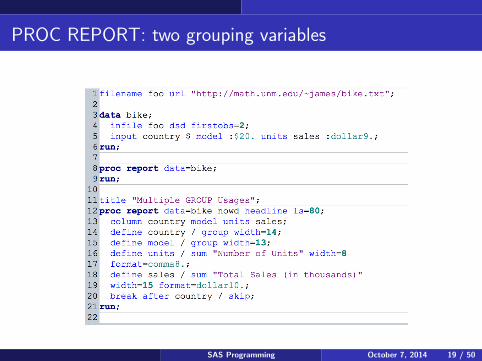
PROC REPORT: two grouping variables
SAS Programming October 7, 2014 19 / 50

PROC REPORT: two grouping variables
SAS Programming October 7, 2014 20 / 50

PROC REPORT: two grouping variables
SAS Programming October 7, 2014 21 / 50
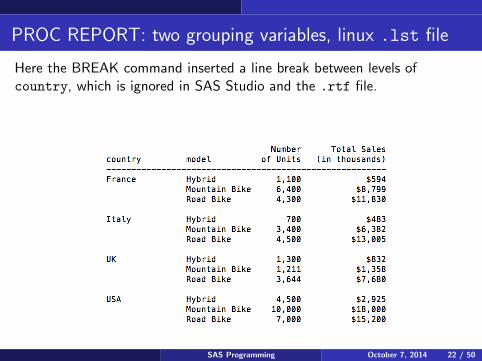
PROC REPORT: two grouping variables, linux .lst file
Here the BREAK command inserted a line break between levels ofcountry, which is ignored in SAS Studio and the .rtf file.
SAS Programming October 7, 2014 22 / 50

PROC REPORT: two grouping variables, linux .lst file
Changing the order of variables in the COLUMN statement changes theorder in the output (BREAK statement is ignored here in SAS Studio—inthe linux version, the output will be double spaced).
SAS Programming October 7, 2014 23 / 50

PROC REPORT: generating subtotals
q
SAS Programming October 7, 2014 24 / 50

PROC REPORT: generating subtotals
q
SAS Programming October 7, 2014 25 / 50

PROC REPORT: generating subtotals
SAS Programming October 7, 2014 26 / 50

PROC REPORT: computed variables
You can also do some computation within PROC REPORT instead ofdoing it within a datastep by using COMPUTE blocks.
SAS Programming October 7, 2014 27 / 50
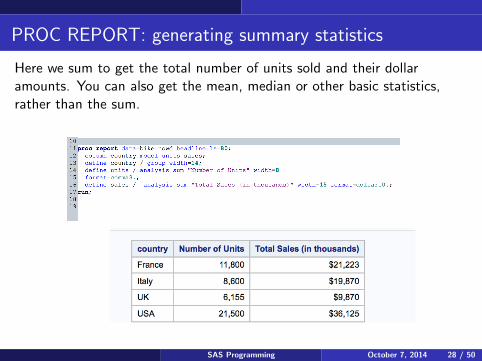
PROC REPORT: generating summary statistics
Here we sum to get the total number of units sold and their dollaramounts. You can also get the mean, median or other basic statistics,rather than the sum.
SAS Programming October 7, 2014 28 / 50

PROC REPORT: comments in reports
Sometimes it is useful to have comments which can be long characterstrings, such as in a questionaire or comments for a doctor’s visit. In thiscase, you can use SPLIT=’ ’ as an option for PROC REPORT and theFLOW option for the DEFINE statement to allow comments to flow overto a new line without interfering with other variables.
SAS Programming October 7, 2014 29 / 50

PROC REPORT: comments in reports
SAS Programming October 7, 2014 30 / 50

PROC REPORT: multicolumn displays
You can use PROC REPORT to display your data in multiple columns,which can be useful for saving space. Unfortunately I couldn’t get this todo anything in SAS Studio or the Word document, but it worked in Linuxin the .lst file. Unfortunately, using the ODS to create an .rtf file inLinux also failed to create multiple columns, so this feature seems to be oflimited use.
SAS Programming October 7, 2014 31 / 50

PROC REPORT: multicolumn displays
SAS Programming October 7, 2014 32 / 50

PROC REPORT: multicolumn displays
SAS Programming October 7, 2014 33 / 50

Multicolumn displays
A place in my life where I have wanted to generate automatedmulticolumn displays is in grant proposals or in CVs where I have wantedto have columns of names of collaborators that are alphabetized by name.If you change the list of people, it is a pain to change the list of people.
I encountered this problem about a year ago writing grant proposals, so Icame up with a specialized R program to deal with it. Given an input filewith a list of collaborators, it generates the LATEXcode to make a nice littletable of the collaborators in two columns.
SAS Programming October 7, 2014 34 / 50
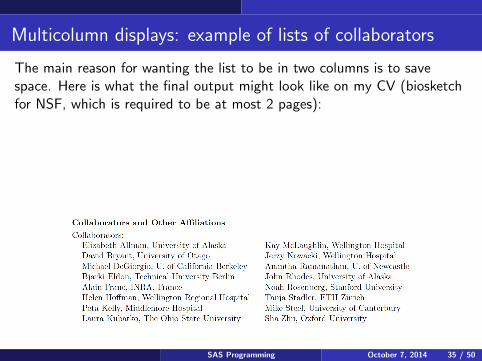
Multicolumn displays: example of lists of collaborators
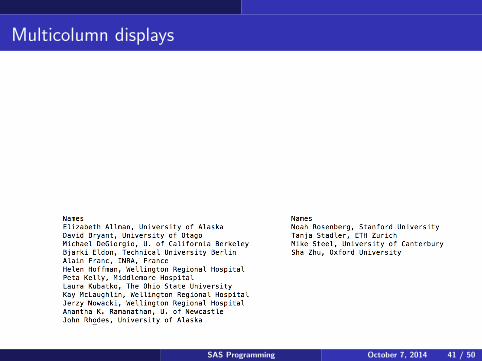
The main reason for wanting the list to be in two columns is to savespace. Here is what the final output might look like on my CV (biosketchfor NSF, which is required to be at most 2 pages):
SAS Programming October 7, 2014 35 / 50

Multicolumn displays: example of lists of collaborators
It is a pain to modify this. If I develop a new collaborator who’s namedoesn’t come later than “Zhu” alphabetically, then I have to insert thissomewhere in the list of names, and this will change the table quite a bit,so that collaborators will have to be moved from the right to left columnand vice versa. It’s just a pain to do a lot of copying and pasting. If youapply for several grants per year (I’ve done 8 in the last two years...) andyour list of collaborators is changing rapidly, then you start thinking ofautomating the problem.
SAS Programming October 7, 2014 36 / 50
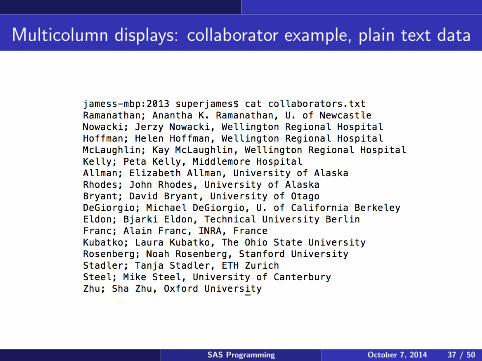
Multicolumn displays: collaborator example, plain text data
q
SAS Programming October 7, 2014 37 / 50

Multicolumn displays: collaborator example, plain text data
To make the problem easier for myself, I created a separate column withthe researcher’s last name even though that is repeated with their fullname. I want to alphabetize by last name but display the full name. Thisshouldn’t have been necessary, but just made things easier. Here is the Rcode to generate the LATEX
jamess-mbp:2013 superjames$ cat collaborators.r
x <- read.table("collaborators.txt",sep=";")
y <- x$V2[order(x$V1)] # sort full names and affiliation by
# lastname
if(length(y) %% 2 == 1) y <- c(y," ") # make even number of cells
y <- matrix(y,ncol=2,byrow=F) # arrange into matrix
write("\\begin{tabular}{ll}",file="collaborators.tex",append=T)
for(i in 1:floor(length(x$V1)/2)) {
write(paste("\\ \\",y[i,1],"&","\\ \\",y[i,2],"\\\\"),file=
"collaborators.tex",append=T)
print(i)
}
write("\\end{tabular}",file="collaborators.tex",append=T)SAS Programming October 7, 2014 38 / 50

Multicolumn displays
It would be reasonably straightforward to do the same sort of thing in SASwith PROC REPORT except that the minimum page size is 15 lines, sothis is slightly difficult. Here is an attempt.
SAS Programming October 7, 2014 39 / 50

Multicolumn displays
SAS Programming October 7, 2014 40 / 50
Multicolumn displays
SAS Programming October 7, 2014 41 / 50

Multicolumn displays: another attempt in SAS
q
SAS Programming October 7, 2014 42 / 50

Multicolumn displays: another attempt in SAS
Notes: the main reason for using PROC REPORT instead of PROCPRINT was that I didn’t want the the observation number printed with thedata.
Also, I couldn’t figure out how to get SAS to print \\ at the end of eachline. If you think of a way, let me know!
This is a little tricky because the backslash is a special character in SASwhich sometimes is used for filepaths, sometimes to indicate breaks inwords, but there is usually a way to print special characters in languages,so I suspect there is a solution.
SAS Programming October 7, 2014 43 / 50
Other tips for PROC REPORT
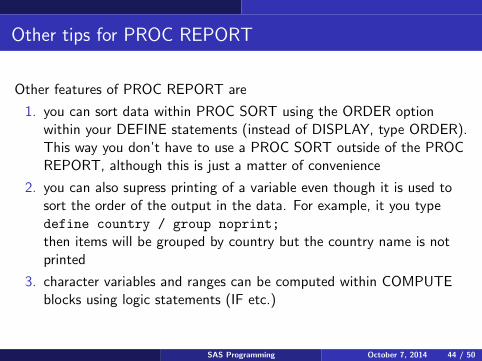
Other features of PROC REPORT are
1. you can sort data within PROC SORT using the ORDER optionwithin your DEFINE statements (instead of DISPLAY, type ORDER).This way you don’t have to use a PROC SORT outside of the PROCREPORT, although this is just a matter of convenience
2. you can also supress printing of a variable even though it is used tosort the order of the output in the data. For example, it you typedefine country / group noprint;
then items will be grouped by country but the country name is notprinted
3. character variables and ranges can be computed within COMPUTEblocks using logic statements (IF etc.)
SAS Programming October 7, 2014 44 / 50

ACROSS variables
When you have two grouping variables, you can make one of them anACROSS variable, which essentially turns your report into a 2x2 table.
SAS Programming October 7, 2014 45 / 50

ACROSS variables
SAS Programming October 7, 2014 46 / 50

ACROSS variables
The comma tells SAS that you want the number of units within each levelof model, instead of reporting the number of units as a separate variable.Without the comma, it is reporting the number of observations that havethe given combination of model of country, which is 1 for each combinationfor this data, and then it gives the marginal total for the number of units.The use of the comma assumes that you have an ACROSS variable first,then another non-grouping variable. To transpose the report, do thefollowing
SAS Programming October 7, 2014 47 / 50

ACROSS variables
SAS Programming October 7, 2014 48 / 50
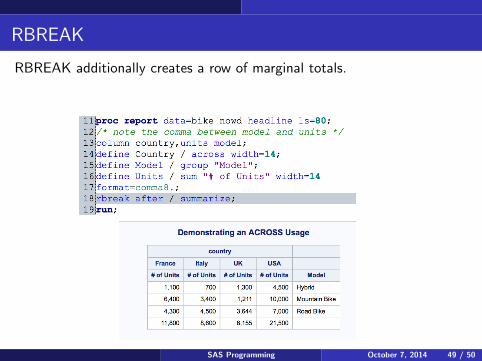
RBREAK
RBREAK additionally creates a row of marginal totals.
SAS Programming October 7, 2014 49 / 50

Two-way tables
It is a bit more natural to use PROC TABULATE for two-way tables, andthat is what we’ll look at next time...
SAS Programming October 7, 2014 50 / 50