customized lives (report) - bccat · transitions is not easy. the majority of studies examine...
TRANSCRIPT

Research by
Prepared by Lesley Andres & Judith OfferhausJune 2013
A Report from the Paths on Life’s Way Project
Customized Lives?Multiple Life Course Activities
of the Class of ‘88 Over 22 Years
BC COUNCIL ON ADMISSIONS & TRANSFER 709 – 555 Seymour Street, Vancouver BC Canada V6B 3H6
bccat.ca | educationplanner.ca | bctransferguide.ca t 604 412 7700 | f 604 683 0576 | e [email protected]
© Copyright 2013 by the British Columbia Council on Admissions and Transfer. BCCAT is the official mark of the BC Council on Admissions and Transfer,
as published by the Registrar of Trade-marks of the Canadian Intellectual Property Office.
This report is also available at www.bccat.ca/publications/research/paths
Research by
Prepared by Lesley Andres & Judith OfferhausJune 2013
A Report from the Paths on Life’s Way Project
Customized Lives?Multiple Life Course Activities
of the Class of ‘88 Over 22 Years
1
Customized Lives? Multiple Life Course Activities of the Class of ’88 Over 22 Years
Lesley Andres Judith Offerhaus University of British Columbia Bremen International Graduate School of Social Sciences Introduction Individuals do not progress from high school to post-secondary education and then on to work and other life sphere activities in a linear fashion. However, trying to capture the dynamics of numerous trajectories and transitions is not easy. The majority of studies examine transitions by considering only one type of trajectory (e.g., moving from one institution to another) with a focus on one life sphere (e.g., post-secondary participation). The order, sequence, and overlap of events such as post-secondary attendance, working, periods of unemployment, and returning to post-secondary studies after a period in the labour force or while engaging in other non-educational activities, remain largely unexamined. Also, the limited availability of data sets that can capture trajectories into, within, and out of post-secondary education in relation to other life events compounds the problem. The Paths on Life’s Way data set (http://blogs.ubc.ca/paths/) is ideal in capturing the nature of such transitions and trajectories. The Paths on Life’s Way project is the only longitudinal database of its kind in British Columbia and one of the few longitudinal studies of youth in Canada. Spanning over 22 years, this data set contains detailed education, work and life course related information collected at five points in time – 1989, 1993, 1998, 2003, and 2010. In this report, information reported monthly (i.e., at 259 time points) on post-secondary education, employment, unemployment, and “other”1 activities are employed. In these analyses, we employ responses to mail out survey questionnaires and use data from the 574 respondents who participated in all phases of data collection and present analyses of the entire 22 years between September 1988 and March 2010. The analyses employ 540 valid cases. We conduct analyses by gender, highest post-secondary credential earned, parental educational background, and geographic location of origin. In this report, we use the technique of sequence analysis to capture the complex types and nature of various trajectories of individuals over a 22 year period. Sequence analysis allows for the examination of all the elements in a sequence simultaneously2 and for the visual presentation that facilitates the detection of patterns. The main purpose of the analysis is to build on previous research3 by providing a more fine grained analysis of trajectories experienced by individuals across the course of their lives. We conclude by offering policy implications for BC and beyond. In Figure 1, a schema of the Paths on Life’s Way project is portrayed. In these analyses, we focus on the left hand side of Figure 1 and employ responses to mail out survey questionnaires.
1 “Other” is a wide-ranging category. Examples include childcare, homemaker, maternity leave, illness, travelling, disability, setting up a practice/business, parental care, and volunteer. 2 See Brzinsky-Fay, Kohler, & Luniak (2006), Aisenbrey & Fasang (2007) for an in depth description. 3 See Andres (2002a, 2002b, 2002c), Andres & Offerhaus (2012), Andres & Adamuti-Trache (2008), and Andres & Wyn (2010).

2
Figure 1. Paths on Life’s Way Sample
Analyses Each type of life course activity is considered a “state”. Individuals could have participated in more than one state at a given time (e.g., full-time post-secondary education and part-time work); however, each state must be mutually exclusive. For reasons of mutual exclusivity and ease of interpretation, we have collapsed the categories into eight different states, as portrayed in Figure 2. Figure 2. Life Course Activity States
Details of the Paths project can be found at the Paths on Life's Way Project website:
http://blogs.ubc.ca/paths/
3
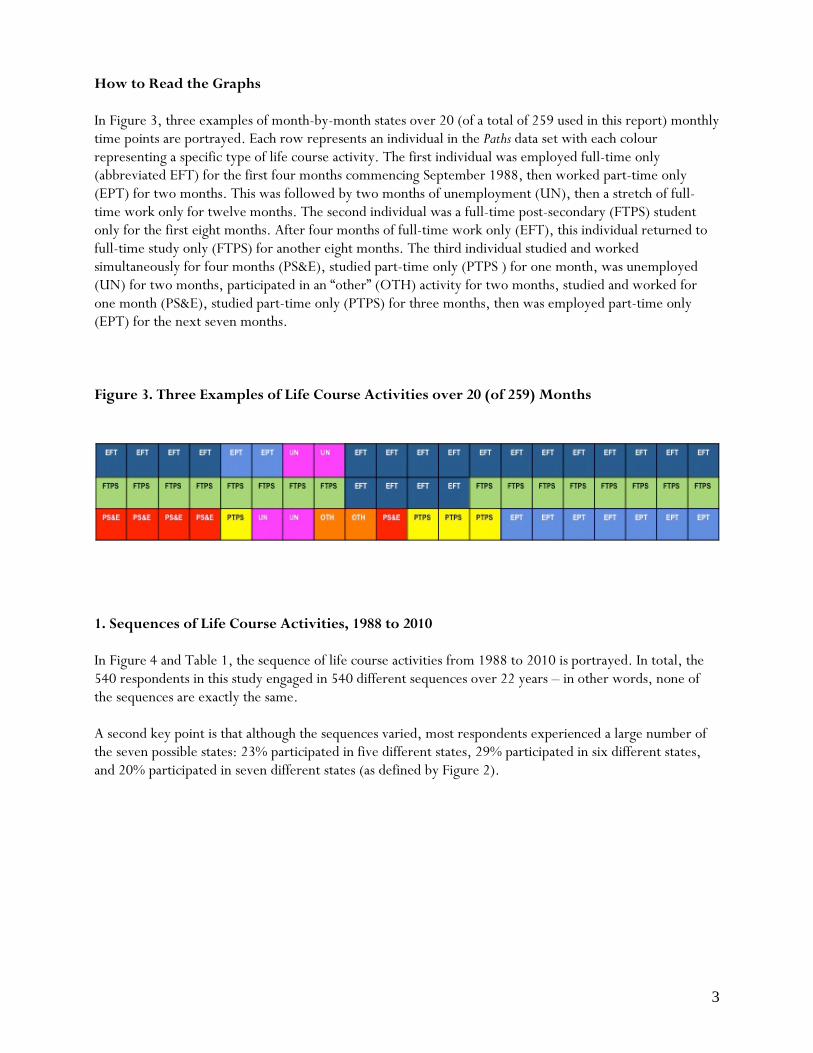
How to Read the Graphs In Figure 3, three examples of month-by-month states over 20 (of a total of 259 used in this report) monthly time points are portrayed. Each row represents an individual in the Paths data set with each colour representing a specific type of life course activity. The first individual was employed full-time only (abbreviated EFT) for the first four months commencing September 1988, then worked part-time only (EPT) for two months. This was followed by two months of unemployment (UN), then a stretch of full-time work only for twelve months. The second individual was a full-time post-secondary (FTPS) student only for the first eight months. After four months of full-time work only (EFT), this individual returned to full-time study only (FTPS) for another eight months. The third individual studied and worked simultaneously for four months (PS&E), studied part-time only (PTPS ) for one month, was unemployed (UN) for two months, participated in an “other” (OTH) activity for two months, studied and worked for one month (PS&E), studied part-time only (PTPS) for three months, then was employed part-time only (EPT) for the next seven months. Figure 3. Three Examples of Life Course Activities over 20 (of 259) Months
1. Sequences of Life Course Activities, 1988 to 2010 In Figure 4 and Table 1, the sequence of life course activities from 1988 to 2010 is portrayed. In total, the 540 respondents in this study engaged in 540 different sequences over 22 years – in other words, none of the sequences are exactly the same. A second key point is that although the sequences varied, most respondents experienced a large number of the seven possible states: 23% participated in five different states, 29% participated in six different states, and 20% participated in seven different states (as defined by Figure 2).
4
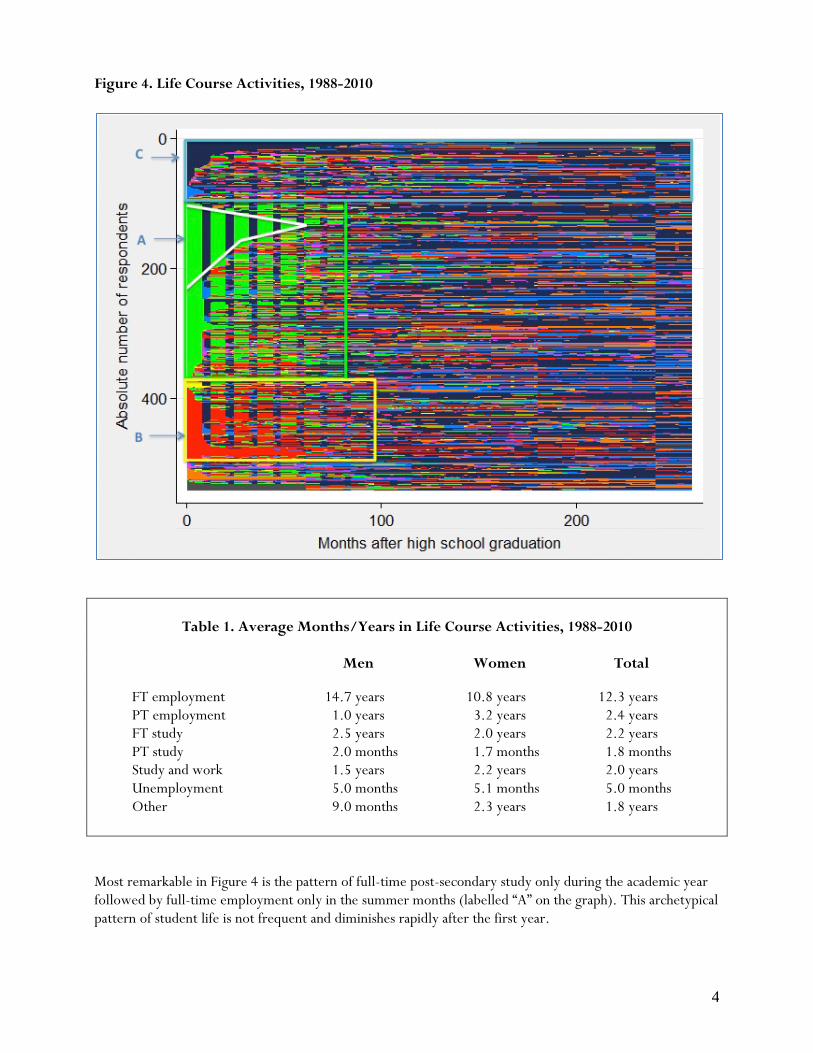
Figure 4. Life Course Activities, 1988-2010
Table 1. Average Months/Years in Life Course Activities, 1988-2010
Men Women Total FT employment 14.7 years 10.8 years 12.3 years PT employment 1.0 years 3.2 years 2.4 years FT study 2.5 years 2.0 years 2.2 years PT study 2.0 months 1.7 months 1.8 months Study and work 1.5 years 2.2 years 2.0 years Unemployment 5.0 months 5.1 months 5.0 months Other 9.0 months 2.3 years 1.8 years Most remarkable in Figure 4 is the pattern of full-time post-secondary study only during the academic year followed by full-time employment only in the summer months (labelled “A” on the graph). This archetypical pattern of student life is not frequent and diminishes rapidly after the first year.
5
Although it was quite common to commence eight months of post-secondary studies in the first year (1988) without being encumbered by other activities such as work, a dwindling proportion of respondents was able to sustain this pattern for four or five years. A considerable proportion began post-secondary studies while working (labelled “B” on graph).4 Interrupted in the summers by full-time work, the combination of post-secondary studies and simultaneous work persists over five years and is only occasionally exchanged for full-time study. A very small proportion began post-secondary studies as part-time students only (yellow area at the top of “B”) and very few switched from full-time status to part-time status without accompanying work. Paths respondents spent an average of just over two years from 1988 to 2010 studying full-time without simultaneously working or engaging in other activities. Across the 22 years, respondents spent an average of around 12 years in full-time work, almost two and a half years in part-time work, and just under six months in unemployment. An average of just under two years was spent in “other” activities. Studying exclusively part-time was rare, with respondents spending less than an average of two months in part-time post-secondary studies during this time period. Rather, respondents spent an average of just under two years in a combination of full- or part-time post-secondary studies and work. At the top of Figure 4 (labelled “C” on the graph) are those who worked full-time only (dark blue) and part-time only (light blue) in September 1988. In the next four years, participation across the various life spheres appears eclectic for these respondents, with more periods of unemployment than for those who had participated in post-secondary studies immediately following high school graduation. 2. Life Course Activities by Gender In Figure 5 and Table 1, distinct gender patterns are portrayed. A sizable proportion of women and men commenced post-secondary studies full-time in September 1988 (47% for both groups). However, over the course of four years, few men and fewer women (A) followed the traditional trajectory of full-time study only during the academic year followed by full-time work during the summers. Also, women were less likely than men to work full-time in the summer months and instead were more likely to work part-time. Approximately one fifth of female and male respondents combined post-secondary study and work (B) from the outset, but the pattern for men was more prolonged than for women. Very few women or men studied only part-time both in 1988 and across the ensuing years.
4 There are four combinations of post-secondary attendance and work: part-time post-secondary education + part-time work, part-time post-secondary education + full-time work; full-time post-secondary education + part-time work; and full-time post-secondary education + full-time work. Including this level of detail in the graphs renders them uninterpretable. Analysis focusing on combining post-secondary education and work will be presented elsewhere.
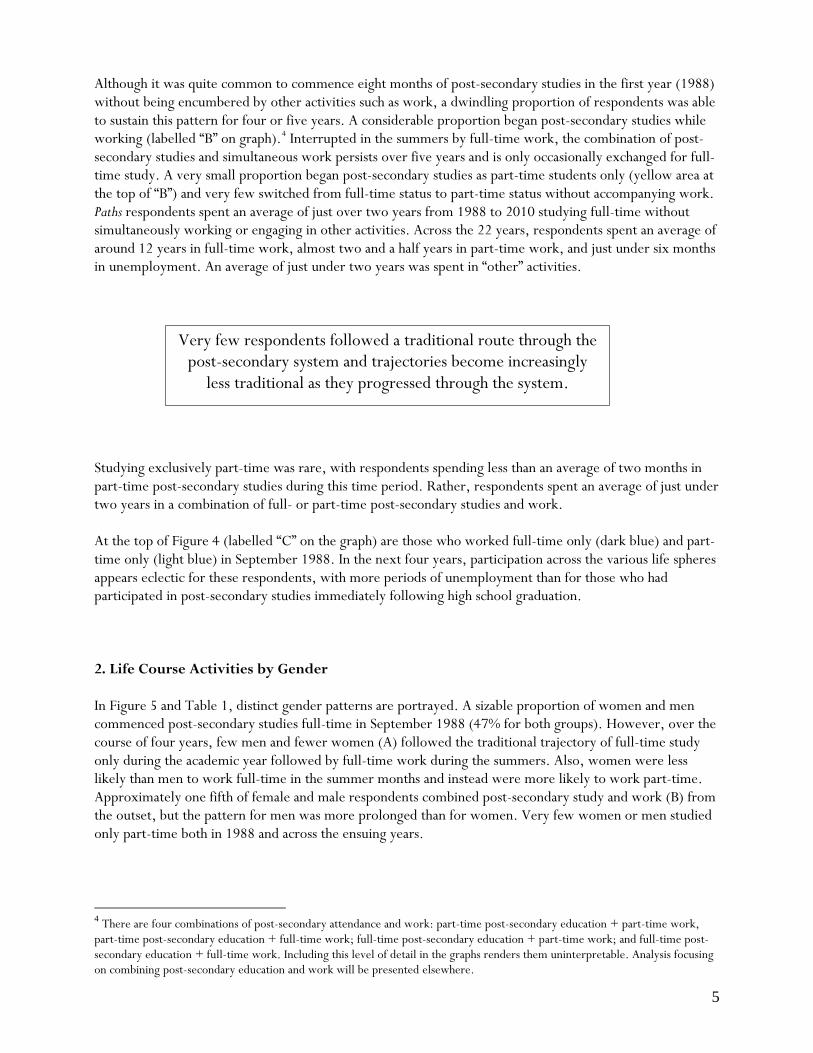
Very few respondents followed a traditional route through the post-secondary system and trajectories become increasingly
less traditional as they progressed through the system.
6
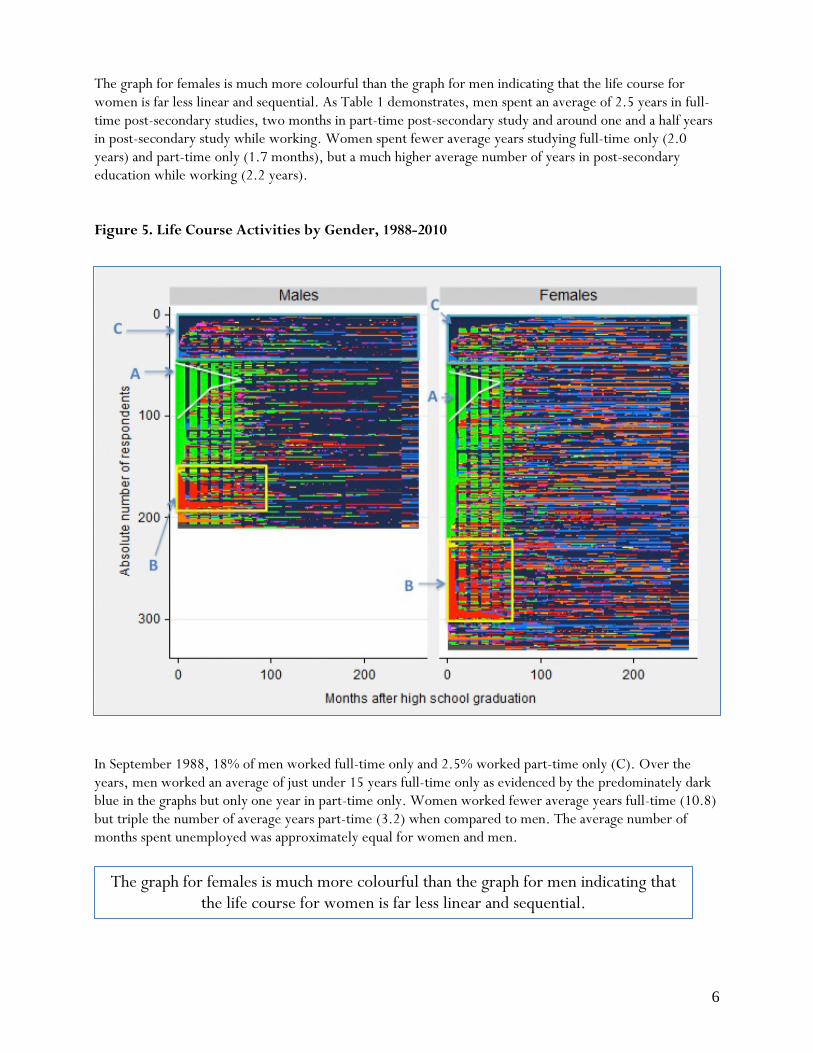
The graph for females is much more colourful than the graph for men indicating that the life course for women is far less linear and sequential. As Table 1 demonstrates, men spent an average of 2.5 years in full-time post-secondary studies, two months in part-time post-secondary study and around one and a half years in post-secondary study while working. Women spent fewer average years studying full-time only (2.0 years) and part-time only (1.7 months), but a much higher average number of years in post-secondary education while working (2.2 years). Figure 5. Life Course Activities by Gender, 1988-2010
In September 1988, 18% of men worked full-time only and 2.5% worked part-time only (C). Over the years, men worked an average of just under 15 years full-time only as evidenced by the predominately dark blue in the graphs but only one year in part-time only. Women worked fewer average years full-time (10.8) but triple the number of average years part-time (3.2) when compared to men. The average number of months spent unemployed was approximately equal for women and men.
The graph for females is much more colourful than the graph for men indicating that the life course for women is far less linear and sequential.
7
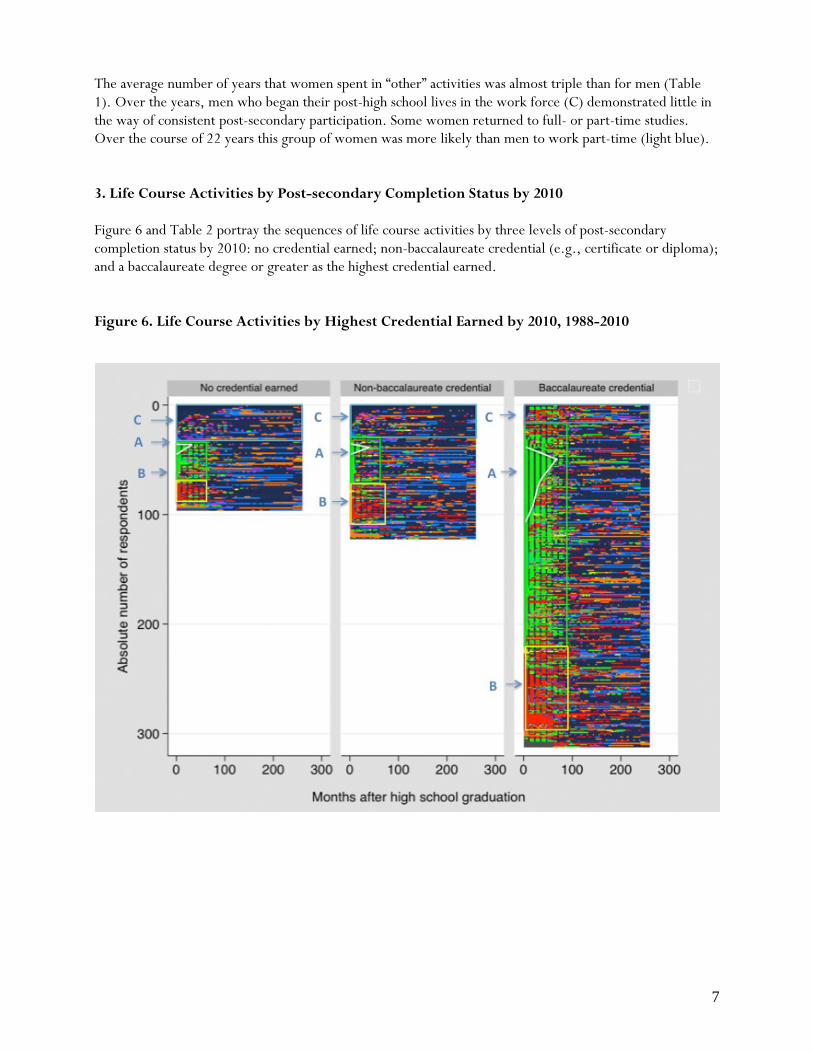
The average number of years that women spent in “other” activities was almost triple than for men (Table 1). Over the years, men who began their post-high school lives in the work force (C) demonstrated little in the way of consistent post-secondary participation. Some women returned to full- or part-time studies. Over the course of 22 years this group of women was more likely than men to work part-time (light blue). 3. Life Course Activities by Post-secondary Completion Status by 2010 Figure 6 and Table 2 portray the sequences of life course activities by three levels of post-secondary completion status by 2010: no credential earned; non-baccalaureate credential (e.g., certificate or diploma); and a baccalaureate degree or greater as the highest credential earned. Figure 6. Life Course Activities by Highest Credential Earned by 2010, 1988-2010

8
Table 2. Average Months/Years in Life Course Activities by Post-secondary Completion Status
No Credential Non-baccalaureate Baccalaureate Credential Credential FT employment 14.0 years 13.5 years 11.4 years PT employment 2.5 years 2.7 years 2.2 years FT study 1.2 years 1.1 years 3.0 years PT study 1.2 months 1.7 months 2.1 months Study and work 10.1 months 1.4 years 2.5 years Unemployment 5.8 months 6.4 months 4.3 months Other 1.9 years 1.8 years 1.7 years
In total, 18% of respondents did not earn a post-secondary credential. However, very few of this group did not participate in post-secondary education at some point over the time period of this study. By 2010, the proportion of never-attenders was only 3%. They were far less likely to participate in a traditional pattern of post-secondary attendance of full-time study followed by full-time summer work (A). Those without earned post-secondary credentials were equally likely than those with earned non-baccalaureate credentials to participate full-time only. They spent 1.2 months in part-time only study and around ten months combining post-secondary studies and work which is lower than the average for those with earned post-secondary credentials. Figure 6 demonstrates that the majority of those who did not earn post-secondary credentials did study full-time only or combined work or study over the first three to four years following high school graduation (B and C).This was most evident in the first year following high school graduation. Those who began their studies full-time only showed the most persistence over the first four years, whereas the proportion of those combining study and work dwindled considerably during the same time period. Figure 6 shows a high concentration of full-time work and to a lesser extent part-time work and participation in “other” activities, particularly between 1994 and 2010 (C). Those who had earned non-baccalaureate credentials by 2010 spent about a half a year less on average in full-time employment than the no credential group but a slightly higher average number of years in part-time employment. However, they spent about the same average years in full-time post-secondary studies as those without earned post-secondary credentials but a much higher average number of years in a combination of work and study than those without earned credentials. According to Figure 6, those who commenced studies full-time only in 1988 (A) spent a shorter continuous period in post-secondary education than those who studied while working simultaneously (B). The latter group was less likely to work part-time seven to 22 years out of high school than the former group (light blue). For the majority of this latter group (B), study together with work was prolonged for up to five years. Those who were employed full-or part-time directly out of high school show no protracted pattern of post-secondary studies. Rather, Figure 6 suggests that this group engaged in very short-term post-secondary programs. Those with earned baccalaureate level credentials or greater spent the fewest average number of years in full-time and part-time employment, but the most average number of years in full-time and part-time post-

9
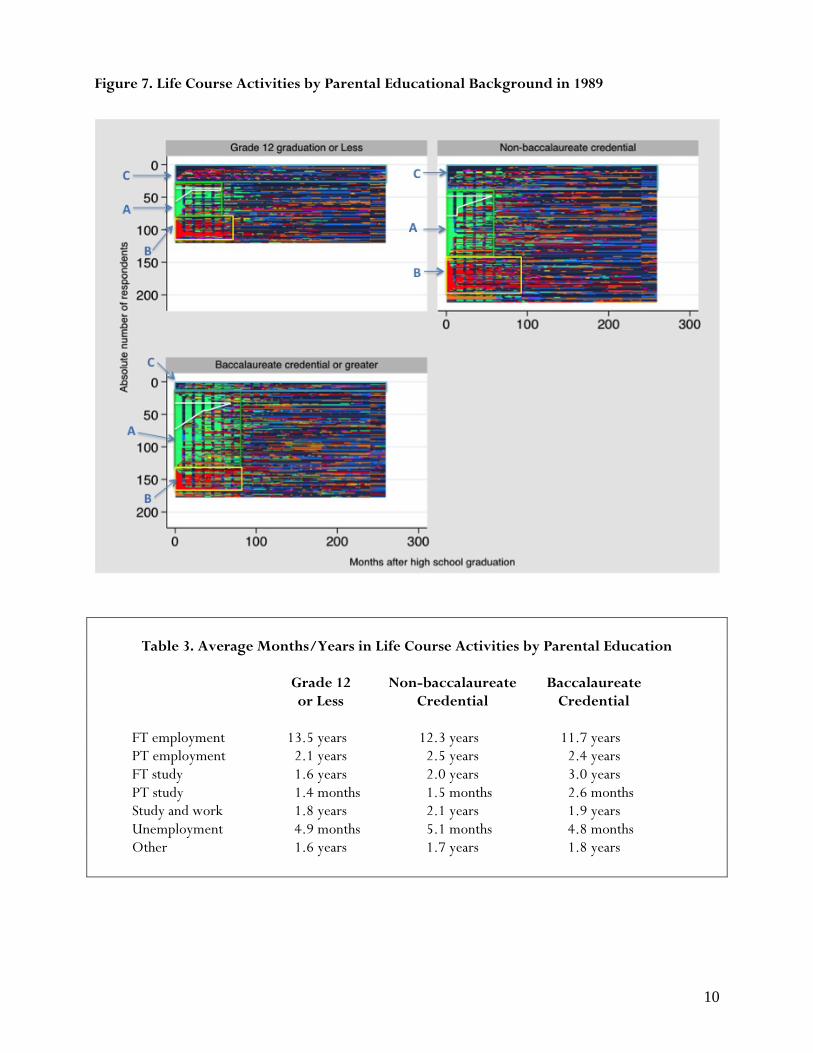
secondary study. The average number of years combining study and work was around two and a half years, which was higher than for those without any earned credentials and those with non-baccalaureate credentials. Also, Figure 6 demonstrates three patterns of continuous post-secondary studies, particularly over the first five years following high school graduation: full-time study only followed by full-time work during summers which, while far more pronounced than with the other post-secondary completion groups, is still the minority pattern (triangle shaped insert in A); full-time study interspersed with a combination of study and work during the school year and either full-, part-time work, or unemployment during the summer months which is the majority pattern (A); or either a solid period of study and work or study and work with full- or part-time work only in the summers (B). Study in one form or another was extended more consistently over a seven year period than with the other two groups. Those who worked full-time for one or more years directly out of high school were more likely to work and study in subsequent years than study full-time only during the academic year (C). The average number of months spent in unemployment was highest for those without any earned post-secondary credential and those with non-baccalaureate credentials and lowest for graduates with earned baccalaureate degrees or higher. 4. Life Course Activities by Parental Educational Background In Figure 7 and Table 3, life course activities by parental educational background as self-reported by respondents in 1989 are depicted. Respondents with one or more parents with earned baccalaureate degrees or higher spent on average one full year more in full-time post-secondary education than did those with one or more parents whose highest credential was at the non-baccalaureate level, and almost one and a half average years more than those with up to high school credentials only (A). The average number of months of part-time study and average number of years combining work and study was similar for all groups (B).
10
Figure 7. Life Course Activities by Parental Educational Background in 1989
Table 3. Average Months/Years in Life Course Activities by Parental Education
Grade 12 Non-baccalaureate Baccalaureate or Less Credential Credential FT employment 13.5 years 12.3 years 11.7 years PT employment 2.1 years 2.5 years 2.4 years FT study 1.6 years 2.0 years 3.0 years PT study 1.4 months 1.5 months 2.6 months Study and work 1.8 years 2.1 years 1.9 years Unemployment 4.9 months 5.1 months 4.8 months Other 1.6 years 1.7 years 1.8 years

11
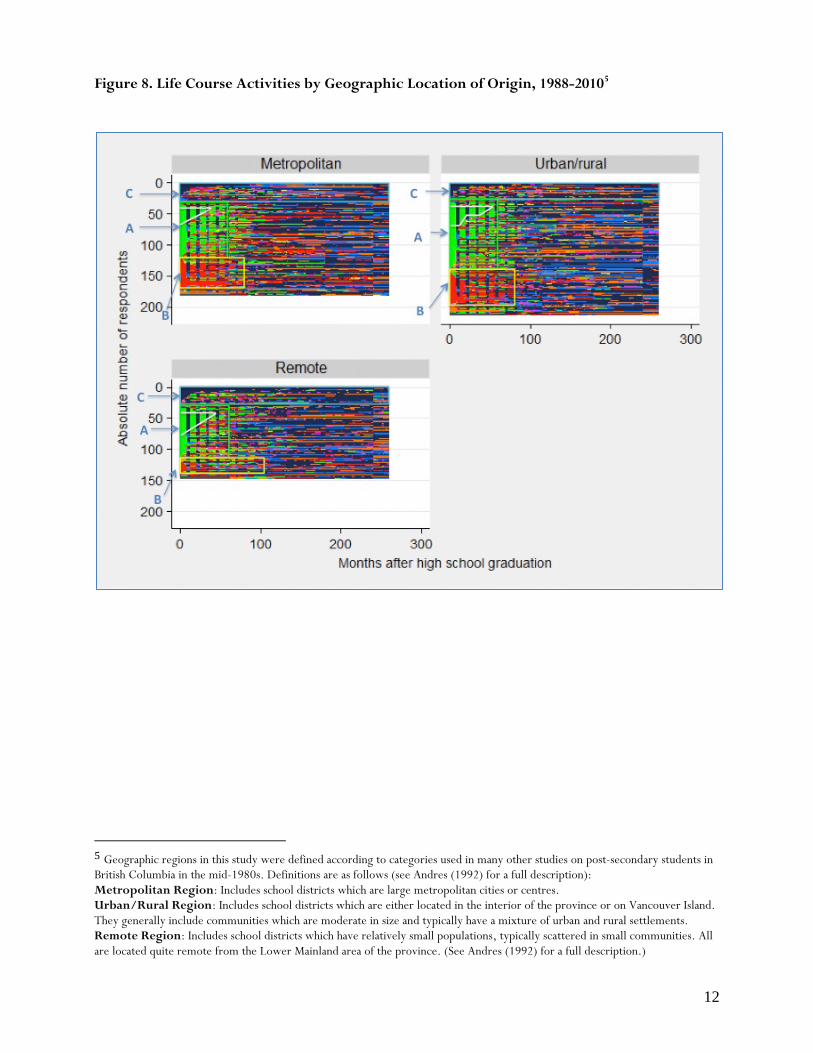
Figure 7 demonstrates that only a small proportion of all three parental education groups followed a traditional pattern of full-time studies during the academic year interspersed with full-time work in the summers; however, those whose parents had not completed any type of post-secondary education were the least likely to study full-time during the academic year with periods of summer employment in between. Those with baccalaureate educated parents managed to sustain a greater semblance of this pattern by occasionally replacing full-time study only with a combination of work and study. Also, similar to the previous graph, the duration of this pattern was longer, extending over around seven years. This pattern is also evident in the other two groups, but with less continuous full-time study overall. A larger proportion of those with parents who had a high school credential or less studied and worked continuously for up to five years after high school graduation (B). Respondents whose parents had a high school credential or less spent the most average years in full-time work and the least average years in part-time work. Those whose parents earned a baccalaureate degree or higher spent an average of nearly two years less in full-time work than those with parents with high school graduation or less. However, the average number of years of part-time employment only was in between the two groups. The average number of months spent unemployed or in “other” activities did not differ greatly across groups. It is noteworthy that the majority of respondents with baccalaureate educated parents who were employed either full- or part-time directly out of high school returned to post-secondary studies in their second year and maintained this pattern for up to four years either in full-time study or a combination of study and work (C). Graphs for the other two groups are distinctively different. Those whose parents had high school credentials or less showed no clear pattern of post-secondary studies. Respondents with parents who had a non-baccalaureate credential demonstrated post-secondary participation patterns somewhere in between the two groups. 4. Life Course Activities by Geographic Region of Origin Finally, in Figure 8 and Table 4 the life course activities for the Class of ’88 are described and plotted by geographic region of origin of respondents. Each region shows distinct participation patterns. Although the average number of years spent in full-time post-secondary studies or the average number of months spent in part-time study does not vary much among the three groups, the patterns of participation differ. Those from metropolitan regions particularly, and urban/rural regions to a lesser extent, showed more continuity in terms of either full-time study (A) or combining study and work (B) in the first four to five years following high school graduation. Those in remote regions followed a more traditional pattern of work or study (A) (i.e., full-time study followed by summers of full-time work) and spent a far fewer average number of years combining study and work (B).
12
Figure 8. Life Course Activities by Geographic Location of Origin, 1988-20105
5 Geographic regions in this study were defined according to categories used in many other studies on post-secondary students in British Columbia in the mid-1980s. Definitions are as follows (see Andres (1992) for a full description): Metropolitan Region: Includes school districts which are large metropolitan cities or centres. Urban/Rural Region: Includes school districts which are either located in the interior of the province or on Vancouver Island. They generally include communities which are moderate in size and typically have a mixture of urban and rural settlements. Remote Region: Includes school districts which have relatively small populations, typically scattered in small communities. All are located quite remote from the Lower Mainland area of the province. (See Andres (1992) for a full description.)
13
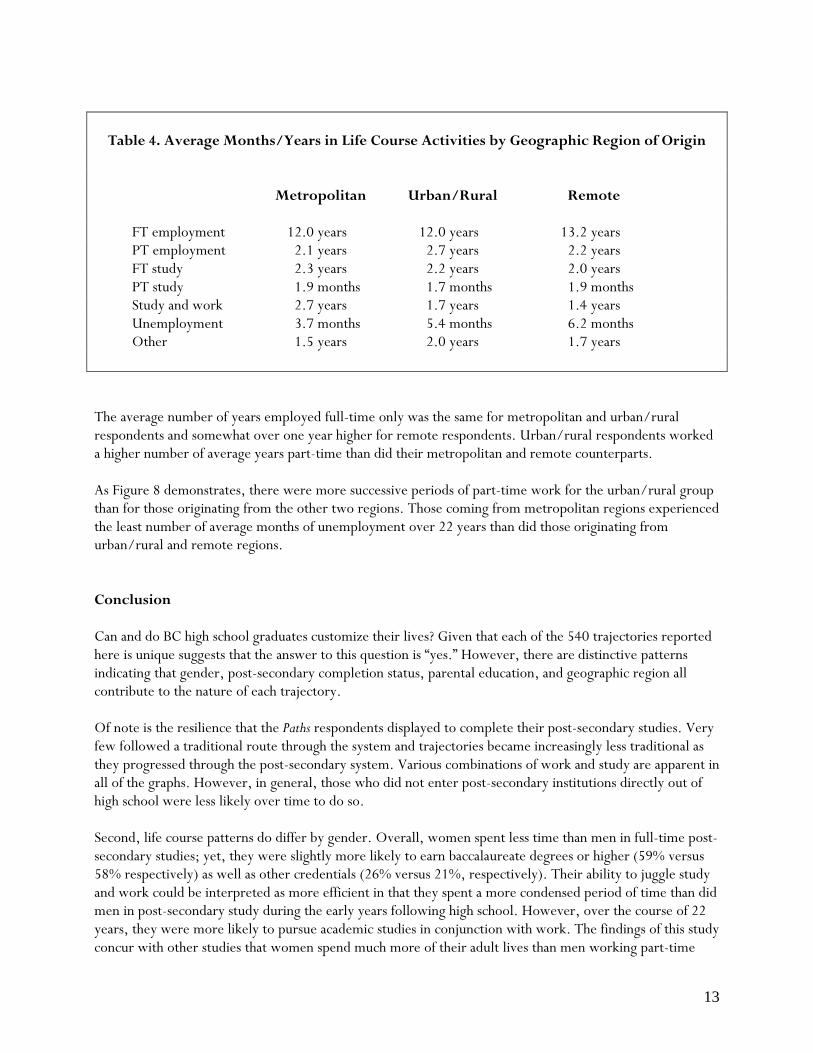
Table 4. Average Months/Years in Life Course Activities by Geographic Region of Origin
Metropolitan Urban/Rural Remote FT employment 12.0 years 12.0 years 13.2 years PT employment 2.1 years 2.7 years 2.2 years FT study 2.3 years 2.2 years 2.0 years PT study 1.9 months 1.7 months 1.9 months Study and work 2.7 years 1.7 years 1.4 years Unemployment 3.7 months 5.4 months 6.2 months Other 1.5 years 2.0 years 1.7 years
The average number of years employed full-time only was the same for metropolitan and urban/rural respondents and somewhat over one year higher for remote respondents. Urban/rural respondents worked a higher number of average years part-time than did their metropolitan and remote counterparts. As Figure 8 demonstrates, there were more successive periods of part-time work for the urban/rural group than for those originating from the other two regions. Those coming from metropolitan regions experienced the least number of average months of unemployment over 22 years than did those originating from urban/rural and remote regions. Conclusion Can and do BC high school graduates customize their lives? Given that each of the 540 trajectories reported here is unique suggests that the answer to this question is “yes.” However, there are distinctive patterns indicating that gender, post-secondary completion status, parental education, and geographic region all contribute to the nature of each trajectory. Of note is the resilience that the Paths respondents displayed to complete their post-secondary studies. Very few followed a traditional route through the system and trajectories became increasingly less traditional as they progressed through the post-secondary system. Various combinations of work and study are apparent in all of the graphs. However, in general, those who did not enter post-secondary institutions directly out of high school were less likely over time to do so. Second, life course patterns do differ by gender. Overall, women spent less time than men in full-time post-secondary studies; yet, they were slightly more likely to earn baccalaureate degrees or higher (59% versus 58% respectively) as well as other credentials (26% versus 21%, respectively). Their ability to juggle study and work could be interpreted as more efficient in that they spent a more condensed period of time than did men in post-secondary study during the early years following high school. However, over the course of 22 years, they were more likely to pursue academic studies in conjunction with work. The findings of this study concur with other studies that women spend much more of their adult lives than men working part-time

14
rather than full-time. As Andres and Wyn (2010) demonstrated, ongoing issues of lack of affordable and available childcare and challenges around work/life balance continue to beg for a policy solution.
Since graduating from high school in 1988, 85% of female and 79% of male Paths
respondents earned some form of post-secondary credential! In some regards, those who commenced but did not complete their post-secondary studies resembled those who had earned some type of credential. A considerable proportion of both groups enrolled in post-secondary education and maintained their enrolment status for up to five solid years. However, a much higher proportion of non-completers than the other two completion groups began working directly following high school graduation and they were less likely to combine work and study. Their subsequent participation in post-secondary studies was both sporadic and short. Of late, the appropriateness of encouraging academic study for all young people, in particular in relation to an alleged shortage of workers in the skilled trades, has been making headlines in both policy circles and the popular media. By 2010, only 2% of men and no women in the Paths study held trades credentials. Might this be an option for those who initially engaged in work over study? The relationship between parental educational background and life course trajectories is both a good news and less than good news story. A solid proportion of those whose parents’ highest level of education was high school graduation or less participated in several consecutive years of post-secondary studies. However, the ability to study full-time during the academic year, interspersed by full-time work in the summer, was much lower than for the other two parental education groups, suggesting that this option was not as affordable. Also, those in this category who worked directly out of high school showed little in the way of post-secondary participation over the next 22 years. This is in stark contrast to respondents with one or more parents who had earned baccalaureate degrees. This suggests a class effect rather than a preference effect. If the policy goal is to enhance participation by socio-economically disadvantaged groups, financial aid policies should be examined to ensure that they can participate in post-secondary education to the same extent as more well-off groups. Finally, participation patterns of those from remote regions are in stark contrast with those from metropolitan and urban/rural areas of the province. That very few respondents originating from remote regions combine study and work suggests two possibilities: they move out of their home communities to complete their post-secondary studies as quickly as possible, for reasons of affordability, family, and/or a desire to return to their home communities; they lack the connections to find work while studying that those from metropolitan and urban/rural students may have established through part-time work in high school; and/or they are able to earn good incomes in their resource-intensive home communities during the summers. The analyses in this report provide a long view into the interplay of the multiple course activities in which people engage from early to mid-adulthood. It is a reminder to those of us interested in post-secondary system success that other dimensions of adult life activities play an important role in people’s lives.
15
Reference List Aisenbrey, S., & Fasang, A. E. (2007). Beyond optimal matching: The ‘second wave’ of sequence analysis. New
Haven: Center for Research on Inequalities and the Life Course, Yale University. Andres, L. (1992). Paths on life’s way: Destinations, determinants, and decisions in the transition from high school.
Unpublished doctoral dissertation. University of British Columbia. Andres, L. (2002a). Paths on Life's Way: Base line study (1988) and first follow-up (1989). Vancouver:
Department of Educational Studies, University of British Columbia. Andres, L. (2002b). Paths on Life's Way: Phase II follow-up survey, 1993. Five years later (revised). Vancouver:
Department of Educational Studies, University of British Columbia. Andres, L. (2002c). Paths on Life's Way: Phase III follow-up survey, 1998. Ten years later. Vancouver:
Department of Educational Studies, University of British Columbia. Andres, L., & Adamuti-Trache, M. (2008). Life course transitions, social class, and gender: A fifteen year
perspective of the lived lives of Canadian young adults. Journal of Youth Studies, 11(2), 115-145. Andres, L., & Offerhaus, J. (2012). The mosaic of post-secondary institutional attendance: A twenty-two year
perspective. Vancouver: BC Council on Admissions and Transfer. http://edst.educ.ubc.ca/sites/edst.educ.ubc.ca/files/faculty_uploads/u20/BCCAT FINAL newsletter 2012.pdf
Andres, L., & Wyn, J. (2010). The making of a generation: The children of the 1970s in adulthood. University of
Toronto Press. Brzinsky-Fay, C., Kohler, U., & Luniak, M. (2006). Sequence analysis with Stata. The Stata Journal, 6(4),
435-460.

709 – 555 Seymour Street, Vancouver, BC Canada V6B 3H6 bccat.ca | educationplanner.ca | bctransferguide.ca | t 604 412 7700 | f 604 683 0576 | e [email protected]
BC Council on Admissions & Transfer