customer’s satisfaction as a mediator of the …ijebmr.com/uploads2018/ijebmr_02_281.pdf ·...
TRANSCRIPT

International Journal of Economics, Business and Management Research
Vol. 2, No. 05; 2018
ISSN: 2456-7760
www.ijebmr.com Page 204
CUSTOMER’S SATISFACTION AS A MEDIATOR OF THE EFFECT OF
PRODUCT ATTRIBUTES ON THE LOYALTY OF HYPERMARKET
CUSTOMERS IN MALANG CITY
Wulan Murni Sulianti
Mahmud
Economics and Business Faculty, University of Wisnuwardhana Malang
Indonesia
Abstract
This study is aimed to analyze the effect of product attributes on customer’s loyalty by mediating
customer’s satisfaction. This research was conducted on giant hypermarket customers in Malang
City, using a sample size of 140 respondents through Convenience sampling technique. The
collected data were analyzed by using Structural Equation Model (SEM). The results showed
that product attributes directly has a significant effect on the loyalty of giant hypermarket
customers in Malang City. Customer’s satisfaction plays a role as partial mediation from the
indirect effect of the influence between product attributes on customer’s loyalty
Keywords: Product Attributes, Customer’s Satisfaction and Loyalty.
INTRODUCTION
Opportunities in retail business in in Indonesia are considered still very tempting for
businessmen. Indonesia with a large population and supported by improving economic
conditions, it encourages retailers of both minimarkets and hypermarkets to roll out their new
outlets. One hypermarket that develops in Indonesia is Giant. Giant is a supermarket chain with
many branches in Indonesia. As of August 2010, there are 46 Giant hypermarkets and 104 Giant
supermarket outlets in Indonesia have been opened. Total visitors in 2013 was as much as
79.4%, in the year 2014 was as much as 79.5%, in 2015 decreased 79.3%, and in 2016 became
79.6% (http: // number of visitors hypermarkets. Blogspot.co.id /). This indicates that 80% of
Giant's hypermarkets control the market.
In Malang City, there are many retailers stand competing for market share. The competition is
getting tighter with the presence of hypermarkets such as Carrefour, Giant and Matahari
hypermarkets. Giant was first opened in 2002 at Villa Melati Mas Tangerang as a form of
cooperation with Dairy Farm with PT. Hero Supermarket Tbk. Until now, Giant has had 46
hypermarkets Giant and 104 outlets supermarkets spread across Indonesia, East Java Province
located in 10 major cities including Surabaya, Gresik, Sidoarjo, Pasuruan, Probolinggo, Malang,
Banyuwangi, Bojonegoro, Madiun and Kediri. Malang itself has 6 hypermarkets that is Giant
Dinoyo, Giant Pulosari, Giant Hypermart Mall Olympic Garden, Giant Sawojajar, Giant
Kebonsari Sukun and Giant Araya.
Along with the increase of hypermarkets and other retailers, competition between retailers and
hypermarkets is also increasing. One way to get and maintain market share is that retailers must

International Journal of Economics, Business and Management Research
Vol. 2, No. 05; 2018
ISSN: 2456-7760
www.ijebmr.com Page 205
be able to make their customers loyal. In order to keep customers loyal, hypermarket owners
need to pay attention to the quality of the products sold. In choosing a product, consumers will
consider the attributes of the product. Product attributes are product elements that are considered
important by consumers and used as a basis for purchasing decisions. Product attributes include
brands, packaging, guarantees, and services and so on (Tjiptono: 2008). Meanwhile, according
Simamora (2001) attributes of the product are the factors considered by buyers when purchasing
a product, such as price, quality, packaging, completeness of functionality (features), design,
after-sales service, and others. If a product has attributes or traits that are in line with what is
expected by the buyer, the product will be considered suitable and will be followed by a repeat
purchase action by the consumer.
The measurement of product attributes carried out by the previous research is not the same
between each other. Garvin (1987), Zeithaml (1988) revealed that the attributes of the products
formed from the performance or appearance of the product, features, durability or quality of
materials, the prices of products and brands. Kotler and Armstrong (2006) explained that product
attributes are formed from product quality, product features and product design. Gwin (2003) in
measuring product attributes using quality, price, variety, assortment and value of the products.
Whereas Newman, et al, (2002) use product quality, product shape and packaging, satisfactory
after-sales service, and the completeness of various products are the variables that make up the
product attributes.
Bennur and Jin (2009) concluded that product attributes affect consumer satisfaction and loyalty.
Corsi and Rungie (2010) show that there is a positive and significant relationship of product
attributes to consumer loyalty with a stronger price and packaging interacting in determining
consumer loyalty. Rajaguru and Matanda (2010) found evidence that product attributes such as
product quality, price and availability of new products have a significant effect on customer’s
loyalty. Nezakati, et al (2011) that product quality is the dominant variable that drives customers
to loyalty. Different results were shown by Reddy and Azeem (2011), Rahmat (2009) found
evidence that product quality did not have a significant influence on loyalty. Gil, et al. (2007)
that the perception of product quality has no effect on brand loyalty.
The results of the study of the effect of product attributes on customer’s loyalty show
inconsistent results or the existence of a research gap that creates interesting opportunities for
studies to fill the gaps and gaps of research by adding intervening variables or mediating
customer’s satisfaction.
A product can satisfy consumers if it is judged to meet or exceed their desires and expectations
(Spreng et.al. 1996). Bloemer and Ruyter (1997) explained that satisfaction is often seen as the
basis for the emergence of loyalty. Satisfaction is the result of customer evaluation of a product
by comparing whether the product received is in line with expectations. Satisfaction can also be
interpreted as a belief that arises after comparing reality with its expectations. For customers,
lacking the ability to compare, the satisfaction is actually only partial. This can be caused by a
lack of experience or information obtained by consumers related to the product to be purchased.
Mital and Baldasare (1998) suggested that poor performance on product attributes has a negative
effect on satisfaction and good performance on product attributes has a positive influence on
satisfaction. While Bloemer, et al. (1998), Oloughlin and Coenders (2002), and Luarn and Lin

International Journal of Economics, Business and Management Research
Vol. 2, No. 05; 2018
ISSN: 2456-7760
www.ijebmr.com Page 206
(2003) in their study found evidence that customer’s satisfaction has a direct effect on customer’s
loyalty.
Based on the phenomenon and results of previous empirical studies that have not been
consistent, this study examines the role of customer’s satisfaction as mediating the influence of
product attributes on customer’s loyalty of hypermarkets in Malang.
THEORITICAL REVIEW
Customer’s Loyalty
According to Griffin (2002), he stated that "loyalty is defined as non random purchase is
expressed over time by some decision making units". Based on this definition it can be seen that
loyalty is more directed to a behavior, which is indicated by routine purchases, based on
decision-making units. Customer’s loyalty has an important role in a company, maintaining them
means improving company performance, this is the main reason for a company to attract and
maintain.
Customer’s loyalty can be measured by indicators; the willingness of the customer to make the
company the first choice, the willingness of the customer to buy the product offered by the
customer, the willingness of the customer to invite others to buy, and the willingness of the
customer to tell about good things about the company (Foster and Cadogan, 2000). While the
indicator of customer’s loyalty according to Kotler & Keller (2006) is Repeat Purchase (loyalty
to product purchases); Retention (Resilience to negative influences regarding the company);
referalls (referring to the total firmness of the company). Trang T.M. Nguyen, et al (2007),
revealed that loyal customers will consider themselves to be loyal to supermarkets, shopping at
this supermarket in the next few weeks, shopping in supermarkets is the first choice, going to
shop at this supermarket in the future, and will promote this supermarket for family and friends.
Sung Jin Yoo and Young Jae Chang (2005) revealed that customer’s loyalty formed due to
favorable wording, repetitive purchase and intention of repurchase. While Chen (2008) identifies
the best choices for shopping, loyalty to the hypermarket, the desire to always shop at the
hypermarket, the order of shopping choices at the hypermarket, has the character where visitors
are served quickly
Customer’s Satisfaction
Tse and Wilton (1988) stated that customer’s satisfaction is the customer's response to the
evaluation of discrepancies felt after use. Engel (1995) defined customer’s satisfaction as a post-
purchase evaluation where the alternative chosen is at least equal to or exceeds customer
expectations, while dissatisfaction arises when results do not meet customer expectations.
According to Spreng, Mackenzie & Olshavsky (1996), customer’s satisfaction is measured based
on expectations, perceptions of performance, and assessment of the performance of the product
or service consumed. Fornel et al (1996) uses three items in measuring customer’s satisfaction,
namely 1) Overal satisfaction is the result of evaluation and current consumption experience
derived from habits, constraints and standardization of services; 2) Confirmation of expectation

International Journal of Economics, Business and Management Research
Vol. 2, No. 05; 2018
ISSN: 2456-7760
www.ijebmr.com Page 207
is the level of conformity between customer performance and expectations and 3) Comparison of
Ideal is product performance compared to ideal conditions according to customer perception.
Maxwell K. Hsu et al. (2010) customer’s satisfaction is measured based on satisfaction with
shopping decisions at Hypermarkets, the choice to shop at Hypermarket is wise, the shopping
experience at Hypermarket is pleasant and satisfied with the products and services provided.
Dong-Mo Koo, (2003) revealed that customers who are satisfied with the decision to buy a
product in this shop, make a wise decision to buy a product in this shop, and when they finish
shopping and get out of this shop I think I'm doing the right thing
Product Attribute
Product attributes have a large influence on buyer perceptions of the product. This is because
physical product attributes carry a variety of benefits needed and desired by the buyer. Therefore,
every company must be careful in making decisions related to attributes.
According to Kotler and Armstrong (2006), the development of products and services requires
defining the benefits offered. These benefits are then communicated and delivered through
product attributes such as product quality, product featurs and product style and design.
Meanwhile, according to Simamora (2001) product attributes are the factors considered by
buyers when buying products, such as price, quality, completeness of functions, design, after-
sales service and others. Dimensional zed product attributes according to Garvin (1987) and
Zeithaml (1988), namely: Product performance or appearance, features or characteristics of
additional products, product durability, product prices and brands.
HYPOTHESIS DEVELOPMENT
Bennur and Jin (2009) concluded that product attributes affect consumer satisfaction and loyalty.
Corsi and Rungie (2010) show that there is a positive and significant relationship of product
attributes to consumer loyalty with a stronger price and packaging interacting in determining
consumer loyalty. Rajaguru and Matanda (2010) found evidence that product attributes such as
product quality, price and availability of new products have a significant effect on customer’s
loyalty. Nezakati, et al (2011) that product quality is the dominant variable that drives customers
to loyalty.
Based on the results of an empirical study, the hypothesis of this study is presented as follows:
H1 Product attributes have a significant effect on customer’s loyalty.
A product can satisfy consumers if it is considered to meet or exceed its desires and expectations
(Spreng et al. 1996). Spreng et al. (1996), Mital. et al. (1998), Bei and Chiao (2001) shows that
there is an influence between product attributes on customer’s satisfaction, while research
conducted by Bloemer, et al. (1998), Oloughlin and Coenders (2002) and Luarn and Lin (2003)
show that customer’s satisfaction influences customer’s loyalty.
Based on the results of an empirical study, the hypothesis of this study is presented as follows:
H2 Customer’s satisfaction as mediating the influence of product attributes on customer’s
loyalty.

International Journal of Economics, Business and Management Research
Vol. 2, No. 05; 2018
ISSN: 2456-7760
www.ijebmr.com Page 208
RESEARCH METHOD
Population and Sample
The population of this study is customers who shop at Giant Hypermarket in Malang City. The
population in this study is an infinite population, which is a very large population size and the
number cannot be known with certainty. In these conditions, the size of the sample is determined
based on the number of indicators of each variable multiplied by 5. Solimun (2002) states that
the determination of the size of the sample size equals 5 to 10 times the number of manifest
variables (indicators) of the entire latent variable. Based on these provisions, the sample size
used is 14 X 10 = 140 respondents.
After determining the number of samples as many as 120 respondents, then distributed at Giant
in Malang City, then carried out sampling with Convenience sampling technique that is the
sample is taken based on spontaneity, meaning anyone who meets the researcher and in
accordance with the requirements of the target population, then the person can be sampled.
Customers are found when shopping at Giant. To avoid sampling errors, the criteria for the
members of the target population are 1) at least 18 years of age, this is based on the assumption
that the respondent is independent in giving answers because they are considered adults, 2)
decision makers, meaning that the respondents are truly as a customer who makes shopping
decisions at Giant.
Definition of Operational Variable
Variable operational definition is an element of research that tells how to measure a variable that
contains indicators that allow researchers to collect relevant data for that variable. Operational
definitions of variables and variable indicators are presented in table 1. The following:
Table 1. Research Variables and Indicators
Variable Indicator Source
Product attribute
Product quality Garvin (1987), Zeithaml
(1988), Newman, et al,
(2002), Gwin, (2003) Complete range of products
Product packaging
Product price
Customer’s
satisfaction
Meeting expectations Maxwell K. Hsu et al
(2010) Matching product quality with
expectations
Suitability of product prices with
expectations
International Journal of Economics, Business and Management Research
Vol. 2, No. 05; 2018
ISSN: 2456-7760
www.ijebmr.com Page 209
Satisfaction with service
Satisfaction with comfort
Customer’s Loyalty The best choice for shopping Trang T.M. Nguyen, et
al (2007) dan Chen
(2008) The first choice for shopping
Loyalty to giant hypermarkets
The desire to always shop at giant
hypermarkets
Recommend to family and friends
Data Analysis Method
In connection with the formulation of the problem, the objectives and hypothesis of the research,
then, the data analysis used in the study with Structural Equation Modeling (SEM). Hypothesis
testing uses CR (critical ratio) coefficients that are analogous to the t test with prob values. (p)
and if p> 0.05 then H0 is accepted, if p ≤ 0.05 then H0 is rejected.
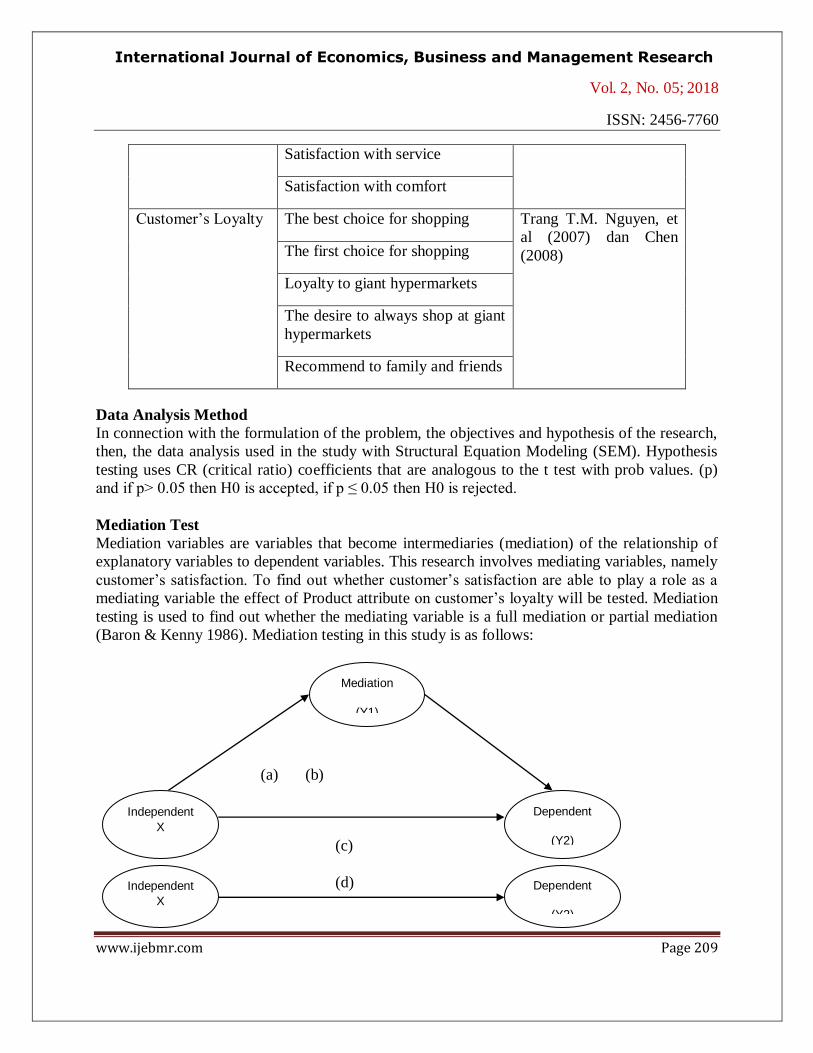
Mediation Test
Mediation variables are variables that become intermediaries (mediation) of the relationship of
explanatory variables to dependent variables. This research involves mediating variables, namely
customer’s satisfaction. To find out whether customer’s satisfaction are able to play a role as a
mediating variable the effect of Product attribute on customer’s loyalty will be tested. Mediation
testing is used to find out whether the mediating variable is a full mediation or partial mediation
(Baron & Kenny 1986). Mediation testing in this study is as follows:
(a) (b)
(c)
(d)
Independent
X
Dependent
(Y2)
Independent
X
Mediation
(Y1)
Dependent
(Y2)

International Journal of Economics, Business and Management Research
Vol. 2, No. 05; 2018
ISSN: 2456-7760
www.ijebmr.com Page 210
Figure 1 Mediation Test the Effect of X on Y2 Mediated by Y1
Information:
1. (a), (b) and (c) are the results of the overall path and model coefficients
2. (d) is the result of the path coefficient of the overall model without the mediating variable.
Testing approach
1. If in (a) and (b) are significant while (c) it is not significant then it can be said to be full
mediation (complete mediation)
2. If in (a) and (b) are significant while (c) are significant, where the coefficient value (c) is
smaller (down) than (d) then it can be said to be partial mediation.
3. If in (a) and (b) are significant while (c) it is significant, where the coefficient of (c) is almost
the same as (d) then not as a mediating variable
4. If one of (a) or (b) is not significant, then it is not a mediating variable
Results
Results of SEM Analysis of Goodness of Fit
Theoretical model in the conceptual framework of research is said to be fit if supported
by empirical data. The results of the goodness of fit overall model testing are given in Figure 2.
product
attribute
customer
satisfaction
X1.4e4
,77X1.3e3
,75
X1.2e2,77
X1.1e1,70
Y1.3
e7
Y1.4
e8
Y1.5
e9
,79
,71
customer
loyalty
Y2.1 e10
,76
Y2.2 e11,70
Y2.3 e12
,70,31
,79
MEASURES OF FIT
RMSEA=,000
GFI=,935
AGFI=,907
CFI=1,000
TLI=1,021
Khi kuadrat=60,493
Khi Kuadrat/DF=,817
p_value=,871
u1
u2
,41
,67
Y1.2
e6
,71
Y1.1
e5
,77
Y2.4 e13
,79
Y2.5 e14
,80

International Journal of Economics, Business and Management Research
Vol. 2, No. 05; 2018
ISSN: 2456-7760
www.ijebmr.com Page 211
Figure 2. Path Diagram Results of SEM Analysis
The test results of Goodness of Fit Overall based on Figure 1, it can be seen that all criteria
indicate the model has met the cut-off value; therefore, the model can be categorized suitable and
suitable for use, so that interpretation can be carried out for further discussion.
As a basis for testing hypotheses, critical ratio (Cr) is used from the results of Weight regression
output. Where the hypothesis will be accepted if the p value < from the significance of 5%, then
the null hypothesis is rejected. The results of the analysis are contained in Tables 2 and 3.
Table 2. Recapitulation of Hypothesis Testing Results
The Effect between Variable Path
Coeficient
T -
Statistic
Note
Product attributes → Customer’s
satisfaction
0,299 2,928 Sig
Customer’s satisfaction → Customer’s
loyalty
0,178 2,270 Sig
Product attributes → Customer’s loyalty 0,205 2,089 Sig
Source: Processed Data
Table 3. Recapitulation of Hypothesis Testing Results
Inter Variable Influence Path
Coeficient
T -
Statistic
Note
Product attributes → Customer loyalty 0,779 6.578 Sig
Source: Processed Data
Based on the results of the mediation test, the path of influence between product attributes on
customer’s loyalty shows that product attributes significantly affect customer’s satisfaction with
a coefficient of 0.299 (a) and customer’s satisfaction significantly influence customer’s loyalty
with a coefficient of 0.178 (b). Whereas, the path coefficient of the influence of product
attributes on customer’s loyalty controlled by customer’s satisfaction has a coefficient value of
0.205 (c). Furthermore (c) it has a smaller coefficient value (down) than the effect of product
attributes on customer’s loyalty without the mediating variable of customer’s satisfaction with a
coefficient of 0.779 (d). Thus, it can be said that customer’s satisfaction acts as a partial
mediation of the indirect effect of product attributes on customer’s loyalty.
Discussion of Research Results
Effect of product attributes on customer’s loyalty.

International Journal of Economics, Business and Management Research
Vol. 2, No. 05; 2018
ISSN: 2456-7760
www.ijebmr.com Page 212
Product attributes have a significant effect on the loyalty of Giant Hypermarket customers in
Malang City. According to Griffin (2005), the rewards of loyalty are long-term and cumulative.
The longer the customer’s loyalty, the greater the profit gained from that customer. Conversely,
switching customers can be detrimental to the company because the cost of serving and selling
goods to old customers is lower than that of new customers. To get the loyalty of giant
hypermarket customers in the city of Malang, the products sold by giant hypermarkets must have
good quality in terms of completeness of various products sold, such as household needs, food
and including daily needs, textile, fashion, furniture, so that the product has provided a separate
place in the eyes of consumers. In addition, the packaging uses packaging and its own brand at a
cheaper price so that it is attractive to customers.
The results of this study extend the study conducted by Bennur and Jin (2009) to conclude that
product attributes affect consumer satisfaction and loyalty. Corsi and Rungie (2010) show that
there is a positive and significant relationship of product attributes to consumer loyalty with a
stronger price and packaging interacting in determining consumer loyalty. Rajaguru and Matanda
(2010) found evidence that product attributes such as product quality, price and availability of
new products have a significant effect on customer’s loyalty. Nezakati, et al (2011) that product
quality is the dominant variable that drives customers to loyalty.
Customer’s satisfaction as a mediation of the influence of product attributes on customer’s
loyalty
Based on the results of inferential statistical analysis produced that customer’s satisfaction acts
as partial mediation of the indirect effects of the effect of product attributes on customer’s
loyalty. In connection with these results, the role of mediation is smaller when compared to the
direct influence of product attributes on customer’s loyalty, due to a factor of discrepancy in the
attributes of products sold at Giant, because in terms of quality and brand are the same as
products sold in supermarket, so customers have recognized the product brand. This condition
which causes the attributes of products sold in Giant will directly provide loyalty without going
through customer’s satisfaction, this is due to customer-formed loyalty, more because giant has a
complete range of products sold so that Giant is considered the best choice for shopping which is
a reflection of customer’s loyalty.
The results of this study broaden the research conducted by Mital. et al. (1998) that poor
performance on product attributes has a negative effect on overall satisfaction and positive
performance on product attributes has a positive effect on the same attributes and overall
satisfaction shows a reduction in sensitivity at the level of attribute performance. The same
results are shown by Spreng et al. (1996), Bei and Chiao (2001) that there is an influence
between product attributes on customer’s satisfaction, while research conducted by Bloemer, et
al. (1998), Oloughlin and Coenders (2002) and Luarn and Lin (2003) show that customer’s
satisfaction influences customer’s loyalty.
Meanwhile, in relation to customer’s loyalty, Anderson et al (1994) stated that if a customer is
satisfied with the product or service provided, it will lead to customer’s loyalty so as to make
customers repurchase in the future, inhibiting competitors from attracting customers because
customers are reluctant to switch, reduce costs and subsequent transaction times, reduce the cost
of handling product / service discrepancies, reduce the cost of searching for new customers

International Journal of Economics, Business and Management Research
Vol. 2, No. 05; 2018
ISSN: 2456-7760
www.ijebmr.com Page 213
because customers will tend to inform other potential customers, because the company has
satisfying products and services, so the company's reputation also raised.
CONCLUSION
Lastly, the conclusion in this study is that customers will have a high level of loyalty to giant
hypermarkets if the products sold by hypermarkets have good quality in terms of completeness
of various products sold, such as household needs, food and including daily needs, textile,
fashion, furniture, so that completeness the product has provided a special place in the eyes of
consumers. In addition, the packaging uses packaging and its own brand at a cheaper price so
that it is attractive to customers. The role of customer’s satisfaction as mediation is smaller when
compared to the direct influence of product attributes on customer’s loyalty. This condition is
because in terms of quality and brand of products sold in hypermarkets are the same as products
sold in supermarket, so customers already recognize the product’s brand?
Managerial suggestions or implications are expresse such as the mediating role of customer’s
satisfaction in the influence of product attributes on customer’s loyalty of giant hypermarkets in
Malang City. The implication is that giant hypermarket management needs to pay attention to
customer’s satisfaction indicators, especially indicators related to the level of comfort, so as to
increase customer’s loyalty, choosing a variety of products for sale requires a convenience.
REFERENCES
Bennur, Shubhapriya dan Jin, Byoungho. 2009. From Apparel Product Attributes to Loyalty: A
Proposed Framework Using Kano’s Theory. International Textile and Apparel
Association, USA
Bloemer, J., Ko de Ruyter and Martin Wetzels.1998. Linking perceived service quality and
service loyalty: a multi-dimensional perspective. European Journal of Marketing.
Vol. 32, No. 5/6, 499-513.
Chen, H. Chu, Robert D. Green dan James Miller. 2008. Male And Female Influence On
Hypermarket Brand Equity. International Business & Economics Research Journal,
Volume 7, Number 9 .
Corsi, Maria, Armando dan Rungie, Cam. 2010. The Evolution of the Relationships between
Product Attributes in Determining Consumers behavioural Loyalty. Anzmac Journal.
Page 1-51
Dong-Mo Koo. 2003. Inter-relationships among Store Images, Store Satisfaction, and Store
Loyalty among Korea Discount Retail Patrons. Asia Pacific Journal of Marketing and
Logistics
Fornell, C Johnson, MD Anderson, EW Cha, and Bryant BE, 1996, The American Customer
Satisfaction Index: Nature, Purpose, and Findings, Journal of Marketing, Vol.60

International Journal of Economics, Business and Management Research
Vol. 2, No. 05; 2018
ISSN: 2456-7760
www.ijebmr.com Page 214
Foster, Brian D dan John W. Cadogan . 2000. Relationship Selling and Customer Loyalty : An
Empirical Investigation, Marketing Intelligence & Planning. Vol 18 No 4, p. 185-
199.
Garvin, D., 1987. Competing on the Eight Dimensions of Quality. Harvard Business Review,
November-December pp. 101-9
Griffin, J. 2002. Customer Loyalty: How To earn it, How To Keep it, Published by Jossey-Bass,
Inc., a John Willey&Sons, Inc. Company USA.
Gwin, Carol F. 2007. The Impact of Trust and Brand Relationship Quality on Perceived Value
and Loyalty in a Consumer Goods Environment. Pepperdine University, Marketing
Department Graziadio School of Business and Management
Kotler, P, dan Gary Armstrong, 2006. Principle of Marketing, 10th Edition/International Edition.
New Jersey; Prentice Hall.
Luarn, Pin & Hsin-Hiu Lin, 2003. A Customer Loyalty Model for E-Service Context, Journal of
electronic Commerce, Vol. 4, pp. 156-168.
Newman, Andrew J and Cullen, David, 2002, Retailing : Environment & Operations, Thomson
Learning.
Nezakati, H., Khim, C. S. &Asgari, O. 2011. Decision-Making Determinants in Working
Women’s Clothes Purchasing – Malaysia Evidence. International Journal of Trade,
Economics and Finance2(5):371-375.
Oloughlin, O. Christina dan Germa Coenders. 2002. Application of the European Customer
Satisfaction Index to Postal Services. Structural Equation Models versus Partial
Least Squares. Departament d’Economia, Universitat de Girona
Rahmat, H. 2009. Pengaruh Kualitas Layanan, Kualitas Produk dan Nilai Nasabah Terhadap
Kepuasan dan Loyalitas Nasabah Bank Mandiri. Jurnal Manajemen dan
Kewirausahaan, vol.11, no. 1,hal. 59-72
Rajaguru, Rajesh and Matanda. J, Margaret. 2010. Consumer Perception of Store and Product
Attributes and its Effect on Customer Loyalty within the Indian Retail Sector.
Australian and New Zealand Marketing Academy (ANZMAC), Brisbane Qld
Australia, pp. 1-8.
Reddy, N. R. V. Ramana and Azeem, B. Abdul. 2011. Influence of Store Satisfaction,
Merchandise Quality, and Service Quality on Store Loyalty. International Journal of
Trade, Economics and Finance, Vol. 2, No. 5
Simamora, Bilson. 2001. Remarketing For Business Recovery. Jakarta: PT. Gramedia Pustaka
Utama

International Journal of Economics, Business and Management Research
Vol. 2, No. 05; 2018
ISSN: 2456-7760
www.ijebmr.com Page 215
Sung Jin Yoo dan Young Jae Chang. 2005. An Exploratory Research on the Store Image
Attributes Affecting Its Store Loyalty. Seoul Journal of Business, Volume 11,
Number 1
Spraeng, Richard A., Mackenzie, Scott B., and Richard W. Olshavsky, 1996, A Re-examination
of the Determinants of Consumer Satisfaction, Journal of Marketing, Vol. 60, 15-32.
Tjiptono, F., 2008. Perspektif Manajemen dan Pemasaran Konterporer. Edisi 1, Yogyakarta:
Penerbit Andi.
Tse David K., dan Peter c. Wilton. 1988. Models of consumer satisfaction formation an
extension. Journal of marketing research. Vol 25, 204-212.
Trang T.M. Nguyen, Tho D. Nguyen and Nigel J. Barrett. 2007. Hedonic shopping motivations,
supermarket attributes, and shopper loyalty in transitional Markets Evidence from
Vietnam. Asia Pacific Journal of Marketing and Logistics, Vol. 19 No. 3, pp. 227-
239
V. Mital, Vikas, William T. Ross and Patrick M Baldasare, 1998, The Asymetric Impact of
Negative and Positive Attribute Level Performance on Overall Satisfaction and
Repurchase Intentions, Journal of Marketing, Vol. 62. p.33-47
Zeithaml, V.A.1988.Consumer Perceptions of price, quality and value: “A means-ends model
synthesis of evidence. Journal of the Academy Marketing Science. Vol. 21