customers’ perceptions of the marketing …eprints.utar.edu.my/452/1/ac-2011-0900141.pdf ·...
TRANSCRIPT
RMP14 - T5G1
CUSTOMERS’ PERCEPTIONS OF THE MARKETING
MIX AND THE EFFECT ON MALAYSIAN
HYPERMARKETS’ BRAND LOYALTY
BY
KHOO CHONG HENG
KUIT SUI YEONG
LEE CHOON SIONG
TAN YI SHI
YEE MEI KUAN
A research project submitted in partial fulfillment of the
requirement for the degree of
BACHELOR OF COMMERCE (HONS) ACCOUNTING
UNIVERSITI TUNKU ABDUL RAHMAN
FACULTY OF BUSINESS AND FINANCE
DEPARTMENT OF COMMERCE AND ACCOUNTANCY
DECEMBER 2011
CUSTOMERS’ PERCEPTIONS OF THE MARKETING
MIX AND THE EFFECT ON MALAYSIAN
HYPERMARKETS’ BRAND LOYALTY
KHOO CHONG HENG
KUIT SUI YEONG
LEE CHOON SIONG
TAN YI SHI
YEE MEI KUAN
BACHELOR OF COMMERCE (HONS) ACCOUNTING
UNIVERSITI TUNKU ABDUL RAHMAN
FACULTY OF BUSINESS AND FINANCE
DEPARTMENT OF COMMERCE AND
ACCOUNTANCY
DECEMBER 2011

RMP14 – T5G1
CUSTOMERS’ PERCEPTIONS OF THE MARKETING
MIX AND THE EFFECT ON MALAYSIAN
HYPERMARKETS’ BRAND LOYALTY
KHOO CHONG HENG
KUIT SUI YEONG
LEE CHOON SIONG
TAN YI SHI
YEE MEI KUAN
This research project is supervised by:
Ms. SHIRLEY LEE VOON HSIEN
LECTURER
FACULTY OF BUSINESS AND FINANCE
DEPARTMENT OF COMMERCE & ACCOUNTANCY

Customers’ Perceptions of the Marketing Mix and the effect on Malaysian Hypermarkets’ brand loyalty
ii
Copyright @ 2011
ALL RIGHTS RESERVED. No part of this paper may be reproduced, stored in a
retrieval system, or transmitted in any form or by any means, graphic, electronic,
mechanical, photocopying, recording, scanning, or otherwise, without the prior
consent of the authors.

Customers’ Perceptions of the Marketing Mix and the effect on Malaysian Hypermarkets’ brand loyalty
iii
DECLARATION
We hereby declare that:
(1) This undergraduate research project is the end result of our own work and that
due acknowledgement has been given in the references to ALL sources of
information be they printed, electronic, or personal.
(2) No portion of this research project has been submitted in support of any
application for any other degree or qualification of this or any other university, or
other institutes of learning.
(3) Equal contribution has been made by each group member in completing the
research project.
(4) The word count of this research report is 13,553.
Name of Student: Student ID: Signature:
1. KHOO CHONG HENG 09ABB01404 __________________
2. KUIT SUI YEONG 09ABB00211 __________________
3. LEE CHOON SIONG 09ABB01855 __________________
4. TAN YI SHI 09ABB01302 __________________
5. YEE MEI KUAN 09ABB00141 __________________
Date: 5th AUGUST 2011

Customers’ Perceptions of the Marketing Mix and the effect on Malaysian Hypermarkets’ brand loyalty
iv
ACKNOWLEDGEMENT
At the beginning, we, the researchers would like to take this opportunity to express
our gratitude to all the parties were helping us at the project time.
First and foremost, we would like to thank our beloved Universiti Tunku Abdul
Rahman for giving us the opportunity to conduct and learn from this project. By
conducting this project, we developed the valuable knowledge and skills that are
useful for our future life. Not at least for that, we able to build up cohesiveness among
team members and become more collaborative in doing complicated task in future.
By the way, we would also like to show gratitude to our pre-supervisor, Mr. Cheah
Chin Kim, who has been given a lot of reliable assistances and recommendations
throughout this project. Without his advice, we would not have sufficient time to
capture the right direction on the path.
Besides, we also want to express our grateful gratitude to our current supervisor as
well as coordinator, Ms. Shirley Lee Voon Hsien for paying significant patient on
teaching and advising us how to become better and ideal on this project. She also
willing to share her experiences on conducting research for ourselves is invaluable at
all.
In addition, we would like to thank to all the respondents who willing to spend their
own time for helping us to complete the data collection work.
Last but not least, we would like to express our gratitude to everyone who has been
with us along this journey. You all are awesome and thank you.

Customers’ Perceptions of the Marketing Mix and the effect on Malaysian Hypermarkets’ brand loyalty
v
DEDICATION
Dedicated to
Khoo, Kuit, Lee, Tan and Yee’s families
Dear researchers’ sweet families who are always give us fully support and strength
with no regret. Besides, their financial sponsors are the motivation to process this
study to be ended successfully.
Ms. Shirley Lee Voon Hsien
Dear supervisor who has been guided and leaded us to the right path in the process of
this study.
Respondents
To 250 respondents those are willing to spend their precious time for helping us to
complete questionnaires for this research study.

Customers’ Perceptions of the Marketing Mix and the effect on Malaysian Hypermarkets’ brand loyalty
vi
TABLE OF CONTENTS
Page
Copyright Page ………………………………………………………………………………. ii
Declaration ………………………………………………………………………………….. iii
Acknowledgement …………………………………………………………………………... iv
Dedication ………………………………………………………………………………….... v
Table of Contents ………………………………………………………………………….... vi
List of Tables ………………………………………………………………………………. x
List of Figures …………………………………………………………………………….... xi
List of Abbreviations ………………………………………………………………………. xii
List of Appendices ………………………………………………………………………… xiii
Preface …………………………………………………………………………………….. xiv
Abstract …………………………………………………………………………………..... xv
CHAPTER 1 INTRODUCTION ………………………………………........................... 1
1.1 Research Background ………………………………………….................. 1
1.2 Problem Statement ………………………………………………………... 3
1.3 Research Objectives ………………………………………………………. 4
1.3.1 General Objectives …………………………………................... 4
1.3.2 Specific Objectives ……………………………………………... 4
1.4 Research Questions ……………………………………………………….. 5
1.5 Hypotheses of the Study ………………………………………………….. 6
1.6 Significance of the Study …………………………………………………. 6
1.7 Chapter Layout …………………………………………………………… 7
1.7.1 Chapter One: Research Overview ………………………............ 7
1.7.2 Chapter Two: Literature Review ……………………………….. 7
1.7.3 Chapter Three: Methodology …………………………………… 7
1.7.4 Chapter Four: Data Analysis ……………………………………. 8
1.7.5 Chapter Five: Discussions, Conclusion and Implication ……….. 8
1.8 Conclusion ………………………………………………………………... 8
CHAPTER 2 LITERATURE REVIEW ………...………………………………………. 9
2.1 Review of the Literature …………………………………...……………... 9

Customers’ Perceptions of the Marketing Mix and the effect on Malaysian Hypermarkets’ brand loyalty
vii
2.1.1 Brand Loyalty ……………………………………………..……. 9
2.1.2 Price …........................................................................................ 10
2.1.3 Store Image ……………………………………………………. 11
2.1.4 Distribution Intensity ………………………………………...... 11
2.1.5 Advertising Spending ………………………………………….. 12
2.1.6 Price Promotion ……………………………………………...... 12
2.2 Review of Relevant Theoretical Model ……..…………………………... 13
2.2.1 Marketing Mix ………………………………………………… 13
2.3 Proposed Theoretical Framework ……………………………………….. 15
2.4 Hypotheses Development ……………………………………………….. 16
2.4.1 The Relationship between Price and Brand Loyalty ………….. 16
2.4.2 The Relationship between Store Image and Brand Loyalty …... 17
2.4.3 The Relationship between Distribution Intensity and Brand
Loyalty ………………………………………….……………. 18
2.4.4 The Relationship between Advertising Spending and Brand
Loyalty ………………………………………………………... 18
2.4.5 The Relationship between Price Promotion and Brand Loyalty. 19
2.5 Conclusion ………………………………………………………………. 20
CHAPTER 3 METHODOLOGY ……………………………………………………… 21
3.1 Research Design ………………………………………………………… 21
3.1.1 Quantitative Research ………………………………………… 21
3.1.2 Descriptive Research ……………………….…………………. 22
3.2 Data Collection Methods ……………………………………….……….. 23
3.2.1 Primary Data ………………………………………………….. 23
3.2.2 Secondary Data ……………………………………………….. 24
3.3 Sampling Design ………………………………………………………… 25
3.3.1 Target Population ……………………………………………… 25
3.3.2 Sampling Frame and Sampling Location ……………………… 25
3.3.3 Sampling Elements ……………………………………………. 25
3.3.4 Sampling Techniques …………………………………………. 26
3.3.5 Sampling Size …………………………………………………. 27
3.4 Research Instrument …………………………………………………….. 27
3.4.1 Questionnaires Design ………………………………………… 28

Customers’ Perceptions of the Marketing Mix and the effect on Malaysian Hypermarkets’ brand loyalty
viii
3.4.2 Pilot Test ………………………………………………………. 28
3.5 Constructs Measurement ………………………………………………… 29
3.5.1 Scale Measurement ……………………………………………. 29
3.6 Data Processing …………………………………………………………. 30
3.6.1 Questionnaire Checking ………………………………………. 30
3.6.2 Data Editing …………………………………………………… 31
3.6.3 Data Coding …………………………………………………… 31
3.6.4 Data Transcribing ……………………………………………… 32
3.6.5 Data Cleaning ………………………………………………….. 32
3.7 Data Analysis ……………………………………………………………. 32
3.7.1 Descriptive Analysis …………………………………………... 33
3.7.2 Reliability Test ………………………………………………… 33
3.7.3 Normality Test ………………………………………………… 34
3.7.4 Inferential Analysis ……………………………………………. 34
3.7.4.1 Pearson Correlation ………………………………… 34
3.7.4.2 Multiple Regressions ………………………………. 35
3.8 Conclusion ………………………………………………………………. 36
CHAPTER 4 DATA ANALYSIS ……………………………………………………… 37
4.1 Pilot Test ………………………………………………………………… 37
4.2 Descriptive Analysis …………………………………………………….. 38
4.2.1 Respondent Demographic Profile and General Information ….. 38
4.2.2 Central Tendencies Measurement of Constructs ……………… 41
4.3 Scale Measurement ……………………………………………………… 42
4.3.1 Internal Reliability Test ……………………………………….. 42
4.3.2 Normality Test ………………………………………………… 43
4.4 Inferential Analysis ……………………………………………………… 44
4.4.1 Pearson Correlation ……………………………………………. 44
4.4.2 Multiple Regression Analysis …………………………………. 45
4.4.2.1 Test of Significance ………………………………... 45
4.4.2.2 Nature of Relationship ……………………………... 47
4.4.2.3 Strength of Relationship …………………………… 47
4.5 Conclusion ………………………………………………………………. 48

Customers’ Perceptions of the Marketing Mix and the effect on Malaysian Hypermarkets’ brand loyalty
ix
CHAPTER 5 DISCUSSION, CONCLUSION AND IMPLICATIONS ………………. 49
5.1 Summary of Statistical Analysis ………………………………………… 49
5.1.1 Pilot Test ………………………………………………………. 49
5.1.2 Descriptive Analysis …………………………………………... 49
5.1.2.1 Respondents Demographic Profiles and General
Information ………………………………………... 49
5.1.3 Scale Measurement ……………………………………………. 50
5.1.3.1 Internal Reliability Test ……………………………. 50
5.1.3.2 Normality Test ……………………………………... 51
5.1.4 Inferential Analysis ……………………………………………. 51
5.1.4.1 Pearson Correlation ………………………………… 51
5.1.4.2 Multiple Regression Analysis ……………………… 51
5.2 Discussions of Major Findings ………………………………………….. 52
5.3 Implication of the study …………………………………………………. 54
5.3.1 Managerial implications ……………………………………….. 54
5.4 Limitation of the Study ………………………………………………….. 56
5.5 Recommendations for Future Research …………………………………. 58
5.6 Conclusion ………………………………………………………………. 58
References ………………………………………………………………………………….. 60
Appendices …………………………………………………………………………………. 66

Customers’ Perceptions of the Marketing Mix and the effect on Malaysian Hypermarkets’ brand loyalty
x
LIST OF TABLES
Page
Table 4.1: Tests of Normality (Pilot Test) 37
Table 4.2: Cronbach’s Alpha Reliability Test 38
Table 4.3: Respondents’ Demographic Profile and General Information 38
Table 4.4: Central Tendencies Measurement of Constructs 41
Table 4.5: Internal Reliability Analysis and Exploratory Factor Analysis 42
Table 4.6: Tests of Normality 43
Table 4.7: Correlation Matrix for BL 44
Table 4.8: Regression predicting Brand Loyalty 45
Table 5.1: Summary result of five hypotheses 52

Customers’ Perceptions of the Marketing Mix and the effect on Malaysian Hypermarkets’ brand loyalty
xi
LIST OF FIGURES
Pages
Figure 2.1: Four Ps of the Marketing Mix 14
Figure 2.2: Proposed Theoretical Framework 15

Customers’ Perceptions of the Marketing Mix and the effect on Malaysian Hypermarkets’ brand loyalty
xii
LIST OF ABBREVIATIONS
5IVs 5 Independent Variables
AS Advertising Spending
BL Brand Loyalty
DI Distribution Intensity
GDP Gross Domestic Product
KMO Kaiser-Meyer-Olkin
P P-value
PP Price Promotion
PR Price
SI Store Image
SPSS Statistical Package for Social Science

Customers’ Perceptions of the Marketing Mix and the effect on Malaysian Hypermarkets’ brand loyalty
xiii
LIST OF APPENDICES
Page
Appendix A: Numbers of Malaysian Hypermarkets 66
Appendix B: Pie Chart of Respondents’ Gender 66
Appendix C: Pie Chart of Respondents’ Age Group 67
Appendix D: Pie Chart of Respondents’ Marital Status 67
Appendix E: Pie Chart of Respondents’ Highest Education Level 68
Appendix F: Pie Chart of Respondents’ Occupation Level 68
Appendix G: Pie Chart of Respondents’ Monthly Income 69
Appendix H: Pie Chart of Respondents’ Frequency to shop in Hypermarket per Month 69
Appendix I: Pie Chart of Respondents’ Average Expenses 70
Appendix J: Central Tendencies Measurement of Constructs 70
Appendix K: Total Variance Explained 72
Appendix L: Normal P-P Plot of Standardized Residual 73
Appendix M: Histogram with Normal Distribution Curve of Brand Loyalty 74
Appendix N: Pearson Correlations between 5IVs and BL 75
Appendix O: Distributed Questionnaire 76
Appendix P: Summary of Past Empirical Studies 84
Appendix Q: Operations of the model variables 87
Appendix R: Permission Letter to conduct survey 89

Customers’ Perceptions of the Marketing Mix and the effect on Malaysian Hypermarkets’ brand loyalty
xiv
PREFACE
In essence, Bachelor of Commerce (Hons) Accounting lies the assessment of
Research Methodology and Project (RMP) or also known as the final year project that
required graduating students to do specific project in this final year.
Specifically, the topic that researchers had selected is customers’ perceptions of
marketing mix and the effect on Malaysian hypermarkets’ brand loyalty in which to
complete this study in a span of 28 weeks.
The term of marketing mix has been well discussed in overseas country whereas
Malaysia still lack of this kind of information in retailing. Therefore, it is very
significant to process this research in order to contribute to the retailing management
regarding their marketing strategic.
In the context of marketing is out of the accounting coverage, as curious students, we
should explore our knowledge in relation to learn more information other than
stipulated course structure. With respect of it, researchers would like to think out of
the box and process this study in accordance to explore their knowledge.
In order to understand the relationship between marketing mix and brand loyalty in
Malaysian hypermarkets, researchers had conducted questionnaires to customers
those shopped hypermarkets in Malaysia as well as reviewed past empirical studies
from other countries.

Customers’ Perceptions of the Marketing Mix and the effect on Malaysian Hypermarkets’ brand loyalty
xv
Abstract
In the past decades, Malaysian hypermarkets are increasing rapidly. Therefore, brand
loyalty has become a critical retailing topic. Meanwhile, plentiful studies are more
concern on the effects of marketing mix towards brand equity instead of brand loyalty.
By conducting this research study, the main goal is to identify which marketing mix
will affect brand loyalty in Malaysian hypermarkets in relation to contribute
hypermarkets’ management and future researchers in Malaysia. However, the
researchers are adapting the dissertation that done by Chen (2007) in relation to its
five independent variables (IVs) which are price, store image, advertising spending,
distribution intensity and price promotion as examining the relationship between five
IVs and Malaysian hypermarkets’ brand loyalty. As such, researchers adapted it by
reason of comparing the results between Malaysian and Taiwan hypermarkets.
Furthermore, researchers will distribute 250 questionnaire surveys to customers in
Malaysian hypermarkets. Lastly, this study is a descriptive and explanatory study by
using descriptive and inferential analysis.
Keywords: Marketing Mix, Malaysian Hypermarkets, Brand Loyalty.

Customers’ Perceptions of the Marketing Mix and the effect on Malaysian Hypermarkets’ brand loyalty
Page 1 of 89
CHAPTER 1: RESEARCH OVREVIEW
1.0 Introduction
This chapter provides an overview of the research project – “Customers’ Perceptions
of the Marketing Mix and the effect on Malaysian Hypermarkets’ brand loyalty.”
Initially, this chapter will begin with the research background, followed by the
problem statement as well as research objectives which are subdivided into general
objective and specific objectives. After that, development of research questions,
hypotheses and significance of the study will be further discussed. Then, chapter
layout will depict general descriptions on each chapter and a conclusion will be
followed.
1.1 Research Background
Malaysian retail environment has experienced a marked and continuous evolvement
over the decades. Chang and Tu (2005) indicated that the major source of competitive
advantage for retailers was to enhance and retain customer loyalty. Strategies
developed need to recognize customer loyalty as a complex and multifaceted
construct affecting customer choices and preference by understanding the role of
format in customer’s decision-making (Huddleston, Whipple & VanAuken, 2004).
Moreover, Yoo Donthu and Lee (2000) supposed that the price, store image,
distribution intensity, advertising spending and price promotion (as 5IVs) in
hypermarket would influence customer decision-making and brand loyalty.
Basically, hypermarket means “everything under the same roof” which combines
supermarkets and department stores with respect to wide floor space for the broadest
category of products linked to discount price policy of self-service and networking
techniques based on sales promotion methods and effective merchandising, and large
parking space (Perrigot & Cliquet, 2006). Furthermore, researchers define Malaysian

Customers’ Perceptions of the Marketing Mix and the effect on Malaysian Hypermarkets’ brand loyalty
Page 2 of 89
hypermarkets as those hypermarkets located in Malaysia regardless foreign or local
hypermarkets. The representations of Malaysian hypermarkets in this study are local
hypermarket which is Mydin and foreign hypermarkets in Malaysia which include
Tesco, Giant, and Carrefour. In essence, customers are defined as the people who are
willing to purchase grocery in hypermarkets.
In order to reflect the situation of hypermarkets in Asia, researchers tend to describe
the trends of hypermarkets in Thailand and Korea. Residents in Thailand and Korea
have spent money in hypermarkets with the highest percentage of 64% and 58%
respectively as compared with other retail industries (“Retail and Shopper Trends
Asia Pacific,” 2010). Meanwhile, Malaysian has spent 37% the most money in
hypermarkets as compared with other supermarkets, convenience stores and personal
cares stores (“Retail and Shopper Trends Asia Pacific,” 2010). Hence, Malaysian
hypermarkets are also quite similar with this described situation.
Main changes in customer purchasing behavior have been contributed by the strong
economic growth in the late 80’s and early 90’s (“Malaysia Exporter Guide Annual,”
2010). The number of hypermarkets increased immensely from only one in 1995 to
thirty in 2003 in Malaysia (Moreira, 2003). After the recession peaked in 2008 and
2009, retailing has enjoyed the healthy growth as purchasing power of shoppers was
increasing when economic recovered in 2010 (“Retailing in Malaysia,” 2011).
Likewise, GDP for 2010 was forecasted to grow at 7% in Malaysia (“Malaysia
Exporter Guide Annual,” 2010). The hypermarkets in Malaysia have dramatically
increased from 79 to 91 outlets between 2009 and 2010 (“Retail and Shopper Trends
Asia Pacific,” 2010).
In 2010, Malaysia had a population of around 27.5 million which is one of the most
developed countries in Southeast Asia (“Preliminary Count Report,” 2010).
Malaysian hypermarkets recently became the dominant format in city as 45% to 60%
of household customers selected hypermarkets as their main outlets (“Malaysia
Exporter Guide Annual,” 2010). Hence, there is a potential increase in numbers of
hypermarkets throughout Malaysia due to the significant population of household
customers who are brand conscious and demanding greater variety and quality of
Customers’ Perceptions of the Marketing Mix and the effect on Malaysian Hypermarkets’ brand loyalty
Page 3 of 89
products. Expansion plans for Malaysian hypermarkets and customers who spend
cautiously will increase the challenges and uncertainties in the economic environment.
Therefore, the critical strategy for Malaysian hypermarkets is to investigate and focus
the 5IVs in marketing mix that can influence customer choices (Pappu & Quester,
2006). Besides, it was critical to develop retail strategies to manage customer loyalty,
patronage and switching behavior (Knox & Denison, 2000). Furthermore, level of
service, pricing policy, and product assortment and customer demographic profile are
the major factors to distinguish hypermarkets from another.
According to Yoo and Donthu (2001), customer-based brand equity (constituted by
brand loyalty, brand association, perceived quality, and brand awareness) was a
measurement of perception and behavioural brand equity towards individual customer.
Moreover, Yoo and Donthu (2001) defined brand loyalty as tendency to be loyal
towards a particular brand and it is demonstrated by the purchase intention as the first
choice. In this research, researchers tend to focus mainly on brand loyalty on
Malaysian hypermarkets due to brand loyalty has an overall effect related to brand
equity.
1.2 Problem Statement
Recently, the rivalry in the retail industry has increased due to the number of
Malaysian hypermarkets increased rapidly. Hence, Malaysian hypermarkets’
management tends to look an approach that can help them to keep and expand market
share in these competitive industry. Although Malaysian hypermarkets realize that
marketing mix will affect customers’ brand loyalty, they do not know which element
of marketing mix has the most significant influence towards brand loyalty.
In the past decade, majority of the studies tended to test whether stipulated elements
of marketing mix were correlated positively with the brand equity. Although brand
loyalty is one of the brand equity’s dimensions, there is lack of evidence to prove that
marketing mix is affecting directly to the brand loyalty. The studies such as Yoo, et al.
(2000), Rajh (2005), Yang and Liao (2004) evaluated the surface of the brand loyalty

Customers’ Perceptions of the Marketing Mix and the effect on Malaysian Hypermarkets’ brand loyalty
Page 4 of 89
only rather than investigating deeply on brand loyalty. Therefore, Malaysian
hypermarkets are lack of information about which marketing mix’s element will
significantly influence the brand loyalty as well as there is no comparison on findings
between overseas country and Malaysia which can be adapted for suiting Malaysia
and thus Malaysian hypermarkets are unable to implement the effective marketing
strategy.
1.3 Research Objectives
The research objectives in this study can be categorized into general objective and
specific objective.
1.3.1 General Objectives
This section primarily describes the purpose of the research. In this research
study, the general objective is:
To identify the marketing mix that influencing customers perceptions toward
Malaysian hypermarkets’ brand loyalty.
1.3.2 Specific Objectives
On the other hand, the specific objectives in this study are created as below:
To examine the relationship of price towards Malaysian hypermarkets’ brand
loyalty.
To examine the relationship of store image towards Malaysian hypermarkets’
brand loyalty.
To examine the relationship of distribution intensity towards Malaysian
hypermarkets’ brand loyalty.

Customers’ Perceptions of the Marketing Mix and the effect on Malaysian Hypermarkets’ brand loyalty
Page 5 of 89
To examine the relationship of advertising spending towards Malaysian
hypermarkets’ brand loyalty.
To examine the relationship of price promotion towards Malaysian
hypermarkets’ brand loyalty.
To compare results between Taiwan and Malaysian customers’ perceptions
of the marketing mix and the effect on hypermarkets’ brand loyalty.
1.4 Research Questions
More specifically, this study is conducted to ravel out the following questions:
What are the marketing mixes that influencing customers perceptions towards
Malaysian hypermarkets’ brand loyalty?
Is there any relationship between price and Malaysian hypermarkets’ brand
loyalty?
Is there any relationship between store image and Malaysian hypermarkets’
brand loyalty?
Is there any relationship between distribution intensity and Malaysian
hypermarkets’ brand loyalty?
Is there any relationship between advertising spending and Malaysian
hypermarkets’ brand loyalty?
Is there any relationship between price promotion and Malaysian
hypermarkets’ brand loyalty?

Customers’ Perceptions of the Marketing Mix and the effect on Malaysian Hypermarkets’ brand loyalty
Page 6 of 89
Is there any difference in results between Taiwan and Malaysian customers’
perceptions of the marketing mix and the effect on hypermarkets’ brand
loyalty?
1.5 Hypotheses of the Study
The hypotheses of the study are developed as below:
H1: There is a significant positive influence of prices towards Malaysian
hypermarkets’ brand loyalty.
H2: There is a significant positive influence of store image towards Malaysian
hypermarkets’ brand loyalty.
H3: There is a significant positive influence of distribution intensity towards
Malaysian hypermarkets’ brand loyalty.
H4: There is a significant positive influence of advertising spending towards
Malaysian hypermarkets’ brand loyalty.
H5: There is a significant positive influence of price promotion towards Malaysian
hypermarkets’ brand loyalty.
1.6 Significance of the Study
In short, this study will contribute to the hypermarkets’ management and future
researchers in Malaysia. For Malaysian hypermarkets’ management, this research can
assist them in identifying their service quality, marketing performance, customer
satisfaction and brand loyalty. Besides, it can also diagnose the areas of marketing
strategy that require improvements. Thus, this research can be used as a reference to
management in allocating resources efficiently and avoid unnecessary investment.

Customers’ Perceptions of the Marketing Mix and the effect on Malaysian Hypermarkets’ brand loyalty
Page 7 of 89
Furthermore, for the future researchers, this research can also be used as supporting
material for guiding them in conducting research in term of service quality, marketing
management and brand loyalty in Malaysia. Therefore, this study focuses on the
specific application of brand loyalty which provides a substantial contribution to
future research.
1.7 Chapter Layout
1.7.1 Chapter One: Research Overview
This chapter is the introductory which provides an overview of the study
context and explanations on the research problem. It covers introduction,
research background, problem statement, research objectives which consist of
the general objective and specific objective, research questions, hypotheses and
significant of study to the application of management theory and practice.
1.7.2 Chapter Two: Literature Review
The purpose of this chapter includes the literature review about the context will
be discussed. On the other hand, the review of relevant theoretical model and
conceptual framework will be proposed for the further study. Besides, relevant
hypotheses will be developed.
1.7.3 Chapter Three: Methodology
In chapter three, it will explain the methodology of the research where the
research design will be specified. It consists of six elements of the whole study
which are data collection methods, sampling design, research instrument,
construct measurement, data processing and lastly data analysis.

Customers’ Perceptions of the Marketing Mix and the effect on Malaysian Hypermarkets’ brand loyalty
Page 8 of 89
1.7.4 Chapter Four: Data Analysis
This chapter is description of data analysis. It also presents some patterns and
analysis of the results which are relevant to the research questions and
hypotheses. There will be descriptive analysis that further discusses the
respondent demographic profile and central tendencies measurement of
constructs. Besides, inferential analyses are included as it is important for
examining the individual variables and its relationships with other variables.
Lastly, conclusion of this chapter will be provided as the linkage for next
chapter.
1.7.5 Chapter Five: Discussions, Conclusion and Implication
This chapter provides the justification for results and explanations for each
variable. It encompasses the summary of the statistical analyses, discussion of
major findings and implications of the study. Thus, it also provides the
limitations of the study and recommendations for further research.
1.8 Conclusion
All the dimensions of chapter one stated above are the overview of this study.
Meanwhile, it provides the preliminary understanding on how researchers will
conduct research study. Therefore, chapter one will be referenced as foundation for
further exploration in this study which will be conducted in chapter two and so on.

Customers’ Perceptions of the Marketing Mix and the effect on Malaysian Hypermarkets’ brand loyalty
Page 9 of 89
CHAPTER 2: LITERATURE REVIEW
2.1 Review of the Literature
2.1.1 Brand Loyalty
In these times, companies’ most meritorious assets are their brands which
adding both economic and strategic value to its proprietors. Thus, enhancing
brand loyalty has become a core of marketing theory to establish sustainable
competitive advantage. The study of Silberhorn (2010) cited many studies and
publications in marketing research which were dedicated to the brand loyalty
concept such as past studies of Chaudhuri and Holbrook (2001).
Oliver and Rust (1997) developed a conceptual framework of brand loyalty that
revealed the overall range of brand loyalty is based on a hierarchal effect model
with respect to affective, behavioral intention, cognitive and action dimensions.
Furthermore, in year 1999, Oliver gave a definition of brand loyalty as “a
deeply held commitment to rebuy or repatronize a preferred product or service
consistently in the future, thereby causing repetitive same-brand or same brand-
set purchasing, despite situational influences and marketing efforts are having
the potential to cause switching behavior”. As such, it reveals that the changes
in marketing environments or strategies will influence the purchasing behavior
of a customer, but customer’s loyalty will still remain constantly and they will
still repeatedly purchase their favorite brands in the future.
However, brand loyalty can also be defined as the final destination of brand
management in a company with respect to test the weakness or strength of its
customers’ loyalty and it could check whether customers still favor its product
which compare to competitors (Aaker, 1996).

Customers’ Perceptions of the Marketing Mix and the effect on Malaysian Hypermarkets’ brand loyalty
Page 10 of 89
Furthermore, Silberhorn (2010) indicated that the majority studies on brand
loyalty were limited to single-category perspective. Nevertheless, there was an
enormous amount of literatures which are on the cross-category relationships in
customers’ decision-making by using multi-category market basket models such
as past studies of Song and Chintagunta (2007) and Niraj, Padmanabhan and
Seetharaman, (2008).
On the other hand, Jacoby and Chestnut (1978) reflected that the construction of
brand loyalty could be divided into attitudinal and behavioral dimensions.
Attitudinal loyalty was defined as intention to repurchase the brand (Mellens,
Dekimpe & Steenkamp, 1996). In contrast, behavioral loyalty was defined as
actual and observable repurchase behaviors (East & Hammond, 1996). Gounaris
and Stathakopoulos (2004) indicated that an increase in behavioral loyalty was
caused by attitudinal loyalty.
Lastly, Tseng, Liao and Jan (2004) had highlighted that purchase a certain
specific product occasionally did not make sense with brand loyalty due to the
convenient factor or a variety of behavior. Since brand loyalty cannot be simply
determined by customers’ repurchasing frequency, it is not sufficient enough or
reasonable to evaluate brand loyalty solely depending on customer purchase
behavior.
2.1.2 Price
The definition of price was “an important extrinsic cue and indicator of product
quality or benefits” (Yoo et al., 2000). Moreover, price could also be classified
as “the only element in the marketing mix that produces revenue; the other
elements produce costs” (Kotler, 2003). In the marketing mix model, companies
adjust price and reduce expenses in order to gain expected profits.
Generally, different retailers are using different price strategies for achieving
their respective goals. Price also implies the cost of product or service usually

Customers’ Perceptions of the Marketing Mix and the effect on Malaysian Hypermarkets’ brand loyalty
Page 11 of 89
express in the monetary term. Nevertheless, regarding what type of product or
service sell, suddenly changes of the price will have a direct effect to the
customers or clients and profitability of the business.
2.1.3 Store Image
Pan and Zinkhan (2006) defined store image as the method in which store was
perceived in customer’s mind. It will influence customers’ decision as where
should they shop. Companies’ images formed by stakeholders were based on
products, brands organizations and chains of organizations (Lemmink, Schuijf
& Streukens, 2003). Store image was defined as the sum of customers’
perceptions towards the stores through his/her experience with the store
(Bloemer & Odekerken-Schroder, 2002). Knox and Denison (2000) highlighted
managing customers’ brand loyalty and preventing customer from switching
stores was significant for corporate to develop retail strategy. As such, the
acknowledged store image acts as a competitive advantage for Malaysian
hypermarkets. Therefore, researchers define store image as customers’ thinking
in their mind towards different attributes of primarily marketing mix
implemented by Malaysian hypermarkets.
2.1.4 Distribution Intensity
Generally, when products are available numerous stores to cover the market can
be defined as distribution intensity. However, it has been argued that certain
varieties of distributions fit certain categories of products. For instance, in order
to enhance the products’ images and gain substantial retailer support, firms tend
to distribute exclusively or selectively rather than distribute intensively to its
products.
Furthermore, the concept of distribution intensity has been primarily invoked by
Copeland (1923). He linked the product class (convenience goods, shopping

Customers’ Perceptions of the Marketing Mix and the effect on Malaysian Hypermarkets’ brand loyalty
Page 12 of 89
goods and specialty goods) to required density of distribution. Accordingly,
analysts tend to assume that convenience goods like grocery goods are likely to
be distributed intensively which are on the basis of the underlying features of
the product. If the distribution intensity could be successfully implemented, the
customers could buy a brand through many of the possible outlets in a trading
area (Coughlan, Anderson, Stern & El-Ansary, 2001).
2.1.5 Advertising Spending
Moorthy and Zhao (2000) highlighted that the characteristics of advertising
spending were signal and informational devices to customers. Thus, advertising
is a media that delivering information to the customers. Barone, Taylor, and
Urbany (2005) also stated that most of the advertising spending is aimed to
introduce new products or services. As such, advertising allows customers to be
aware of new products or services while providing information related to the
new products or services. Meanwhile, customers will judge whether the
products or services are suitable for them before they decide to purchase them.
Besides, advertising spending and the perceive quality were positively related
(Moorthy & Zhao, 2000; Aaker & Jacobson, 1994). Therefore, it implies that
the quality of the products or services is high if a company allocates large
amount of advertising spending. However, the effect of advertising towards
customers should be concerned seriously. Consequently, company must design
carefully on their advertising as the messages delivered may provoke different
target customers (Angel & Manuel, 2005).
2.1.6 Price Promotion
Price promotion which was defined as the “short-term price reductions” was
believed to harm brand equity when offered over in long-term time (Yoo et al.,
2000). Hence, the price promotion period is normally short-term compared to

Customers’ Perceptions of the Marketing Mix and the effect on Malaysian Hypermarkets’ brand loyalty
Page 13 of 89
other marketing mix elements such as product, price, and place. However, the
effects from price promotion mainly hail from brand switching, incidental
purchase and storage (Van Heerde, Gupta & Wittink, 2003).
Withal, most of the effect of a price promotion was seen in customers’ short-
term brand choices and it increased the price sensitivity of non-loyal customers
(Mela, Gupta & Lehman, 1997).
2.2 Review of Relevant Theoretical Models
2.2.1 Marketing Mix
The model of marketing mix was initially developed by McCarthy (1960) and
he defined the traditional marketing mix by the “four Ps” which are product,
price, place and promotion.
“The developing of a marketing mix must be an integral part of selecting a
target market” has been stated by McCarthy (1971). Thus, all ingredients of
variables must be set timely in accordance to coordinate with marketing strategy
for making the strategy successful. There are involved numerous of variables
such as brand, service, advertising, product, prices, package, media, salesman
and intensity of sales that can be varied or altered. Moreover, McCarthy (1971)
had mentioned that the four major elements of marketing mix were the “four Ps”
and all of the four Ps were equally important to the marketing mix.
Furthermore, Armstrong and Kotler (2005) recently stated that marketing mix
was the set of controllable and tactical marketing approach that firm tended to
produce the demanded response in the target market, which consists of “four Ps”
into four groups of variables; they are product, price, place and promotion.

Customers’ Perceptions of the Marketing Mix and the effect on Malaysian Hypermarkets’ brand loyalty
Page 14 of 89
Figure 2.1: Four Ps of the Marketing Mix
Source: Armstrong and Kotler (2005), Marketing: An introduction (7th ed.). New
Jersey: Pearson Prentice Hall.
Product
Varity
Design
Features
Brand name
Quality
Promotion
Advertising
Personal selling
Sales promotion
Public relation
Place
Channels
Coverage
Assortments
Locations
Inventory
Price
List price
Discount
Allowances
Payment period
Credit terms
Target
Customers
Customers’ Perceptions of the Marketing Mix and the effect on Malaysian Hypermarkets’ brand loyalty
Page 15 of 89
However, based on the study adapted by researchers, it had adopted the 5IVs
from the traditional “four Ps” as a representatives set of marketing programs
(Yoo et al., 2000). Researchers would like to further adapt the same 5IVs for
investigating the Malaysian hypermarket’ brand loyalty.
In order to guide managers in building and maintaining the brand equity of a
brand name and the intensity of influence of individual marketing mix elements
on brand equity, Yoo et al. (2000) gave the importance that brand equity had for
companies operating under contemporary conditions and it seems fully justified
to explore how as well as with what intensity individual marketing mix
elements impact brand equity. As such, the importance of brand equity consists
of numerous benefits for companies that own brands and brand equity are
positively associated with brand loyalty.
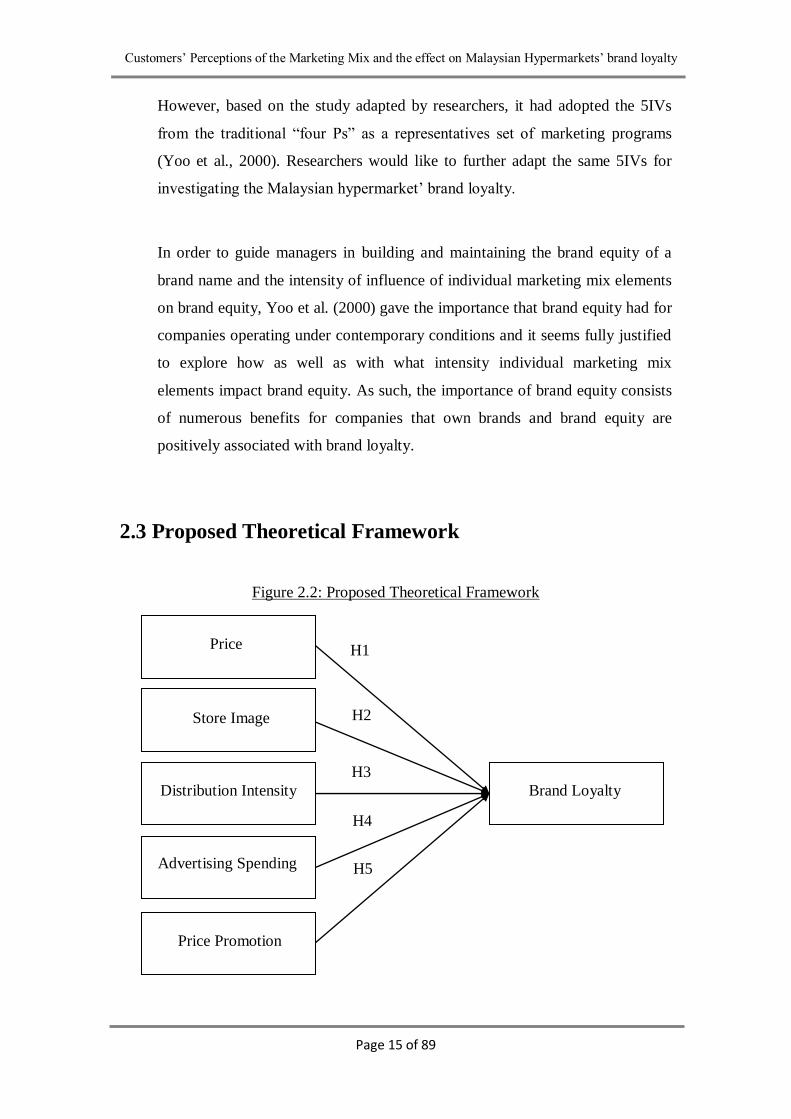
2.3 Proposed Theoretical Framework
Figure 2.2: Proposed Theoretical Framework
Price
Price Promotion
Store Image
Distribution Intensity
Advertising Spending
Brand Loyalty
H1
H2
H3
H4
H5

Customers’ Perceptions of the Marketing Mix and the effect on Malaysian Hypermarkets’ brand loyalty
Page 16 of 89
Adapted from: Chen, C. H. (2007). Customers’ Perceptions of the Marketing Mix and
the effect on Taiwan Hypermarkets’ Brand Loyalty. (Doctoral dissertation, Lynn
University, 2007). ProQuest Dissertations & Theses A&I, UMI 3274169.
The above diagrammatic drawing reveals the proposed conceptual framework of this
study is to identify the marketing mix that influencing customers perceptions towards
Malaysian hypermarkets’ brand loyalty and to examine how significant is each
independent marketing mix variables associated with Malaysian hypermarkets’ brand
loyalty.
As a glance on the research model, there are 5IVs which are price, storage image,
distribution intensity, advertising spending and price promotion. Besides, the
dependent variable which is the brand loyalty depends on the independent variables in
relation to examine the relationship among 5IVs.
Meanwhile, the proposed conceptual framework is also considered as hypothesis
model of the effects of 5IVs on brand loyalty. The hypothesis model embodies five
hypotheses to be tested for investigating the relationship between independent and
dependent variables. Whereby, each of the hypotheses will be further discussed in
detail on the hypothesis development.
2.4 Hypotheses Development
2.4.1 The Relationship between Price and Brand Loyalty
Wong and Sidek (2008) indicated that price and brand loyalty had a positive
relationship. Besides, Sirohi, McLaughlin and Wittink (1998) indicated that
price had directly correlated to loyalty.
Neither loyal nor disloyal customers were using the price as an evaluative
criterion of the product, actually they would not be influenced by the price

Customers’ Perceptions of the Marketing Mix and the effect on Malaysian Hypermarkets’ brand loyalty
Page 17 of 89
consideration (Meer, 1995). Generally, loyal customers are more willing to pay
the full price or premium price for their favourite brand cause brand loyal
customers are less influenced by price sensitive compared with brand disloyal
customers (Jackson, 2010). Thus, the changes of price level do not affect the
brand loyalty and it shows an indirect relationship between price and brand
loyalty.
In addition, based on the adapted study, it was a dissertation from Lynn
University in Taiwan by Chen (2007) which conducted questionnaire survey of
500 customers regarding their customers’ perceptions of the marketing mix
towards Taiwan hypermarkets’ brand loyalty. Meanwhile, Chen used multiple
regression analysis for computing its findings. One of its findings showed that
the price had an equivalent and negative effect on brand loyalty.
2.4.2 The Relationship between Store Image and Brand Loyalty
Nguyen and Leblanc (2001) indicated that the strongly favourableness of
perceptions of both corporate reputation and image would tend to increase the
degree of customer loyalty. Furthermore, the trust and satisfaction that
interwoven tightly with the traditional constructs such as image could
substantially contribute to loyalty (Orth & Green, 2009).
Nevertheless, Sivadas and Baker-Prewitt (2000) supposed that there was direct
relationship between store image and store satisfaction rather than store loyalty.
Store image affected store loyalty via store satisfaction (Gupta & Pirsch, 2008).
On the contrary, Koo (2003) found that abstract and global image component
had a more significant influence on loyalty than satisfaction. Additionally,
based on the adapted study, one of its findings showed that store image was an
equivalent and positive effect on brand loyalty (Chen, 2007).

Customers’ Perceptions of the Marketing Mix and the effect on Malaysian Hypermarkets’ brand loyalty
Page 18 of 89
2.4.3 The Relationship between Distribution Intensity and
Brand Loyalty
Distribution intensity jointly influenced the level of inter and intra brand
competition in a customer product industry (Cadeaux, 1992). If distribution
intensity has been successfully implemented, customers would be able to buy a
brand through many of the possible outlets in a trading area (Coughlan et al.,
2001)
In the customers’ perceptions, customers would be more satisfied by reason of
the product was available in a greater number of stores and they would be
offered the product as where and when they want it (Ferris, Oliver & Kluyer,
1989; Smith, 1992). Thus, intensive distribution can reduce the time of
customers like inherent spending on searching the stores and travelling to and
from the stores. Besides, intensive distribution also provides a convenience in
purchasing products and makes it easier to get services which are related to the
products.
As a result of increment on distribution intensity, customers will have more time
and place utility and perceive more value for the product. With respect of it,
such increased value will lead to greater customers’ satisfaction and perceived
quality. Consequently, greater brand loyalty would be developed along with
customers’ satisfactions with the product (Yoo et al., 2000). Specifically, Chen
(2007) stated distribution intensity was an equivalent and positive effect on
brand loyalty.
2.4.4 The Relationship between Advertising Spending and
Brand Loyalty
The study of Cobb-Walgren, Ruble and Donthu (1995) found advertising
spending not only had positive effects on brand equity as a construct, yet also on

Customers’ Perceptions of the Marketing Mix and the effect on Malaysian Hypermarkets’ brand loyalty
Page 19 of 89
each of its brand equity components which were brand loyalty, brand awareness,
perceived quality and brand image.
Advertising acted as a pivotal role in raising the brand awareness and creating
strong brand associations (Yoo et al., 2000). It is high probability that a brand
will be included in the consideration set of customers if it has a repetitive
advertising schedule. Then, the customer’s brand choices have been simplified
as a habit to select the brand. Great amount of advertising helps to build the
brand awareness and relates to the positive association which will lead to
greater brand equity. With the extended hierarchy of effects model, advertising
had associated positively with brand loyalty as it reinforced the brand
associations and attitudes (Shimp, 1997).
Yang and Liao (2004) proposed advertising had significant affect in customers’
buying decision. Therefore, brand loyalty can be enhanced by increasing the
advertising which helped to acquire new customers and retain loyal customers.
Furthermore, one of its findings from the adapted study showed that advertising
spending was an equivalent and positive effect on brand loyalty (Chen, 2007).
2.4.5 The Relationship between Price Promotion and Brand
Loyalty
According to Gupta (1988), price promotion does not significantly affect brand
loyalty and it is only found to enhance temporary brand switching. This is
because customers are immediately attracted to promoted brand, and when deals
end, they lose interest in the brand. So, changes in brand loyalty may not incur
after price promotion unless the brand is perceived to better than its competing
brand.
In other words, Shih, Sun and Tang (2007) mentioned there was a significant
positive correlation between price promotions and brand loyalty. In contrary,

Customers’ Perceptions of the Marketing Mix and the effect on Malaysian Hypermarkets’ brand loyalty
Page 20 of 89
price promotions would decline customers’ brand loyalty to non-price-sensitive
brand companies (Wang, Li & Zhao, 2006). Moreover, price promotion was an
equivalent and positive effect on brand loyalty has been stated from the adapted
study (Chen, 2007).
2.5 Conclusion
Overall, reviews of past researchers’ literature were discussed in this chapter which
include 5IVs and brand loyalty. The findings of the past research studies have
significantly contributed the knowledge in brand loyalty and its antecedents.
Moreover, researchers used to construct a proposed conceptual framework in which
that assumes significant theoretical models and five hypotheses have been developed
on lastly.

Customers’ Perceptions of the Marketing Mix and the effect on Malaysian Hypermarkets’ brand loyalty
Page 21 of 89
CHAPTER 3: METHODOLOGY
3.0 Introduction
Researchers used research method to collect and analysis the data with respect to test
the hypotheses and answer the search questions about the relationship between 5IVs
and brand loyalty. In this chapter, its sections consist of research design, data
collection methods, sample design, research instrument, constructs measurement, data
processing and data analysis.
3.1 Research Design
Research design was defined as constitutes the blueprint for collection, measurement
and analysis of data (Cooper & Schindler, 2006). There are several types of research
design method commonly used which are exploratory, descriptive, and explanatory
studies. In essence, research details the procedures indispensable for obtaining the
information needed to structure and solve marketing research problems. A good
research design would ensure the marketing research project is carried through
effectively and efficiently (Malhotra, 2004). For this study, the researcher is analysing
on the unit of customers in Malaysian hypermarket. Meanwhile, this research is
considered as cross-sectional on account of concerned study on the relationship
between marketing mix and Malaysian hypermarket’s brand loyalty.
3.1.1 Quantitative Research
In this research study, quantitative research will be right conducted. It was
prominently used as a synonym for any data collection technique (such as
questionnaire) or data analysis procedure (such as graphs) that generated or used
numerical data (Mark, Philip & Adrian, 2009).

Customers’ Perceptions of the Marketing Mix and the effect on Malaysian Hypermarkets’ brand loyalty
Page 22 of 89
This method has been chosen purposely because quantifiable data is easier and
clearer to analyze independent variables toward brand loyalty and it is collected
by distributing questionnaire to target respondents. Furthermore, self-
administered questionnaire is the effective and preferred type of data collection
procedure for study which on a time-limit status while a large number of target
respondents is involved. Hence, the research is intended to use delivery and
collection questionnaire that deliver questionnaire by hand to each respondent
and collect back later. Meanwhile, our research cannot implement qualitative
research because qualitative data was more common presented in word as
opposed to numerically as in the case of quantitative research (Have, 2004).
3.1.2 Descriptive Research
On the other hand, other than quantitative research has been conducted in our
study, descriptive research is also used in this study and it was defined as for
which the purpose was to produce an accurate representation of persons, events
or situations (Mark, Philip & Adrian, 2009). Meanwhile, descriptive researches
are primarily concerned with finding out the kinds of “what is” question such as:
What are the marketing mixes that influencing customers perceptions toward
Malaysian hypermarkets’ brand loyalty? Is there any relationship between price
promotion and Malaysian hypermarkets’ brand loyalty?
In accordance with Borg and Gall (1989), descriptive studies were aimed at
finding out “what is” question. Hence, research questions in this research study
would be resulted by implementing descriptive studies. Therefore observational
and survey methods are frequently used to collect descriptive data. Since
questionnaire survey method is being employed for our study in order to collect
quantitative data for analysis, descriptive research is more suitable for our study.
At the same time, descriptive research was allowed to include multiple variables
for analysis (Borg & Gall, 1989). Our research study is going to implement
multiple variables analysis which is obviously matched with the principle of
descriptive research.

Customers’ Perceptions of the Marketing Mix and the effect on Malaysian Hypermarkets’ brand loyalty
Page 23 of 89
3.2 Data Collection Methods
The elementary sources for conducting the research study are primary and secondary
data. Researchers used both the primary and secondary data as the sources in order to
have sufficient and supportive information to be applied in our research study.
Researchers collected information from the respondents through questionnaires as the
sources of primary data. However, the secondary data is gathered through external
databases or online information databases to support this research study.
3.2.1 Primary Data
Primary data is the firsthand data that gather by the present researchers which
are specifically for a research project (Zikmund, 2003). According to Malhotra
(2004), the effort to obtain primary data is more expensive and time consuming
compare to others.
Primary data is observed and collected directly by researchers from firsthand
experience to address the research problem at hand. There are many methods to
collect the primary data. One of the methods is questionnaire. Questionnaire is
widely used by most of the researchers as it can effectively collect data. Besides,
questionnaire becomes a main tool to get opinions, attitudes and descriptions
from the respondents. Therefore, we choose questionnaire as our method to
collect the primary data as it can raise the reliability and the simplicity
information for our research study.
The questionnaires were distributed to 250 respondents in Kuala Lumpur,
Selangor and Perak. The reason that researchers had selected Kuala Lumpur,
Selangor and Perak is because of those state outlets obtained the first to third
highest percentage in Malaysia as referring to the Appendix A. Furthermore,
each respondent requires spending around ten minutes to complete the
questionnaire together with researchers’ monitor. All the questionnaires will be
collected back by the researchers because the researchers are responsible to

Customers’ Perceptions of the Marketing Mix and the effect on Malaysian Hypermarkets’ brand loyalty
Page 24 of 89
distribute and collect back the questionnaires after targeted respondents had
completed the questionnaire. This ascertains that researches can gather all the
questionnaires without lose any set of it.
3.2.2 Secondary Data
The characteristic of secondary data was a reference to assist researchers in
conduct their research study. Zikmund (2003) highlighted that secondary data
related to historical data. Secondary data are the information that gathered and
recorded by somebody for certain purposes. Although secondary data is cheaper
than primary data and can be obtained rapidly, it may be obsolete or not
accurately meet the researchers’ needs as the secondary data collected
previously might be for other purposes.
Researchers used secondary data at the starting point of our research by
reviewing the literature of similar genre. It may be beneficial to researchers as
secondary data contains the information that individuals cannot collect on their
own.
The secondary data for this research study was collected from external
databases or online information databases such as ProQuest, Emerald-insight,
Scopus, Science Direct, JSTOR and other supportive data provided by UTAR
website. Besides, researchers used internet search engines such as Google
Scholar and Yahoo to obtain more other related material in this research study.

Customers’ Perceptions of the Marketing Mix and the effect on Malaysian Hypermarkets’ brand loyalty
Page 25 of 89
3.3 Sampling Design
3.3.1 Target Population
Target population was the collection of objects and elements possess the
information which the present researchers will make inference (Malhotra, 2004).
Due to our research is focused on the study of brand loyalty in Malaysian
hypermarket, so that the target population is those customers in Malaysian
hypermarket.
3.3.2 Sampling Frame and Sampling Location
Sampling frame was defined as the list of elements which from the sample had
been drawn, is called working population (Zikmund, 2003). Using the sample
can become highly representative if all subjects participate and also become the
ideal, which can reduce the cost and time. However, our research study is using
non-probability techniques for selecting our sampling and thus we will not
indicate any sampling frame. Furthermore, primary data is being used in our
study. With respect of it, the questionnaires will be distributed at public areas
inside the Malaysian hypermarkets which are located in Kuala Lumpur,
Selangor and Perak.
3.3.3 Sampling Elements
Sampling elements means that group of individuals or a particular product are
participated in the research study (Hair & Ortinan, 2006). In this research, the
sampling elements are those target respondents were at least 18 years old who
were having the purchasing power in Malaysian hypermarket.

Customers’ Perceptions of the Marketing Mix and the effect on Malaysian Hypermarkets’ brand loyalty
Page 26 of 89
Generally, whoever over 18 years old in Malaysia has the right to work as part
or full times worker for earning money which shows they have ability to earn
money. Besides, whoever over 18 years old is the age of majority according to
Section 2 of the Age of Majority Act 1971 which he or she is having the
competent to contract. Therefore, whoever over 18 years old only be
considered as potential customers for Malaysian hypermarket provided they
have their own purchasing power without influence by others and are able to
trade legally. As such, the target respondents will be selected randomly for
conducting the survey during the weekday and weekend.
Furthermore, the researchers will ask customers whether they had filled the
questionnaire before in order to prevent the same customers being selected
twice. If the customer had completed questionnaire previously, then next
qualified customers will be selected.
3.3.4 Sampling Techniques
The sampling techniques can separate into two methods which are probability
sampling and non-probability sampling. Probability sampling which are
included simple random sampling, systematic sampling, stratified random
sampling, cluster sampling and multi-stage sampling. For non-probability
sampling is included quota sampling, purposive or judgmental sampling,
snowball sampling, self-selection sampling and convenience sampling. Non-
probability sampling is defined as “an arbitrary and subjective procedure where
each population elements does not have a known non-zero chance of being
included; no attempt is made to generate a statistically representative sample”
(Cooper & Schindler, 2006).
In this research, present researchers are using the non-probability sampling
which applied quota sampling. Non-probability sampling has been selected due
to this sampling technique is useful, quick and convenient as well as suitable for
this research that without sampling frame. Moreover, for the quota sampling is

Customers’ Perceptions of the Marketing Mix and the effect on Malaysian Hypermarkets’ brand loyalty
Page 27 of 89
based on the gender. Thus, the questionnaires will be distributed equally to the
male and female customers. The reason that researchers applied quota sampling
is its practices are less costly and can be set up very quickly. Since Malaysia
comprises population of 14 million males and 13 million females, researchers
would like to equally concern on the male and female customers (“Preliminary
Count Report,” 2010).
3.3.5 Sampling Size
Sampling size was defined as the number of elements to be included in the
study (Malhotra, 2005). Besides, Creswell (2005) stated that “the larger the
sample, the less the potential error that the sample will be different from the
population”. Thus, the bigger sampling size is more accurate in contrast to
smaller sampling size and adequate size of the sample can use to estimate
accurate actual population parameters and reduce the sampling error.
According to Green’s (1991), he estimated: n (sample size) = 50 + 8(m), which
“m” is the number of independent variables. In our research has fives
independent variables, there are price, store image, distribution intensity,
advertising spending and price promotion and thus m is equal to 5. So that, n =
50 + 8 (5) = 90, which means that our sampling size are at least 90 target
respondents. However, researchers will distribute 250 questionnaires in Kuala
Lumpur, Selangor and Perak.
3.4 Research Instrument
Questionnaire is efficient in collecting data after requirements and measurements for
the variables of interest are known. As such, Sekaran (2003) defined a questionnaire
was a pre-formulated written set of questions generally within closely defined
alternatives for respondents to record respondents’ answers. Generally, questionnaires
can be administered personally and it will be electronically or face to face distributed

Customers’ Perceptions of the Marketing Mix and the effect on Malaysian Hypermarkets’ brand loyalty
Page 28 of 89
to respondents. Moreover, pilot test has also been conducted to ensure that the
measurement scale and components in the questionnaire are properly designed and
understood by respondents.
3.4.1 Questionnaires Design
In this study, researchers had used self-administered questionnaire survey
method for distributing questionnaire to respondents. This method is able to
complete the questionnaires shortly and let researchers collected back
questionnaire easily. Ideally, it just requires lower cost in reaching large number
of respondents as well as clarification of question for the respondents’ doubts
can be done on the spot.
Besides, English and Mandarin are used in designing the questionnaires due to
both languages are widely used in Malaysia. In order to assist respondents make
fast decisions and standardized the questions with interest of reducing biases,
closed-ended questions has been used in constructing the questionnaires.
Therefore, researchers can code the information easily and data compilation
process becomes simpler.
3.4.2 Pilot Test
Pilot test was a small scale exploratory research technique by using sampling
without applies rigorous standards (Zikmund, 2003). Researchers have
distributed 25 questionnaires to the lecturers from Univerisiti Tunku Abdul
Rahman (UTAR) as respondents for testing the internal reliability and accuracy
of the questionnaires whether it is comprehensive and capable to implement the
real survey. Meanwhile, feedbacks are appreciated as a reference for improving
on the weaknesses which encountered if any.

Customers’ Perceptions of the Marketing Mix and the effect on Malaysian Hypermarkets’ brand loyalty
Page 29 of 89
3.5 Constructs Measurement
3.5.1 Scale Measurement
A scale can be defined as any series of items that are arranged progressively
according to magnitude or value in which an item can be placed in accordance
to its quantification (Zikmund, 2003). Besides, a scale is also represented as a
continuous spectrum or series of categories. Thus, it is a useful tool in designing
the questionnaire due to it helps to differentiate on how variables are different
from one another. In present researcher designed questionnaire, all the
statements in research were based on four common types of scale which are
nominal scale, ordinal scale, interval scale and ratio scale.
In this research project, there are three types of data measurement scales are
utilized which are nominal scale, ordinal scale and interval scale. Nominal scale
usually uses the numbers or letters assigned to object serve as labels or tags for
identification and classification. Moreover, it is the simplest type of
measurement scale and the classes are mutually exclusive and collectively
exhaustive. However, ordinal scale is a ranking scale in which numbers are
assigned to object for indicating the relative extent to which the object as
possess some characteristics.
Additionally, for interval scale, is defined as a scale that not only arranges
objects or alternatives according to their magnitudes but also distinguishes this
ordered arrangement in units of equal intervals. This type of scale is the best
used for opinion or attitude measurement. As such, the most suitable
measurement is Likert scale. Likert scale is defined as interval scale that
specifically uses five points of strongly disagrees, disagrees, neutral, agree and
strongly agree which started from number 1 to number 5. It is useful to denote a
degree of agreement or disagreement with each of a series of statement in
relation to the certain object.

Customers’ Perceptions of the Marketing Mix and the effect on Malaysian Hypermarkets’ brand loyalty
Page 30 of 89
Furthermore, our questionnaires are divided into three sections which are
Section A, Section B and Section C. Firstly, for Section A is demographic
profile. In this section, questions are designed by using nominal scale and
ordinal scale to collect demographic information about the target respondents’
profile such as gender, age, marital status, occupation and so on.
Secondly, Section B is Marketing Mix practice for Malaysian hypermarkets
which uses 5 point Likert scale to examine respondents’ agreement and
disagreement with questions related to five independent variables that influence
customer perception about selection of Malaysian hypermarket that contributing
in brand loyalty.
Lastly, questions of brand loyalty in the Malaysian hypermarkets are being
asked in the Section C with respect to examine how significant the associated
factors will influence the brand loyalty by using 5 point Likert scale.
3.6 Data Processing
Zikmund (2003) stated that data preparation process includes a series of actions which
consist of questionnaire checking, data editing, data coding, data transcribing and data
cleaning before rerunning data analysis. The raw data collected can be transformed
into useful information to solve the research problems as well as answer the research
questions.
3.6.1 Questionnaire Checking
Identifying on the problem and making correction are the main purpose of
checking. Thus, researchers had checked the questionnaire cautiously and
questionnaire has been gone through few times of moderation and amendment
before it was completed. The questionnaire needs to be moderated and approved
by the supervisor to ensure that the quality and appropriateness of the questions

Customers’ Perceptions of the Marketing Mix and the effect on Malaysian Hypermarkets’ brand loyalty
Page 31 of 89
asked before it can be given out to respondents. Moreover, some test runs of the
survey were conducted with respect to reduce the chance of error encountered
and understood by respondents.
3.6.2 Data Editing
In order to increase the accuracy and precision of the results collected from the
questionnaires, data editing has been carried out by researchers. So that, missing
data would be discarded since it is undesirable. Furthermore, poor or contrasting
response would be kept for review and checked for consistency. Obviously, the
accuracy of overall of the research had been increased.
3.6.3 Data Coding
Data coding has been done prior to distribution of questionnaire to respondents.
Data coding is used for assigning code to each of the answer options provided in
the questions and thus Statistical Package for Social Science (SPSS) program
can analyse the data effectively.
In the questionnaire, Section A is related to the demographic profile of
respondents. For example of question five, occupation level of executive is
coded as 1, professional is coded as 2, manager is coded as 3 and so forth.
Furthermore, Section B and Section C are inquiring the perceptions of
respondents regarding the statements developed with ranges of choices to be
selected for each question regarding 5IVs and brand loyalty respectively. It
reveals how strong is the respondents agree or disagree with each question
which is consisting of strongly disagree as coded as 1, disagree as coded as 2,
neutral as coded as 3, agree as coded as 4 and strongly agree as coded as 5.
Apparently, it shows a 5 point Likert scale of coding style.

Customers’ Perceptions of the Marketing Mix and the effect on Malaysian Hypermarkets’ brand loyalty
Page 32 of 89
3.6.4 Data Transcribing
After researchers distributed all questionnaires to respondents, all the coded data
from the collected questionnaires would be keyed into researchers’ personal
computer electronically as raw data for the analysis of SPSS.
3.6.5 Data Cleaning
SPSS program is a typical program that used for checking and identifying out of
range data. Logically will be those inconsistent or extreme data. Besides,
ambiguous answers will be considered as missing responses. Missing responses
will either be substituted a neutral value or discarded. As such, the purpose of
data cleaning is would like to enhance the consistency of value and settle the
missing response with stipulated solution.
3.7 Data Analysis
Data collected through questionnaires from target respondents were analysed by using
descriptive statistical analysis. SPSS program is capable to summarise data by
conducting statistical analysis, tables, percentages and frequency distributions. The
results were interpreted in forms of tables and graphs for clarification of data. Besides,
inferential statistics were also used to examine the relationship between variables. To
test the hypothesis developed by using SPSS in this research, 250 questionnaires will
be distributed to the target respondents. Furthermore, a pilot test will be conducted
prior to distribution of the questionnaires to the target respondents in order to ensure
the respondent understands the question meaning and effectiveness of data captured.

Customers’ Perceptions of the Marketing Mix and the effect on Malaysian Hypermarkets’ brand loyalty
Page 33 of 89
3.7.1 Descriptive Analysis
Descriptive analysis in terms of measuring mean, mode standard deviation and
ranges were used to describe the sample data by depicting representative
respondent and showing the common patterns of responses (Burns & Bush,
2006). In short, researchers can describe and detect the characteristics of
respondents. According to Zikmund (2003), descriptive analysis represented
the transforming of raw data into a form that enable researchers to understand
and interpret easier in terms of rearranging, ordering and manipulating data in
order to provide descriptive information. Calculating averages, frequency, range
and standard deviations are commonly used to summarize the data. The mean,
mode, frequency, range, standard deviation and variances were collected for the
interval scale of independent variables (price, store image, advertising,
promotions and distribution intensity) and dependent variable (brand loyalty).
Frequency distribution that is a mathematical distribution was used in this study
to calculate the number of responses related to different values of one variable
and present in percentage (Malhotra, 2005). Table of frequency counts,
percentages and cumulative percentages for all values related to the particular
variable are prepared.
3.7.2 Reliability Test
The reliability test is used to determine the measures are free from error and
thus results in consistency. Cronbach’s Alpha reliability test that varies from 0
to 1 is used to assess the reliability of data collected. Sekaran (2003) indicated
that acceptable and adequate level of reliability should have Cronbach’s alpha
of at minimum 0.6 or 0.7 and preferably closer to 0.9 which was considered
useful. Furthermore, this test is important as it acts as the minimum requirement
for validity. These variables in terms of price, store image, advertising spending,
price promotion, distribution intensity and brand loyalty are used to estimate the
reliability for the construct’s dimensions.
Customers’ Perceptions of the Marketing Mix and the effect on Malaysian Hypermarkets’ brand loyalty
Page 34 of 89
3.7.3 Normality Test
To test whether the input data is normally distributed, normality test will be
used. Due to the assumption that data comes from a normally distributed
population, it is required to perform normality test by some statistical tests such
as person correlation and multiple regressions. Otherwise, the results of the tests
will not be reliable if the assumptions are not valid. Kolmogorov-Smirnov and
Shapiro-Wilk Tests are used by the researchers to determine whether the set
scores in the sample follows a normal distribution. The data can be assumed to
be normally distributed only when the p-value in the Kolmogorov-Smirnov test
and Shapiro-Wilk Tests are more than 0.05.
3.7.4 Inferential Analysis
The inferential analysis is used to test whether the hypotheses are substantial.
3.7.4.1 Pearson Correlation
According to Malhotra and Peterson (2006), the Pearson’s Correlation analysis
is a statistical measure of the strength of association between the five
independent variables and one dependent variable. Hair, Black, Babin,
Anderson and Tatham (2006) signified the indication of coefficient (r) is
magnitude and direction of linear relationship of variables used in research. The
result of this test is a range of possible values from -1 to +1. The numbers
indicates the strength of the relationship between variables, while the sign (+ or
-) indicates the direction of relationship between variables. The correlation
coefficient range of +1.0 indicates perfect positive relationship, -1.0 indicates
perfect negative relationship while value of 0 indicates no significant
relationship. The researcher is using Pearson Correlation to test the significant
association between price and brand loyalty, store image and brand loyalty,

Customers’ Perceptions of the Marketing Mix and the effect on Malaysian Hypermarkets’ brand loyalty
Page 35 of 89
advertising spending and brand loyalty, price promotion and brand loyalty, and
distribution intensity and brand loyalty.
3.7.4.2 Multiple Regressions
Multiple regressions is a statistical techniques that used to analyze the linear
relationship between an individual dependent variable and two or more
independent variables by forecasting the coefficient of equation for the straight
line (Hair et al., 2006). According to Hair, Babin, Money and Samouel (2003),
the test would be significant when p-value is less than 0.05. The beta coefficient
allowed researchers to identify which independent variables was the most
influential towards the dependent variable (Hair et al., 2006). Hair et al., (2006)
supposed that the use of multiple regression analysis enabled to provide the
information such as statistical significance of each coefficient, nature of
relationship and strength of relationship.
The general equation of the multiple regressions is as follow:
Y = β0 + β1X1 + β2X2 + β3X3 + …. +βnXn
Therefore, the equation of multiple regressions that being used in this study as
follow: Brand Loyalty (BL) = β0+ β1*Price (PR) + β2*Store Image (SI) +
β3*Advertising Spending (AS) + β4*Price Promotion (PP) + β5*Distribution
Intensity (DI)
Since there are single metric dependent variable and multiple metrics of
independent variables, multiple regressions are used by the researcher to
determine the strength of relationships for overall model in terms of 5IVs and
brand loyalty.

Customers’ Perceptions of the Marketing Mix and the effect on Malaysian Hypermarkets’ brand loyalty
Page 36 of 89
3.8 Conclusion
Overall, researchers provide a summary of the methodology be related to this study
and the selected 250 of respondents in Kuala Lumpur, Selangor and Perak areas
whereby questionnaires were distributed. Furthermore, researchers also highlighted
SPSS program was used for data analysis. In next chapter, researchers will examine
the collected raw data from respondents deeply with respect to come out the result of
this study.

Customers’ Perceptions of the Marketing Mix and the effect on Malaysian Hypermarkets’ brand loyalty
Page 37 of 89
CHAPTER 4: DATA ANALYSIS
4.0 Introduction
In this chapter, the outcome of the questionnaire surveyed target respondents’ data
was analyzed. Before the actual survey for this study was implemented, a pilot test for
25 targeted respondents was executed in Universiti Tunku Abdul Rahman (UTAR).
Moreover, Statistical Package for Social Science (SPSS) version 16.0 was used to
conduct in-depth analysis of data collected in term of descriptive analysis, scale
measurement and inferential analysis.
4.1 Pilot Test
In order to reduce the deficiency of questionnaire that would be distributed to
respondents, researchers had conducted pilot test by distributing 25 questionnaires to
the lecturers in UTAR for collecting their comments. As a result, recommendation
and advice have been collected with respect to ensure the questionnaire is suitable for
this study.
Specifically, researchers had analyzed these 25 questionnaires through SPSS with the
confirmation of fulfilling the assumptions of normality and reliability.
Table 4.1: Tests of Normality
Kolmogorov-Smirnov Shapiro-Wilk
Statistic df Sig. Statistic df Sig.
Standardized Residual 0.158 25 0.107 0.920 25 0.51
Source: Developed for the research.

Customers’ Perceptions of the Marketing Mix and the effect on Malaysian Hypermarkets’ brand loyalty
Page 38 of 89
Table 4.2: Cronbach’s Alpha Reliability Test
Construct Alpha Coefficient Number of Items
Price 0.584 3
Store Image 0.734 4
Distribution Intensity 0.538 3
Advertising Spending 0.758 4
Price Promotion 0.882 3
Brand Loyalty 0.734 5
Source: Developed for the research.
As a glance on above tables, both show that pilot test have fulfilled the assumption of
normality test in which its p-value is 0.107(> 0.05) and all the alpha coefficients are
reasonable under the small size of samples.
4.2 Descriptive Analysis
The data of descriptive analysis and the sequence of data presentation refer to the
distributed questionnaire (Appendix O).
4.2.1 Respondent Demographic Profile and General Information
Table 4.3: Respondents’ Demographic Profile and General Information
Profile Categories Frequency Percentage
Gender Male 125 50.0
Female 125
250
50.0
Age Group 18-23 75 30.0
24-29 53 21.2
30-35 41 16.4
36-41 33 13.2
42-47 17 6.8
> 48 31
250
12.4
Marital Status Single 128 51.2
Married 122
250
48.8
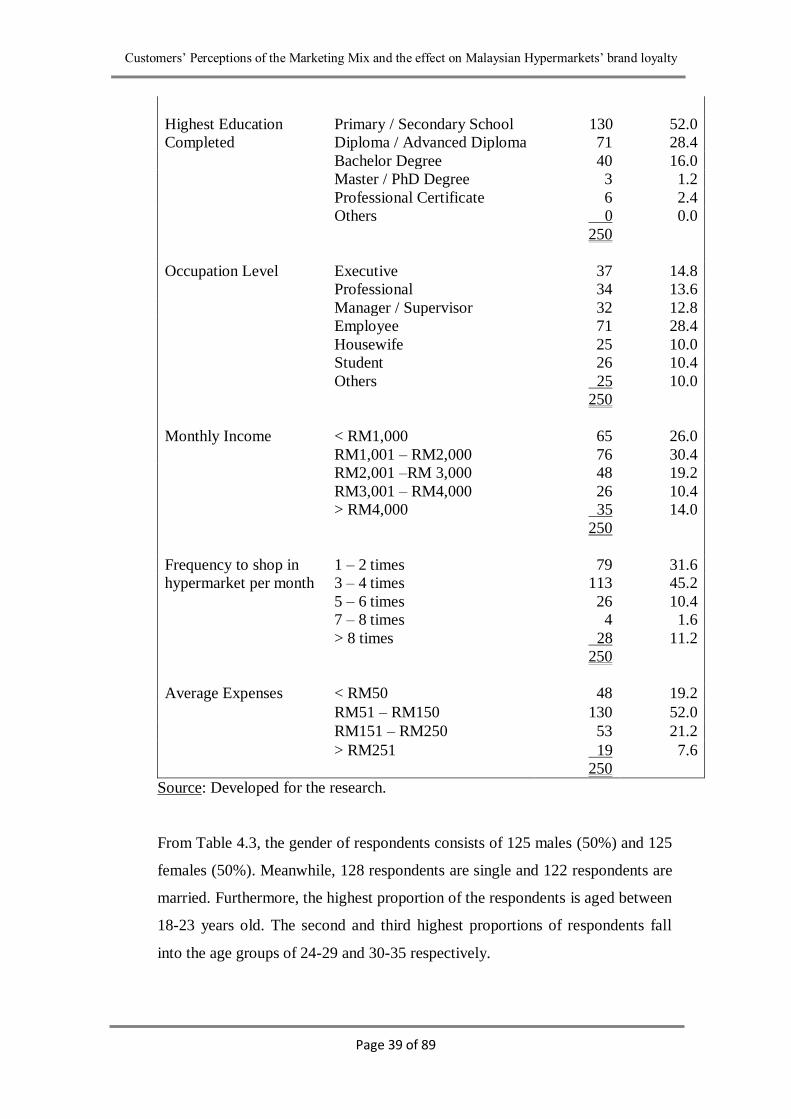
Customers’ Perceptions of the Marketing Mix and the effect on Malaysian Hypermarkets’ brand loyalty
Page 39 of 89
Highest Education
Completed
Primary / Secondary School 130 52.0
Diploma / Advanced Diploma 71 28.4
Bachelor Degree 40 16.0
Master / PhD Degree 3 1.2
Professional Certificate 6 2.4
Others 0
250
0.0
Occupation Level Executive 37 14.8
Professional 34 13.6
Manager / Supervisor 32 12.8
Employee 71 28.4
Housewife 25 10.0
Student 26 10.4
Others 25
250
10.0
Monthly Income < RM1,000 65 26.0
RM1,001 – RM2,000 76 30.4
RM2,001 –RM 3,000 48 19.2
RM3,001 – RM4,000 26 10.4
> RM4,000 35
250
14.0
Frequency to shop in
hypermarket per month
1 – 2 times 79 31.6
3 – 4 times 113 45.2
5 – 6 times 26 10.4
7 – 8 times 4 1.6
> 8 times 28
250
11.2
Average Expenses < RM50 48 19.2
RM51 – RM150 130 52.0
RM151 – RM250 53 21.2
> RM251 19
250
7.6
Source: Developed for the research.
From Table 4.3, the gender of respondents consists of 125 males (50%) and 125
females (50%). Meanwhile, 128 respondents are single and 122 respondents are
married. Furthermore, the highest proportion of the respondents is aged between
18-23 years old. The second and third highest proportions of respondents fall
into the age groups of 24-29 and 30-35 respectively.

Customers’ Perceptions of the Marketing Mix and the effect on Malaysian Hypermarkets’ brand loyalty
Page 40 of 89
Additionally, Table 4.3 also indicates that the majority of respondents of 52.0%
have completed the highest education of primary or secondary school. The
respondents who have Diploma or Advanced Diploma holders (28.4%) and
Bachelor Degree holders (16.0%) are the second and third highest proportions
for highest education completed. Lastly, the respondents who hold Master or
PhD degree and professional certificates are 1.2% and 2.4% respectively.
Moreover, the table reveals that the highest proportion of occupation level falls
to employee (28.4%). Subsequently, the proportions of occupation level are
followed by 14.8% of executive, 13.6% of professional and 12.8% of managers
or supervisor. The remaining of 30% of respondents is approximately dispersed
into housewife (10.0%), student (10.4%) and other occupation (10.0%).
Besides, the monthly income of respondents is explored in Table 4.3. 30.4% of
the respondents have monthly income of RM1001-RM2000. Following by 26.0%
and 19.2% of the respondents who have monthly income of < RM1000 and
RM2001-RM3000 respectively. Lastly, 10.4% of the respondents’ income level
is RM3001-RM4000.
Finally, majority of respondents had shopped hypermarkets for 3-4 times per
month. Afterward followed by 1-2 times, >8 times, 5-6 times and 7-8 times.
Besides, the highest proportion of respondents who spend RM51-RM150 for
each time in hypermarkets is 52.0%. Thereafter, 21.2%, 19.2% and 7.6% of
respondents spend average expenses of RM151-RM250, <RM50 and >RM251
respectively in hypermarkets.
The pie charts for demographic respondent profile and general information will
be showed from Appendix B to Appendix I.

Customers’ Perceptions of the Marketing Mix and the effect on Malaysian Hypermarkets’ brand loyalty
Page 41 of 89
4.2.2 Central Tendencies Measurement of Constructs
Table 4.4: Central Tendencies Measurement of Constructs
Variables Items Means Standard Deviations
Price PR1 3.1440 0.88453
Store Image SI1 3.1440 0.78340
SI2 3.7080 0.75433
SI3 3.6440 0.84861
Distribution Intensity DI1 3.7200 0.86056
DI2 3.8520 0.74317
DI3 3.6480 0.91622
Advertising Spending AS2 3.4520 0.85005
AS3 3.3600 0.88177
AS4 2.9160 1.08149
Price Promotion PP1 3.7440 0.79561
PP2 3.6200 0.77330
PP3 3.6520 0.80840
Brand Loyalty BL1 3.4400 0.85869
BL2 3.5600 0.84929
BL4 3.6800 0.85588
BL5 3.4640 0.89213
Source: Developed for the research.
Table 4.4 shows the overall means and the standard deviations of 5IVs and
brand loyalty in this study. As such, price’s mean is 3.1440 and its standard
deviation is 0.88453. Furthermore, store image’s mean is ranged from 3.1440 to
3.7080 and its standard deviation is between 0.84861-0.75433. For distribution
intensity, its mean and standard deviation are between 3.6480-3.8520 and
0.74317-0.91622 respectively.
By the way, the range of advertising spending’s mean is from 2.9160 to 3.4520
and its standard deviation is between 0.85005-1.08149. Similarly, price
promotion had showed its mean is ranged from 3.6200 to 3.7440 and its
standard deviation falls in the range from 0.77330 to 0.80840. Eventually, brand
loyalty’s mean is within a scope from 3.4400 to 3.6800 and its standard
deviation is between 0.84929-0.89213. Appendix J shows a more detail result
regarding the central tendencies measurement of constructs.

Customers’ Perceptions of the Marketing Mix and the effect on Malaysian Hypermarkets’ brand loyalty
Page 42 of 89
4.3 Scale Measurement
4.3.1 Internal Reliability Test
According to Sekaran (2003), the consistency and stability of the data are
measured by using the reliability test. Specifically, Cronbach’s Alpha is used to
examine the internal reliability of the five construct. Therefore, seventeen items
were included to test all the variables’ reliability. Burns and Bush (2006) stated
that the reliability coefficient closer to 0.600 is better. According to Table 4.5,
the Cronbach’s Alpha values of the entire constructs are more than 0.600 and
hence all are acceptable.
Table 4.5: Internal Reliability Analysis and Exploratory Factor Analysis
Variables Items Factors Loading A Set of Items Cronbach’s Alpha
Price P1 0.691 1 -
Store Image SI1 0.749 3 0.610
SI2 0.798
SI3 0.473
Distribution
Intensity
DI1 0.704 3 0.631
DI2 0.677
DI3 0.643
Advertising
Spending
AS2 0.583 3 0.606
AS3 0.762
AS4 0.800
Price
Promotion
PP1 0.531 3 0.751
PP2 0.524
PP3 0.419
Brand Loyalty BL1 0.573 4 0.752
BL2 0.736
BL4 0.780
BL5 0.767
Source: Developed for the research.
Note: After conducted the factor analysis, price could not be calculated as it
stands a single item (Wanous, Reichers & Hudy, 1997).
Factor analysis extracted the results of five factors solution with eigenvalues
more than one and the total variance was explained at 58.8%. Five items

Customers’ Perceptions of the Marketing Mix and the effect on Malaysian Hypermarkets’ brand loyalty
Page 43 of 89
relating to these factors were removed (i.e. price has two items; store image has
one item; advertising spending has one item; hypermarkets’ brand loyalty has
one item) due to low loadings.
Measurement of the samples’ adequacy is by using the Kaiser-Meyer-Olkin
(KMO). Leech, Barrett and Morgan (2005) stated that KMO below 0.5 is
inadequate and it should be above 0.7. KMO value of 0.814 shows the sample
size is adequate and the Bartlett’s test of sphericity is significant (p = 0.000 <
0.01). A total of 17 items which are unidimensional and factorially distinct
loaded on the constructs were retained for further analysis. The results of
analysis are summarized in Table 4.5.
4.3.2 Normality Test
The tests of normality, histogram with normal curve, P-P plot and scatter plot
diagram are being used to show the normal distribution of data.
Tables 4.6: Tests of Normality
Kolmogorov-Smirnova Shapiro-Wilk
Statistic df Sig. Statistic df Sig.
Standardized Residual .043 250 .200* .991 250 .117
Note: a. Lilliefors Significance Correction
*. This a lower bound of the true significance.
Source: Developed for the research.
The normality test has been conducted via the Kolmogorov-Smirnov. Based on
the Table 4.6, its p-value is equal to 0.200 (p-value > 0.05) as showing that the
normality assumption is met.
Besides, the normal probability plot of brand loyalty lies close to the imaginary
straight line rising from lower-left corner to the upper-right corner and becomes
upward slope of the graph. This shows that the data are normally distributed. It
has been showed in Appendix L. Moreover, the histogram of brand loyalty

Customers’ Perceptions of the Marketing Mix and the effect on Malaysian Hypermarkets’ brand loyalty
Page 44 of 89
shows a reasonable bell-shaped and thus data are normally distributed. The
result can be referred to Appendix M.
4.4 Inferential Analysis
4.4.1 Pearson Correlation
Table 4.7: Correlation Matrix for BL
Variables PR SI DI AS PP BL
PR 1.000
SI 0.079 1.000
DI 0.102 0.216** 1.000
AS 0.045 0.220** 0.173** 1.000
PP 0.027 0.421** 0.392** 0.318** 1.000
BL 0.156* 0.422** 0.374** 0.280** 0.477** 1.000
Notes: Correlation is significant at the *0.05; **0.01 levels (2-tailed)
Source: Developed for the research.
By implementing Pearson Correlation, Table 4.7 displays the outcome of the
correlation analysis of the 5IVs and brand loyalty. According to Table 4.7, the
range of correlation coefficient between BL and 5IVs is covered from 0.477 to
0.156 as PP enjoys the strongest correlation whilst the weakest correlation falls
to PR.
In overview, majority of the independent variables have significant positive
correlations as the P<0.01with brand loyalty. Sekaran (2003) stated that the
correlation coefficient which higher than 0.75 will exist a collineatiry problem.
The highest correlation coefficient in this study is 0.477 which is below the cut-
off of 0.75 for collinearity problem. Thus, collinearity problem does not exist in
this research. Detail of the result was showed in Appendix N.

Customers’ Perceptions of the Marketing Mix and the effect on Malaysian Hypermarkets’ brand loyalty
Page 45 of 89
4.4.2 Multiple Regression Analysis
In this research, the multiple regression analysis is used as a statistical technique
to analyze the linear relationship between a dependent variable and multiple
independent variables (Hair et al., 2006). There are three steps in conducting
multiple regression analysis, including: (i) Statistical significance of each
coefficient, (ii) Nature of relationship and (iii) Strength of relationship.
According to Hair et al., (2003), the test will be significant if the p-value is less
than 0.05. The beta coefficient is used to determine which independent variables
have the most influence on the dependent variable (Hair et al., 2006). Lastly, the
multiple r square is used to determine the strength of the relationship between
all the independent variables collectively and the dependent variable (Hair et al.,
2006).
Table 4.8: Regression predicting Brand Loyalty
Model
Unstandized
Coefficients
Standardized
Coefficients
t
Sig.
Collinearity
Statistics
B Std.
Error
Beta Tolerance VIF
1 (Constant) 0.348 0.293 1.187 0.237
PR 0.078 0.039 0.106 2.026 0.044 0.808 1.237
SI 0.261 0.063 0.238 4.124 0.000 0.834 1.200
DI 0.194 0.058 0.189 3.335 0.001 0.887 1.128
AS 0.097 0.051 0.105 1.906 0.058 0.689 1.452
PP 0.269 0.063 0.266 4.267 0.000 0.984 1.016
R2 0.344
Adj. R2 0.331
Sig. F .000a
F-value
25.62
4
Source: Developed for the research.
4.4.2.1 Test of Significance
H1: There is a significant positive influence of price towards Malaysian
hypermarkets’ brand loyalty. (Reject H0 if p<0.05)

Customers’ Perceptions of the Marketing Mix and the effect on Malaysian Hypermarkets’ brand loyalty
Page 46 of 89
From Table 4.8, the significant value for price is 0.044 which is less than p-
value of 0.05. Therefore, H1 is accepted, which indicates that price has a
significant positive influence towards Malaysian hypermarkets’ brand loyalty.
H2: There is a significant positive influence of store image towards
Malaysian hypermarkets’ brand loyalty. (Reject H0 if p<0.05)
From Table 4.8, the significant value for store image is 0.000 which is less than
p-value of 0.05. Therefore, H2 is accepted, which indicates that store image has
a significant positive influence towards Malaysian hypermarkets’ brand loyalty.
H3: There is a significant positive influence of distribution intensity
towards Malaysian hypermarkets’ brand loyalty. (Reject H0 if p<0.05)
From Table 4.8, the significant value for distribution intensity is 0.001 which is
less than p-value of 0.05. Therefore, H3 is accepted, which indicates that
distribution intensity has a significant positive influence towards Malaysian
hypermarkets’ brand loyalty.
H4: There is a significant positive influence of advertising spending
towards Malaysian hypermarkets’ brand loyalty. (Reject H0 if p<0.05)
From Table 4.8, the significant value for advertising spending is 0.058 which is
more than p-value of 0.05. Therefore, H4 is rejected, which indicates that
advertising spending has a no significant positive influence towards Malaysian
hypermarkets’ brand loyalty.
H5: There is a significant positive influence of price promotion towards
Malaysian hypermarkets’ brand loyalty. (Reject H0 if p<0.05)
From Table 4.8, the significant value for price promotion is 0.000 which is less
than p-value of 0.05. Therefore, H5 is accepted, which indicates that price

Customers’ Perceptions of the Marketing Mix and the effect on Malaysian Hypermarkets’ brand loyalty
Page 47 of 89
promotion has a significant positive influence towards Malaysian hypermarkets’
brand loyalty.
In conclusion, price, store image, distribution intensity and price promotion are
found to exert a significant positive influence towards Malaysian hypermarkets’
brand loyalty provided their p-values are lesser than 0.05.
4.4.2.2 Nature of Relationship
Based on the output of Table 4.8, the following equation is being created,
BL = 0.348 + 0.078(PR) + 0.261(SI) + 0.194(DI) + 0.097(AS) + 0.269(PP)
Based on the linear equation above, there is a significant positive relationship
between PR, SI, DI, AS and PP with BL. PP is the most powerful antecedent to
BL because its value of regression coefficient is 0.269. This indicates that one
unit increase in PP will increase BL by 0.269 when PR, SI, DI and AS are held
constant. It is followed by SI, DI, AS and PR with a regression coefficient of
0.261, 0.194, 0.097 and 0.078 respectively. Similarly, a unit increase in SI, DI,
AS and PR will increase BL by 0.261, 0.194, 0.097 and 0.078 respectively when
other independent variables remain status quo.
4.4.2.3 Strength of Relationship
Hair, Anderson, Tatham and Black (1998) suggested that there was
comparatively small degree of multicollinearity if tolerance value and VIF value
are above 0.10 and below 10 respectively. Thus, all the tolerance values and
VIF values in Table 4.4.2 prove that there is no multicollinearity problem.
Based on Table 4.4.2, PP (B = 0.269) has the strongest impact on BL which is
significant at 0.05 level and followed by SI (B = 0.261), DI (B = 0.194), AS (B
= 0.097) and PR (B = 0.078).

Customers’ Perceptions of the Marketing Mix and the effect on Malaysian Hypermarkets’ brand loyalty
Page 48 of 89
The F value of 25.624 is significant at the 0.05 level. This shows that the model
is fit and the F-value is large.
According to the output of Table 4.4.2, R2 of 0.344 indicates that 34.4% of
variation in BL is explained by the factors of PR, SI, DI, AS and PP. Meanwhile,
65.6% of the changes in BL are explained by other factors.
4.5 Conclusion
This chapter summarizes and interprets the output of SPSS data collected from the
survey. The analysis is divided into three parts which included descriptive analysis,
scale measurement and inferential analysis. The analysis of result and interpretation
will be used in next chapter for discussion, conclusion and implications of the overall
research.

Customers’ Perceptions of the Marketing Mix and the effect on Malaysian Hypermarkets’ brand loyalty
Page 49 of 89
CHAPTER 5: DISCUSSION, CONCLUSION AND
IMPLICATIONS
5.0 Introduction
This chapter consists of the summary of statistical analyses that discussed in the
previous chapter. Besides, discussion for major findings to confirm research
objectives and hypotheses of this study and summarization for results of hypotheses
testing are provided. Furthermore, researchers discuss the implications and limitations
of the study. Lastly, recommendations for future researchers and conclusion are being
made at the end of this chapter.
5.1Summary of Statistical Analysis
5.1.1 Pilot Test
The pilot test has been fulfilled the assumption tests of normality by its P-Value >
0.05 and reliability by reasonable Alpha Coefficient.
5.1.2 Descriptive Analysis
5.1.2.1 Respondents Demographic Profiles and General Information
Under demographic profiles of 250 respondents, male and female are held 50%
respectively. Most of the respondents are between 18 to 23 years old (30.0%)
while the least respondents are aged from 42 to 47 years old (6.8%). Majority of
the respondents are single (51.2%) whilst the remaining is married (48.8%).
Customers’ Perceptions of the Marketing Mix and the effect on Malaysian Hypermarkets’ brand loyalty
Page 50 of 89
Likewise, the highest proportion of respondents’ highest education level
belongs to primary and secondary school (52.0%). The lowest proportion of
respondents’ highest education level is Master and PhD Degree (1.2%).
Moreover, respondents’ occupations are mostly employees (28.4%) but not
students (10.0%) and others (10.0%). Furthermore, most of the respondents’
monthly income is between RM 1,001 to RM 2,000 (30.4%) while the least is
between RM 3,001 to RM 4,000 (10.4%).
As for general information of respondents, the highest frequency to shop in
Malaysian Hypermarket is 3 to 4 times per month (45.2%) yet less respondents
shop Malaysian Hypermarket for 7 to 8 times per month (10.4%). Besides, 52.0%
of respondents spending average from RM 51 to RM 150 each time and only 7.6%
of respondents spending average more than RM251 each time.
5.1.3 Scale Measurement
5.1.3.1 Internal Reliability Test
The scale is measured based on the reliability test. Before conducting reliability
test, two items of price and one item for each store image, advertising spending,
hypermarkets’ brand loyalty have been removed due to low loading. Hence,
single item of price cannot be used for analysis reliability purpose. After that,
only 17 items are used to measure five constructs. Among the five constructs
measured, the highest score with the Cronbach’s alpha of 0.752 is brand loyalty,
followed by price promotion (0.751), distribution intensity (0.631) and store
image (0.610). Advertising spending contributed the lowest alpha with 0.606.
Hence, the five variables are reliable.

Customers’ Perceptions of the Marketing Mix and the effect on Malaysian Hypermarkets’ brand loyalty
Page 51 of 89
5.1.3.2 Normality Test
Another assumption of normality distributed of data has to be fulfilled prior to
conduct Pearson Correlation and multiple regression analysis. The normality
test has been fulfilled by showing p-value of 0.200 which is greater than 0.05
under the Kolmogorov-Smirnov. Likewise, the histogram with normal curve as
well as P-P and Q-Q plots of standardized residual have the reasonable shape
which reveals that data are normally distributed.
5.1.4 Inferential Analysis
5.1.4.1 Pearson Correlation
As to measure the relationship and associations among brand loyalty, price,
store image, distribution intensity, advertising spending and price promotion,
Pearson Correlation has been used. The highest correlation coefficient between
BL and 5IVs is 0.477 whereas the lowest falls to 0.156. Most of the independent
variables’ p-value with brand loyalty is < 0.01. In conclusion, there is no
collinearity problem exist as the highest correlation coefficient is below the cut-
off of 0.75 in this study.
5.1.4.2 Multiple Regression Analysis
Multiple Regression analysis involves test of significant, nature relationship and
strength of relationship. The test of significant in this research shows all the
alternative hypotheses are accepted excludeadvertising spending (H4).
Under the nature of relationship the equation is formed:
BL = 0.348 + 0.078(PR) + 0.261(SI) + 0.194(DI) + 0.097(AS) + 0.269(PP)

Customers’ Perceptions of the Marketing Mix and the effect on Malaysian Hypermarkets’ brand loyalty
Page 52 of 89
According to above linear equation, there is a significant positive relationship
between price, store image, distribution intensity, advertising spending, and
price promotion and brand loyalty.
Furthermore, the strength of relationship is explained by R2of 0.344. It denotes
that 34.4% of variation in brand loyalty is explained by price, store image,
distribution intensity, advertising spending and price promotion. Meanwhile,
65.6% of the changes in BL are explained by other factors.
5.2 Discussions of Major Findings
In this research, there are five hypotheses. Apart from the alternative hypotheses for
advertising spending, other alternative hypotheses are supported. Meanwhile, Table
5.1 shows the summary of result related to all the hypotheses.
Table 5.1: Summary result of five hypotheses
Hypotheses Supported
(reject Ho)
Not Supported
(do not reject Ho)
H1: There is a significant positive influence of price
towards Malaysian hypermarkets’ brand loyalty.
P=0.044
(P< 0.05)
B=0.078
H2: There is a significant positive influence of store
image towards Malaysian hypermarkets’ brand
loyalty.
P=0.000
(P<0.05)
B=0.261
H3: There is a significant positive influence of
distribution intensity towards Malaysian
hypermarkets’ brand loyalty.
P=0.001
(P<0.05)
B=0.194
H4: There is a significant positive influence of
advertising spending towards Malaysian
hypermarkets’ brand loyalty.
P=0.058
(P>0.05)
B=0.097
H5: There is a significant positive influence of price
promotion towards Malaysian hypermarkets’
brand loyalty.
P=0.000
(P<0.05)
B=0.269
*P denoted as p-value
Source: Developed for the study.
Researchers find out that H1 is significant by reason of its p-value is less than
0.05.Hence, there is a significant positive influence of price towards Malaysian

Customers’ Perceptions of the Marketing Mix and the effect on Malaysian Hypermarkets’ brand loyalty
Page 53 of 89
hypermarkets’ brand loyalty. The Beta of 0.078which is the lowest value in contrast
to other variables indicates that the price does not have much impact to the brand
loyalty. Likewise, Wong and Sidek (2008) indicated that price and brand loyalty had a
positive relationship. Besides, price was directly correlated to loyalty (Sirohi,
McLaughlin & Wittink , 1998).
Besides, H2 has Beta of 0.261 and p-value of 0.000 which shows that there is a
significant positive influence of store image towards Malaysian hypermarkets’ brand
loyalty. According to Nguyen and Leblanc (2001), both corporate reputation and
image of the strongly favourableness of perceptions will tend to increase the degree of
customer loyalty. Gupta and Pirsch (2008) stated store image could only affect store
loyalty via store satisfaction. Furthermore, corporate image had a directly impact on
customer loyalty rather than customer satisfaction (Sivadas & Baker-Prewitt, 2000).
Koo (2003) further supported that abstract and global image component had a more
significant influence on loyalty than satisfaction. Additionally, the finding of store
image from adapted study is equivalent to our finding which showed positive effect
between store image and brand loyalty (Chen, 2007).
Moreover, Table 5.1 depicts that Beta and p-value of H3 are 0.194 and 0.058
respectively. Since the p-value is lesser than 0.05, H3 is accepted. Thus, there is a
significant positive influence of distribution intensity towards Malaysian
hypermarkets’ brand loyalty. Customers would be more satisfied by reason of the
product is available in a greater number of stores and they will be offered the product
where and when they want it (Ferris, Oliver & Kluyer, 1989; Smith, 1992). According
to adapted research, greater brand loyalty would be developed along with customers’
satisfactions with the product (Yoo et al., 2000). Moreover, Chen (2007) stated
distribution intensity had positive effect on brand loyalty as well.
In addition, H4 is not supported due to p-value of 0.058 which is greater than 0.05.
This result indicated there is no significant positive influence of advertising spending
towards Malaysian hypermarkets’ brand loyalty. Besides, the Betaof H4 is 0.097.
With respect of it, Agrawal (1996) stated that if the brand name is strong enough, the
brand loyalty did not require much advertising spending.

Customers’ Perceptions of the Marketing Mix and the effect on Malaysian Hypermarkets’ brand loyalty
Page 54 of 89
Lastly, the Beta for H5 is 0.269 which is the highest Beta value as compared with
other variables. Thus, it reveals that price promotion has strong impact to brand
loyalty. Besides, the p-value for H5 is 0.000 which means that price promotion has
significant positive influence towards Malaysian hypermarkets’ brand loyalty. Price
promotion has an equivalent finding which had positive effect on brand loyalty with
from the adapted study (Chen, 2007).
In conclusion, researchers conclude that the relationship between 5IVs and brand
loyalty by giving the equation BL = 0.348 + 0.078(PR) + 0.261(SI) + 0.194(DI) +
0.097(AS) + 0.269(PP). In accordance to the equation, for every 1 increased in Price,
Brand Loyalty would be raised up by 0.348 as provided that other variables remain
unchanged.
In contrary, based on the adapted study, its equation stated as BL = - 0.345 - 0.049(PR)
+ 0.669 (SI) + 0.022 (AS) + 0.343(DI) + 0.360 (PP). The obvious difference between
this study and the adapted study is the price construct. Present researchers examined
the price and brand loyalty has a positive relationship, but the adapted study is stated
as negative relationship between price and brand loyalty.
5.3 Implication of the study
5.3.1 Managerial implications
The result of this study provides insight for Malaysian hypermarket to realize
whether marketing mixes which are price, store image, distribution intensity,
advertising spending and price promotion have any relationship towards
Malaysian hypermarkets’ brand loyalty. Besides, it also provides information to
Malaysian hypermarket that which marketing mix has the most significant
influence towards brand loyalty. Hence, hypermarkets’ management can
emphasize on certain marketing strategic that helps to enhance its brand loyalty
among customers.

Customers’ Perceptions of the Marketing Mix and the effect on Malaysian Hypermarkets’ brand loyalty
Page 55 of 89
H1 is supported that price has a significant positive influence towards
Malaysian hypermarkets’ brand loyalty in this research through Multiple
Regression analysis. This shows that hypermarkets’ management has to set the
products price reasonably and properly. Brand switching might happened if
hypermarket products price are high or not reasonable. Additionally,
hypermarkets’ management should set the price lower than other competing
stores in order to build Malaysian hypermarkets’ brand loyalty among the
customers. In short run, hypermarkets may earn low profit. Nevertheless, they
can earn high profit in long run if they able to enhance Malaysian hypermarkets’
brand loyalty.
From Multiple Regression analysis, store image has a significant positive
influence towards Malaysian hypermarkets’ brand loyalty in this research
because H2 is accepted. Researchers conclude that customers are willing to
become loyal customers to hypermarkets whichever has good store image.
Therefore, hypermarkets’ management requires undertaking strategic planning
to build a strong store image. For example, hypermarkets should increase
products quality with reasonable price that can make customers confident to
purchase in hypermarket. Moreover, hypermarkets can provide a good
environment to customers in order to ensure they have a comfortable
environment to shop. Hypermarkets are also highly encouraged to involve
corporate social responsibility that can increase the image and reputation of
hypermarkets.
Furthermore, H3 is supported that distribution intensity also has a significant
positive affect towards Malaysian hypermarkets’ brand loyalty in this research
by using Multiple Regressions. Hence, it is necessary for hypermarkets’
management to plan properly the distribution intensity of the hypermarkets.
Hypermarkets should provide more products for customers to purchase. Thus,
customers can purchase several of products in the same hypermarket where it
includes many products. Furthermore, customers can shop at anytime and
anywhere if the hypermarket is available in many locations. At the end,
Malaysian hypermarkets’ brand loyalty can be enhanced when customers felt

Customers’ Perceptions of the Marketing Mix and the effect on Malaysian Hypermarkets’ brand loyalty
Page 56 of 89
satisfy as hypermarkets able to provide convenient which helped them to save
time and cost.
Additionally, Multiple Regression analysis depicts that advertising spending
does not have significant positive impact towards Malaysian hypermarkets’
brand loyalty in this research as H4 is accepted. Therefore, hypermarkets’
management should spend less on advertising as it does not have significant
impact towards its Malaysian hypermarkets’ brand loyalty. Appropriate
advertising is necessary in order to promote new products yet not need to
emphasize too much on it. It is because the major role of advertising is to let the
customers aware of the new products launch by hypermarkets. Besides, a loyal
customer will not change to shop in other hypermarkets irrespective of how
high the hypermarket’s advertising spending.
Lastly, H5 is supported that price promotion has the most significant impact on
Malaysian hypermarkets’ brand loyalty in this research from multiple regression
analysis. Customers tend to shop in the same hypermarket when that
hypermarket always provides price promotion. Therefore, hypermarkets’
management should emphasize more on price promotion such as “Everyday
Low Price”, coupons, rebates and others. In addition, hypermarkets’
management has to ensure that products price after the promotion is reasonable.
Hypermarkets’ effort to build strong brand loyalty will be useless if the products
prices are not reasonable after the price promotion. The reason that price
promotion has significant impact on Malaysian hypermarkets’ brand loyalty is
because of price promotion can easily make customers felt satisfied. When they
felt satisfied, then Malaysian hypermarkets’ brand loyalty can be enhanced
eventually.
5.4 Limitation of the Study
There is a few limitations have been encountered on the whole process of this study.
Initially, availability of information such as supporting materials, published journals

Customers’ Perceptions of the Marketing Mix and the effect on Malaysian Hypermarkets’ brand loyalty
Page 57 of 89
and articles that are reference for secondary data considered as a constraint for the
area of this research. Although Malaysian hypermarkets realized that brand loyalty is
important for them for enhancing their reputations as well as increasing their
competitive advantage against competing stores, there are not sufficient journals or
articles related to marketing mix associated with brand loyalty in Malaysian
hypermarkets. Therefore, most of the journals were adopted from foreign countries
and their findings may not be accurate or suitable to apply in Malaysia.
Next, the sample size in this study may not represent whole population due to limited
financial resources and time available. 250 samples from Selangor, Kuala Lumpur
and Perak may not large enough to represent accurately whole Malaysian
hypermarkets’ customers whoever are over 18 years old. Nevertheless, this limitation
does not affect the overall result significantly because Selangor, Kuala Lumpur and
Perak are the states which consists the first to third highest numbers of outlets in
Malaysia. Thus, 250 samples are able to be cited as deputy for this study. However,
limited financial resources and time available have restricted the ability of researchers
to cover a wider area of research.
Furthermore, questionnaires have been developed on close-ended questions. Even
though it is simple for respondents for answering questions, it may result that
respondents just simply fill in the answer without thinking in-depth. Besides,
researchers also cannot capture more comments and opinions from respondents
regarding on their perceptions. Thus, both statements reveal a limitation with regard
to the reliability and accuracy of this study. In other words, respondents may also face
the problem of misinterpret or misunderstood some words or sentences used in the
questionnaires. The main reason is questionnaires in Chinese language are translated
by researchers from English to Chinese and it may cause inaccuracy in translation and
misunderstood by respondents.
In overall, there are some limitations indicated in this study which encountered by
researchers. However, it does not affect the overall result of this study. The
underlying reason is the limitations can lay a background for future study as having a

Customers’ Perceptions of the Marketing Mix and the effect on Malaysian Hypermarkets’ brand loyalty
Page 58 of 89
better understanding on the impacts of the relationship between marketing mix and
brand loyalty of Malaysian hypermarkets.
5.5 Recommendations for Future Research
For future research, future researchers are highly encouraged to conduct further study
throughout the whole Malaysia which includes wider area to East Malaysia. It should
be conducted nationally whichever covered East Malaysia and West Malaysia in order
to have a clearer indication and thus able to clarify the customers perceptions in
Malaysia entirely. The largest result of survey from various costumers’ background
can assist to originate the best findings of the study for generalizing the overall
population and developing a full and intensive research.
In addition, future research should look into other variables like needs of customers,
values of products and others. with respect to broaden the horizon of study and add on
new finding to the present pool of knowledge. Ideally, its diversity of research model
will provide more accurate insights to Malaysian hypermarkets for implementing the
effective marketing strategy to enhance brand loyalty. Moreover, future researchers
have to construct the questionnaires into different types of languages such English,
Malay, Chinese, Tamil, etc.
Lastly, future research can also extend to others retailing target such as retailing stores
in order to obtain more proper findings on the relationship between marketing mix
and brand loyalty.
5.6 Conclusion
As a conclusion, the research project has fulfilled its objectives to examine the
relationships between price, store image, distribution intensity, advertising spending
and price promotion and brand loyalty of Malaysian hypermarket. Besides, some

Customers’ Perceptions of the Marketing Mix and the effect on Malaysian Hypermarkets’ brand loyalty
Page 59 of 89
recommendations for hypermarket to improve their performance and future
researchers to continue related researches are provided.

Customers’ Perceptions of the Marketing Mix and the effect on Malaysian Hypermarkets’ brand loyalty
Page 60 of 89
REFERENCES
Aaker, D. A. (1996). Measuring brand equity across products and markets. California
Management Review, 38(3), 102-121.
Aaker, D. A., & Jacobson, R. (1994). The financial information content of perceived
quality. Journal of Marketing Research, 31(2), 191-201.
Agrawal, D. (1996). Effect of brand loyalty on advertising and trade promotions: A
game theoretic analysis with empirical evidence. Marketing Science, 15(1), 86-
108.
Angel, F. V., & Manuel, J. S. (2005). The impact of marketing communication and
price promotion on brand equity. Brand Management, 12(6), 431-444.
Armstrong, G., & Kotler, P. (2005). Marketing: An introduction (7th ed.). New Jersey:
Pearson Prentice Hall.
Barone, M. J., Taylor, V. A., & Urbany, J. E. (2005). Advertising signaling effects for
new brands: The moderating role of perceived brand differences. Journal of
Marketing Theory and Practice, 13(1), 1-13.
Bloemer, J. M. M., & Odekerken-Schroder, G. (2002). Store satisfaction and store
loyalty explained by customer and store-related factors. Journal of Consumer
Satisfaction, Disatisfaction and Complaining Behaviour, 15, 68-80.
Borg, W. R., & Gall, M. D. (1989). Educational research (5th ed.). White Plains,
New York: Longman Inc.
Burns, A. C., & Bush, R. F. (2006). Marketing research (5th ed.). New Jersey:
Pearson Education, Inc.
Cadeaux, J. (1992). Industry product volatility and retailer assortments. Journal of
Macromarketing, 12(2), 28-37.
Chang, C. H., & Tu, C. Y. (2005). Exploring store image, customer satisfaction and
customer loyalty relationships: Evidence from Taiwanese hypermarkets.
Journal of the American Academy of Business, 7(2), 197-202.
Chaudhuri, A. & Holbrook, M. B. (2001). The chain of effects from brand trust and
brand affect to brand performance: The role of brand loyalty. Journal of
Marketing, 65(2), 81–93.
Chen, C. H. (2007). Customers’ perceptions of the marketing mix and the effect on
Taiwan hypermarkets’ brand loyalty. (Doctoral dissertation, Lynn University,
2007). ProQuest Dissertations & Theses A&I, UMI 3274169.
Cobb-Walgren, C. J., Ruble, C. A., & Donthu, N. (1995). Brand equity, brand
preferences, and purchase intent. Journal of Advertising, 24(3), 25-40.

Customers’ Perceptions of the Marketing Mix and the effect on Malaysian Hypermarkets’ brand loyalty
Page 61 of 89
Cooper, R. D. & Schindler, P. S. (2006). Business research methods (9th ed.). New
York: McGraw hill/Irwin, International Edition.
Copeland, M. T. (1923). Relation of consumers’ buying habits to marketing methods.
Harvard Business Review, 1, 282-289.
Coughlan, A. T., Anderson, E., Stern, L. W., & El-Ansary, A. I. (2001). Marketing
channels (6th ed.). New Jersey: Prentice Hall.
Creswell, J. W. (2005). Educational research: Planning, conducting, and evaluating
quantitative and qualitative research (2nd
ed.). Upper Saddle River, NJ: Pearson
Education.
East, R., & Hammond, K. A. (1996). The erosion of repeat purchase loyalty. Mark
Lett, 7(2), 163-72.
Ferris, P., Oliver, J., & Kluyver, C. D. (1989). The relationship between distribution
and market share. Marketing Science, 8(2), 107-127.
Gounaris, S., & Stathakopoulos, V. (2004). Antecedents and consequences of brand
loyalty: an empirical study. Journal of Brand Management, 11(4), 70-87.
Green, S. B. (1991). How many subjects does it take to do a regression analysis?
Multivariate Behavioral Research, 26(3), 499-510.
Gupta, S. (1988). Impact of sales promotions on when, what, and how much to buy.
Journal of Marketing Research, 25(11), 342-355.
Gupta, S., & Pirsch, J. (2008). The influence of a retailer's corporate social
responsibility program on re-conceptualizing store image. Journal of Retailing
and Consumer Services, 15(6), 516-526.
Hair, J. E., Anderson, R. E., Tatham, R. L., & Black, W. C. (1998). Multivariate data
analysis (5th ed.). Upper Saddle River, NL: Prentice-Hall.
Hair, J. F., Babin, B., Money, A. H., & Samouel, P. (2003). Essentials of business
research methods (1st ed.). New Jersey: John Wiley & Sons, Inc.
Hair, J. F., Black, W. C., Babin, B. J., Anderson, R. E., & Tatham, R. L. (2006).
Multivariate data analysis (6th
ed.). New Jersey: Pearson Education
International.
Hair, J. F., Bush, R. P., & Ortinan, D. J. (2006). Marketing research within a
changing information environment (3rd
ed.). New York: McGraw-Hill/Irwin.
Have, P. T. (2004). Understanding Qualitative Research and Ethnomethodogy.
Thousand Oaks, CA: Sage Publications.

Customers’ Perceptions of the Marketing Mix and the effect on Malaysian Hypermarkets’ brand loyalty
Page 62 of 89
Huddleston, P., Whipple, J., & VanAuken, A. (2004). Food store loyalty: Application
of a consumer loyalty framework. Journal of Targeting, Measurement and
Analysis for Marketing, 12(3), 213-230.
Jackson, R. (2010). A lighter wallet due to loyalty: the influence of brand loyalty on
the amount a consumer is willing to pay for their preferred brand. Journal of
Psychology, 12-15.
Jacoby, J. & Chestnut, R. W. (1978). Brand Loyalty: Measurement and Management.
New York: John Wiley & Sons.
Knox, S. D., & Denison, D. J. (2000). Store loyalty: Its impact on retail revenue-an
empirical study of purchasing behavior in the UK. Journal of Retailing and
Consumer Services, 7, 33-45.
Koo, D. M. (2003). Inter-relationships among store images, store satisfaction, and
store loyalty among Korea discount retail patrons. Asia Pacific Journal of
Marketing and Logistics, 15(4), 42–71.
Kotler, P., (2003). Marketing insights from A to Z. Canada: John Wiley and Sons, Inc.
Leech, N. L., Barrett, K. C., & Morgan, G. A. (2005). SPSS for intermediate statistics:
use and interpretation (2nd
ed.). Mahwah, NJ: Lawrence Erlbaum Associates.
.
Lemmink, J., Schuijf, A., & Streukens, S. (2003). The role of corporate image and
company employment image in explaining application intentions. Journal of
Economic Psychology, 24, 1-15.
Malaysia exporter guide annual. (2010, December). Retrieved March 7, 2010, from
http://gain.fas.usda.gov/Recent%20GAIN%20Publications/Exporter%20Guide_
Kuala%20Lumpur_Malaysia_12-30-2010.pdf
Malhorta, N. K. (2004). Marketing research: An applied orientation (4th ed.). United
State: Pearson Education, Inc.
Malhotra, N. K. (2005). Basic marketing research (2nd ed.). United State: Pearcon
Education, Inc.
Malhotra, N. K., & Peterson, M. (2006). Basic marketing research: Decision-making
approach (2nd
ed.). New Jersey: Prentice Hall.
Mark, S., Philip, L. & Adrian, T. (2009). Research methods for business students (5th
ed.). Financial Times: Prentice Hall.
McCarthy, E. J. (1960). Basic marketing: A managerial approach. Homewood, IL:
Richard D. Irwin.
McCarthy, E. J. (1971). Basic marketing: A managerial approach (4th
ed.).
Homewood, IL: Richard D. Irwin.

Customers’ Perceptions of the Marketing Mix and the effect on Malaysian Hypermarkets’ brand loyalty
Page 63 of 89
Meer, D. (1995). System beaters, brand loyals, and deal shoppers: New insights into
the role of brand and price. Journal of Advertising Research, 35, 2-12.
Mela, C. F., Gupta, S., & Lehmann, D. R. (1997). The long-term impact of promotion
and advertising on consumer brand choice. Journal of Marketing
Research, 34(2), 248-261.
Mellens, M., Dekimpe, M. G., & Steenkamp, JBEM. (1996). A review of brand-
loyalty measures in marketing. Tijdschr voor Econ Manage, 41(4), 507-33.
Moorthy, S., & Zhao, H. (2000). Advertising spending and perceived quality.
Marketing Letters, 11(3), 221-233.
Moreira, D. (2003). Is bigger always better? Malaysian Business.
Nguyen, N., & Leblanc, G. (2001). Corporate image and corporate reputation in
customers’ retention decisions in services. Journal of Retailing and Consumer
Services, 8(4), 227-236.
Niraj, R., Padmanabhan, V. & Seetharaman, P. B. (2008). A cross-category model of
households’ incidence and quantity decisions. Marketing Science, 27(2), 225–
235.
Oliver, R. (1999). Whence consumer loyalty? Journal of Marketing, 63, 33-44.
Oliver, R. & Rust, R. (1997). Customer delight: Foundations, findings, and
managerial insight. Journal of Retailing, 73(3), 311-337.
Orth, U. R., & Green, M. T. (2009). Consumer loyalty to family versus non-family
business: The roles of store image, trust and satisfaction. Journal of Retailing
and Consumer Services, 16(4), 248-259.
Pan, Y., & Zinkhan, G. W. (2006). Determinants of retail patronage: a meta-analytical
perspective. Journal of Retailing, 82(3), 229-243.
Pappu, R., & Quester, P. (2006). A consumer-based method for retailer equity
measurement: Results of an empirical study. Journal of Retailing and Consumer
Services, 13(5), 317-329.
Perrigot, R., & Cliquet, G. (2006). Hypermarket format: Any future or a real need to
be changed? An empirical study of the French, Spanish and Italian markets. 5th
International Marketing Trends Congress.
Preliminary count report, population and housing census, Malaysia, 2010 (n.d.).
Retrieved March 3, 2010, from
http://www.statistics.gov.my/portal/index.php?option=com_content&view=artic
le&id=350%3Apreliminary-count-report-population-and-housing-census-
malaysia-2010&catid=102%3Apreliminary-count-report-population-and-
housing-census-malaysia-2010&lang=en

Customers’ Perceptions of the Marketing Mix and the effect on Malaysian Hypermarkets’ brand loyalty
Page 64 of 89
Rajh, E. (2005). The effects of marketing mix elements on brand equity. Privredna
kretanja i eknomska politika (Economic Trends and Economic Policy), 102, 30-
59.
Retail and shopper trends Asia Pacific. (2010, August). Retrieved March 3, 2010,
from
http://hk.nielsen.com/documents/APACRetailandShopperTrendsReport2010.pdf
Retailing in Malaysia. (2011, January). Retrieved March 3, 2010, from
http://www.euromonitor.com/retailing-in-malaysia/report
Sekaran, U. (2003). Research methods for business: A skill building approach (4th
ed.). New York: John Wiley and Sons, Inc.
Shih, C. Y., Sun, P. C., & Tang, T. S. (2007). The Impact of Advertising and Price
Promotion on Brand Equity: With Product Category as a Moderator.
Unpublished Manuscript, Department of Business Management, Tatung
University.
Shimp, T. A. (1997). Advertising, promotion, and supplemental aspects of integrated
marketing communications (4th ed.). Orlando, FL: Dryden.
Silberhorn, F. D.-K. (2010). Four essays on modeling brand choice and brand loyalty.
Germany.
Sirohi, N., McLaughlin, E. W., & Wittink, D. R. (1998). A model of consumer
perceptions and store loyalty intentions for a supermarket retailer. Journal of
Retailing, 74(2), 223-245.
Sivadas, E., & Baker-Prewitt, J. L. (2000). An examination of the relationship
between service quality, customer satisfaction, and store loyalty. International
Journal of Retail & Distribution Management, 28(2), 73-82.
Smith, D. C. (1992). Brand extensions and advertising efficiency: what can and
cannot be expected. Journal of Advertising Research, 32, 11-20.
Song, I. & Chintagunta, P. K. (2007). A discrete-continuous model for multi-category
purchase behavior of households. Journal of Marketing Research, 44(4), 595–
612.
Tseng, Y. M., Liao, B. C., & Jan, Y. S. (2004). The study of relation between product
value, brand trust, brand affect and brand loyalty. Journal of Business
Administration, 61, 29-50.
Van Heerde, H. J., Gupta, S., & Wittink, D. R. (2003). Is 75% of the sales promotion
bump due to brand switching? No, only 33% is. Journal of Marketing Research,
40(4), 481-491.

Customers’ Perceptions of the Marketing Mix and the effect on Malaysian Hypermarkets’ brand loyalty
Page 65 of 89
Wang, Y. L., Li, M. X., & Zhao, J. (2006). Revenge price promotion strategy which
departs from the brand positioning and its consequences. Unpublished
Manuscript, University of Shaoxing.
Wanous, J. P., Reichers, A. E., & Hudy, M. J. (1997). Overall job satisfaction: how
good are single-item measures. Journal of Applied Psychology, 82(2), 247-252.
Wong, F. Y., & Sidek, Y. (2008). Influence of brand loyalty on consumer sportswear.
Journal of Economics and Management, 2(2), 221-236.
Yang, H. E., & Liao, C. C. (2004). A study on the relationships among marketing mix
elements, brand equity, and customer lifetime value. Unpublished Manuscript,
Tatung University.
Yoo, B. H., & Donthu, N. (2001). Developing and validating a multidimensional
consumer-based brand equity scale. The Journal of Product and Brand
Management, 52(1), 1-14.
Yoo, B., H., Donthu, N., & Lee, S. H. (2000). An examination of selected marketing
mix elements and brand equity. Journal of the Academy of Marketing Science,
28(2), 195-211.
Zikmund, W. G. (2003). Business research methods (7th ed.). United States:
Thomson South Western.
Zikmund, W. G. (2003). “Exploring Marketing Research”. United States: Thomson
South Western.

Customers’ Perceptions of the Marketing Mix and the effect on Malaysian Hypermarkets’ brand loyalty
Page 66 of 89
APPENDICES
Appendix A: Numbers of Malaysian Hypermarkets
Malaysian
Hypermarket
Total
Outlet
State Outlet Percentage
(State Outlet
/ Total
Outlet)
References
Perak Selangor &
Kuala
Lumpur
Carrefour 18 - 14 77.78% http://www.carrefour.com.m
y/newc4w/en/shopping_mal
l.php
Giant 44 3 20 52.27% http://www.giant.com.my/lo
cation
Tesco 37 5 15 54.05% http://www.tesco.com.my/ht
ml/stores.aspx?ID=7&PID=
99&LID=1&Repost=True
Mydin 5 - 1 20.00% http://www.mydin.com.my/
mydin/mydin-wholesale-
hypermarket
Source: Developed for the research
Appendix B: Pie Chart of Respondents’ Gender
Source: Developed for the research
Male
50.0%Female
50.0%
Gender
Male
Female

Customers’ Perceptions of the Marketing Mix and the effect on Malaysian Hypermarkets’ brand loyalty
Page 67 of 89
Appendix C: Pie Chart of Respondents’ Age Group
Source: Developed for the research
Appendix D: Pie Chart of Respondents’ Marital Status
Source: Developed for the research
18-23
30.0%
24-29
21.2%30-35
16.4%
36-41
13.2%
42-47
6.8%
> 48
12.4%
Age Group
18-23
24-29
30-35
36-41
42-47
> 48
Single
51.2%
Married
48.8%
Marital Status
Single
Married
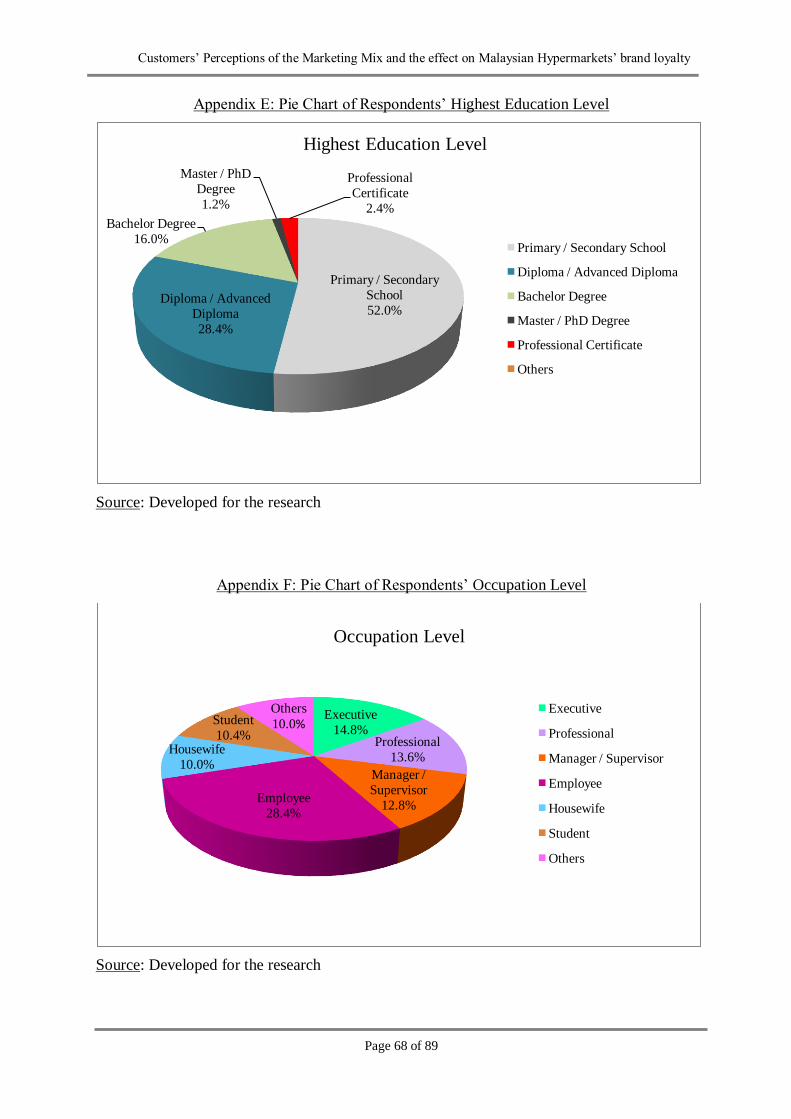
Customers’ Perceptions of the Marketing Mix and the effect on Malaysian Hypermarkets’ brand loyalty
Page 68 of 89
Appendix E: Pie Chart of Respondents’ Highest Education Level
Source: Developed for the research
Appendix F: Pie Chart of Respondents’ Occupation Level
Source: Developed for the research
Primary / Secondary
School
52.0%Diploma / Advanced
Diploma
28.4%
Bachelor Degree
16.0%
Master / PhD
Degree
1.2%
Professional
Certificate
2.4%
Highest Education Level
Primary / Secondary School
Diploma / Advanced Diploma
Bachelor Degree
Master / PhD Degree
Professional Certificate
Others
Executive
14.8%Professional
13.6%
Manager /
Supervisor
12.8%Employee
28.4%
Housewife
10.0%
Student
10.4%
Others
10.0%
Occupation Level
Executive
Professional
Manager / Supervisor
Employee
Housewife
Student
Others

Customers’ Perceptions of the Marketing Mix and the effect on Malaysian Hypermarkets’ brand loyalty
Page 69 of 89
Appendix G: Pie Chart of Respondents’ Monthly Income
Source: Developed for the research
Appendix H: Pie Chart of Respondents’ Frequency to Shop in Hypermarket per Month
Source: Developed for the research
< RM1,000
26.0%
RM1,001-RM2,000
30.4%
RM2,001-RM3,000
19.2%
RM3,001-RM4,000
10.4% > RM4,000
14.0%
Monthly Income
< RM1,000
RM1,001-RM2,000
RM2,001-RM3,000
RM3,001-RM4,000
> RM4,000
1 - 2 times
31.6%
3 - 4 times
45.2%
5 - 6 times
10.4%
7 - 8 times
1.6%
> 8 times
11.2%
Frequency to Shop in Hypermarket per Month
1 - 2 times
3 - 4 times
5 - 6 times
7 - 8 times
> 8 times

Customers’ Perceptions of the Marketing Mix and the effect on Malaysian Hypermarkets’ brand loyalty
Page 70 of 89
Appendix I: Pie Chart of Respondents’ Average Expenses
Source: Developed for the research
Appendix J: Central Tendencies Measurement of Constructs
Items Statement SD D N A SA Mean Standard
Deviation
P1 The product price offered
by hypermarket is higher
than its competing stores.
2.4 19.6 45.2 26.8 6.0 3.1440 0.88453
SI1 Hypermarket sells high
quality products.
0.8 18.0 51.2 26.0 4.0 3.1440 0.78340
SI2 Hypermarket sells very
popular products.
0.4 6.0 26.8 56.0 10.8 3.7080 0.75433
SI3 Hypermarket has positive
image.
2.8 6.0 25.2 56.0 10.0 3.6440 0.84861
DI1 Hypermarket sells more
goods than its competing
stores.
1.2 6.4 28.4 47.2 16.8 3.7200 0.86056
DI2 Hypermarket is easily
available in many locations.
1.2 3.2 19.2 62.0 14.4 3.8520 0.74317
DI3 Hypermarket has more
store location than its
competing stores.
1.2 10.4 27.2 44.8 16.4 3.6480 0.91622
AS2 The advertising campaigns 0.4 15.2 30.4 46.8 7.2 3.4520 0.85005
< RM50
19.2%
RM51-RM150
52.0%
RM151-RM250
21.2%
> RM251
7.6%
Average Expenses
< RM50
RM51-RM150
RM151-RM250
> RM251

Customers’ Perceptions of the Marketing Mix and the effect on Malaysian Hypermarkets’ brand loyalty
Page 71 of 89
of hypermarket are seen
frequently.
AS3 The advertising campaigns
of hypermarket are
attractive.
2.4 13.6 36.0 41.6 6.4 3.3600 0.88177
AS4 I remember the last
advertising campaigns of
hypermarket.
10.0 28.0 27.2 30.0 4.8 2.9160 1.08149
PP1 Price promotion of
hypermarket is frequently
offered.
1.2 5.6 23.6 56.8 12.8 3.7440 0.79561
PP2 Price promotion of
hypermarket is reasonable.
1.6 6.0 28.4 56.8 7.2 3.6200 0.77330
PP3 Price promotion of
hypermarket is satisfactory.
1.2 6.0 30.8 50.4 11.6 3.6520 0.80840
BL1 I would recommend others
to shop in hypermarket.
1.2 12.8 34.8 43.2 8.0 3.4400 0.85869
BL2 I will continue to shop in
hypermarket as my primary
choice.
0.8 10.4 31.6 46.4 10.8 3.5600 0.84929
BL4 I have shopped in
hypermarket for a long
time.
0.8 7.6 30.0 46.0 15.6 3.6800 0.85588
BL5 I anticipate having a long-
term commitment to
hypermarket.
2.0 10.4 37.6 39.2 10.8 3.4640 0.89213
Source: Developed for the research
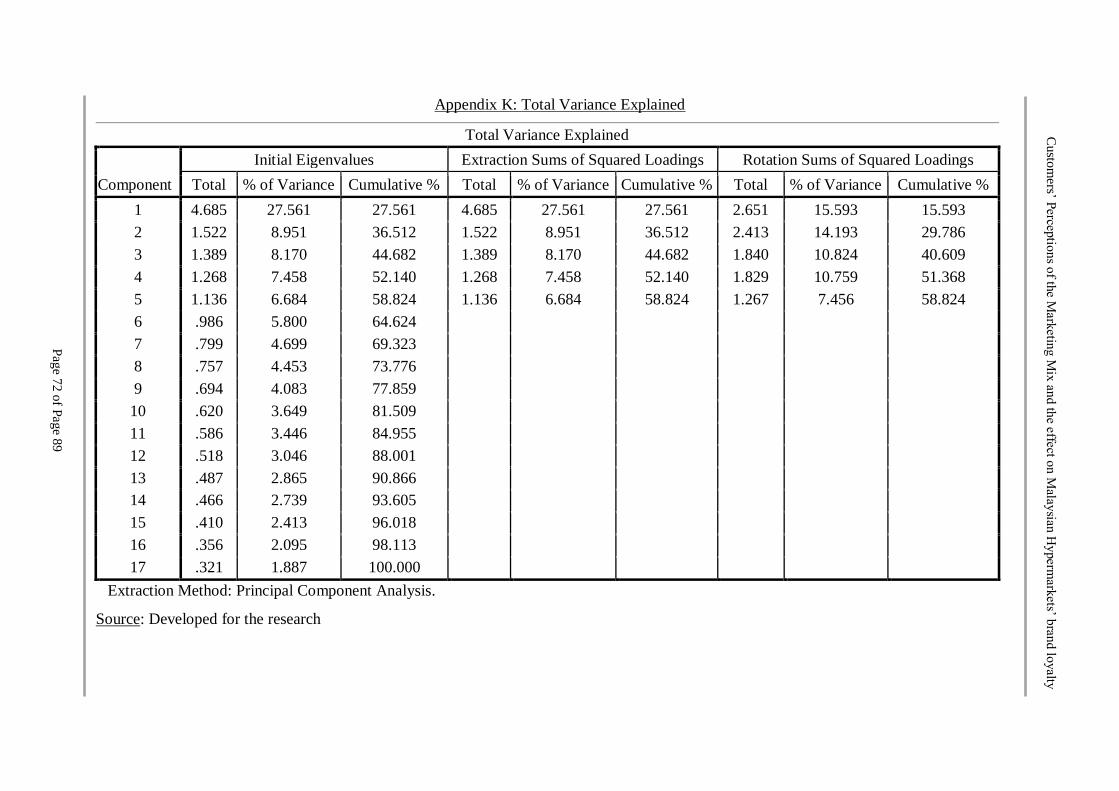
Appendix K: Total Variance Explained
Total Variance Explained
Component
Initial Eigenvalues Extraction Sums of Squared Loadings Rotation Sums of Squared Loadings
Total % of Variance Cumulative % Total % of Variance Cumulative % Total % of Variance Cumulative %
1 4.685 27.561 27.561 4.685 27.561 27.561 2.651 15.593 15.593
2 1.522 8.951 36.512 1.522 8.951 36.512 2.413 14.193 29.786
3 1.389 8.170 44.682 1.389 8.170 44.682 1.840 10.824 40.609
4 1.268 7.458 52.140 1.268 7.458 52.140 1.829 10.759 51.368
5 1.136 6.684 58.824 1.136 6.684 58.824 1.267 7.456 58.824
6 .986 5.800 64.624
7 .799 4.699 69.323
8 .757 4.453 73.776
9 .694 4.083 77.859
10 .620 3.649 81.509
11 .586 3.446 84.955
12 .518 3.046 88.001
13 .487 2.865 90.866
14 .466 2.739 93.605
15 .410 2.413 96.018
16 .356 2.095 98.113
17 .321 1.887 100.000
Extraction Method: Principal Component Analysis.
Source: Developed for the research
Cu
stom
ers’ Percep
tion
s of th
e Mark
eting
Mix
and th
e effect on M
alaysian
Hy
perm
arkets’ b
rand
loyalty
Pag
e 72 o
f Pag
e 89

Customers’ Perceptions of the Marketing Mix and the effect on Malaysian Hypermarkets’ brand loyalty
Page 73 of 82
Appendix L: Normal P-P Plot of Standardized Residual
Source: Developed for the research

Customers’ Perceptions of the Marketing Mix and the effect on Malaysian Hypermarkets’ brand loyalty
Page 74 of 82
Appendix M: Histogram with Normal Distribution Curve of Brand Loyalty
Source: Developed for the research

Customers’ Perceptions of the Marketing Mix and the effect on Malaysian Hypermarkets’ brand loyalty
Page 75 of 82
Appendix N: Pearson Correlations between 5IVs and BL
PR SI DI AS PP BL
PR Pearson
Correlation
1 .079 .102 .045 .027 .156*
Sig. (2-tailed) .213 .108 .483 .674 .014
N 250 250 250 250 250 250
SI Pearson
Correlation
.079 1 .216** .220** .421** .422**
Sig. (2-tailed) .213 .001 .000 .000 .000
N 250 250 250 250 250 250
DI Pearson
Correlation
.102 .216** 1 .173** .392** .374**
Sig. (2-tailed) .108 .001 .006 .000 .000
N 250 250 250 250 250 250
AS Pearson
Correlation
.045 .220** .173** 1 .318** .280**
Sig. (2-tailed) .483 .000 .006 .000 .000
N 250 250 250 250 250 250
PP Pearson
Correlation
.027 .421** .392** .318** 1 .477****
Sig. (2-tailed) .674 .000 .000 .000 .000
N 250 250 250 250 250 250
BL Pearson
Correlation
.156* .422** .374** .280 .477* 1
Sig. (2-tailed) .014 .000 .000 .000 .000
N 250 250 250 250 250 250
**. Correlation is significant at the 0.01 level (2-tailed).
*. Correlation is significant at the 0.05 level (2-tailed).
Source: Developed for the research

Customers’ Perceptions of the Marketing Mix and the effect on Malaysian Hypermarkets’ brand loyalty
Page 76 of 89
Appendix O: Distributed Questionnaire
UNIVERSITI TUNKU ABDUL RAHMAN
Faculty of Business and Finance
BACHELOR OF COMMERCE (HONS) ACCOUNTING
FINAL YEAR PROJECT
TITLE OF TOPIC: CUSTOMERS’ PERCEPTIONS OF THE
MARKETING MIX AND THE EFFECT ON MALAYSIAN
HYPERMARKETS’ BRAND LOYALTY
Survey Questionnaire
Dear respondent,
We are final year undergraduate students pursuing a degree course in Bachelor of
Commerce (Hons) Accounting at Universiti Tunku Abdul Rahman (UTAR). The
purpose of this survey is to find out about your perception on the effects of marketing
mix on brand loyalty in Malaysian Hypermarkets. Marketing mix in this project
consists of price, store image, distribution intensity, advertising spending and price
promotion. As a representation of Malaysian hypermarkets, we plan to select local as
well as foreign hypermarkets that are found in Malaysia such as Mydin, Tesco,
Carrefour and Giant.
Thank you for your participation.
Instructions:
1) There are THREE (3) sections in this questionnaire. Please answer ALL questions
in ALL sections.
2) Completion of this form will take you approximately 5 to 10 minutes.
3) The contents of this questionnaire will be kept strictly confidential.

Customers’ Perceptions of the Marketing Mix and the effect on Malaysian Hypermarkets’ brand loyalty
Page 77 of 89
拉曼大学
Faculty of Business and Finance
BACHELOR OF COMMERCE (HONS) ACCOUNTING
调查报告
标题:
消费者观点下的行销组合以及行销组合对我国霸级市场忠诚度的影响
问卷调查
您好,
我们是拉曼大学会计科系的学生。这份问卷调查是有关您的观点对于行销组合
(Marketing Mix) 在我国霸级市场 (Hypermarkets) 的品牌忠诚度。报告里的行销组
合指的是价格,商品形象,商店分布率,广告费与价格优惠。此外,我们选了
Mydin, Tesco, Carrefour 和 Giant 为我国霸级市场的代表。
在此,我们非常感谢您的合作。
备注:
1) 此问卷调查共分成三个部分。请您务必要回答全部的问题。
2) 此问卷调查仅需五到十分钟左右。
3) 有关您的资料与答复将会完全被保密。

Customers’ Perceptions of the Marketing Mix and the effect on Malaysian Hypermarkets’ brand loyalty
Page 78 of 89
Section A: Demographic Profile
第一部分:基本资料
Please place a tick “√” for each of the following:
请在以下选项打 “√” :
1. Gender 性别 :
□ Male 男性
□ Female 女性
2. Age 年龄 :
□ 18 - 23
□ 24 - 29
□ 30 - 35
□ 36 - 41
□ 42 - 47
□ > 48
3. Marital Status 婚姻状态 :
□ Single 单身
□ Married 已婚
4. Highest Education Completed 已完成的最高教育程度 :
□ Primary School 小学 / Secondary School 中学
□ Diploma 学院文凭 / Advanced Diploma 高等学院文凭
□ Bachelor Degree 学士
□ Master Degree 硕士 / PhD Degree 博士
□ Professional Certificate 专业文凭
□ Others, please specify 其他,请备注 : _____________
5. Occupation Level 职业 :
□ Executive 主管
□ Professional 专业人士
□ Manager 经理 / Supervisor 管理人
□ Employee 员工
□ Housewife 家庭主妇
□ Student 学生
□ Others, please specify 其他,请备注 : _____________

Customers’ Perceptions of the Marketing Mix and the effect on Malaysian Hypermarkets’ brand loyalty
Page 79 of 89
6. Monthly Income 月薪 :
□ < RM1,000
□ RM1,001 - RM2,000
□ RM2,001 - RM3,000
□ RM3,001 - RM4,000
□ > RM4,000
7. How frequent do you shop in hypermarket per month 您每个月在霸级市场的
购物次数 ?
□ 1 - 2 times
□ 3 - 4 times
□ 5 - 6 times
□ 7 - 8 times
□ > 8 times
8. On average, how much do you spend each time in hypermarket 您平均在霸级
市场内消费多少 ?
□ < RM50
□ RM51 - RM150
□ RM151 - RM250
□ > RM251
9. Which hypermarkets are you referring 哪间霸级市场是您的探讨对象 ?
□ Giant
□ Tesco
□ Mydin
□ Carrefour

Customers’ Perceptions of the Marketing Mix and the effect on Malaysian Hypermarkets’ brand loyalty
Page 80 of 89
Section B: Marketing Mix
第二部分 : 行销组合
Please circle your answer to each statement using 5 Points Likert Scale:
请您将最合适的一个选项圈起 :
[(1) = Strongly Disagree 非常不同意 ; (2) = Disagree 不同意 ; (3) = Neutral
中立 ; (4) = Agree 同意 and (5) = Strongly Agree 非常同意]
Price 价格
No. Questions
Str
on
gly
Dis
agre
e
Dis
agre
e
Neu
tral
Agre
e
Str
on
gly
Agre
e
*P1 The product price offered by hypermarket
is higher than its competing stores.
霸级市场的商品价格比其他零售商更
高。
1 2 3 4 5
P2 The product price offered by hypermarket
is reasonable.
霸级市场的商品价格很公道。
1 2 3 4 5
P3 The product price offered by hypermarket
is consistent without fluctuating.
霸级市场提供一致的商品价格。
1 2 3 4 5
Store Image 商品形象
No. Questions
Str
on
gly
Dis
agre
e
Dis
agre
e
Neu
tral
Agre
e
Str
on
gly
Agre
e
SI1 Hypermarket sells high quality products.
霸级市场销售高品质的商品。
1 2 3 4 5
SI2 Hypermarket sells very popular products.
霸级市场销售大众化的商品。
1 2 3 4 5
SI3 Hypermarket has positive image.
霸级市场拥有良好的商誉。
1 2 3 4 5
SI4 Hypermarket has nice ambient.
霸级市场提供舒适的环境。
1 2 3 4 5

Customers’ Perceptions of the Marketing Mix and the effect on Malaysian Hypermarkets’ brand loyalty
Page 81 of 89
Distribution Intensity 商店分布率
No. Questions
Str
on
gly
Dis
agre
e
Dis
agre
e
Neu
tral
Agre
e
Str
on
gly
Agre
e
DI1 Hypermarket sells more goods than its
competing stores.
霸级市场比其他零售商销售更多的商
品。
1 2 3 4 5
DI2 Hypermarket is easily available in many
locations.
霸级市场广泛地遍布各区。
1 2 3 4 5
DI3 Hypermarket has more store location than
its competing stores.
霸级市场的分店比其他零售商更多。
1 2 3 4 5
Advertising Spending 广告费
No. Questions
Str
on
gly
Dis
agre
e
Dis
agre
e
Neu
tral
Agre
e
Str
on
gly
Agre
e
AS1 The advertising spending of hypermarket
seems like more expensive than its
competing stores.
霸级市场的广告费较其他零售商高。
1 2 3 4 5
AS2 The advertising campaigns of hypermarket
are seen frequently.
霸级市场的广告活动很频密。
1 2 3 4 5
AS3 The advertising campaigns of hypermarket
are attractive.
霸级市场提供具有吸引力的广告。
1 2 3 4 5
AS4 I remember the last advertising campaigns
of hypermarket.
我依然记得霸级市场最近的广告。
1 2 3 4 5

Customers’ Perceptions of the Marketing Mix and the effect on Malaysian Hypermarkets’ brand loyalty
Page 82 of 89
Price Promotion 价格优惠
No. Questions
Str
on
gly
Dis
agre
e
Dis
agre
e
Neu
tral
Agre
e
Str
on
gly
Agre
e
PP1 Price promotion of hypermarket is
frequently offered.
霸级市场经常提供价格优惠。
1 2 3 4 5
PP2 Price promotion of hypermarket is
reasonable.
霸级市场所提供的价格优惠很公道。
1 2 3 4 5
PP3 Price promotion of hypermarket is
satisfactory.
霸级市场所提供的价格优惠令人满意。
1 2 3 4 5

Customers’ Perceptions of the Marketing Mix and the effect on Malaysian Hypermarkets’ brand loyalty
Page 83 of 89
Section C:Hypermarkets’ Brand Loyalty
第三部分: 霸级市场的品牌忠诚度
Please circle your answer to each statement using 5 Points Likert Scale:
请您将最合适的一个选项圈起 :
[(1) = Strongly Disagree 非常不同意 ; (2) = Disagree 不同意 ; (3) = Neutral
中立 ; (4) = Agree 同意 and (5) = Strongly Agree 非常同意]
Hypermarkets’ Brand Loyalty 霸级市场的品牌忠诚度
No. Questions
Str
on
gly
Dis
agre
e
Dis
agre
e
Neu
tral
Agre
e
Str
on
gly
Agre
e
BL1 I would recommend others to shop in
hypermarket.
我会建议他人在霸级市场内购物。
1 2 3 4 5
BL2 I will continue to shop in hypermarket as
my primary choice.
我会继续把霸级市场视为我购物首选。
1 2 3 4 5
BL3 I will not shop in other competing stores
even if they offer cheaper price.
我不会在其他零售商购物即使他们提供
更廉价的同等商品。
1 2 3 4 5
BL4 I have shopped in hypermarket for a long
time.
我已在霸级市场购物一段时间了。
1 2 3 4 5
BL5 I anticipate having a long-term
commitment to hypermarket.
我将会长期在霸级市场购物。
1 2 3 4 5
Thank you for your time and opinion.
~ The End ~
~ 谢谢合作 ~
Source: Developed for the research

Appendix P: Summary of Past Empirical Studies
1. Summary of Past Empirical Studies on the relationship between price and brand loyalty.
Study Country Data Major Findings
Chen , 2007 Taiwan Questionnaire survey of 500
customers in Taiwan
There is negative relationship between price and brand
loyalty.
Jackson, 2010 US Questionnaire survey of 71
participants in University of
Minnesota.
Brand-loyal consumers would be willing to pay significantly
more for their preferred brands than non-loyal consumers.
Meer, 1995 US Administered Category Equity
Battery to 45,000 HTI panelists, with
respondents able to evaluate up to
three categories. Each respondent
rating a category is treated as a unit
of analysis and amounted to 70,000
cases.
There is a relationship between perceived differentiation and
superiority and the ability to command premium prices.
Sirohi, McLaughlin,
Wittink, 1998
New York Using Partial Least Squares, on data
averaged across at least 100
customers per .store for each of
about 160 stores
Service quality is by far the most critical determinant of
merchandise quality perception.
Wong & Sidek, 2008 Malaysia Questionnaire survey were
distributed and self-administered to
100 respondents
There is a positive relationship between price and brand
loyalty
2. Summary of Past Empirical Studies on the relationship between store image and brand loyalty.
Study Country Data Major Findings
Chen , 2007 Taiwan Questionnaire survey of 500
customers in Taiwan
There is positive relationship between store image and brand
loyalty.
Pag
e 84 o
f 89
Cu
stom
ers’ Percep
tion
s of th
e Mark
eting
Mix
and th
e effect on
Malay
sian H
yperm
arkets’ b
rand
loyalty

Gupta & Pirsch, 2008 USA Questionnaire survey of 460 retail
consumers
Store image affects store loyalty via store satisfaction.
Nguyen & Leblanc,
2001
US 222 consumers in retail sector, 171
clients of a major long-distance
company and 395 students of a
faculty of business administration.
Degree of customer loyalty has a tendency to be higher when
perceptions of both corporate reputation and corporate image
are strongly favorable.
Orth & Green, 2009 US Questionnaire survey of 138 students
at public university
The traditional constructs such as image are tightly
interwoven with trust and satisfaction, and can substantially
contribute to loyalty.
Sivadas & Baker-
Prewitt, 2000
USA National random telephone survey of
542 shoppers
There is direct relationship between store image and store
satisfaction rather than store loyalty
Koo, 2003 Korea Questionnaire survey of 517 discount
retail customers.
The overall attitude towards discount retail store that is
considered as an abstract and global image has strong
influence on satisfaction and loyalty. Its impact is much
stronger on loyalty than on satisfaction.
3. Summary of Past Empirical Studies on the relationship between distribution intensity and brand loyalty.
Study Country Data Major Findings
Cadeaux, 1992 US This thesis requires testing,
refinement and elaboration by
construing the frequency of new item
additions and old item deletions,
industry product volatility.
Industry product volatility may directly affect the assortment
behaviour of retailers and this indirectly affect both consumer
choices and prices.
Chen , 2007 Taiwan Questionnaire survey of 500
customers in Taiwan
There is positive relationship between distribution and brand
loyalty.
Ferris, Oliver &
Kluyer, 1989
US Analytical test on the secondary data
by using retail audit data on
distribution and market share for
Brands are not distributed and resistance to compromise is
low, choices will be made by default and preferences
compromised.
Pag
e 85 o
f 89
Cu
stom
ers’ Percep
tion
s of th
e Mark
eting
Mix
and th
e effect on
Malay
sian H
yperm
arkets’ b
rand
loyalty

nine brands of sparkling wine in a
European country.
Smith, 1992 Russian 447 questionnaires were mailed to
product managers from consumer
goods companies.
A relationship existed between distribution intensity and
customer satisfaction.
Yoo et al., 2000 US Questionnaire survey of 569 students
enrolled at a major state
university
Distribution intensity has a positive effect on perceived
quality and brand loyalty.
4. Summary of Past Empirical Studies on the relationship between advertising spending and brand loyalty.
Study Country Data Major Findings
Chen , 2007 Taiwan Questionnaire survey of 500
customers in Taiwan
There is positive relationship between advertising spending
and brand loyalty.
Cobb-Walgren, Ruble
& Donthu, 1995
US Conducted survey for hotel study
was administered to 90 evening
MBA students and cleaner study was
92 users.
Advertising spending has positive effects on brand equity and
also brand equity components.
Yang & Liao, 2004 Taiwan Questionnaire survey of 300 students
from Tatung University
Advertising spending has positively related to brand loyalty.
Yoo et al., 2000 US Questionnaire survey of 569 students
enrolled at a major state
university
High advertising are related to high brand equity.
5. Summary of Past Empirical Studies on the relationship between price promotion and brand loyalty.
Study Country Data Major Findings
Chen , 2007 Taiwan Questionnaire survey of 500
customers in Taiwan
There is positive relationship between price promotion and
brand loyalty.
Pag
e 86 o
f 89
Cu
stom
ers’ Percep
tion
s of th
e Mark
eting
Mix
and th
e effect on
Malay
sian H
yperm
arkets’ b
rand
loyalty

Gupta, 1988 US Secondary data of 100 purchase
history of coffee brand of each
household from Information
Resources, Inc.
Price promotions do not significantly affect to brand loyalty
and it’s only found to enhance temporary brand switching.
Wang, Li & Zhao,
2006
China Questionnaire survey of 1,000
mobile service consumers on
December 2006.
Price promotions would decline customers’ brand loyalty to
non-price-sensitive brand companies.
Shih, Sun & Tang,
2007
Taiwan Questionnaire survey of 200 student
of Tantung University, Taiwan
during February, 2007 to April,
2007.
There are a significant positive correlation between price
promotions and brand loyalty on bank yet negative correlation
between price promotions and brand loyalty on jeans.
Appendix Q: Operation of the model variables
Variables Items Description References
Independent Variables
Marketing Mix (MM) MM1: Price (P) P 1-3 of Section B on survey questionnaires
Interval Measurement Scale: 5 Points Likert Scale
Yoo et al., 2000
MM2: Store Image (SI) SI 1-4 of Section B on survey questionnaires
Interval Measurement Scale: 5 Points Likert Scale
Yoo et al., 2000; Wu &
Tian, 2009; Villarejo-
Ramos, 2002.
MM3: Distribution Intensity (DI) DI 1-3 of Section B on survey questionnaires
Interval Measurement Scale: 5 Points Likert Scale
Yoo et al., 2000
MM4: Advertising Spending (AS) AS 1-4 of Section B on survey questionnaires
Interval Measurement Scale: 5 Points Likert Scale
Yoo et al., 2000; Martin,
2000
MM5: Price Promotion (PP) PP 1-3 of Section B on survey questionnaires
Interval Measurement Scale: 5 Points Likert Scale
Yoo et al., 2000; Martin,
2000.
Pag
e 87 o
f 89
Cu
stom
ers’ Percep
tion
s of th
e Mark
eting
Mix
and th
e effect on
Malay
sian H
yperm
arkets’ b
rand
loyalty

Dependent Variables
Brand Loyalty (BL) BL BL 1-5 of Section C on survey questionnaires
Interval Measurement Scale: 5 Points Likert Scale
Yoo et al., 2000; Martin,
2000
Pag
e 88 o
f 89
Cu
stom
ers’ Percep
tion
s of th
e Mark
eting
Mix
and th
e effect on
Malay
sian H
yperm
arkets’ b
rand
loyalty