customer service performance report - puc · customer service performance report 2010 pennsylvania...
TRANSCRIPT
Customer ServicePerformance Report
2010
Pennsylvania Electric & Natural Gas Distribution Companies
Pennsylvania Public Utility Commission Bureau of Consumer Services

Table of Contents Introduction ................................................................................................................. 1
I. Company-Reported Performance Data
A. Telephone Access 1. Busy-Out Rate ...................................................................................................................... 4 2. Call Abandonment Rate ........................................................................................................ 6 3. Percent of Calls Answered Within 30 Seconds ..................................................................... 8
B. Billing 1. Number and Percent of Residential Bills Not Rendered Once Every Billing Period ............ 11 2. Number and Percent of Bills to Small Business Customers Not Rendered Once Every
Billing Period ....................................................................................................................... 13
C. Meter Reading 1. Number and Percent of Residential Meters Not Read by Company or Customers in Six
Months ................................................................................................................................ 14 2. Number and Percent of Residential Meters Not Read in 12 Months ................................... 17 3. Number and Percent of Residential Remote Meters Not Read in Five Years ..................... 18
D. Response to Disputes 1. Number of Residential Disputes That Did Not Receive a Response Within 30 Days ......... 20
II. Customer Transaction Survey Results
A. Reaching the Company .................................................................................... 24 B. Automated Phone Systems .............................................................................. 26 C. Company Representatives ............................................................................... 27 D. Overall Satisfaction .......................................................................................... 31
III. Conclusion ............................................................................................................. 34

Appendix A Table 1A EDC Survey Results .......................................................................................................... 35 Table 1B EDC Survey Results (continued) ....................................................................................... 35 Table 2 Overall Satisfaction with Contact: EDC Credit/Collection Calls v. Other Calls ................... 36 Table 3 Contacting an EDC ............................................................................................................ 36 Table 4 Consumer Ratings of EDC Representatives ..................................................................... 37 Table 5A Premise Visit from an EDC Field Representative .............................................................. 37 Table 5B Premise Visit (continued) ................................................................................................... 38 Table 6 Characteristics of 2010 EDC Survey Participants .............................................................. 38 Table 7 Average Number of Residential Customers ...................................................................... 39
Appendix B Table 1A NGDC Survey Results ....................................................................................................... 40 Table 1B NGDC Survey Results (continued) .................................................................................... 40 Table 2 Overall Satisfaction with Contact: NGDC Credit/Collection Calls v. Other Calls ................ 41 Table 3 Contacting an NGDC ......................................................................................................... 41 Table 4 Consumer Ratings of NGDC Representatives................................................................... 42 Table 5A Premise Visit from an NGDC Field Representative ........................................................... 42 Table 5B Premise Visit (continued) ................................................................................................... 43 Table 6 Characteristics of 2010 NGDC Survey Participants ........................................................... 43 Table 7 Average Number of Residential Customers ...................................................................... 44

1
Introduction
This comprehensive report of the Public Utility Commission (Commission) presents quality of service data for both the major Electric Distribution Companies1 (EDCs) and the major Natural Gas Distribution Companies2
The reporting requirements at § 54.155 and § 62.36 include a provision whereby BCS is to report to the Commission various statistics associated with informal consumer complaints and payment agreement requests
(NGDCs). Prior to the first comprehensive report on annual activity in 2002, the Commission produced two separate reports. This report fulfills the requirements of 52 Pa. Code § 54.156 of the EDC reporting requirements and 52 Pa. Code § 62.37 of the NGDC reporting requirements. Both provide for the Commission to annually produce a summary report on the customer service performance of the EDCs and NGDCs using the statistics collected as a result of the reporting requirements. On Dec. 3, 1996, the Electricity Generation Customer Choice and Competition Act (Act), 66 Pa. C.S. §§ 2801-2812, was enacted. The Natural Gas Choice and Competition Act (Act), 66 Pa. C.S. Chapter 22, was enacted on June 22, 1999. These acts require the EDCs and NGDCs to maintain, at a minimum, the levels of customer service that were in existence prior to the effective dates of the acts. In response, the Commission took steps to ensure the continued provision of high-quality customer service through the implementation of regulations that require the EDCs and the NGDCs to report statistics on important components of customer service, including: telephone access to the company; billing frequency; meter reading; timely response to customer disputes; and the level of customer satisfaction with the company’s handling of recent interactions with its customers (§§ 54.151- 54.156 for EDCs and §§ 62.31-62.37 for NGDCs). The Commission adopted the final rulemaking establishing Reporting Requirements for Quality of Service Benchmarks and Standards for the EDCs on April 23, 1998. The EDCs began reporting the required data to the Commission in August 1999, for the first six months of that year and followed up with a report on annual activity in February 2000. Beginning in February 2001, the EDCs began submitting annual data on telephone access, billing, meter reading and response to customer disputes. In January 2000, the companies began surveying customers who had initiated an interaction with their EDC, and the companies have continued this practice on an annual basis. The Commission adopted the final rulemaking establishing Reporting Requirements for Quality of Service Benchmarks and Standards for the NGDCs on Jan. 12, 2000. As per the regulations, NGDCs began reporting the required data to the Commission in August 2001 for the first six months of that year and followed up with a report on annual activity in February 2002. In January 2002, the companies began their surveys of customers who had initiated interactions with the companies. Beginning in February 2003, the NGDCs filed their first annual reports on telephone access, billing, meter reading and response to customer disputes. NGDCs that serve fewer than 100,000 residential accounts are not required to report statistics on the various measures required of the larger companies. The smaller NGDCs must conduct mail surveys of customers who contact them and report the survey results to the Commission. The smaller NGDCs surveyed their customers in 2010 and sent the results to the Commission in 2011. The Bureau of Consumer Services (BCS) has summarized the information supplied by the EDCs and NGDCs, including survey data, into the charts and tables that appear on the following pages.
1 Allegheny Power (Allegheny); Duquesne Light Company (Duquesne); PPL Electric Utilities, Inc. (PPL); PECO Energy Company (PECO); UGI Utilities Inc. (UGI-Electric); and the FirstEnergy companies –Metropolitan Edison Company (Met-Ed), Pennsylvania Electric Company (Penelec) and Pennsylvania Power Company (Penn Power). 2 Columbia Gas of Pennsylvania Inc. (Columbia); Equitable Gas Company (Equitable); National Fuel Gas Company (NFG); Peoples Natural Gas (Peoples); Philadelphia Gas Works (PGW); UGI Penn Natural; and UGI Utilities Inc. (UGI-Gas).

2
that consumers file with the Commission. The BCS is to report a “justified consumer complaint rate,”3 a “justified payment agreement request rate,”4 “the number of informally verified infractions of applicable statutes and regulations,”5 and an “infraction rate”6
3 A justified informal consumer complaint is a complaint where the BCS has determined that the utility did not follow Commission procedures or regulations. The justified informal consumer complaint rate is the number of justified, informal, residential consumer complaints, as determined by the BCS, per 1,000 residential customers. 4 A payment agreement request is justified where a utility did not follow Commission negotiation procedures or regulations. The justified payment agreement request rate is the number of justified payment agreement requests, as determined by the BCS, from residential customers per 1,000 residential customers. 5 An informally verified infraction is an apparent misapplication of Commission regulations as determined by the BCS through its examination of information obtained as part of its review of informal consumer complaints and payment agreement requests. 6 The infraction rate is the number of informally verified infractions, as determined by the BCS, per 1,000 residential customers.
for the EDCs and NGDCs. These statistics also are important indicators of service quality. The BCS has calculated and reported these rates for a number of years in the annual report, Utility Consumer Activities Report and Evaluation: Electric, Gas, Water and Telephone Utilities (UCARE). The BCS will report the 2010 rates noted above in the 2010 UCARE report. The report offers detailed descriptions of each of these measures, as well as a comparison with performance statistics from the previous year. Access to the 2010 Utility Consumer Activities Report and Evaluation, and the 2010 Report on Pennsylvania’s Electric and Natural Gas Distribution Companies Customer Service Performance is available on the Commission’s website: www.puc.state.pa.us.
3
I. Company-Reported Performance
In accordance with Reporting Requirements for Quality of Service Benchmarks and Standards (quality of service reporting requirements), the EDCs and the NGDCs reported statistics for 2010 regarding telephone access, billing, meter reading and disputes not responded to within 30 days. For each of the required measures, the companies report data by month and include a 12-month average. With the exception of the telephone access statistics and the small business bill information, the required statistics directly relate to the regulations in 52 Pa. Code Chapter 56 Standards and Billing Practices for Residential Utility Service.
Treatment of PECO Energy Historically, the Customer Service Performance Report has presented PECO Energy (PECO) statistics with the EDCs, although PECO’s statistics include data for both the company’s electric and natural gas accounts. PECO has three categories of customers: electric only, gas only, and those receiving both electric and gas service. The company is not able to separate and report the data by gas and electric accounts. For example, PECO’s gas and/or electric customers contact the same call center and receive only one bill per billing period. However, customers receiving electric and natural gas from PECO have two separate meters, and the company must read each one. Starting with 2004 data, the report presents PECO’s natural gas meter-reading statistics with the NGDCs separately from the company’s electric meter-reading statistics.
Treatment of the FirstEnergy Companies FirstEnergy requested BCS to report Metropolitan Edison (Met-Ed) and Pennsylvania Electric (Penelec) as separate companies beginning with 2003 data. BCS has always treated Penn Power, the third FirstEnergy Company, as a separate company. Because Met-Ed, Penelec and Penn Power use the same call center, however, the data appears under FirstEnergy in the Telephone Access Section.
Treatment of Allegheny Power On Feb. 24, 2011, the Pennsylvania Public Utility Commission (PUC) approved a joint application filed by West Penn (Allegheny Power), Trans-Allegheny Interstate Line Company (TrAILCo) and FirstEnergy to obtain approval for a change of control of Allegheny and TrAILCo. Allegheny and TrAILCo each became a wholly owned subsidiary of FirstEnergy. Subsequent to the approval, Allegheny Power began identifying itself to customers as “West Penn Power, A FirstEnergy Company.” For this year’s report, we will continue to identify the company with the name Allegheny Power, because the 2010 data collected was prior to the merger and associated name change to West Penn Power.
A. Telephone Access The quality of service reporting requirements for both the EDCs and the NGDCs include telephone access to a company, because customers must be able to readily contact their EDC or NGDC with questions, complaints and requests for service, and to report service outages and other problems. Attempted contacts to a call center initially have one of two results: They are either “received” by the company, or they receive a busy signal and thus are not “received” by the company. Calls in the “busy-out rate” represent those attempted calls that received a busy signal or message; they were not “received” by the company because the company lines or trunks were at capacity.

4
For the calls that are “received” by the company, the caller has several options. One option is to choose to speak to a company representative. When a caller chooses this option, the caller enters a queue to begin a waiting period until a company representative is available to take the call. Once a call enters the queue, it can take one of three routes: it will either be abandoned (the caller chooses not to wait and disconnects the call); it will be answered within 30 seconds; or it will be answered in a time period that is greater than 30 seconds. The percent of those calls answered within 30 seconds is reported to the Commission. In order to produce an accurate picture of telephone access, the companies must report three separate measures of telephone access: 1) percent of calls answered within 30 seconds; 2) average busy-out rate; and 3) call abandonment rate. Requiring three separate measures averts the possibility of masking telephone access problems by presenting only one or two parts of the total access picture. For example, a company could report that it answers every call in 30 seconds or less. If this were the only statistic available, one might conclude that the access to the company is very good. However, if there are only a few trunk lines into this company’s call distribution system, other callers attempting to contact the company will receive a busy signal once these trunks are at capacity. The callers that get through wait 30 seconds or less for someone to answer, but a large percentage of customers cannot get through to the company; thus, telephone access is not very good at all. Therefore, it is important to look at both percent of calls answered within 30 seconds and busy-out rates to get a clearer picture of the telephone access to the EDC or NGDC. The third measurement, call abandonment rate, indicates how many customers drop out of the queue of customers waiting to talk to a company representative. A high call abandonment rate is most likely an indication that the length of the wait to speak to a company representative is too long. Statistics on call abandonment are often inversely related to statistics measuring calls answered within 30 seconds. For the most part, the companies answering a high percent of calls within 30 seconds have low call abandonment rates, and those answering a lower percent of calls within 30 seconds have higher call abandonment rates. The 2008-10 EDC figures presented later in this report conform to the inverse relationship. In addition, the 2008-10 data reported by the NGDCs also conform to this relationship. This report presents the EDC and NGDC statistics on telephone access in the following three charts:
• Busy-Out Rate; • Call Abandonment Rate; and • Percent of Calls Answered Within 30 Seconds.
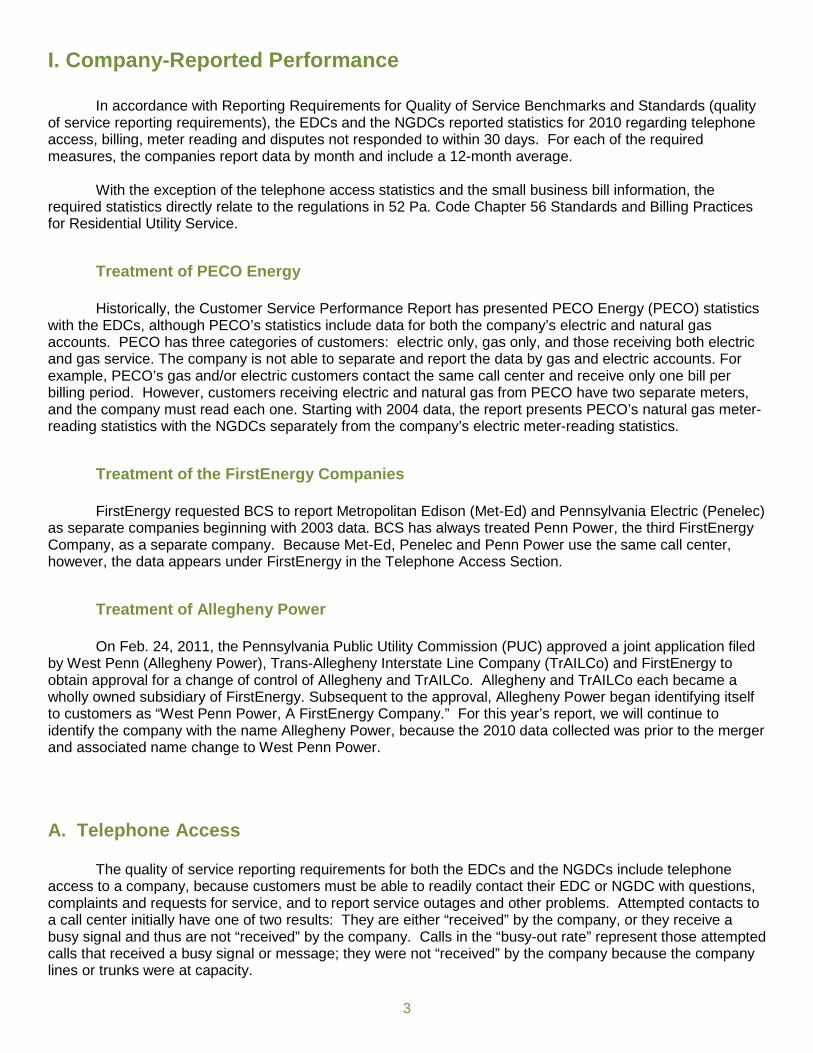
1. Busy-Out Rate The Commission’s regulations at § 54.153(b)(1)(ii) require that the EDCs are to report to the Commission the average busy-out rate for each call center or business office, as well as a 12-month cumulative average for the company. Similarly, § 62.33(b)(1)(ii) requires the NGDCs to report the average busy-out rate. Each regulation defines busy-out rate as the number of calls to a call center that receive a busy signal divided by the total number of calls received at a call center. For example, a company with a 10 percent average busy-out rate means that 10 percent of the customers who attempted to call the company received a busy signal (and thus did not gain access) while 90 percent of the customer calls were received by the company. If the company has more than one call center, it is to supply the busy-out rates for each center, as well as a combined statistic for the company as a whole.
The following chart presents the combined busy-out rate for each major EDC during 2008, 2009 and 2010. The second chart presents the combined busy-out rate for each major NGDC during 2008, 2009 and 2010.
5
EDCs Busy-Out Rate* 2008-10
*12-month average. **Met-Ed, Penelec and Penn Power use the same call center so these companies are combined under FirstEnergy. Five of the six EDCs reported a 2010 busy-out rate that is better than or equal to the 2009 rate, while one company reported a slight increase. UGI-Electric’s busy-out rate increased from 2 percent in 2009 to 3 percent in 2010; the company reported that it experienced problems with its phone system during the early part of 2010.
0% 0% 0% 0%
3%
12%
0% 0% 0% 0%
1%
2%
0% 0% 0% 0% 0%
3%
0%
2%
4%
6%
8%
10%
12%
14%
Allegheny Duquesne FirstEnergy** PECO PPL UGI-Electric
2008 2009 2010

6
NGDC Busy-Out Rate* 2008-10
*12-month average. NFG showed an improved busy-out rate in 2010. Four of the NGDCs maintained their busy-out rate from 2009 to 2010. The two companies reporting higher busy-out rates in 2010 are UGI-Gas and UGI Penn Natural Gas; UGI reported that it experienced problems with its phone system during the early part of 2010, causing the 12-month cumulative average to increase.
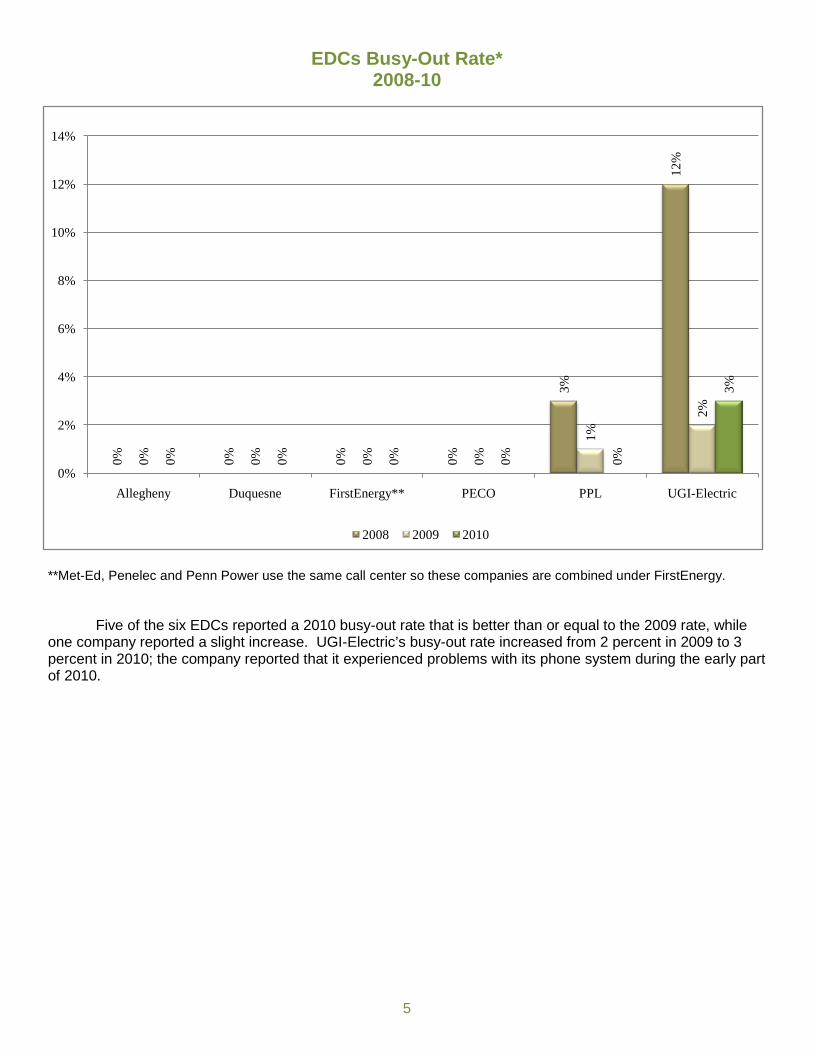
2. Call Abandonment Rate Consistent with the regulations, the EDCs and NGDCs are to report to the Commission the average call abandonment rate for each call center, business office or both. The call abandonment rate is the number of calls to a company’s call center that were abandoned divided by the total number of calls that the company received at its call center or business office (§ 54.152 and § 67.32). For example, an EDC with a 10 percent call abandonment rate means that 10 percent of the calls received were terminated by the customer prior to speaking to an EDC representative. As the time that customers spend “on hold” increases, they have a greater tendency to hang up, raising the call abandonment rates. If the EDC or NGDC has more than one call center, it is to supply the call abandonment rates for each center, as well as a combined statistic for the company as a whole.
The next chart presents the combined call abandonment rate for each major EDC during 2008, 2009 and 2010.
0% 0%
3%
0% 0%
12%
0%0% 0%
1%
0% 0%
2%
1%
0% 0% 0% 0% 0%
3% 3%
0%
2%
4%
6%
8%
10%
12%
14%
Columbia Equitable NFG Peoples PGW UGI-Gas UGI Penn Natural
2008 2009 2010
7
EDCs Call Abandonment Rate* 2008-10
*12-month average.
**Met-Ed, Penelec and Penn Power use the same call center, and so are combined under FirstEnergy. The above statistics show that three EDCs maintained their call abandonment rate from 2009 to 2010. The call abandonment rate increased for PPL, PECO and UGI-Electric. PECO explained its call abandonment rate doubled from 2009 to 2010 as a result of a call volume increase of 15 percent over 2009 levels. UGI-Electric also attributes the increase in its call abandonment rate during the early part of the year to a very high call volume. PPL reported that its higher call abandonment rate is the result of a higher-than-expected call volume in 2010.
The chart on the following page presents the call abandonment rates for the major NGDCs during 2008, 2009 and 2010.
4%
3%
2%
6%
3%
5%
3% 3%
2%
5%
3%
7%
3% 3% 3%
5%
6%
8%
0%
1%
2%
3%
4%
5%
6%
7%
8%
9%
Duquesne FirstEnergy** PPL Allegheny PECO UGI-Electric
2008 2009 2010
8
NGDC Call Abandonment Rate* 2008-10
*12-month average.
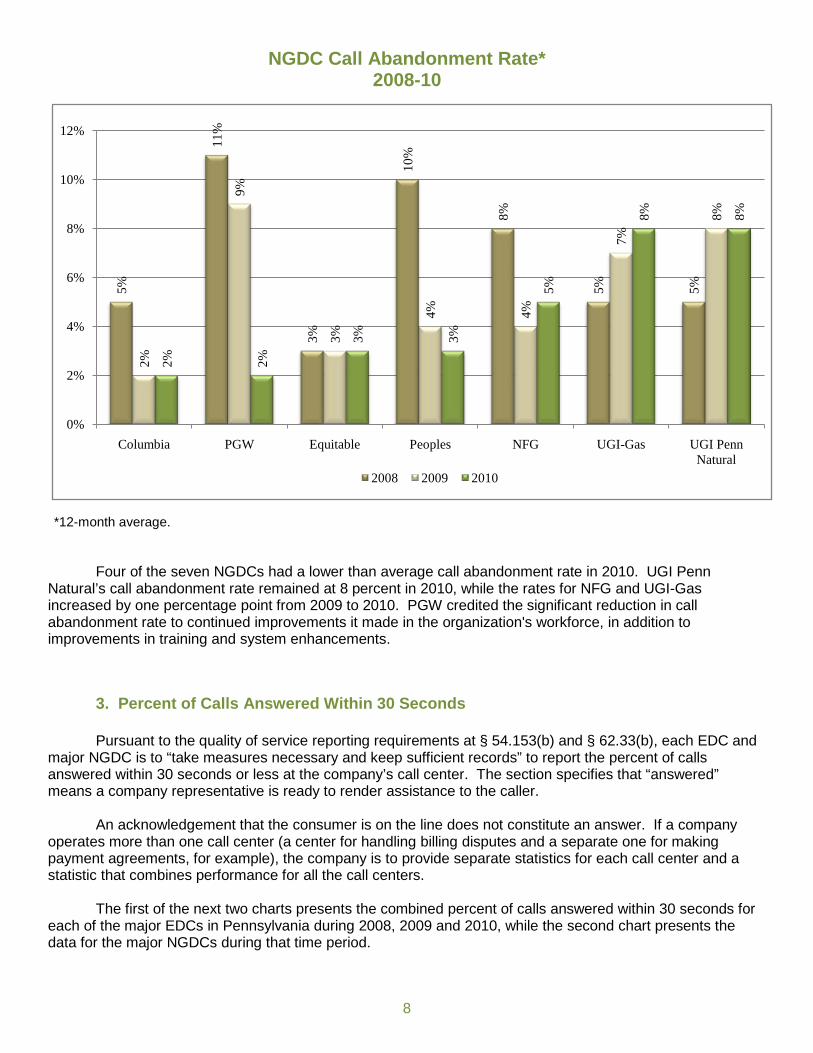
Four of the seven NGDCs had a lower than average call abandonment rate in 2010. UGI Penn Natural’s call abandonment rate remained at 8 percent in 2010, while the rates for NFG and UGI-Gas increased by one percentage point from 2009 to 2010. PGW credited the significant reduction in call abandonment rate to continued improvements it made in the organization's workforce, in addition to improvements in training and system enhancements.
3. Percent of Calls Answered Within 30 Seconds Pursuant to the quality of service reporting requirements at § 54.153(b) and § 62.33(b), each EDC and major NGDC is to “take measures necessary and keep sufficient records” to report the percent of calls answered within 30 seconds or less at the company’s call center. The section specifies that “answered” means a company representative is ready to render assistance to the caller.
An acknowledgement that the consumer is on the line does not constitute an answer. If a company operates more than one call center (a center for handling billing disputes and a separate one for making payment agreements, for example), the company is to provide separate statistics for each call center and a statistic that combines performance for all the call centers.
The first of the next two charts presents the combined percent of calls answered within 30 seconds for
each of the major EDCs in Pennsylvania during 2008, 2009 and 2010, while the second chart presents the data for the major NGDCs during that time period.
5%
11%
3%
10%
8%
5% 5%
2%
9%
3%
4% 4%
7%
8%
2% 2%
3% 3%
5%
8% 8%
0%
2%
4%
6%
8%
10%
12%
Columbia PGW Equitable Peoples NFG UGI-Gas UGI Penn Natural
2008 2009 2010

9
EDCs Percent of Calls Answered Within 30 Seconds*
2008-10
*12-month average. **Met-Ed, Penelec and Penn Power use the same call center, and so are combined under FirstEnergy. The 2010 results show improved access for two of the EDCs. Allegheny shows the greatest increase and attributes its improvement to “continued improvements in self-service capabilities of the Interactive Voice Response (IVR) coupled with a concerted effort to manage daily staffing levels.” FirstEnergy’s percent of calls answered within 30 seconds remained relatively stable from 2008 to 2010, rising slightly from 2009 to 2010. The remaining four companies reported decreases from 2009 to 2010. PECO reported the most significant decrease from 81 percent to 77 percent. The company explains that the performance decrease in all three areas of telephone access for 2010 was due to a volume increase of 15 percent over 2009 levels. PECO attributes this to three consecutive months of high customer bills due to excessive summer heat that resulted in a higher percentage of PECO customers in active collections. PPL explains that the company experienced higher-than-expected call volume levels for the following reasons: 1) significant customer interest in shopping for generation; 2) expiration of the generation rate cap; and 3) new distribution rates that became effective Jan. 1, 2010. The average of the six EDCs is 76 percent of calls answered within 30 seconds. The change in the industry average from 2008 to 2009 is slight, going from 77 percent to 76 percent and remaining at 76 percent in 2010.
81%
76%
87%
80%
80%
58%
78% 81
%
80%
78% 81
%
60%
80%
79%
78%
77%
77%
66%
0%
10%
20%
30%
40%
50%
60%
70%
80%
90%
100%
FirstEnergy** PPL UGI-Electric Duquesne PECO Allegheny
2008 2009 2010
10
NGDCs Percent of Calls Answered Within 30 Seconds*
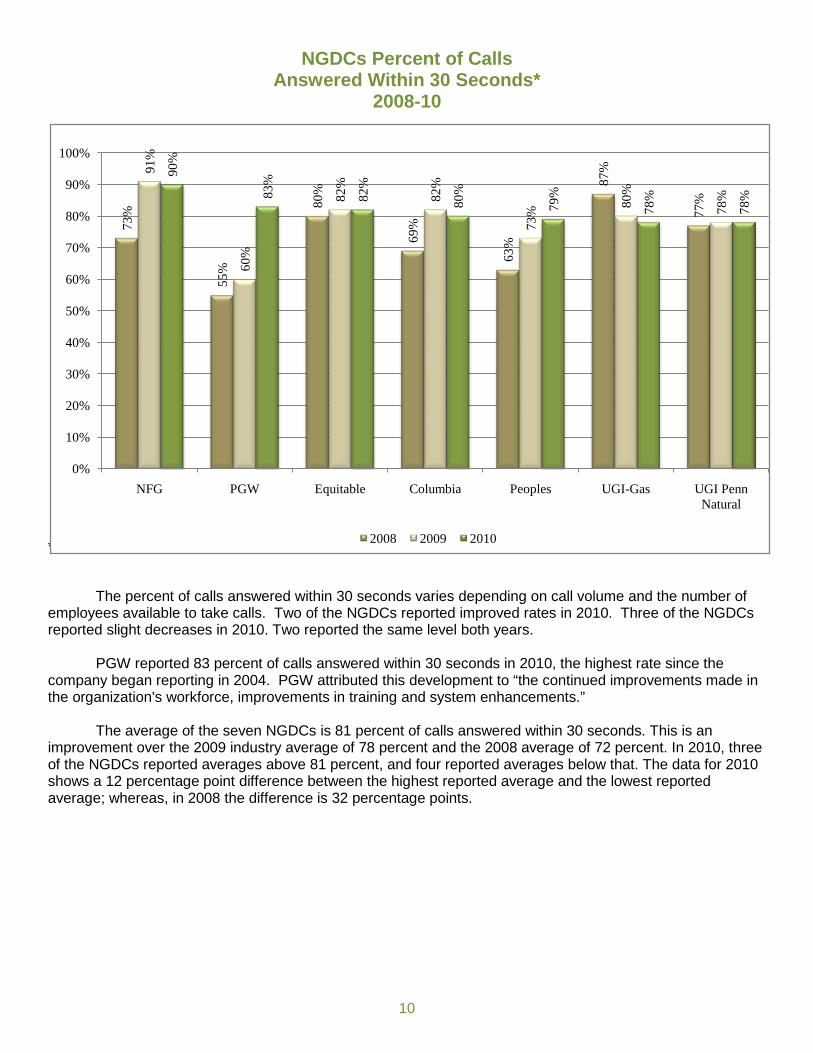
2008-10 *12-month average. The percent of calls answered within 30 seconds varies depending on call volume and the number of employees available to take calls. Two of the NGDCs reported improved rates in 2010. Three of the NGDCs reported slight decreases in 2010. Two reported the same level both years.
PGW reported 83 percent of calls answered within 30 seconds in 2010, the highest rate since the company began reporting in 2004. PGW attributed this development to “the continued improvements made in the organization's workforce, improvements in training and system enhancements.”
The average of the seven NGDCs is 81 percent of calls answered within 30 seconds. This is an
improvement over the 2009 industry average of 78 percent and the 2008 average of 72 percent. In 2010, three of the NGDCs reported averages above 81 percent, and four reported averages below that. The data for 2010 shows a 12 percentage point difference between the highest reported average and the lowest reported average; whereas, in 2008 the difference is 32 percentage points.
73%
55%
80%
69%
63%
87%
77%
91%
60%
82%
82%
73%
80%
78%
90%
83%
82%
80%
79%
78%
78%
0%
10%
20%
30%
40%
50%
60%
70%
80%
90%
100%
NFG PGW Equitable Columbia Peoples UGI-Gas UGI Penn Natural
2008 2009 2010
11
B. Billing Pursuant to 66 Pa.C.S. § 1509 and Standards and Billing Practices for Residential Utility Service (§ 56.11), a utility is to render a bill once every billing period to all customers. The customer bill is often the only communication between the company and its customer, thus underscoring the need to produce and send this fundamental statement to customers at regular intervals. When a customer does not receive a bill each month, it frequently generates consumer complaints to the company and sometimes to the Commission. The failure of a company to render a bill once every billing period also adversely affects collections performance.
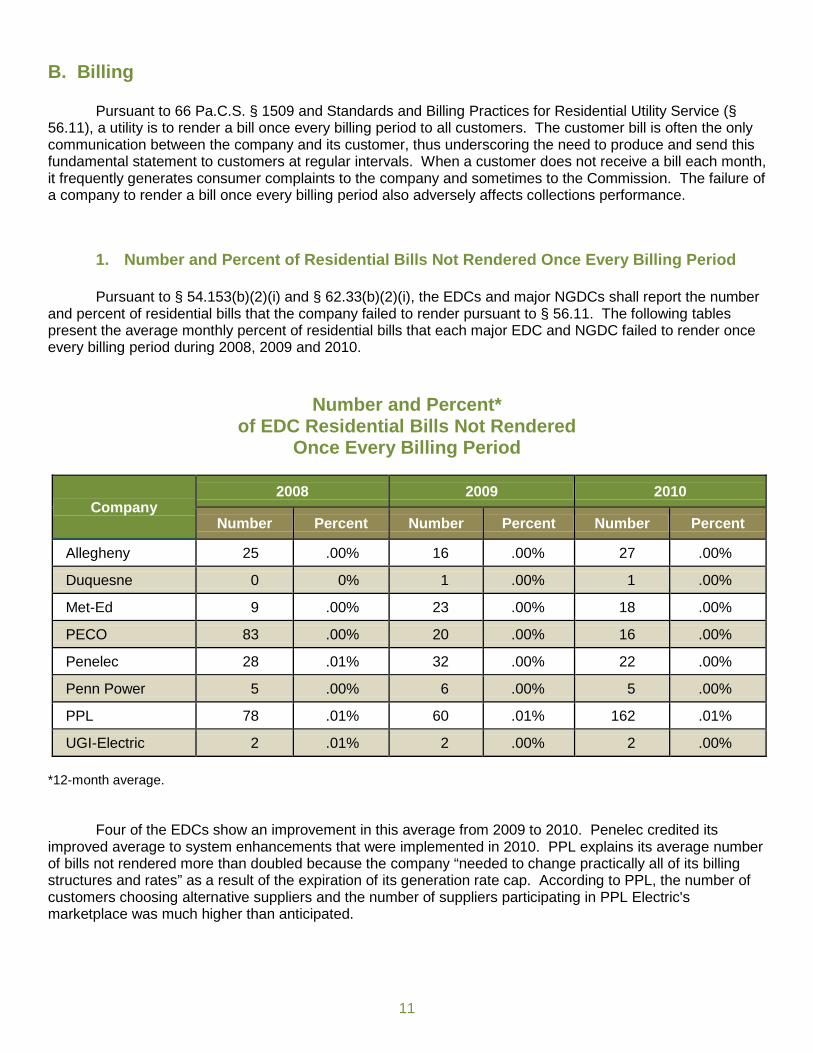
1. Number and Percent of Residential Bills Not Rendered Once Every Billing Period Pursuant to § 54.153(b)(2)(i) and § 62.33(b)(2)(i), the EDCs and major NGDCs shall report the number and percent of residential bills that the company failed to render pursuant to § 56.11. The following tables present the average monthly percent of residential bills that each major EDC and NGDC failed to render once every billing period during 2008, 2009 and 2010.
Number and Percent* of EDC Residential Bills Not Rendered
Once Every Billing Period
Company 2008 2009 2010
Number Percent Number Percent Number Percent
Allegheny 25 .00% 16 .00% 27 .00%
Duquesne 0 0% 1 .00% 1 .00%
Met-Ed 9 .00% 23 .00% 18 .00%
PECO 83 .00% 20 .00% 16 .00%
Penelec 28 .01% 32 .00% 22 .00%
Penn Power 5 .00% 6 .00% 5 .00%
PPL 78 .01% 60 .01% 162 .01%
UGI-Electric 2 .01% 2 .00% 2 .00% *12-month average. Four of the EDCs show an improvement in this average from 2009 to 2010. Penelec credited its improved average to system enhancements that were implemented in 2010. PPL explains its average number of bills not rendered more than doubled because the company “needed to change practically all of its billing structures and rates” as a result of the expiration of its generation rate cap. According to PPL, the number of customers choosing alternative suppliers and the number of suppliers participating in PPL Electric's marketplace was much higher than anticipated.

12
Number and Percent*
of NGDC Residential Bills Not Rendered Once Every Billing Period
Company
2008 2009 2010
Number Percent Number Percent Number Percent
Columbia** 4 .00% 2 .00% 2 .00%
Equitable 25 .01% 13 .00% 3 .00%
NFG 10 .02% 10 .01% 7 .00%
Peoples 26 .01% 12 .00% 7 .00%
PGW 101 .00% 93 .00% 40 .01%
UGI-Gas*** 10 .00% 0 .00% 0 .00%
UGI Penn Natural 46 .00% 2 .00% 0 0%
*12-month average. **Columbia’s numbers for 2008 are different from previous reports because of an averaging error that was identified
when analyzing the data for 2009. ***The 2009 percent was changed to .00 percent to reflect that the zero number is the average due to rounding (average
number was rounded to zero from .33). Five of the NGDCs show a decrease in the average number of bills not rendered and the remaining two NGDCs reported the same number for 2009 and 2010. UGI-Gas reported only two accounts not receiving a bill during a billing cycle in 2010, and UGI Penn Natural Gas reported zero.

13
2. Number and Percent of Bills to Small Business Customers Not Rendered Once Every Billing Period
Both the EDC and the NGDC quality of service reporting requirements require that companies report the number and percent of small business bills the companies failed to render in accordance with 66 Pa.C.S. § 1509. The reporting requirements at 52 Pa. Code § 54.152 (relating to definitions) define a small business customer as a person, sole proprietorship, partnership, corporation, association or other business that receives electric service under a small commercial, industrial or business rate classification. In addition, the maximum registered peak load for the small business customer must be less than 25 kilowatt hours within the last 12 months. Meanwhile, the NGDC reporting requirements at 52 Pa. Code § 62.32 (relating to definitions) define a small business customer as a person, sole proprietorship, partnership, corporation, association or other business whose annual gas consumption does not exceed 300,000 cubic feet (mcf). The tables on the following page show the average number and percent of small business customers the major EDCs and NGDCs did not bill according to statute.
Number and Percent* of EDC Bills to Small Business Customers Not Rendered Once Every Billing Period
Company 2008 2009 2010
Number Percent Number Percent Number Percent
Allegheny 19 .02% 11 .01% 19 .01%
Duquesne 0 0% 0 0% 0 0%
Met-Ed 7 .01% 11 .00% 6 .01%
PECO 43 .03% 6 .00% 5 .00%
Penelec 7 .01% 13 .00% 9 .01%
Penn Power 2 .01% 3 .00% 2 .01%
PPL 59 .03% 34 .02% 96 .06%
UGI-Electric 1 .01% 0 .00% 0 .00% *12-month average. Four of the EDCs reported an improvement in this performance metric from 2009 to 2010. Duquesne and UGI-Electric maintained the average reported the previous year. Two companies, PPL and Allegheny, reported a higher average number of bills not rendered to small business customers in 2010 than in 2009. PPL attributed the increase to the same reason that residential bills were not rendered: the expiration of PPL Electric's generation rate cap requiring that the company change “practically all of its billing structures and rates.”

14
Number and Percent* of NGDC Bills to Small Business Customers
Not Rendered Once/Billing Period
Company 2008 2009 2010
Number Percent Number Percent Number Percent
Columbia** 0 .00% 0 .00% 0 0%
Equitable 4 .03% 1 .01% 1 .00%
NFG 0 .00% 1 .00% 1 .01%
Peoples 3 .02% 2 .01% 0 .00%
PGW 4 .19% 3 .16% 3 .15%
UGI-Gas 1 .01% 0 .00% 0 .00%
UGI Penn Natural 0 0% 1 .00% 0 .00% *12-month average.
**Columbia’s numbers for 2008 are different from previous reports because of an averaging error that was identified when
analyzing the data for 2009. Peoples and UGI Penn Natural reported an improved average in the number of bills not rendered to small business customers. The average reported by the remaining NGDCs did not change.
C. Meter Reading Regular meter reading is important in order to produce accurate bills for customers who expect to receive bills based on the amount of service they have used. The Commission’s experience is that the lack of actual meter readings generates complaints to companies, as well as to the Commission. In both of the Final Rulemaking Orders establishing Reporting Requirements for Quality of Service Benchmarks and Standards [L-00000147 and L-970131], the Commission stated its concern that regular meter reading may be one of the customer service areas where EDCs and NGDCs might, under competition, reduce the level of service. The quality of service reporting requirements include three measures of meter-reading performance that correspond with the meter-reading requirements of the Chapter 56 regulations at § 56.12(4)(ii), § 56.12(4)(iii) and § 56.12(5)(i).
1. Number and Percent of Residential Meters Not Read By Company or Customer in
Six Months Pursuant to § 56.12(4)(ii), a utility may estimate the bill of a residential ratepayer if utility personnel are unable to gain access to obtain an actual meter reading. However, at least every six months, the utility must obtain an actual meter reading or ratepayer-supplied reading to verify the accuracy of prior estimated bills. The quality of service reporting requirements at § 54.153(b)(3)(i) require EDCs to report the number and percent of residential meters the company has not read in accordance with § 56.12(4)(ii). The results are compiled in the next table.

15
Number and Percent* of EDC Residential Meters Not Read
by Company or Customer in Six Months
Company 2008 2009 2010
Number Percent Number Percent Number Percent
Allegheny 111 .02% 90 .01% 400 .06%
Duquesne 2 .00% 2 .00% 1 .00%
Met-Ed 392 .08% 464 .10% 433 .09%
PECO 639 .04% 443 .03% 15 .00%
Penelec 287 .06% 316 .06% 260 .05%
Penn Power 29 .02% 72 .05% 76 .05%
PPL 20 .00% 32 .00% 75 .01%
UGI-Electric 8 .02% 0 0% 0 0% *12-month average.
Four of the eight EDCs – Duquesne, Met-Ed, PECO and Penelec – show improvement in this measure. PECO credits its marked improvement to its “aggressive strategy to obtain access for meter maintenance and readings which included the termination notice process.” According to the company, this strategy resulted in access being provided prior to actual termination of service in most cases.
Penn Power, PPL and Allegheny show an increase in the number of residential meters not read by the company or customer in six months.

16
Number and Percent* of NGDC Residential Meters Not Read
by Company or Customer in Six Months
Company 2008 2009 2010
Number Percent Number Percent Number Percent
Columbia 763 .20% 607 .16% 665 .17%
Peoples 850 .26% 703 .22% 518 .14%
Equitable 88 .04% 82 .04% 11 .00%
NFG 767 .39% 389 .20% 314 .16%
PECO (Gas) 285 .06% 139 .03% 4 .00%
PGW 286 .06% 257 .06% 291 .06%
UGI-Gas 111 .03% 33 .01% 19 .01%
UGI Penn Natural 0 0% 30 .02% 17 .01% *12-month average. The Reporting Requirements for Quality of Service Benchmarks and Standards at § 62.33(b)(3)(i) require the major NGDCs to report the number and percent of residential meters for which the company has failed to obtain an actual or ratepayer supplied meter reading within the past six months as required under § 56.12(4)(ii). The table above presents the data that the companies reported for 2008, 2009 and 2010. Six of the eight NGDCs report improvement in this measure. PECO (Gas) reduced the average number of residential meters not read as required by § 56.12(4)(ii) by 97 percent from 139 in 2009 to four in 2010. Equitable reduced the average number of residential meters not read as required by § 56.12(4)(ii) by 87 percent from 82 in 2009 to 11 in 2010. Equitable explains that it “continues to leverage the investment in Automatic Meter Reading (AMR) devices.” Equitable adds that the improvement is also a result of its “focus on earlier identification of locations and/or meters that could not be read electronically.”
17
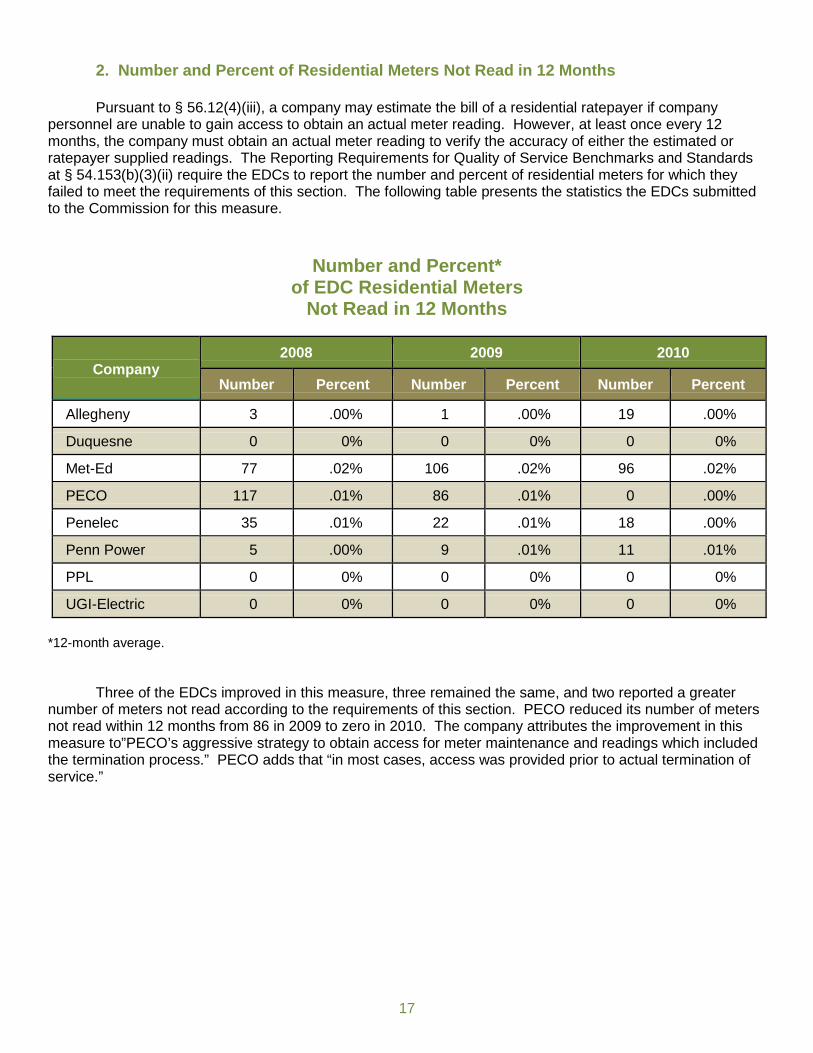
2. Number and Percent of Residential Meters Not Read in 12 Months Pursuant to § 56.12(4)(iii), a company may estimate the bill of a residential ratepayer if company personnel are unable to gain access to obtain an actual meter reading. However, at least once every 12 months, the company must obtain an actual meter reading to verify the accuracy of either the estimated or ratepayer supplied readings. The Reporting Requirements for Quality of Service Benchmarks and Standards at § 54.153(b)(3)(ii) require the EDCs to report the number and percent of residential meters for which they failed to meet the requirements of this section. The following table presents the statistics the EDCs submitted to the Commission for this measure.
Number and Percent*
of EDC Residential Meters Not Read in 12 Months
Company 2008 2009 2010
Number Percent Number Percent Number Percent
Allegheny 3 .00% 1 .00% 19 .00%
Duquesne 0 0% 0 0% 0 0%
Met-Ed 77 .02% 106 .02% 96 .02%
PECO 117 .01% 86 .01% 0 .00%
Penelec 35 .01% 22 .01% 18 .00%
Penn Power 5 .00% 9 .01% 11 .01%
PPL 0 0% 0 0% 0 0%
UGI-Electric 0 0% 0 0% 0 0% *12-month average. Three of the EDCs improved in this measure, three remained the same, and two reported a greater number of meters not read according to the requirements of this section. PECO reduced its number of meters not read within 12 months from 86 in 2009 to zero in 2010. The company attributes the improvement in this measure to”PECO’s aggressive strategy to obtain access for meter maintenance and readings which included the termination process.” PECO adds that “in most cases, access was provided prior to actual termination of service.”

18
Number and Percent* of NGDC Residential Meters
Not Read in 12 Months
Company 2008 2009 2010
Number Percent Number Percent Number Percent
Columbia 244 .06% 210 .05% 220 .05%
Peoples 103 .03% 96 .03% 106 .01%
Equitable 34 .01% 28 .01% 0 .00%
NFG 836 .43% 73 .04% 31 .02%
PECO (Gas) 66 .02% 36 .01% 0 0%
PGW 95 .00% 71 .00% 97 .02%
UGI-Gas 41 .01% 3 .00% 1 .00%
UGI Penn Natural 0 0% 7 .00% 10 .01% *12-month average. For the NGDCs, the quality of service reporting requirements at § 62.33(b)(3)(ii) require the major NGDCs to report the number and percent of residential meters for which the company failed to obtain an actual meter reading within the past 12 months. This is the fourth year that the report presents PECO’s natural gas meter-reading data separately from its electric meter-reading data.
Half of the NGDCs show improvement in the number of meters not read within 12 months. According to PECO, its performance in this measure shows significant improvement due to its “aggressive strategy to obtain access for meter maintenance and readings which included the termination process.” PECO adds that “in most cases, access was provided prior to actual termination.”
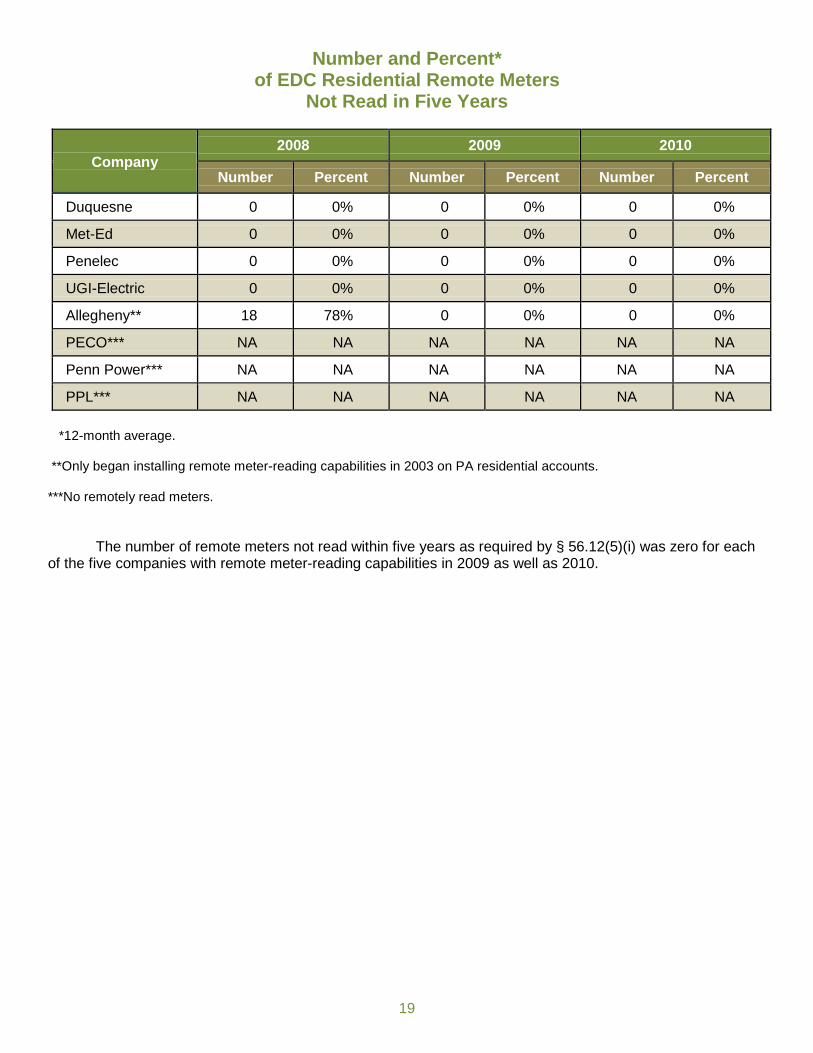
3. Number and Percent of Residential Remote Meters Not Read in Five Years Pursuant to §56.12(5)(i), a utility may render a bill on the basis of readings from a remote reading device. However, the utility must obtain an actual meter reading at least once every five years to verify the accuracy of the remote reading device. Under the quality of service reporting requirements at § 54.153(b)(3)(iii) and § 62.33(b)(3)(iii), each EDC and major NGDC must report to the Commission the number and percent of residential remote meters for which it failed to obtain an actual meter reading under the timeframe described in Chapter 56. The following tables show the data as reported by the major companies. However, the accuracy of the data in the tables regarding remote reading devices cannot be verified. Although the Commission has defined remote meter reading devices and direct interrogation devices, there is still a question whether certain meters qualify as direct interrogation devices.
19
Number and Percent* of EDC Residential Remote Meters
Not Read in Five Years
Company 2008 2009 2010
Number Percent Number Percent Number Percent
Duquesne 0 0% 0 0% 0 0%
Met-Ed 0 0% 0 0% 0 0%
Penelec 0 0% 0 0% 0 0%
UGI-Electric 0 0% 0 0% 0 0%
Allegheny** 18 78% 0 0% 0 0%
PECO*** NA NA NA NA NA NA
Penn Power*** NA NA NA NA NA NA
PPL*** NA NA NA NA NA NA *12-month average. **Only began installing remote meter-reading capabilities in 2003 on PA residential accounts. ***No remotely read meters. The number of remote meters not read within five years as required by § 56.12(5)(i) was zero for each of the five companies with remote meter-reading capabilities in 2009 as well as 2010.
20
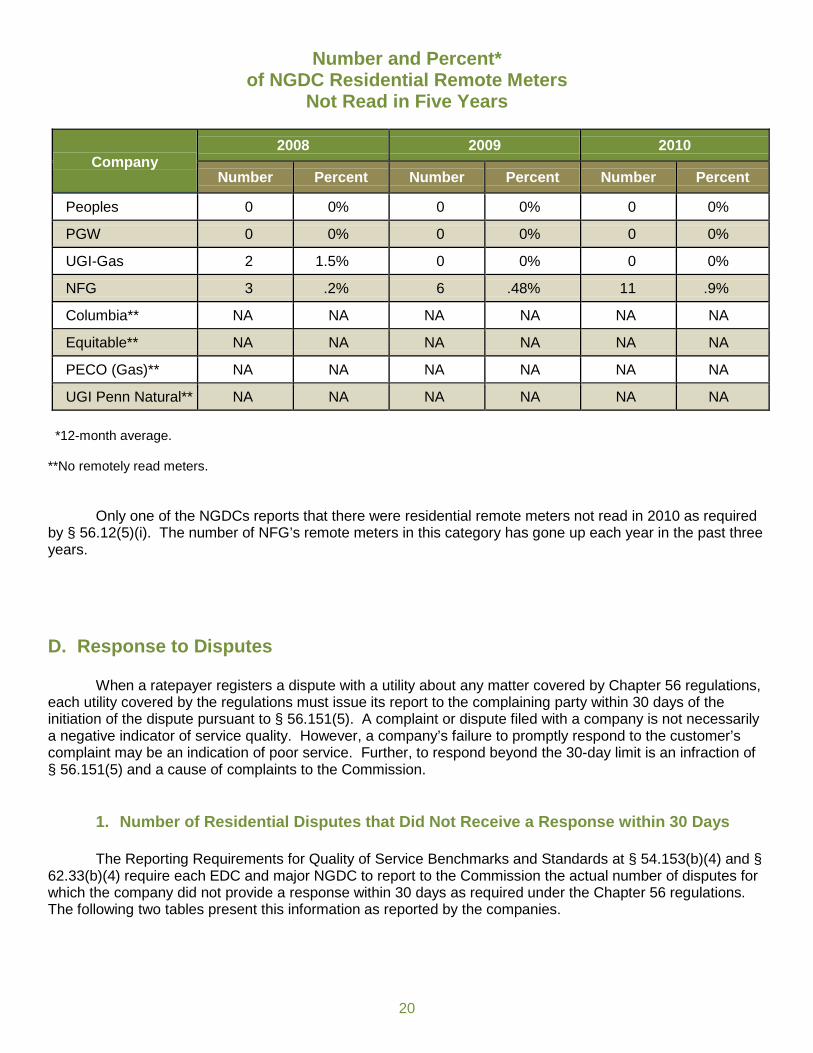
Number and Percent* of NGDC Residential Remote Meters
Not Read in Five Years
Company 2008 2009 2010
Number Percent Number Percent Number Percent
Peoples 0 0% 0 0% 0 0%
PGW 0 0% 0 0% 0 0%
UGI-Gas 2 1.5% 0 0% 0 0%
NFG 3 .2% 6 .48% 11 .9%
Columbia** NA NA NA NA NA NA
Equitable** NA NA NA NA NA NA
PECO (Gas)** NA NA NA NA NA NA
UGI Penn Natural** NA NA NA NA NA NA *12-month average. **No remotely read meters. Only one of the NGDCs reports that there were residential remote meters not read in 2010 as required by § 56.12(5)(i). The number of NFG’s remote meters in this category has gone up each year in the past three years.
D. Response to Disputes When a ratepayer registers a dispute with a utility about any matter covered by Chapter 56 regulations, each utility covered by the regulations must issue its report to the complaining party within 30 days of the initiation of the dispute pursuant to § 56.151(5). A complaint or dispute filed with a company is not necessarily a negative indicator of service quality. However, a company’s failure to promptly respond to the customer’s complaint may be an indication of poor service. Further, to respond beyond the 30-day limit is an infraction of § 56.151(5) and a cause of complaints to the Commission.
1. Number of Residential Disputes that Did Not Receive a Response within 30 Days
The Reporting Requirements for Quality of Service Benchmarks and Standards at § 54.153(b)(4) and § 62.33(b)(4) require each EDC and major NGDC to report to the Commission the actual number of disputes for which the company did not provide a response within 30 days as required under the Chapter 56 regulations. The following two tables present this information as reported by the companies.

21
Number of EDC Residential Disputes
That Did Not Receive a Response Within 30 Days
Company 2008 2009 2010
Allegheny 15 15 14
Duquesne 27 12 13
Met-Ed 2 2 11
PECO 35 0 0
Penelec 2 1 12
Penn Power 2 1 5
PPL 145 72 99
UGI-Electric 0 4 0 Two of the eight EDCs reported a decrease in the number of disputes not responded to within 30 days, and one reported the same number from 2009 to 2010. PECO and UGI-Electric reported zero disputes not answered within 30 days in 2010.
Five companies reported an increase in disputes not responded to within 30 days. PPL indicates that the reason for the increase is due to a high volume of calls and a delay in re-billing both caused by the expiration of the rate cap and a significant increase in customers shopping for suppliers.
22
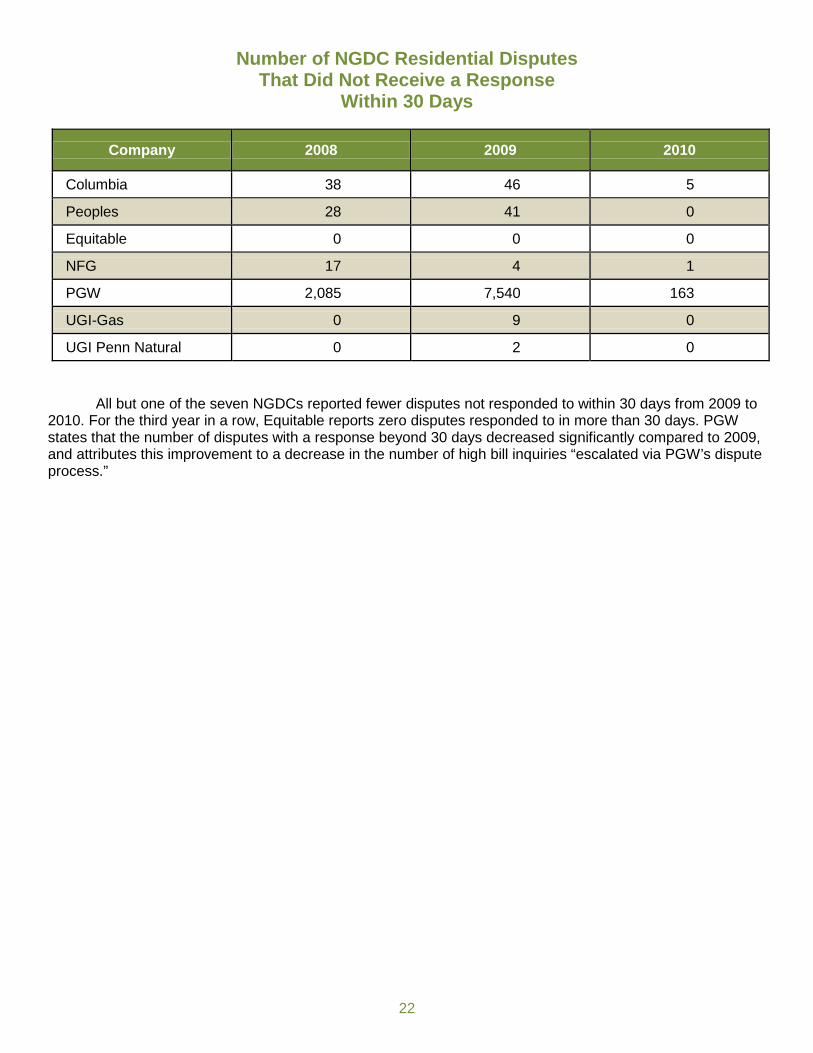
Number of NGDC Residential Disputes That Did Not Receive a Response
Within 30 Days
Company 2008 2009 2010
Columbia 38 46 5
Peoples 28 41 0
Equitable 0 0 0
NFG 17 4 1
PGW 2,085 7,540 163
UGI-Gas 0 9 0
UGI Penn Natural 0 2 0 All but one of the seven NGDCs reported fewer disputes not responded to within 30 days from 2009 to 2010. For the third year in a row, Equitable reports zero disputes responded to in more than 30 days. PGW states that the number of disputes with a response beyond 30 days decreased significantly compared to 2009, and attributes this improvement to a decrease in the number of high bill inquiries “escalated via PGW’s dispute process.”

23
II. Customer Transaction Survey Results
In conformance with the Reporting Requirements for Quality of Service Benchmarks and Standards at § 54.154 for the EDCs and § 62.34 for the major NGDCs, the companies are to report to the Commission the results of telephone transaction surveys of customers who have had interactions with the company. The purpose of the transaction surveys is to assess the customer’s perception regarding this recent interaction. The regulations specify that the survey questions are to measure access to the company, employee courtesy, employee knowledge, promptness of the EDC or NGDC response or visit, timeliness of the company response or visit, and satisfaction with the handling of the interaction. The EDCs and NGDCs must carry out the transaction survey process using survey questionnaires and procedures that provide the Commission with uniform data to directly compare customer service performance among EDCs and NGDCs in Pennsylvania. A survey working group composed of EDC representatives and Commission staff designed the EDC survey questionnaire and survey procedures in 1999. The first surveys of EDC customers were conducted in 2000. In 2001, the NGDCs formed a survey working group to design the survey questionnaire and survey procedures. The NGDCs agreed to use the same basic survey as the EDCs with similar procedures. The survey of NGDC customers was conducted for the first time in 2002. Both working groups decided that the focus of the surveys should be on residential and small business customers who have recently contacted their company. The working groups agreed that industrial customers and large commercial customers should not be included in the survey since these large customers have specific representatives within their respective companies with whom they discuss any problems, concerns and issues, and thus should be excluded from the survey. For both the EDCs and the NGDCs, the survey sample also excludes all transactions that result from company outbound calling programs or other correspondence. However, transactions with consumers who use a company’s automated telephone system exclusively, as well as those who contact their company by personal visit, are eligible to be surveyed. This is the seventh year that all of the major EDCs and NGDCs used a common survey company. This report also presents PGW survey data for the seventh year. Each month, the EDCs and NGDCs randomly select a sample of transaction records for consumers who have contacted them within the past 30 days. The companies transmit the sample lists to the research firm. The research firm randomly selects individual consumers from the sample lists. The survey firm contacts individual consumers in the samples until it meets a monthly quota of completed surveys for each company. Each year, the survey firm completes approximately 700 surveys for each EDC or NGDC. With a sample of this size, there is a 95 percent probability the results have a statistical precision of plus or minus five percentage points of what the results would be if all customers, who had contacted their EDC or NGDC, had been surveyed. Thus, the sampling plan meets the requirements of § 54.154(5) and § 62.34(5) that specify that the survey results must be statistically valid within plus or minus 5 percent.
24
Survey working group members from both industries agreed the 700 completed surveys should include 200 contacts about credit and collection issues, and 500 contacts about all other types of issues. Under this plan, the credit and collection contacts do not dominate survey results. Credit and collection contacts are from customers who need to make payment agreements, customers who received termination notices or had service terminated, those who are requested to pay security deposits, and others with bill payment problems. Consumer contacts about other issues include calls about billing questions and disputes, installation of service requests, metering problems, outage reporting, questions about choosing an alternative supplier, and a variety of other reasons. This report summarizes the 2008-10 EDC survey data and the 2008-10 NGDC survey data into the charts and tables that appear later in this chapter and in the appendices. For the EDCs, the chapter presents the results from the 2010 surveys while Appendix A presents a comparison of results from the past three years. Appendix A also includes additional details of the EDC survey results. Appendix B presents a comparison of the NGDC survey results from the past three years. Both Appendix A and B provide information about the number and type of consumers who participated in the 2010 surveys, as well as the average number of residential customers each EDC and NGDC serve. In all charts and tables related to the surveys, “don’t know” and “refused” responses to survey questions were removed from the analysis.
Treatment of Equitable Gas Due to a sampling error, Equitable’s 2009 survey data varies from standard protocols and is inconsistent with past years’ data and with other companies’ data for 2009 and, as such, is problematic. Case selection and sampling need to be sufficiently uniform to ensure that the Commission can directly compare customer service performance among the utilities. Because of a modification that Equitable made to its call center data codes, the extract program did not select a large percentage of the contacts for the sample. Only the more complex transactions were targeted for sampling, negatively skewing the results. Each month in 2009, the sample lists that Equitable transmitted to the research firm for further sampling represented only 5 percent of the transactions normally selected. The problem has been corrected, but all of the 2009 survey data for Equitable was impacted by the error as was the survey data for the first three months of 2010. On April 14, 2011, the Public Utility Commission granted Equitable Gas Company, LLC’s petition for limited waiver of customer survey reporting requirements pursuant to 52 Pa. Code § 62.34. The limited waiver of the customer survey requirement allowed Equitable to include only the data from June 2010 through December 2010 in its customer survey report. Please keep this in mind when viewing the NGDC survey tables on the following pages, as well as in Appendix B.
A. Reaching the Company One of the first survey questions in each of the surveys asks the consumer “How satisfied were you with the ease of reaching the EDC or the NGDC?” The bar charts that follow present the percent of consumers who indicated satisfaction with the initial stage of their contact with the company. The Commission believes a company should offer reasonable telephone access to its customers. Customers must be able to readily contact their company with questions, complaints and requests for service, and to report service outages and other service problems. For 2010, the average of the percentages of EDC customers who responded that they were either “satisfied” or “somewhat satisfied” with the ease of reaching the company is 89 percent. Survey results from the 2009 and 2008 surveys are available in Appendix A, Table 1. For NGDCs, the average of the percentages of NGDC consumers who responded that they were either “satisfied” or “somewhat satisfied” with the ease of reaching the company is 84 percent. The NGDC survey results from the 2009 and 2008 surveys are available in Appendix B, Table 1.

25
Satisfaction with Ease of Reaching EDC
2010
Satisfaction with Ease of Reaching NGDC
2010 *See explanation on Page 24.
58%
63%
61%
66%
71%
75%
76%
16%
17%
21%
18%
15%
15%
15%
0% 10% 20% 30% 40% 50% 60% 70% 80% 90% 100%
PGW
Peoples
Equitable*
UGI-Gas
UGI Penn Natural
Columbia
NFG
Very Satisfied Somewhat Satisfied
91%
90%
86%
84%
82%
80%
74%
53%
58%
68%
65%
68%
73%
71%
71%
28%
27%
21%
25%
23%
19%
22%
23%
0% 10% 20% 30% 40% 50% 60% 70% 80% 90% 100%
Allegheny
PECO
Penn Power
Met-Ed
Duquesne
UGI-Electric
PPL
Penelec
Very Satisfied Somewhat Satisfied
94%
93%
92%
91%
90%
89%
85%
81%

26
B. Automated Phone Systems Survey interviewers ask consumers other questions about the preliminary stages of their contact with the EDC or NGDC. All of the EDCs and all but one of the NGDCs use an automated telephone system to filter calls, and save time and money when dealing with consumer calls (NFG is the one company that does not use an automated telephone system at its call center). The surveys ask consumers several questions about their experience with using the automated systems. The charts that follow present the level of satisfaction consumers expressed about using the EDC or NGDC automated telephone systems.
Satisfaction with Using EDC’s Automated Phone System
2010
On average, 80 percent of EDC consumers reported being either “very satisfied” or “somewhat satisfied” with the EDCs’ automated phone system. Appendix A, Table 3, presents other details of how consumers perceive using an EDC’s automated phone systems. The following chart presents the survey findings regarding the perceptions of NGDC consumers regarding the NGDC telephone systems. It shows that, for the major NGDCs, 71 percent of NGDC consumers reported satisfaction with using the automated systems. NFG does not use an automated phone system to route consumer calls so is not included in the chart. Appendix B, Table 3, presents other details of how customers perceive using an NGDC’s automated phone system.
43%
47%
48%
52%
52%
49%
54%
60%
30%
28%
32%
29%
29%
33%
30%
24%
0% 10% 20% 30% 40% 50% 60% 70% 80% 90% 100%
Allegheny
Penn Power
PECO
PPL
Duquesne
Met-Ed
Penelec
UGI-Electric
Very Satisfied Somewhat Satisfied
84%
84%
82%
81%
81%
80%
75%
73%
27
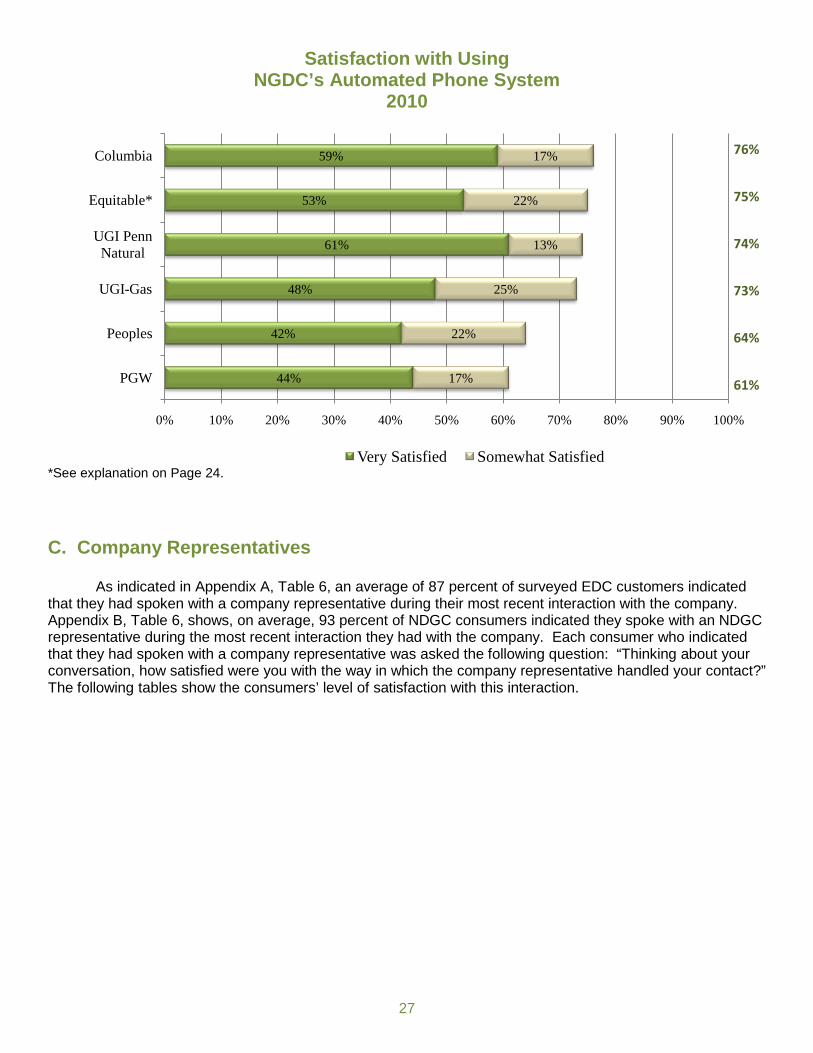
Satisfaction with Using NGDC’s Automated Phone System
2010
*See explanation on Page 24.
C. Company Representatives As indicated in Appendix A, Table 6, an average of 87 percent of surveyed EDC customers indicated that they had spoken with a company representative during their most recent interaction with the company. Appendix B, Table 6, shows, on average, 93 percent of NDGC consumers indicated they spoke with an NDGC representative during the most recent interaction they had with the company. Each consumer who indicated that they had spoken with a company representative was asked the following question: “Thinking about your conversation, how satisfied were you with the way in which the company representative handled your contact?” The following tables show the consumers’ level of satisfaction with this interaction.
44%
42%
48%
61%
53%
59%
17%
22%
25%
13%
22%
17%
0% 10% 20% 30% 40% 50% 60% 70% 80% 90% 100%
PGW
Peoples
UGI-Gas
UGI Penn Natural
Equitable*
Columbia
Very Satisfied Somewhat Satisfied
76%
75%
74%
73%
64%
61%

28
Satisfaction with EDC Representative’s Handling of the Contact
2010
On average in 2010, 92 percent of EDC consumers indicated being either “somewhat satisfied” or “very satisfied” with the way the company representative handled the consumer contact. Appendix A, Table 1B, provides results from 2008 through 2010 regarding consumer satisfaction with how EDC representatives handled the contact to the EDC. The following chart shows that in 2010, on average, 87 percent of NGDC consumers indicated they were either “somewhat satisfied” or “very satisfied” with the way the company representative handled the interaction. Appendix B, Table 1B, provides results from 2008 through 2010 regarding consumer satisfaction with how NGDC representatives handled the contact to the NGDC.
75%
73%
80%
80%
82%
79%
83%
85%
13%
16%
10%
13%
11%
14%
11%
10%
0% 10% 20% 30% 40% 50% 60% 70% 80% 90% 100%
PECO
Allegheny
UGI-Electric
Met-Ed
Duquesne
Penn Power
PPL
Penelec
Very Satisfied Somewhat Satisfied
95%
94%
94%
93%
93%
90%
89%
88%

29
Satisfaction with NGDC Representative’s Handling of the Contact
2010
*See explanation on Page 24. A consumer’s overall rating of satisfaction with the company representative’s handling of the contact may be influenced by several factors, including the courtesy and knowledge of the representatives. The reporting requirements specify the transaction survey questionnaire must measure consumers’ perceptions of employee courtesy and knowledge. The following tables show the EDC and NGDC consumers’ 2010 ratings of these attributes of the company representatives with whom they interacted. Appendix A, Table 4, provides a comparison of 2008, 2009 and 2010 ratings of EDC representatives. Appendix B, Table 4, provides a comparison of 2008, 2009 and 2010 ratings of NGDC representatives.
71%
73%
72%
76%
80%
81%
83%
14%
12%
14%
11%
9%
8%
8%
0% 10% 20% 30% 40% 50% 60% 70% 80% 90% 100%
PGW
UGI-Gas
Peoples
Equitable*
NFG
UGI Penn Natural
Columbia
Very Satisfied Somewhat Satisfied
91%
89%
89%
87%
86%
85%
85%
30
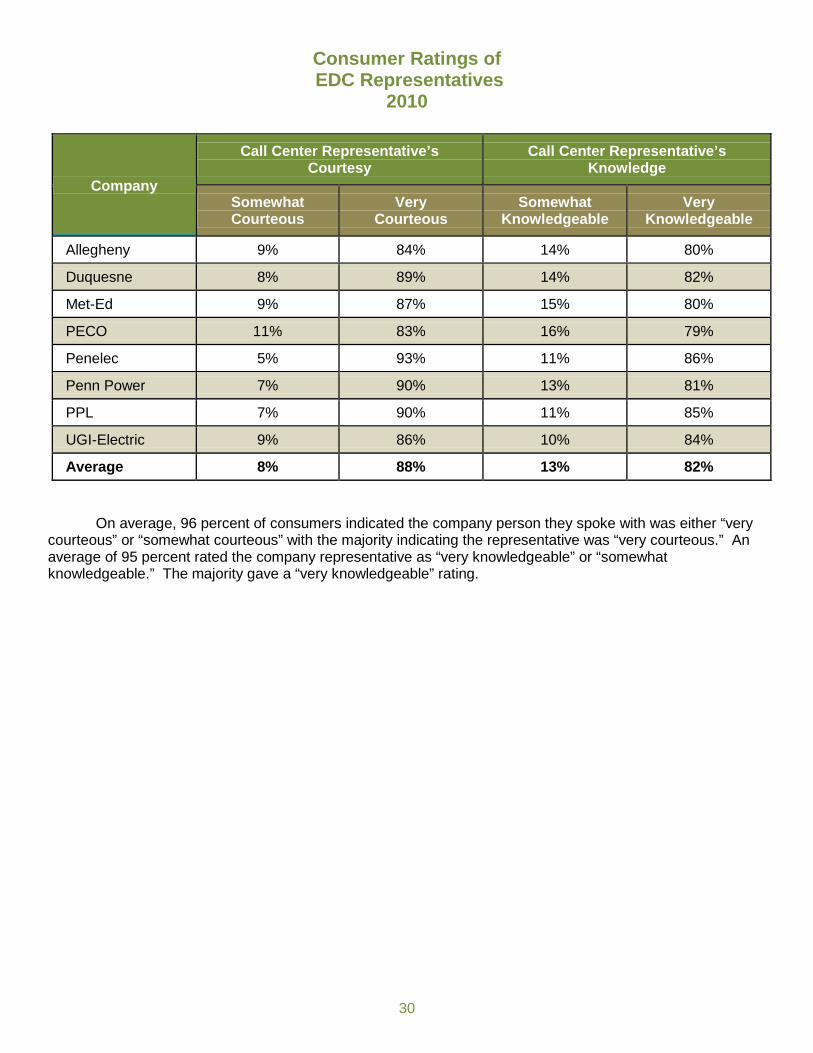
Consumer Ratings of EDC Representatives
2010
Company
Call Center Representative’s Courtesy
Call Center Representative’s Knowledge
Somewhat Courteous
Very Courteous
Somewhat Knowledgeable
Very Knowledgeable
Allegheny 9% 84% 14% 80%
Duquesne 8% 89% 14% 82%
Met-Ed 9% 87% 15% 80%
PECO 11% 83% 16% 79%
Penelec 5% 93% 11% 86%
Penn Power 7% 90% 13% 81%
PPL 7% 90% 11% 85%
UGI-Electric 9% 86% 10% 84%
Average 8% 88% 13% 82% On average, 96 percent of consumers indicated the company person they spoke with was either “very courteous” or “somewhat courteous” with the majority indicating the representative was “very courteous.” An average of 95 percent rated the company representative as “very knowledgeable” or “somewhat knowledgeable.” The majority gave a “very knowledgeable” rating.

31
Consumer Ratings of NGDC Representatives
2010
Company
Call Center Representative’s Courtesy
Call Center Representative’s Knowledge
Somewhat Courteous
Very Courteous
Somewhat Knowledgeable
Very Knowledgeable
Columbia 6% 89% 9% 84%
Peoples 10% 81% 12% 76%
Equitable* 9% 84% 11% 79%
NFG 7% 86% 9% 83%
PGW 9% 80% 13% 74%
UGI-Gas 12% 78% 13% 75%
UGI Penn Natural 7% 85% 8% 83%
Average 9% 83% 11% 79% *See explanation on Page 24. On average, 92 percent of consumers rated NGDC representatives as either “very courteous” or “somewhat courteous.” In addition, 90 percent of NGDC consumers rated company representatives as either “very knowledgeable” or “somewhat knowledgeable.”
D. Overall Satisfaction Consumers use a variety of factors to determine their overall level of satisfaction about a contact with a utility company. The ease of reaching the company may be the initial factor. Other factors include the use of the company’s automated telephone system, the wait to speak to a company representative, and the courtesy and knowledge of that representative. If a field visit is part of the interaction, this, too, would affect the consumer’s overall assessment. The tables that follow present the 2010 survey findings regarding overall satisfaction with EDC and NGDC quality of service during customer contacts.

32
Overall Satisfaction with EDC’s Quality of Service During Recent Contact
2010
The previous chart presents the results of the responses to the question, “Considering all aspects of recent contact with the company, how satisfied were you with the quality of service provided by the company?” In 2010, the EDC industry average showed that 89 percent of consumers were “satisfied” (71 percent “very satisfied”) with the overall quality of service they received from their EDCs. Appendix A, Table 1B, provides 2008, 2009 and 2010 results regarding EDC overall customer satisfaction.
64%
64%
67%
70%
72%
74%
75%
79%
21%
23%
22%
19%
17%
15%
16%
15%
0% 10% 20% 30% 40% 50% 60% 70% 80% 90% 100%
Allegheny
PECO
Met-Ed
Penn Power
Duquesne
UGI-Electric
PPL
Penelec
Very Satisfied Somewhat Satisfied
94%
91%
89%
89%
89%
89%
87%
85%

33
Overall Satisfaction with NGDC’s Quality of Service During Recent Contact
2010 *See explanation on Page 24. In 2010, the industry average for overall satisfaction with NGDC customer contacts is 85 percent (71 percent were “very satisfied”). The above chart shows the percent of consumers who indicated satisfaction in response to the question: “Considering all aspects of this recent contact with the NGDC, how satisfied were you with the quality of the service provided by the NGDC?” Appendix B, Table 1B, provides 2008, 2009 and 2010 results regarding NGDC overall customer satisfaction. As indicated in the introduction to the section on customer surveys, the companies and survey firm divided consumer contacts into credit and collection contacts, and contacts about other matters. Members of both working groups had expressed concern that the satisfaction level of consumers who had contacted the companies about credit and collection issues would negatively influence the overall satisfaction ratings. However, the opposite proved true for all EDCs in the first two years the survey was conducted and again in 2004. Over the last three years, a slightly greater average percentage of customers who contacted the EDCs about credit and collection issues responded that they were either “very satisfied” or “somewhat satisfied” than customers who contacted the EDCs about other issues. Appendix A, Table 2, presents the level of satisfaction by these two categories of contacts, as well as the overall satisfaction level for each of the EDCs.
Customers of three out of the seven NGDCs rated their satisfaction higher on credit and collection contacts in 2010 than on other types of contacts that year. The average percentage of customers who were either “very satisfied” or “somewhat satisfied” with their non-credit and collection contacts with the NGDCs is 86 percent, and the average percentage who were either “very satisfied” or “somewhat satisfied” with their credit and collections contacts is 85 percent. Appendix B, Table 2, presents the level of satisfaction by these two categories of contacts, as well as the overall satisfaction level for each of the NGDCs for 2008-10.
64%
67%
72%
68%
74%
77%
77%
18%
15%
12%
17%
12%
11%
14%
0% 10% 20% 30% 40% 50% 60% 70% 80% 90% 100%
PGW
Peoples
Equitable*
UGI-Gas
UGI Penn Natural
NFG
Columbia
Very Satisfied Somewhat Satisfied
91%
88%
86%
85%
84%
82%
82%

34
III. Conclusion
This report fulfills the Commission’s responsibility to summarize the quality of service statistics that the EDCs and NGDCs reported to the Commission. The companies will continue to report data annually to the Commission. The telephone access, billing, meter-reading and dispute data is due to the Commission on Feb. 1 of each year. On April 1 of each year, the Commission is to receive the results of the customer surveys conducted during the previous year. The UCARE report will again provide statistics associated with 2010 consumer complaints and payment agreement requests filed with the Commission by the customers of the major EDCs and NGDCs. The Commission uses three sources of data to obtain as complete a picture as possible of the quality of customer service experienced by customers of the major electric and gas companies. The first source is the company itself, reporting telephone access statistics, the number of bills not rendered monthly to residential and commercial customers, meters not read according to Chapter 56 regulations, and disputes not handled within 30 days. The Commission uses consumer complaints and payment agreement requests filed with the Commission by the customers of the EDCs and NGDCs as a second source of data. As noted in the introduction, 2010 data on informal complaint and payment agreement requests filed with the Commission will be reported in the Commission’s annual UCARE report. Finally, the Commission uses the results of the surveys of the companies’ customers who have had customer-initiated contacts with the companies. This latter source of information tells the Commission about the ease of contacting the companies, the consumers’ view of the knowledge and courtesy of the companies’ customer service representatives, as well as the consumers’ overall satisfaction with the way the company handled the contacts. This information allows the Commission to monitor the quality of EDCs’ and NGDCs’ customer service performance. The survey results show, for the most part, customers are satisfied with the service they receive from their companies. Nevertheless, the company-reported performance data indicates there is room for improvement on the part of Pennsylvania’s major electric and gas companies.
For example, the number of accounts not billed, meters not read and disputes not responded to within 30 days represent infractions of the Chapter 56 regulations. Although some companies have improved their telephone access statistics, access remains at a less than desirable level. Customers, who cannot reach their company, contact the Commission to report access problems. The Commission closely monitors company performance on access measures not only through reported statistics, but also through customer reports to the BCS. Deficiencies in call center access are an even greater cause for concern since the passage of Act 201, which specifically forbids the Commission from accepting complaints from customers who have not first contacted the utility (66 Pa.C.S. § 1410). The analysis provided by both the EDCs and the NGDCs regarding the company-reported statistics, show the various measures prescribed by the reporting requirements are interrelated. Often, the level of performance on one of the measures directly affects a company’s performance on one or more of the other measures. For example, if a company fails to obtain actual meter readings for long periods of time, it may underestimate the customers’ usage. When the company does get actual reads, the make-up bills may cause the customers to call the company, generating increased volumes of complaints. This may affect telephone access statistics. Further, as several companies have pointed out, an increased volume of complaints often leads to a company not being able to handle the disputes in a timely manner and the failure to issue reports to the disputes within the required 30-day timeframe. Later, such behavior may influence customer survey results and generate consumer complaints with the Commission. Finally, Commission review of the complaints may generate high justified consumer complaint rates, as well as high infraction rates.
35
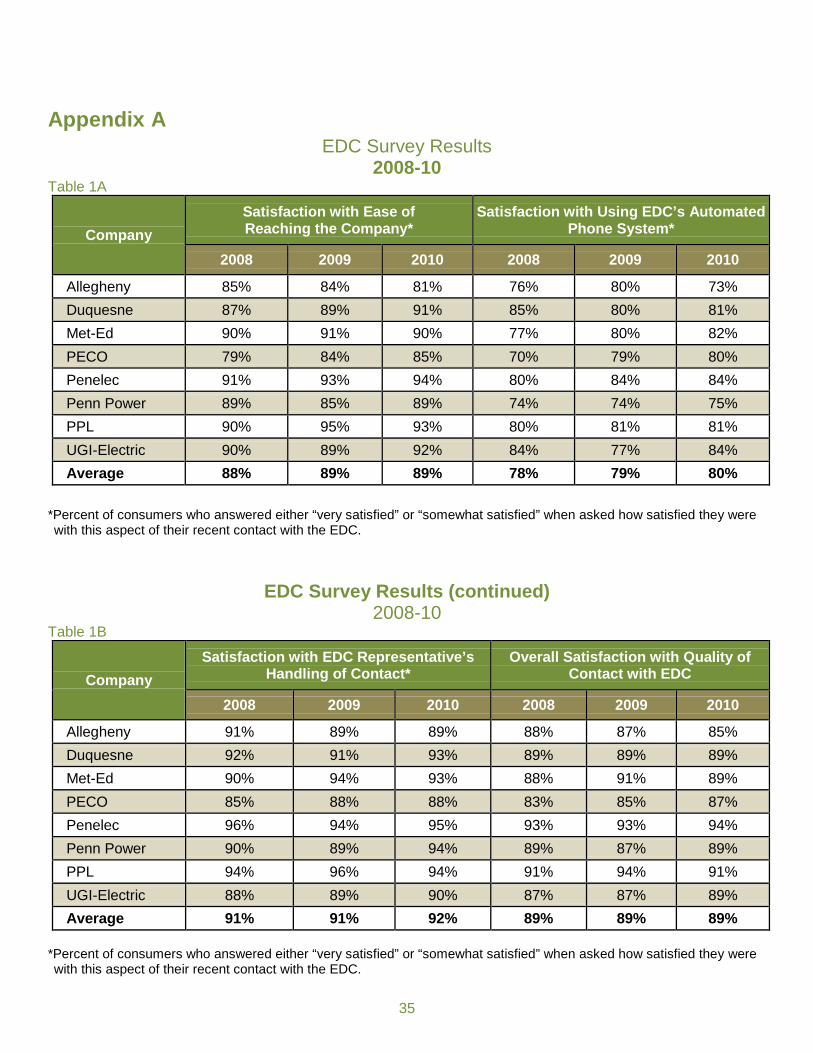
Appendix A EDC Survey Results
2008-10 Table 1A
Company Satisfaction with Ease of Reaching the Company*
Satisfaction with Using EDC’s Automated Phone System*
2008 2009 2010 2008 2009 2010
Allegheny 85% 84% 81% 76% 80% 73% Duquesne 87% 89% 91% 85% 80% 81% Met-Ed 90% 91% 90% 77% 80% 82% PECO 79% 84% 85% 70% 79% 80% Penelec 91% 93% 94% 80% 84% 84% Penn Power 89% 85% 89% 74% 74% 75% PPL 90% 95% 93% 80% 81% 81% UGI-Electric 90% 89% 92% 84% 77% 84% Average 88% 89% 89% 78% 79% 80%
*Percent of consumers who answered either “very satisfied” or “somewhat satisfied” when asked how satisfied they were with this aspect of their recent contact with the EDC.
EDC Survey Results (continued) 2008-10
Table 1B
Company Satisfaction with EDC Representative’s
Handling of Contact* Overall Satisfaction with Quality of
Contact with EDC
2008 2009 2010 2008 2009 2010
Allegheny 91% 89% 89% 88% 87% 85% Duquesne 92% 91% 93% 89% 89% 89% Met-Ed 90% 94% 93% 88% 91% 89% PECO 85% 88% 88% 83% 85% 87% Penelec 96% 94% 95% 93% 93% 94% Penn Power 90% 89% 94% 89% 87% 89% PPL 94% 96% 94% 91% 94% 91% UGI-Electric 88% 89% 90% 87% 87% 89% Average 91% 91% 92% 89% 89% 89%
*Percent of consumers who answered either “very satisfied” or “somewhat satisfied” when asked how satisfied they were with this aspect of their recent contact with the EDC.
36
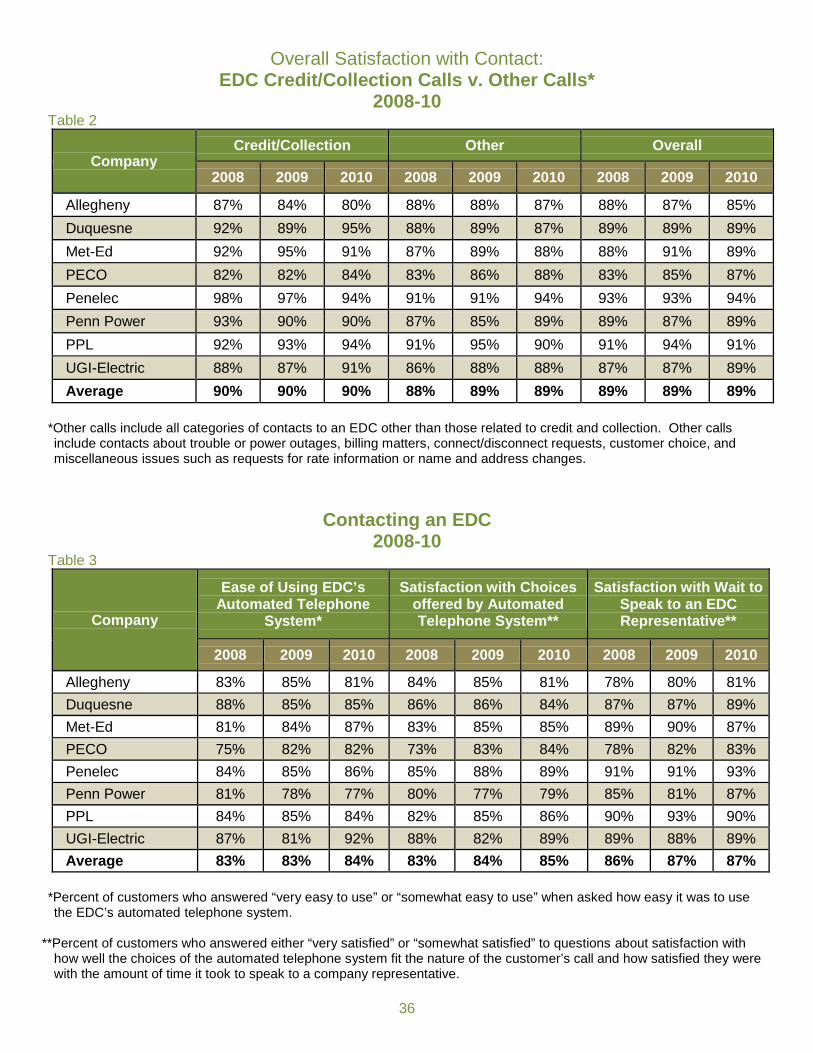
Overall Satisfaction with Contact: EDC Credit/Collection Calls v. Other Calls*
2008-10 Table 2
Company Credit/Collection Other Overall
2008 2009 2010 2008 2009 2010 2008 2009 2010
Allegheny 87% 84% 80% 88% 88% 87% 88% 87% 85% Duquesne 92% 89% 95% 88% 89% 87% 89% 89% 89% Met-Ed 92% 95% 91% 87% 89% 88% 88% 91% 89% PECO 82% 82% 84% 83% 86% 88% 83% 85% 87% Penelec 98% 97% 94% 91% 91% 94% 93% 93% 94% Penn Power 93% 90% 90% 87% 85% 89% 89% 87% 89% PPL 92% 93% 94% 91% 95% 90% 91% 94% 91% UGI-Electric 88% 87% 91% 86% 88% 88% 87% 87% 89% Average 90% 90% 90% 88% 89% 89% 89% 89% 89%
*Other calls include all categories of contacts to an EDC other than those related to credit and collection. Other calls include contacts about trouble or power outages, billing matters, connect/disconnect requests, customer choice, and miscellaneous issues such as requests for rate information or name and address changes.
Contacting an EDC 2008-10
Table 3
Company
Ease of Using EDC’s Automated Telephone
System*
Satisfaction with Choices offered by Automated Telephone System**
Satisfaction with Wait to Speak to an EDC Representative**
2008 2009 2010 2008 2009 2010 2008 2009 2010
Allegheny 83% 85% 81% 84% 85% 81% 78% 80% 81% Duquesne 88% 85% 85% 86% 86% 84% 87% 87% 89% Met-Ed 81% 84% 87% 83% 85% 85% 89% 90% 87% PECO 75% 82% 82% 73% 83% 84% 78% 82% 83% Penelec 84% 85% 86% 85% 88% 89% 91% 91% 93% Penn Power 81% 78% 77% 80% 77% 79% 85% 81% 87% PPL 84% 85% 84% 82% 85% 86% 90% 93% 90% UGI-Electric 87% 81% 92% 88% 82% 89% 89% 88% 89% Average 83% 83% 84% 83% 84% 85% 86% 87% 87%
*Percent of customers who answered “very easy to use” or “somewhat easy to use” when asked how easy it was to use the EDC’s automated telephone system.
**Percent of customers who answered either “very satisfied” or “somewhat satisfied” to questions about satisfaction with
how well the choices of the automated telephone system fit the nature of the customer’s call and how satisfied they were with the amount of time it took to speak to a company representative.

37
Consumer Ratings of EDC Representatives 2008-10
Table 4
Company Call Center Representative’s Courtesy* Call Center Representative’s
Knowledge*
2008 2009 2010 2008 2009 2010
Allegheny 96% 95% 93% 96% 95% 94% Duquesne 95% 95% 97% 95% 95% 96% Met-Ed 97% 98% 96% 94% 96% 95% PECO 92% 93% 94% 90% 92% 95% Penelec 97% 97% 98% 96% 97% 97% Penn Power 96% 95% 97% 92% 92% 94% PPL 97% 98% 97% 96% 96% 96% UGI-Electric 94% 93% 95% 94% 92% 94% Average 96% 96% 96% 94% 94% 95%
*Percent of consumers who answered either “very satisfied” or “somewhat satisfied” when asked how satisfied they were with this aspect of the field visit.
Premise Visit from an EDC Field Representative
2008-10 Table 5A
Company
Overall Satisfaction with the Way
Premise Visit Handled* Satisfaction that Work Completed Promptly* Field Rep’s Courtesy**
2008 2009 2010 2008 2009 2010 2008 2009 2010
Allegheny 86% 90% 90% 76% 78% 76% 100% 97% 94% Duquesne 88% 90% 93% 86% 93% 85% 96% 98% 94% Met-Ed 92% 98% 98% 85% 81% 83% 100% 100% 100% PECO 88% 81% 90% 76% 77% 80% 86% 94% 97% Penelec 96% 95% 97% 87% 89% 93% 95% 100% 100% Penn Power 91% 94% 95% 82% 89% 89% 100% 93% 96% PPL 96% 95% 91% 91% 92% 83% 100% 100% 100% UGI-Electric 91% 100% 95% 79% 76% 79% 100% 100% 96% Average 91% 93% 94% 83% 85% 84% 97% 98% 97%
*Percent of consumers who answered either “very satisfied” or “somewhat satisfied” when asked how satisfied they were with this aspect of the field visit. For the purpose of the survey, “promptness” is the state or condition of acting or responding with speed or readiness to a customer’s question, complaint, dispute or request. An example of promptness might be the utility responding to a customer’s request for a premise visit with an appointment in five days rather than in five weeks.
**Percent of consumers who described the company field representative as “very courteous” or “somewhat courteous” when asked about their perceptions about various aspects of the field representative’s visit to the
consumer’s home or property.
38
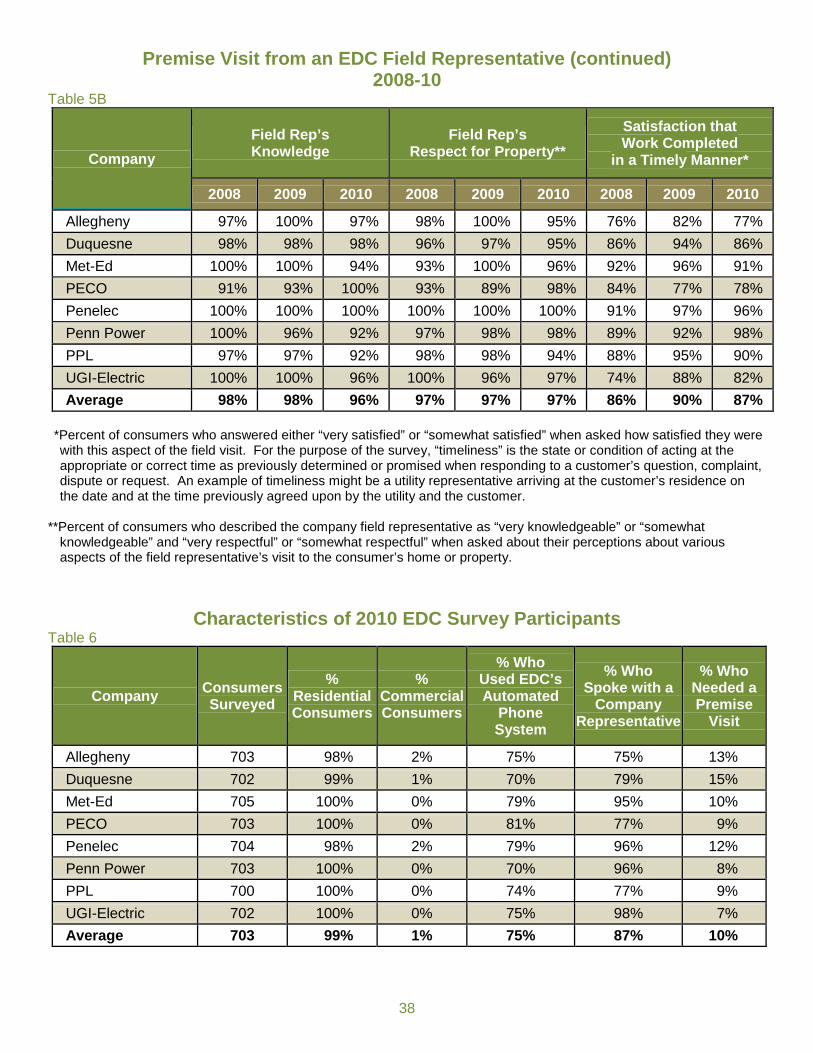
Premise Visit from an EDC Field Representative (continued) 2008-10
Table 5B
Company Field Rep’s Knowledge
Field Rep’s Respect for Property**
Satisfaction that Work Completed
in a Timely Manner*
2008 2009 2010 2008 2009 2010 2008 2009 2010
Allegheny 97% 100% 97% 98% 100% 95% 76% 82% 77% Duquesne 98% 98% 98% 96% 97% 95% 86% 94% 86% Met-Ed 100% 100% 94% 93% 100% 96% 92% 96% 91% PECO 91% 93% 100% 93% 89% 98% 84% 77% 78% Penelec 100% 100% 100% 100% 100% 100% 91% 97% 96% Penn Power 100% 96% 92% 97% 98% 98% 89% 92% 98% PPL 97% 97% 92% 98% 98% 94% 88% 95% 90% UGI-Electric 100% 100% 96% 100% 96% 97% 74% 88% 82% Average 98% 98% 96% 97% 97% 97% 86% 90% 87%
*Percent of consumers who answered either “very satisfied” or “somewhat satisfied” when asked how satisfied they were with this aspect of the field visit. For the purpose of the survey, “timeliness” is the state or condition of acting at the appropriate or correct time as previously determined or promised when responding to a customer’s question, complaint, dispute or request. An example of timeliness might be a utility representative arriving at the customer’s residence on the date and at the time previously agreed upon by the utility and the customer.
**Percent of consumers who described the company field representative as “very knowledgeable” or “somewhat
knowledgeable” and “very respectful” or “somewhat respectful” when asked about their perceptions about various aspects of the field representative’s visit to the consumer’s home or property.
Characteristics of 2010 EDC Survey Participants Table 6
Company Consumers Surveyed
% Residential Consumers
% Commercial Consumers
% Who Used EDC’s Automated
Phone System
% Who Spoke with a
Company Representative
% Who Needed a Premise
Visit
Allegheny 703 98% 2% 75% 75% 13% Duquesne 702 99% 1% 70% 79% 15% Met-Ed 705 100% 0% 79% 95% 10% PECO 703 100% 0% 81% 77% 9% Penelec 704 98% 2% 79% 96% 12% Penn Power 703 100% 0% 70% 96% 8% PPL 700 100% 0% 74% 77% 9% UGI-Electric 702 100% 0% 75% 98% 7% Average 703 99% 1% 75% 87% 10%

39
Average Number of EDC Residential Customers 2010
Table 7
Company Average Number of Residential Customers
Allegheny 614,758
Duquesne 524,406
Met-Ed 485,991
PECO 1,419,415
Penelec 505,397
Penn Power 140,101
PPL 1,212,020
UGI-Electric 54,477
40
Appendix B
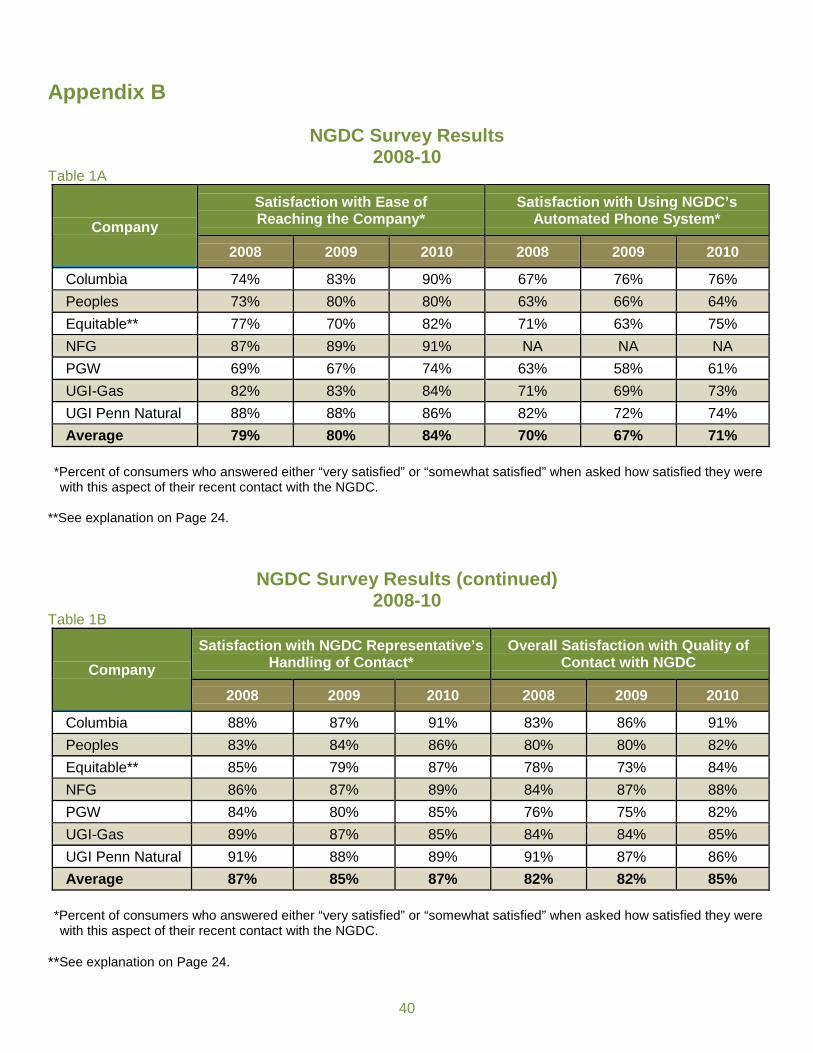
NGDC Survey Results 2008-10
Table 1A
Company Satisfaction with Ease of Reaching the Company*
Satisfaction with Using NGDC’s Automated Phone System*
2008 2009 2010 2008 2009 2010
Columbia 74% 83% 90% 67% 76% 76% Peoples 73% 80% 80% 63% 66% 64% Equitable** 77% 70% 82% 71% 63% 75% NFG 87% 89% 91% NA NA NA PGW 69% 67% 74% 63% 58% 61% UGI-Gas 82% 83% 84% 71% 69% 73% UGI Penn Natural 88% 88% 86% 82% 72% 74% Average 79% 80% 84% 70% 67% 71%
*Percent of consumers who answered either “very satisfied” or “somewhat satisfied” when asked how satisfied they were with this aspect of their recent contact with the NGDC.
**See explanation on Page 24.
NGDC Survey Results (continued) 2008-10
Table 1B
Company Satisfaction with NGDC Representative’s
Handling of Contact* Overall Satisfaction with Quality of
Contact with NGDC
2008 2009 2010 2008 2009 2010
Columbia 88% 87% 91% 83% 86% 91% Peoples 83% 84% 86% 80% 80% 82% Equitable** 85% 79% 87% 78% 73% 84% NFG 86% 87% 89% 84% 87% 88% PGW 84% 80% 85% 76% 75% 82% UGI-Gas 89% 87% 85% 84% 84% 85% UGI Penn Natural 91% 88% 89% 91% 87% 86% Average 87% 85% 87% 82% 82% 85%
*Percent of consumers who answered either “very satisfied” or “somewhat satisfied” when asked how satisfied they were with this aspect of their recent contact with the NGDC.
**See explanation on Page 24.

41
Overall Satisfaction with Contact: NGDC Credit/Collection Calls v. Other Calls*
2008-10 Table 2
Company Credit/Collection Other Overall
2008 2009 2010 2008 2009 2010 2008 2009 2010
Columbia 83% 91% 93% 83% 84% 90% 83% 86% 91% Peoples 77% 78% 76% 81% 81% 84% 80% 80% 82% Equitable** 72% 77% 87% 81% 71% 82% 78% 73% 84% NFG 80% 89% 82% 85% 86% 90% 84% 87% 88% PGW 76% 75% 82% 76% 74% 82% 76% 75% 82% UGI-Gas 82% 80% 86% 85% 86% 85% 84% 84% 85% UGI Penn Natural 91% 87% 86% 91% 87% 87% 91% 87% 86% Average 80% 82% 85% 84% 81% 86% 83% 82% 85%
*Other calls include all categories of contacts to an NGDC other than those related to credit and collection. Other calls include contacts about reliability and safety, billing matters, connect/disconnect requests, customer choice, and miscellaneous issues such as requests for rate information or name and address changes.
**See explanation on Page 24.
Contacting an NGDC 2008-10
Table 3
Company
Ease of Using NGDC’s Automated Telephone
System*
Satisfaction with Choices offered by Automated Telephone System**
Satisfaction with Wait to Speak to an NGDC
Representative
2008 2009 2010 2008 2009 2010 2008 2009 2010
Columbia 71% 79% 81% 70% 79% 78% 74% 81% 83% Peoples 67% 70% 73% 68% 72% 70% 69% 74% 75% Equitable*** 71% 70% 77% 74% 74% 75% 74% 71% 83% NFG NA NA NA NA NA NA 86% 89% 90% PGW 70% 63% 68% 68% 63% 72% 68% 66% 76% UGI-Gas 75% 77% 74% 72% 73% 76% 79% 78% 81% UGI Penn Natural 85% 85% 81% 86% 81% 79% 86% 86% 83% Average 74% 74% 76% 74% 74% 75% 78% 78% 82%
*Percent of customers who answered “very easy to use” or “somewhat easy to use” when asked how easy it was to use the NGDC’s automated telephone system.
**Percent of customers who answered either “very satisfied” or “somewhat satisfied” to questions about satisfaction with
how well the choices of the automated telephone system fit the nature of the customer’s call and how satisfied they were with the amount of time it took to speak to a company representative.
***See explanation on Page 24.
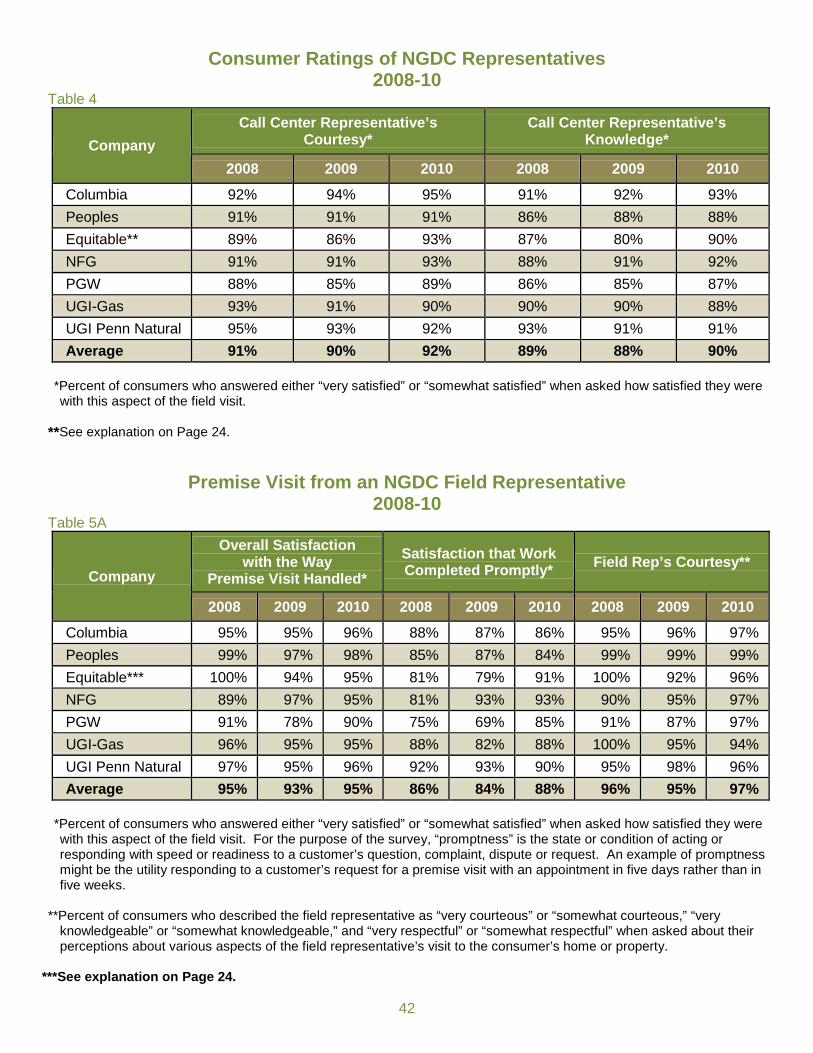
42
Consumer Ratings of NGDC Representatives 2008-10
Table 4
Company Call Center Representative’s
Courtesy* Call Center Representative’s
Knowledge*
2008 2009 2010 2008 2009 2010
Columbia 92% 94% 95% 91% 92% 93% Peoples 91% 91% 91% 86% 88% 88% Equitable** 89% 86% 93% 87% 80% 90% NFG 91% 91% 93% 88% 91% 92% PGW 88% 85% 89% 86% 85% 87% UGI-Gas 93% 91% 90% 90% 90% 88% UGI Penn Natural 95% 93% 92% 93% 91% 91% Average 91% 90% 92% 89% 88% 90%
*Percent of consumers who answered either “very satisfied” or “somewhat satisfied” when asked how satisfied they were with this aspect of the field visit.
**See explanation on Page 24.
Premise Visit from an NGDC Field Representative 2008-10
Table 5A
Company
Overall Satisfaction with the Way
Premise Visit Handled* Satisfaction that Work Completed Promptly* Field Rep’s Courtesy**
2008 2009 2010 2008 2009 2010 2008 2009 2010
Columbia 95% 95% 96% 88% 87% 86% 95% 96% 97% Peoples 99% 97% 98% 85% 87% 84% 99% 99% 99% Equitable*** 100% 94% 95% 81% 79% 91% 100% 92% 96% NFG 89% 97% 95% 81% 93% 93% 90% 95% 97% PGW 91% 78% 90% 75% 69% 85% 91% 87% 97% UGI-Gas 96% 95% 95% 88% 82% 88% 100% 95% 94% UGI Penn Natural 97% 95% 96% 92% 93% 90% 95% 98% 96% Average 95% 93% 95% 86% 84% 88% 96% 95% 97%
*Percent of consumers who answered either “very satisfied” or “somewhat satisfied” when asked how satisfied they were with this aspect of the field visit. For the purpose of the survey, “promptness” is the state or condition of acting or responding with speed or readiness to a customer’s question, complaint, dispute or request. An example of promptness might be the utility responding to a customer’s request for a premise visit with an appointment in five days rather than in five weeks.
**Percent of consumers who described the field representative as “very courteous” or “somewhat courteous,” “very
knowledgeable” or “somewhat knowledgeable,” and “very respectful” or “somewhat respectful” when asked about their perceptions about various aspects of the field representative’s visit to the consumer’s home or property.
***See explanation on Page 24.

43
Premise Visit from an NGDC Field Representative (continued) 2008-10
Table 5B
Company Field Rep’s Knowledge*
Field Rep’s Respect for Property**
Satisfaction that Work Completed
in a Timely Manner*
2008 2009 2010 2008 2009 2010 2008 2009 2010
Columbia 96% 98% 100% 99% 96% 97% 90% 86% 87% Peoples 99% 97% 98% 99% 99% 99% 88% 89% 92% Equitable*** 100% 92% 93% 100% 95% 96% 83% 86% 91% NFG 99% 100% 97% 92% 99% 99% 84% 93% 91% PGW 91% 81% 92% 96% 93% 97% 77% 72% 88% UGI-Gas 98% 95% 94% 98% 97% 98% 88% 88% 87% UGI Penn Natural 96% 95% 96% 100% 99% 99% 90% 91% 88% Average 96% 94% 96% 98% 97% 98% 88% 86% 89%
*Percent of consumers who answered either “very satisfied” or “somewhat satisfied” when asked how satisfied they were with this aspect of the field visit. For the purpose of the survey, “timeliness” is the state or condition of acting at the appropriate or correct time as previously determined or promised when responding to a customer’s question, complaint, dispute or request. An example of timeliness might be a utility representative arriving at the customer’s residence on the date and at the time previously agreed upon by the utility and the customer.
**Percent of consumers who described the company field representative as “very knowledgeable” or “somewhat
knowledgeable.”
***See explanation on Page 24.
Characteristics of 2010 NGDC Survey Participants
Table 6
Company Consumers Surveyed
% Residential Consumers
% Commercial Consumers
% Who Used NGDC’s
Automated Phone System
% Who Spoke with a
Company Representative
% Who Needed a Premise
Visit
Columbia 704 99% 1% 67% 75% 16%
Peoples 703 100% 0% 81% 95% 21%
Equitable* 407 98% 2% 80% 98% 25%
NFG 700 100% 0% NA 98% 18%
PGW 705 99% 1% 62% 96% 15%
UGI-Gas 703 99% 1% 76% 95% 16%
UGI Penn Natural 703 99% 1% 72% 97% 14%
Average 661 99% 1% 73% 93% 18% *See explanation on Page 24.

44
Average Number of NGDC Residential Customers 2010
Table 7
Company Average Number of Residential Customers
Columbia 372,751
Equitable 237,688
NFG 197,843
Peoples 326,915
PGW 479,564
UGI-Gas 305,861
UGI Penn Natural 144,594

Pennsylvania Public Utility Commission Commonwealth Keystone Building
P.O. box 3265Harrisburg, PA 17105-3265
www.puc.state.pa.us