customer relationship management within the industry of ...529510/fulltext01.pdf · customer...
TRANSCRIPT
Customer Relationship Management within the Industry of Speciality Stores – How customer loyalty can be explained by
satisfaction, trust and commitment
Authors: Marcus Ahlmén, Marketing Programme Petter Jönsson, Marketing Programme Andreas Thörnblad, Marketing Programme
Tutor: Michaela Sandell
Examiner: Dr. Pejvak Oghazi
Subject: Customer Relationship Management
Level and semester: Bachelor’s Thesis, Spring 2012
Acknowledgements This study was performed as our bachelor thesis during the spring semester
of 2012. The process has provided us with a deeper knowledge about the
subject at hand as well as how to manage extensive workload within a limited
timeframe. During the completion of this study we have received support
from a number of individuals that we would like to acknowledge.
First of all, we would like to thank the anonymous company in this study and
their representatives for a successful and giving collaboration. Secondly, we
would like to thank Dr. Magnus Hultman for his guidance and structural
assistance that we believe have improved this study considerably. Finally, we
want to send a special thanks to our supervisor Michaela Sandell that
unconditionally helped us in a constructive manner both regarding problem
solutions and general concerns.
Linnaeus University, School of Business and Economics, 5/21/2012
Marcus Ahlmén Petter Jönsson Andreas Thörnblad
Abstract The purpose of this thesis is to explain how satisfaction, trust and
commitment impacts customer retention and word-of-mouth communication
within the industry of Speciality Stores. The study takes off from a historical
perspective where the development of marketing is presented, which
ultimately leads to customer relationship management (CRM). The study
raises the components of customer loyalty and the difficulties of how to build
successful customer relationships within the industry of Speciality Stores. A
survey questionnaire is conducted and distributed digitally to respondents that
are customers of an anonymous company within the industry under
investigation. The main findings in this study are that companies within the
industry of Speciality Stores can achieve word-of-mouth communication
through customer satisfaction and trust. The study also finds that the features
of customer satisfaction have a stronger impact on word-of-mouth
communication than the features of trust. This means that it is these features
of the ones treated in this study that companies within the industry of
Speciality Stores should enact in order to best achieve word-of-mouth
communication among its customers.
Table of Contents Chapter 1. Introduction .................................................................................... 7!
1.1 Background ............................................................................................ 7!1.2 The Industry of Speciality Stores ........................................................... 9!1.3 Problem Discussion ............................................................................... 9!1.4 Purpose ................................................................................................. 12!
Chapter 2. Literature Review ......................................................................... 13!2.1 Customer Relationship ......................................................................... 13!2.2 Satisfaction ........................................................................................... 14!
2.2.1 Service Quality .............................................................................. 16!2.2.2 Service Features ............................................................................ 16!2.2.3 Customer Complaint Management ............................................... 17!
2.3 Trust ..................................................................................................... 17!2.3.1 Shared Values ............................................................................... 19!2.3.2 Communication ............................................................................. 20!2.3.3 Opportunistic Behavior ................................................................. 20!
2.4 Commitment ........................................................................................ 21!2.4.1 Relationship Benefits .................................................................... 24!2.4.2 Switching Costs ............................................................................. 25!2.4.3 Scarcity of Alternatives ................................................................. 26!2.4.4 Shared Values ............................................................................... 26!
2.5 Customer Loyalty ................................................................................. 27!2.5.1 Customer Retention ....................................................................... 28!2.5.2 Word-of-Mouth Communication ................................................... 28!
Chapter 3. Conceptual Framework ................................................................ 30!3.1 The Relationships Between Relationship Quality and Relationship Outcome Within the Industry of Specilaity Stores .................................... 30!
3.1.1 Satisfaction and Customer Retention ............................................ 30!3.1.2 Satisfaction and Word-of-Mouth Communication ........................ 30!3.1.3 Trust and Customer Retention ...................................................... 31!3.1.4 Trust and Word-of-Mouth Communication .................................. 31!3.1.5 Commitment and Customer Retention .......................................... 31!3.1.6 Commitment and Word-of-Mouth Communication ...................... 32!
Chapter 4. Methodology ................................................................................ 33!4.1 Research Approach .............................................................................. 33!
4.1.1 Inductive vs. Deductive Research ................................................. 33!4.1.2 Qualitative vs. Quantitative Research .......................................... 34!
4.2 Research Design ................................................................................... 35!
4.3 Data Sources ........................................................................................ 37!4.4 Research Strategy ................................................................................. 38!4.5 Data Collection Method ....................................................................... 39!4.6 Data Collection Instrument .................................................................. 41!
4.6.1 Operationalization and Measurement of Variables ...................... 41!4.6.2 Questionnaire Design ................................................................... 44!4.6.3 Pretesting ...................................................................................... 46!
4.7 Sampling .............................................................................................. 47!4.7.1 Sampling Frame ............................................................................ 47!4.7.2 Sample Selection ........................................................................... 48!
4.8 Data Analysis Method .......................................................................... 49!4.8.1 Descriptive Statistics ..................................................................... 49!4.8.2 Correlation Analysis ..................................................................... 50!4.8.3 Regression Analysis ...................................................................... 51!
4.9 Quality Criteria .................................................................................... 51!4.9.1 Validity .......................................................................................... 51!4.9.2 Content Validity ............................................................................ 52!4.9.3 Construct Validity ......................................................................... 53!4.9.4 Criterion Validity .......................................................................... 54!4.9.5 Reliability ...................................................................................... 55!
Chapter 5. Data Analysis ............................................................................... 57!5.1 Descriptive Statistics ............................................................................ 57!5.2 Reliability ............................................................................................. 58!5.3 Correlation Analysis ............................................................................ 59!5.4 Hypothesis Testing ............................................................................... 59!
Chapter 6. Discussion, Conclusion & Implications ....................................... 61!6.1 Discussion ............................................................................................ 61!6.2 Conclusion ........................................................................................... 64!6.3 Academic Implications ........................................................................ 65!6.4 Managerial Implications ...................................................................... 65!
Chapter 7. Limitations & Future Research .................................................... 67!7.1 Limitations ........................................................................................... 67!7.2 Future Research ................................................................................... 68!
References ...................................................................................................... 70!
List of Tables Table 1. Research Strategies .......................................................................... 38 Table 2. Simplified Operationalization Table ................................................ 44 Table 3. Demographics .................................................................................. 57 Table 4. Mean & Standard Deviation of Variables ........................................ 58 Table 5. Reliability Test ................................................................................. 58 Table 6. Correlation Analysis ........................................................................ 59 Table 7. Regression Analysis ......................................................................... 60
List of Figures Figure 1. Hypotheses Model .......................................................................... 32 Figure 2. Sample Size Statistical Formula ..................................................... 48
Attachments Attachment 1. Operationalization Table ........................................................ 82 Attachment 2. Framework of Survey Questions ............................................ 83 Attachment 3. Survey Design (Swedish Version) ......................................... 84 Attachment 4. Survey Design (English Version) ........................................... 87
7 (89)
Chapter 1. Introduction
1.1 Background
Marketing as a concept has been around for quite some time and has
constantly evolved due to continuous change in the marketplace. Initially,
marketing started as a short-term approach with the mere intention to increase
sales (Agariya & Singh, 2011). This type of marketing is described by
Grönroos (1994) as well as Mattson (1997) as transactional marketing and
includes the understanding of the Four Ps of marketing. The Four Ps consists
of product, place, price and promotion that together form a strategic basis for
companies to differentiate themselves to stay competitive in the marketplace.
Barnes, Fox & Morris (2004) mean that as competition increased, the
complexity of the market intensified and by this Agariya & Singh (2011)
mean that companies began to understand the value of customer
relationships. This understanding changed the objectives of marketing from
only attracting customers to also keeping and cherishing the current ones to
achieve long-term relationships and loyal customers (Bitner, Booms, &
Mohr, 1994; Cravens & Piercy, 1994; Grönroos, 1991; Gummesson, 1987).
This shift from short-term transactional marketing towards long-term
relationship marketing was thus inevitable for companies to stay competitive
in accordance with the complexity of the new market conditions (Grönroos,
1994).
According to Özgenera & Iraz (2006) as well as Payne & Frow (2005)
customer relationship management (CRM) is described as the activities
performed by a company to initiate, establish, maintain and develop long-
term relationships with customers. CRM as a concept consider the needs and
desires of each individual customer (Piccoli et al., 2003; Payne & Frow,
2005) that is a fundamental part of CRM strategies due to that customers
8 (89)
value the factors that constitute a relationship differently based on their
personal perspectives and earlier experiences (Babin, Darden & Griffin,
1994; Garbarino & Johnson, 1999; Reichheld & Teal, 1996). The key
objective with CRM is to achieve loyal customers (Rigby, Reichheld &
Dawson, 2003) by treating them in a customized manner that strives to create
a personal bond between the company and the customer (Özgenera & Iraz,
2006). According to Rauyruen & Miller (2007) customer loyalty is expressed
through customer retention and positive word-of-mouth communication
expressed by the customer. The importance of customer loyalty is widely
known throughout the literature and has been demonstrated in a study
conducted by Rigby, Reichheld & Dawson (2003). In their study they
investigated the importance of customer loyalty within more than 200
companies from a wide range of industries and concluded that a five percent
increase in customer retention could increase the profits of a company with
up to 95 percent.
It is crucial for companies to achieve customer retention since it is up to six
times more expensive to acquire a new customer than it is to retain a current
one (Rosenberg & Czepiel, 1984). Customer retention is described by Boles,
Barksdale & Johnson (1997) as the company’s ability to both attract and
retain customers and is expressed as when the customer purchase from the
company repeatedly. The second feature of customer loyalty is word-of-
mouth communication and is recommendations expressed by a customer to
others where the strength in this type of communication originates from that
personal communication is considered more reliable than non-personal
communication (Zeithaml & Bitner, 1996). It is of great value for companies
to have such loyal customers that they spread positive word-of-mouth about
the company and recommend the company to others since such
recommendations function as valuable promotion because it does not involve
9 (89)
any costs for the company. According to Huang et al. (2009) customer
loyalty represent the outcome part of the relationship, which according to
Arnett & Badrinarayanan (2005) as well as De Wulf, Odekerken-Schröder &
Iacobucci (2001) is the result of the company´s ability to achieve satisfaction,
trust and commitment among its customers, mentioned throughout the
literature as relationship quality.
1.2 The Industry of Speciality Stores
This thesis will treat the industry of Speciality Stores that according to the
Global Industry Classification Standard (GICS) is a sub-industry within the
industry Speciality Retail. Speciality Retail is one of four industries within
retailing that in turn is included in the sector of Consumer Discretionary.
Speciality Stores is defined as retailers who distributes single products or
services and is thus specialized in a niche market (Morgan Stanley Capital
International, 2002).
1.3 Problem Discussion
In the contemporary market, retail companies face new challenges due to the
increased competition and saturation in the market (Anderson, Jolly &
Fairhurst, 2007). Due to these conditions companies within retailing started
to seek competitive advantages through relationship marketing activities with
the main objective of customer loyalty (Anderson, Jolly & Fairhurst, 2007).
Throughout the literature the accomplishment of customer loyalty, expressed
in terms of customer retention and word-of-mouth communication, is derived
from the company´s ability to achieve satisfaction, trust and commitment
with the customer (Arnett & Badrinarayanan, 2005; De Wulf, Odekerken-
Schröder & Iacobucci, 2001). However, even if there is a general
understanding about these relationships throughout the literature there are
authors that do not agree. Hennig-thurau & Klee (1997); Reichheld &
10 (89)
Aspinall (1993) as well as Bloemer & Poiesz (1989) mention that the
relationship between customer satisfaction and retention is weak or even non-
existing. Further, Ranaweera & Prabhu (2003) mean that trust is a weak
predictor of customer retention. Simultaneously, Evanschitzky et al. (2006)
mention that it cannot be determined whether a direct relationship between
commitment and customer retention exists or not. Continuing, Gripsrud
(2002) states that the contemporary media society is under constant
development where customers today express themselves through media
channels such as social media. This would mean that the availability of
spreading word-of-mouth communication has become easier and more
convenient for customers, which constantly changes the conditions for
companies to achieve word-of-mouth communication. This in turn means that
the relationship between word-of-mouth communication and customer
satisfaction, trust and commitment changes due to rapid changes in the media
society.
Although a general understanding is that customer satisfaction, trust and
commitment leads to customer loyalty, it is unclear whether they are equally
important or if one of these components stronger contributes to customer
loyalty than the others. This knowledge would be of great value for retail
companies since this would give them the ability to understand what specific
component of the relationship that achieves a certain outcome of customer
loyalty. This means that a company that possesses this type of knowledge
could tailor their relationship-building activities in order to achieve either
customer retention or word-of-mouth communication depending on what is
needed in the company´s current situation.
Zemke & Schaff (1990) mean that the industry of Speciality Stores is of a
homogeneous nature due to the fact that the products and services offered are
11 (89)
of similar character. This should mean that customers within this industry
have the opportunity to switch between competing companies without
compromising quality of what is offered since the companies provide similar
products and services. Gagliano & Hathcote (1994) as well as Zemke &
Schaff (1990) mention that the most important attribute for companies within
the industry of Speciality Stores is to have outstanding customer service in
order to achieve loyal customers. This means that relationship-building
activities with the objective of gaining loyal customers is not only an
important activity for companies within this industry, instead such activities
should be seen as vital to stay competitive and prevent customers from
switching to competitors. The consequence of this reasoning should be that if
relationship-building activities is a central part of Speciality Stores, there
should exists extensive published material in relation to the subject.
However, throughout the literature a limited amount of material is written in
the area of Speciality Stores that treat relationship-building activities within
this specific industry. Simultaneously, the limited literature yet available is
outdated since the material is published in the 90´s. There is reason to believe
that the conditions described in the outdated literature is not applicable in the
contemporary market since Pan & Lee (2003) mention that the emergence of
the Internet, e-commerce and social media has totally changed the
relationship between the company and its customers.
In accordance with the above reasoning, it is known that customer
satisfaction, trust and commitment as parts of relationship quality have some
impact on the outcome of the relationship in form of customer retention and
word-of-mouth communication. Further, Speciality Stores operates in an
industry where a homogeneous market, characterized by high competition
and disloyal customers, requires that companies within this industry
understand how the relationship with the customer could be constructed in
12 (89)
order to achieve customer loyalty. The justification for this thesis is derived
from that it is known but not explicitly explained how customer satisfaction,
trust and commitment affect customer retention and word-of-mouth
communication. The selection of industry is motivated based on that long-
term relationships with customers within this industry are essential for
companies to stay competitive and is to date not adequately investigated.
1.4 Purpose
The purpose of this thesis is to explain how satisfaction, trust and
commitment impacts customer retention and word-of-mouth communication
within the industry of Speciality Stores.
13 (89)
Chapter 2. Literature Review
2.1 Customer Relationship
The primary focus of marketing should be to emphasize the exchange of
relationships (Ferber, 1970; Hunt, 1983; Kotler, 1972). According to Berry
(2002) this mind-set in marketing is about establishing relationships with the
customers in order to have the ability to transform them into loyal customers.
Berry (2002) states that it is about moving away from the former approach
that is reflected in the outdated transactional marketing approach that merely
was about attracting customers without thinking about the long-term value
the customer could have for the company.
There is no overall definition of relationship marketing in the literature, but
there is a general understanding about its purpose. The goal with relationship
marketing is about attracting, maintaining and enhancing relationships with
customers (Berry, 2002; Grönroos, 1989; Rapp & Collins, 1990). The
establishment of successful relationships with customers results in many
benefits for the company both in terms of competitive advantages in the
marketplace (Day, 2000; Hunt, 1997) as well as financial benefits (Boles et
al., 2000; Walter and Gemünden, 2000) due to the fact that it is up to six
times more expensive to acquire a new customer than to retain a current one
(Rosenberg & Czepiel, 1984).
The development of relationships with customers is characterized by the
relationship quality as well as the relationship outcome (Badrinarayanan,
2005). Relationship quality is the customer’s perception of the degree his
expectations of the relationship is fulfilled by the company, i.e. the overall
strength of the relationship (Garbarino & Johnson, 1999). The most frequent
constructs used to measure relationship quality involve customer satisfaction,
14 (89)
trust, and commitment (Arnett & Badrinarayanan, 2005; Baker, Simpson &
Siguaw 1999; De Wulf, Odekerken-Schröder & Iacobucci, 2001; Dorsch,
Swanson & Kelley 1998; Garbarino & Johnson, 1999; Palmer and Bejou
1994; Smith 1998). The relationship outcome aspect of customer
relationships determines what the relationship between a customer and a
company leads to (Huang et al. 2009; Hennig-Thurau, Gwinner & Gremler,
2002). The most frequent construct used to describe the outcome part of a
relationship is customer loyalty (Caceres & Paparoidamis, 2007; Hennig-
Thurau, Gwinner & Gremler, 2002; Zeithaml, Berry & Parasuraman, 1996).
2.2 Satisfaction
Customer satisfaction is according to Anderson & Sullivan (1993) about
meeting customer expectations as well as maintaining high perceived quality.
MacNealy (1994) mean that the most important aspect of customer
satisfaction is to meet the expectations of the customers, while Churchill &
Suprenant (1982); Johnson & Fornell (1991); Oliver & DeSarbo (1988)
argues that the customers’ evaluation of how the company delivers the
offering, i.e. the perceived quality, is the key to achieve satisfaction.
Anderson & Sullivan (1993) mean that there is no consistent understanding in
the literature of which one of these two factors that have the greatest impact
on customer satisfaction, but that most studies have shown that perceived
quality is more important than expectations. Fornell et al. (1996) agree with
this reasoning when stating that the degree of satisfaction depends on the
customers overall perception of the quality that the company delivers,
including the quality of the offering, the service features of the company, as
well as the performance of the sales personnel. In this way, it is crucial for a
company to strive to deliver high quality in all aspects of the relationship
both regarding the physical offering as well as service to obtain satisfied
customers and healthy relationships.
15 (89)
Customer satisfaction is according to Blackwell, Miniard & Engel (2006) one
of the most important aspects for companies to strive for, and should be seen
as one of their greatest assets to build relationships with its customers.
Customer satisfaction has long been recognized as a key aspect for
companies to achieve long-term success and to stay competitive in the
marketplace (Hennig-Thurau & Klee, 1997). Why customer satisfaction is
important in the relationship with the customers is according to Rust &
Zahorik (1993) as well as Kotler (1994) because it has proven to be a big part
of why customers chose to return to the company. Hennig-Thurau & Klee
(1997) state that customer retention is important for companies to be able to
reach customer loyalty that results in that customers repeatedly purchase
from the company. Anderson & Fornell (1994) as well as Rust & Zahorik
(1993) argue that there is a clear correlation between customer satisfaction
and customer retention. If a customer is satisfied it often leads to retention
that in turn results in positive effects on profitability for the company
(Anderson & Fornell, 1994; Rust & Zahorik, 1993). It is well known that
customer satisfaction results in many benefits for the company, Zineldin
(2000) states that it results in lower price sensitivity among the customers,
that they become more loyal to the company, as well as they purchase more
goods from the company.
Hansemark & Albinsson (2004) state that the concept of customer
satisfaction consists of the components service quality, service features, and
customer complaint management. These components together function as a
way to achieve satisfaction among customers and is thus a way for the
company to maintain high perceived quality. Other authors also support that
these components are a way for a company to maintain high perceived
quality. McDougall & Levesque (1994) as well as Morgan & Piercy (1992)
state that the provision of service quality is a way to achieve customer
16 (89)
satisfaction. Further, Lavesque & McDougall (1996) also argue for the
importance of delivering superior service features to reach satisfaction among
customers. Johnston (2001) as well as Nyer (2000) additionally states that
customer satisfaction can be achieved with the implementation of customer
complaint management.
2.2.1 Service Quality
Service quality consists of two aspects that are the outcome aspect of the
service and the relational aspect of the service (McDougall & Levesque,
1994; Morgan & Piercy, 1992). The outcome aspect of the service is the
providing of the core service by the company and the relational aspect of the
service is the relationship between the customer and the service provider
(McDougall & Levesque, 1994; Morgan & Piercy, 1992). Concerning the
outcome aspect of the service, Parasuraman, Berry & Zeithaml (1991) mean
that when providing the core service to the customer, it is important for the
service provider to demonstrate accuracy and to convey reliability to
proclaim that he cares about the customers. Concerning the relational aspect
of the service, it is of importance for the service provider to show empathy,
confidence, and responsiveness to the customers (Parasuraman, Berry &
Zeithaml, 1991).
2.2.2 Service Features
Competing with merely goods and services is according to Pine & Gilmore
(1999) no longer enough to achieve customer satisfaction in the increasingly
commoditized market of today. Pine & Gilmore (1999, p. 18) states that
companies need to develop their service offerings to “deliver memorable
events that engage customers in inherently personal ways”. Pine & Gilmore
(1999) mean that rather than simply meeting the customer’s expectations, the
company should strive to exceed those expectations, which they call
17 (89)
customer surprise. Lavesque & McDougall (1996) mean that convenience
and accessibility are two key elements when it comes to develop superior
service offerings to the customers. A good example of this is mentioned by
Hansemark & Albinsson (2004) that describes extended hours of operations
as a way to exceed the customers predetermined expectations of the service
offering and to make it more accessible for the customers.
2.2.3 Customer Complaint Management
Why customers choose to switch between companies is according to Hart,
Heskett & Sasser (1990) because the service supplier doesn't provide
adequate customer complaint management. Johnston (2001) as well as Nyer
(2000) mean that if the company advocates complaint management, and
allow and encourage customers to file complaints on the service quality, it
will increase customer satisfaction. According to Nyer (2000) this has shown
to be most effective among the customers that are most dissatisfied and
among those customers that file complaints most intensely. Customer
complaint management is also mentioned by Andreassen (2000) as well as
Spreng, Harrell & Mackoy (1995) but then as a part of service recovery.
Spreng, Harrell & Mackoy (1995) arguing that if a company encourage
customer to file complaints about the service level, the customers will be
more satisfied. This encouragement will according to Spreng, Harrell &
Mackoy (1995) lead to service recovery that in turn will result in customer
retention.
2.3 Trust
According to Rotter (1967, p. 664) trust is described as “a generalized
expectancy held by an individual that the word of another can be relied on”.
Another definition is provided by Moorman, Deshpande, & Zaltman (1993,
p. 82) who define trust as the “willingness to rely on an exchange partner in
18 (89)
whom one has confidence”. The mutuality of these definitions is that they
both describe trust as an expectancy given by one party to another based on
the perception that the party can be relied on. Morgan & Hunt (1994); Berry
& Parasuraman (1991); Thomas & Skinner (2010); Sirdeshmukh, Singh &
Sabol (2002) all describes that trust is a key aspect in building relationships
and Morgan & Hunt (1994) states that trust therefore should be one of the
main cues in relationship marketing activities to build successful
relationships with customers. According to Moorman, Zaltman, & Despande
(1992) as well as Ganesan & Hess (1997) trust in relationships reduces
perceived uncertainty of risk between the parties involved in a relationship.
By this, Moorman, Zaltman, & Despande (1992) as well as Ganesan & Hess
(1997) mean that one party might experience some type of risk or uncertainty
and that the other party by being trusted can reduce this perception of risk
and uncertainty in a given situation. Further, Lambert, Emmelhainz, &
Gardner (1999) suggest that trust is so crucial for the establishment of
relationships that it is very difficult to create long-term relationships without
the presence of trust between the parties.
Cox (2004) mentions that difficulties exist in building relationships because
complications can occur between the parties in a relationship that in turn
damages the established trust. Cox (2004) states that the parties in a
relationship generally have different intentions with the relationship e.g. a
company’s intention (maximum profit) and the customers’ intention
(benefits) that can create conflict if one party experience unevenness between
the parties and feel that the other party takes advantage in the situation. In
buyer-seller relationships trust can according to Ganesan & Hess (1997) be
divided into two dimensions. First, Ganesan & Hess (1997) state that one
type of trust exists between individuals and other individuals mentioned as
interpersonal trust. Interpersonal trust is the trust that exists between for
19 (89)
example the sales representative and a customer to a company. Secondly,
Ganesan & Hess (1997) state that a second type of trust exists between
individuals and the company as a whole. Ganesan & Hess (1997) mention
this type of trust as organizational trust. By this discussion Ganesan & Hess
(1997) mean that an individual possesses two main perceptions of trust
towards a company, one being the interpersonal towards the employees and
one organizational trust towards the company. According to Dwyer, Schurr,
& Oh (1987); Bhagat (2009); Morgan & Hunt (1994) trust is built upon the
concept of shared values between the parties in the relationship. Further,
Morgan & Hunt (1994) adds the concept of communication and opportunistic
behavior as important building blocks for trust in relationships.
2.3.1 Shared Values
According to Morgan & Hunt (1994) the concept of shared values functions
as the starting point for building trust in relationships. Morgan & Hunt (1994)
mean that shared values represent the opinions an individual have about
behaviors, goals and also includes the perception of what is right and wrong.
Morgan & Hunt (1994) states that from the individuals’ perspective the
values are affected by past experiences that have formed the individual to
become whom they are today. From the companies perceptive, Morgan &
Hunt (1994) mean that the values are expressed in the organizational culture
that reflects what the company stands for. The organizational culture
represents what the company is and function as a base when the individual
evaluates if the values of the company and the individual match.
Morgan & Hunt (1994) mean with the concept of shared values the individual
can either identify, agree with the values of the company, or the individual
can reject the values and thereby disagree, this is mentioned as customer
identification. Another aspect is also added by Morgan & Hunt (1994) as
internalization, which means that the individual assumes the values of the
20 (89)
company and become a part of them. Of these different types of associations
Morgan & Hunt (1994) mean that internalization is the strongest form of
shared values. Bhattacharya & Sen (2003) mentions that customers who are
attracted to a company’s identity are likely to be more appealed to the
company when they feel that the company matches who they are.
2.3.2 Communication!
Morgan & Hunt (1994) mention the concept of communication as a second
building block for trust. Morgan & Hunt (1994) state that the formal and
informal communication from the company is a factor that affects how
meaningfulness can be created in relationships. Morgan & Hunt (1994) mean
that the frequency, quality and reliability determine how the communication
affects trust in relationships.
Rempel, Holmes & Zanna (1985) as well as Hovland, Janis & Kelley (1953)
also mention the reliability aspect of communication and mean that the
partners’ ability to keep its promise and demonstrate competence is the
underlying influence of trust in communication. According to Ganasan &
Hess (1997) reliability has a significant affection on the interpersonal trust
that exists between a sales representative and an individual. By this, Ganasan
& Hess (1997) mean that the concept reliability affect the relationship
between individuals to a further extent than the relationship between
individuals and organizations and it is therefore important that the sales
representatives gives a credible behavior where they demonstrate competence
to create trust.
2.3.3 Opportunistic Behavior
Morgan & Hunt (1994) as well as Rempel, Holmes & Zanna (1985) mean
that trust in relationships is also affected by what is mentioned as
21 (89)
opportunistic behavior. Opportunistic behavior is when a party in the
relationship violates the implicit or explicit promises that the relationship
consists of, mentioned as violation of promises. Morgan & Hunt (1994) mean
that a relationship is consisted of certain promises between the parties and
that a violation of these promises leads to a decrease of trust since one party
feels exploited in the relationship.
Rempel, Holmes & Zanna (1985) describes that behavior characterized by
concern for the other party in the relationship builds trust and mention this
behavior as benevolence. Ganasan & Hess (1997) mean that the dimension of
benevolence affects organizational trust. By this Ganasan & Hess (1997)
mean that trust between customers and the company is foremost affected by
the company’s ability to convince the customer that the company is willing to
sacrifice something extra or unexpected to satisfy the customer. Cox (2004)
also discusses a similar issue when proposing that trust is damaged if
complications occur between the companies’ intentions (maximum profit)
and the customers’ intention (benefits) and the customers feel utilized in
some way.
!2.4 Commitment
Morgan & Hunt (1994) as well as Anderson & Weitz (1992) describe
commitment as a complex concept and that it is a connection between two
parties whom both strives towards an establishment of a relationship that will
have a long-term duration. Moorman et al. (1992) adds that customer
commitment is a physiological force and that the customer while committed
is linked to the company in which he does business with. Allen & Meyer
(1997) states that commitment is a physiological state and that people can
establish two different forms of commitment. Attitudinal commitment is one
and refers to a personal attachment towards an organization, union or
22 (89)
occupation. Behavioral commitment is the other and indicates some kind of
action taken by the person, which can be continuing membership, policies or
goals (Allen & Meyer, 1997).
According to Gundlach et al., (1995) as well as Morgan & Hunt (1994)
commitment is seen as a key variable for establishing a relationship that in
turn will result in customer retention and loyalty towards the company.
Fornell & Wernerfelt (1987) explain the importance of building commitment
in a relationship, as commitment will lead to loyal customers that in turn will
result in higher profit for the company because the company will remain
current customers. Dick & Basu (1994) agree with the already mentioned
aspects of why commitment is important but is also adding that committed
customer will spread positive information or opinions about the company and
that it is a fact that committed customer will purchase more and because of
that company with committed customer increase their sales.
Allen & Meyer (1990) as well as Mathieu & Zajac (1990) states that there are
two main types of commitment and that they both include different aspects of
why people become committed. These types of commitment are called
affective commitment and continuance commitment. Gundlach et al. (1995)
explains affective commitment as a mixture of attitudinal loyalty,
involvement and attachment. When relationship is built on continuance
commitment, Fullerton (2005) proclaims that customers identify themselves
with the company, feel a personal bond and an emotion of familiarity
connected to the company. This identification results in that the customer
recommends the company to their friends. According to Fullerton (2003)
continuance commitment is when a customer remains committed to a
company because of high switching costs and/or scarcity of alternatives.
23 (89)
Meyer & Herscovitch (2001) further state that a third type of commitment
mentioned as normative commitment can be added to the concept of
commitment. Normative commitment refers to the moral attachment that the
customer feels towards a company and that customers feel indebt to join
companies that they have shared values with. Companies who create
normative commitment among its customers naturally gain customer
retention. Customer retention is created due to the concept of reciprocity,
which refers to the customer’s willingness of repay the company if they feel
that they owe the company in some aspect (Cialdini, 2007; Meyer &
Herscovitch, 2001). Cialdini (2007) further explains that the repayment does
not need to be returned in the same way that it was given in order to be
successful. In fact, Edlund et al. (2007) proclaims that the most effective way
of using the concept of reciprocity is when the customer only have one single
way to repay the company, in other words to buy products from that
particular company assortment.
Anderson & Weitz (1992) states that a relationship built on commitment will
have a long-term duration and will be meaningful in the way that the
customers will preserve the relationship with the belief that the relationship
needs effort and attention. According to Dagger, David & Ng (2011)
customer commitment affects the relationship between a customer and a
company positively as long as the company cherishes the customer by
providing confidence and offer both social and special benefits. Malhotra,
Budhwar & Prowse (2007) states that these benefits also can be described as
rewards in the relationship that in some way provides the customer with
financial or other tangible or intangible benefits that is received from being in
a relationship. Malhotra, Budhwar & Prowse (2007) further uses the same
approach as MacMillan et al. (2005) when stating that rewards can be divided
into extrinsic and intrinsic types and that rewards in the same way as benefits
24 (89)
affect all types of commitment mentioned by Allen & Mayer (1990). Dagger,
David & Ng (2011) proclaims that providing customers with benefits is
especially important during the first stage of relationship building. Gwinner
et al. (1998) also proclaims that benefits affect the level of commitment and
that it is one of the main parts of a successful relationship. Gwinner et al.
(1998) states that relationship benefits can be divided into three different
groups, confidence benefits, social benefits and finally special treatments
benefits.
2.4.1 Relationship Benefits
Confidence benefits is the first type of relationship benefits and will
according to Gwinner et al. (1998) result in security and comfort for the
customer. With this, Gwinner et al. (1998) mean that the company must keep
their promises and protect customer privacy in order to gain their confidence
and create commitment. This type of benefits is also mentioned by
MacMillan et al. (2005) who call it intrinsic benefits that are inherent in the
relationship and are intangible for the customer.
The second type of relationship benefits is social benefits that give the
customer an emotion of familiarity and friendship. Gwinner et al. (1998)
mean that companies must support their customers and help them in their
decisions in order to appear friendly and helpful. MacMillan et al. (2005)
appeal this type of benefits as intangible benefits that also leads to
commitment among the customers. Li & Dant (1997) proclaims that this type
of benefits is psychological attached and that it gives the customer a feeling
of guilt if they just receive benefits without giving something back. Social
benefits will because of this most likely result in positive re-purchasing
behavior among the customers.
25 (89)
The third type of benefits is special treatment benefits and refers to economic
advantages and product advantages for the customer. Gwinner et al. (1998)
states that such benefits is the most tangible ones for the customer and can
occur as cost savings/lower prices in form of physical products and/or
tailored offers for the customer, which will lead to loyalty and commitment
among the customers. MacMillan et al. (2005) states that such benefits are
important as activity during the first stage of relationship building and call it
extrinsic benefits that occur in a more material form than other types of
benefits.
2.4.2 Switching Costs
Bendapudi & Berry (1997); Dwyer et al., (1987) as well as Gundlach et al.,
(1995) proclaims that customers become committed to a relationship if there
are distinct switching costs that makes it difficult for customers to switch
between different companies. Jones, Mothersbaugh & Beatty (2002) states
that switching costs exists as a multidimensional nature and uses their own
new reasoning’s together with already known ones in order to categorize
switching costs into several different groups depending on how it affects the
customer. Jones, Mothersbaugh & Beatty (2002) states that continuity costs
are associated with the perceived risk of switching from a known company to
an unknown.
Search costs are another group that Jones, Mothersbaugh & Beatty (2002)
presents and is related to the customers searching for another company,
which demands both time and effort. Setup and sunk costs are the last two
groups that Jones, Mothersbaugh & Beatty (2002) themselves states and are
associated with the first time customers involved with the company and the
emotional attachment that must be replaced when customers are switching
company. Guiltinan (1989) mentions another group called contractual costs
that are related to fees and if the customer will suffer any charges for leaving
26 (89)
or entering a company. Fullerton (2005) proclaims a negative aspect of
building relationships with this type of switching costs. If the customer is
economically charged for having a relationship with a company or if mistakes
caused by the customer can result in fees, Fullerton (2005) mean that this can
result in that the customer feel trapped in the relationship and will not
recommend the company further. The last group of switching costs is
learning costs and is according to Heskett (1990) associated with the need of
knowledge about a company´s assortment, employees or design.
2.4.3 Scarcity of Alternatives
Gierl & Huettl (2010) as well as Cialdini (2007) mean that scarcity is an
important marketing tool or instrument since customers tend to value objects
more if they are limited or hard to get hold of and that this contributes in
keeping the customer interested in the company. Gierl & Huettl (2010) states
that scarcity occurs with both limited supply and high demand. Scarcity can
thus be accomplished through limited edition products or as a result of high
demand for the product who have an exclusively status, called exclusive
products. According to Cialdini (2007) limited editions results in that things
become less accessible and the customer lose their freedom of choices to
some extent. This less freedom will result according to Cialdini (2007) that
customer tends to want it more than before and that new scarce products are
more wanted among the customer than those that already were restricted.
Cialdini (2007) also states that products become more exclusive and wanted
if the customers compete against each to get them or if the products are only
available during a limited time.
2.4.4 Shared Values
Morgan & Hunt (1994) proclaims that shared values in a relationship occurs
when the involved parties have the same beliefs about what is right or wrong,
27 (89)
important or unimportant and also appropriate or inappropriate. Chatman
(1991) also state that shared values are a direct precursor for both
commitment and trust. Kashyap & Sivadas (2012) explains shared values as
a social influence when one source influences a target audience. This
influence occurs when one party accept that another influence them because
the values from that party is congruent with their own values. Sharing of
values is an important feature when building commitment in a relationship
since that type of similarity between the company and the customer can
provide directions for organizational goals, strategies and policies. Kashyap
& Sivadas (2012) further proclaims that committed customers have a desire
to continue the relationship with that company. Such relationships imply an
emotion of solidarity and cohesion among the customers that over time
results in that the shared values between the company and the customer
becomes even more similar.
2.5 Customer Loyalty
According to Chaudhuri & Holbrook (2001) as well as Edvardsson et al.
(2000) customer loyalty is defined as the customer´s willingness to
repurchase the products or services provided by the company. Zeithaml,
Berry & Parasuraman (1996) also adds the willingness to recommend the
company and the act to encourage other consumers to enact the company.
Customer loyalty is a primary goal of customer relationships (Sheth, 1996)
which could be explained by that it is up to six times more expensive to
acquire a new customer than it is to retain a current one (Rosenberg &
Czepier, 1984). Customer loyalty consists of the aspects customer retention
and the customers’ willingness to recommend the company through word-of-
mouth communication (Zeithaml, Berry & Parasuraman, 1996; Czepiel, 1990;
Fornell & Wernerfelt, 1987; Hennig-Thurau, Gwinner & Gremler, 2002;
Rauyruen & Miller, 2007).
28 (89)
2.5.1 Customer Retention
According to Boles, Barksdale & Johnson (1997) customer retention is the
process that describes a company’s ability to attract and retain customers.
Gerpott et al. (2001) continues by defining customer retention as when a
customer continues to do business with a company or purchase from the same
company repeatedly. Crosby, Evans & Cowles (1990) states that customer
retention is one main part of the outcome of a strong relationship between a
customer and a company. To achieve retention among its customers, it is
crucial for the company to exceed the customer’s expectations in order to in
turn reach customer loyalty (Boles, Barksdale & Johnson, 1997). Retention of
customers can according to Bowman & Narayandas (2001) as well as De
Wulf, Oderkerken-Schröder & Iacobucci (2001) be addressed by asking
customers to report the number of purchases they made in relation to a
specific brand. Further, Verheof (2003) developed the measurability by
addressing how many products of that specific group of products that has
been purchased from that specific company, also mentioned as extent of
purchases.
2.5.2 Word-of-Mouth Communication
According to Anderson (1998); Richins (1983); Herr, Kardes & Kim (1991)
as well as Haywood (1993) word-of-mouth communication is defined as
informal communication between customers and others concerning
evaluations of products or services. Word-of-mouth communication is an
important tool for the company to attract new customers and thus create
loyalty (Grönroos, 1990; Morgan & Hunt, 1994). Word-of-mouth
communication is expressed as a recommendation from one customer to
others where the strength in the communication derives from that personal
communication is considered more reliable than non-personal communication
(Zeithaml & Bitner, 1996). It can thereby be stated that informal
29 (89)
communication from one customer to another can outweigh the formal
communication from a company. Word-of-mouth communication can be
direct recommendations about a product or service (Fullerton & Taylor,
2002) but also the sharing of thoughts of an entire brand (Maru File, Cermak
& Prince, 2004).
30 (89)
Chapter 3. Conceptual Framework 3.1 The Relationships Between Relationship Quality and Relationship Outcome Within the Industry of Specilaity Stores 3.1.1 Satisfaction and Customer Retention
In marketing literature customer satisfaction is typically described as the way
to achieve customer retention (Kotler, 1994; Fornell, 1992; Reichheld &
Sasser, 1990). However, Hennig-thurau & Klee (1997); Reichheld &
Aspinall (1993) as well as Bloemer & Poiesz (1989) mention that the
relationship between the satisfaction and retention is weak or even non-
existing. Due to this ambiguity and the fact that the literature in this area is
outdated, the following hypothesis is stated:
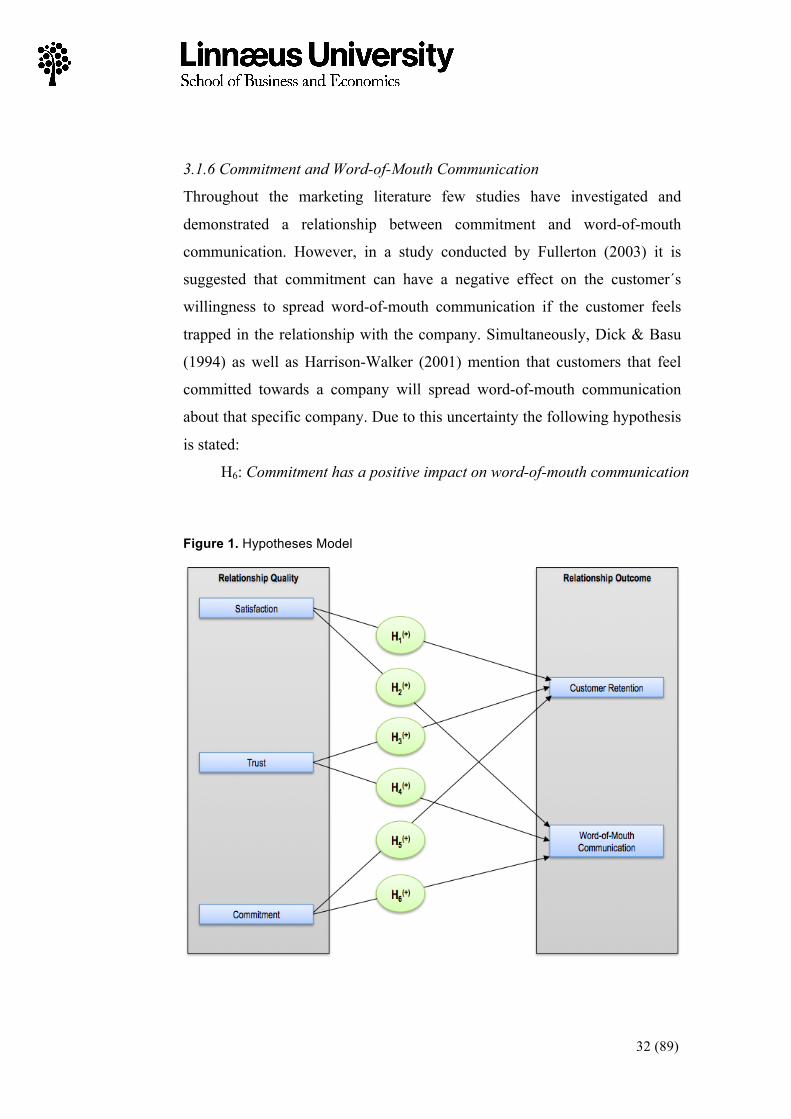
H1: Satisfaction has a positive impact on customer retention
3.1.2 Satisfaction and Word-of-Mouth Communication
Previous studies have shown a strong association between customer
satisfaction and word-of-mouth communication (Ladhari, 2007; Ranaweera
& Prabhu, 2003, Kim, Ng & Kim, 2009; Bitner, 1990; Oliver, 1980; Bloch,
1986; Reichheld & Sasser, 1990). However, Gripsrud (2002) mention that the
contemporary media society is under constant development where customers
today express themselves through media channels such as social media. Due
to this, it is of great importance to continuously investigate the phenomena of
word-of-mouth communication with regard to the development described by
Gripsrud (2002). The following hypothesis is stated:
H2: Satisfaction has a positive impact on word-of-mouth communication
31 (89)
3.1.3 Trust and Customer Retention
Previous studies have indicated that trust is likely to influence the retention of
customer (Kassim & Abdullah, 2010). However, Ranaweera & Prabhu
(2003) have shown that this type of trust is the foremost driver of customer
retention when it comes to business-to-business relationships. Ranaweera &
Prabhu (2003) further states that in the context of company to customer
relationships trust is found to be a weak predictor of retention. Due to this the
following hypothesis is stated:
H3: Trust has a positive impact on customer retention
3.1.4 Trust and Word-of-Mouth Communication
Throughout the marketing literature few studies have investigated and
demonstrated a relationship between trust and word-of-mouth communication
(Ranaweera & Prabhu, 2003). However, in a study conducted by Ranaweera
& Prabhu (2003) it is suggested that trust is just as important as satisfaction
to achieve word-of-mouth communication. Due to this the following
hypothesis is stated:
H4: Trust has a positive impact on word-of-mouth communication
3.1.5 Commitment and Customer Retention
Brown & Petersson (1993); Morgan & Hunt (1994) as well as Fullerton
(2003) mention that commitment is an antecedent for customer retention.
However, the impact between commitment and customer retention is
according to Evanschitzky et al. (2006) not rigorously investigated in the
marketing literature. According to Evanschitzky et al. (2006) it cannot be
determined whether a direct relationship between the concepts exists or not.
Due to this uncertainty the following hypothesis is stated:
H5: Commitment has a positive impact on customer retention
32 (89)
3.1.6 Commitment and Word-of-Mouth Communication
Throughout the marketing literature few studies have investigated and
demonstrated a relationship between commitment and word-of-mouth
communication. However, in a study conducted by Fullerton (2003) it is
suggested that commitment can have a negative effect on the customer´s
willingness to spread word-of-mouth communication if the customer feels
trapped in the relationship with the company. Simultaneously, Dick & Basu
(1994) as well as Harrison-Walker (2001) mention that customers that feel
committed towards a company will spread word-of-mouth communication
about that specific company. Due to this uncertainty the following hypothesis
is stated:
H6: Commitment has a positive impact on word-of-mouth communication Figure 1. Hypotheses Model
33 (89)
Chapter 4. Methodology
4.1 Research Approach
4.1.1 Inductive vs. Deductive Research
In research there are typically two types of research approaches that includes
an inductive and a deductive research approach. An inductive research
approach means that the researcher begins the forming of theoretical
knowledge with an observation of an event (Bryman & Bell, 2011). On the
basis of this observed event the researcher strives to draw generalizable
conclusions by interpreting what is observed through the event and thus
create a theory of understanding. With this understanding an inductive
process begins with an observation and results in a theoretical understanding
(Ghauri & Gronhaug, 2010).
A deductive research approach means that research is based on what is
already known about a particular subject, and which theoretical
considerations that is important in relation to that subject. This means that the
researcher begins by creating an understanding of the given subject by
creating a theoretical framework (Bryman & Bell, 2011). From this
framework it is possible for the researcher to set up hypotheses that further
can be tested through gathered empirical data. The formulated hypotheses are
then either supported or not supported by the research that results in that the
theory from which the hypotheses originated from is revised based on the
new knowledge (Ghauri & Gronhaug, 2010).
Considering the purpose of this study, were hypothesis are extracted from
already existing theoretical knowledge, the study cannot naturally implement
an inductive research approach where theoretical understanding is derived
from empirical data. The appropriate approach implemented in this study is

34 (89)
the deductive research approach since the study examines theoretical
concepts with empirical data. This study begins with a foundation of
theoretical knowledge further examined through an empirical investigation
that further supports the justification for the applied research approach.
4.1.2 Qualitative vs. Quantitative Research
In research there are further approaches in addition to the inductive and
deductive perspective to take into account for the researcher including a
qualitative and a quantitative research approach. A qualitative research
approach is an approach where the research uses a small number of
respondents to make it possible to gain in-depth information to reach an
understanding about a more complex problem under investigation (Ghauri &
Gronhaug, 2010). This approach is most suited when examine complex
situations where attitudes and beliefs among the respondents constitute what
is under investigation. In qualitative research the analysis is merely
constructed based on the interpretation of the findings in the empirical
investigation (Bryman & Bell, 2011; Ghauri & Gronhaug, 2010).
A quantitative research approach is generally characterized by a small
amount of studied variables on a larger scale of respondents. This approach
typically means that a population is examined by investigating a sample of
that population. The findings gained from that sample represent the entire
population and the findings of the sample can thus be generalized across this
population. To enable a generalization across the population it is important
that the research is carried out in a standardized and structured way and also
in measureable terms. In order to present the findings in a formalized manner
the findings need to be measurable and presentable in statistics. (Bryman &
Bell, 2011)
35 (89)
In this study a quantitative research approach is implemented since the
purpose of this study is to gain knowledge about an entire population. This
could also be achieved with a qualitative research approach. However,
findings of qualitative character cannot be analyzed statically and presented
in numbers since the problem at hand are investigated deeply with a smaller
number of respondents. This results in that qualitative research cannot
achieve generalizability to the same extent as a quantitative research
approach where the results are supported statistically (Yin, 2003). Further,
this study strives not to gain deeper knowledge about the studied variables
but to assess the relationship between the variables to support or reject the
hypothesis in this study.
4.2 Research Design
There are mainly three types of designs to take into account when planning a
research project. These types of designs include exploratory, causal, and
descriptive research designs (Bryman & Bell, 2011; Ghauri & Gronhaug,
2010). Exploratory research design is according to Bryman & Bell (2011)
normally used in the beginning of a research project to identify potential
problems with the upcoming research. This type of research aims to clarify if
the intended research direction is viable or not. The aim of causal research
design is according to Bryman & Bell (2011) to describe how variables affect
and cause other studied variables to change and impact each other. This type
of research design is thus a way of predicting how changes among variables
may affect and cause others but demands that the researcher have the ability
to control the independent studied variables in order to ensure that the result
can be supported. Descriptive research design deals with everything that can
be statistically measured and counted numerically in a study. Therefore
descriptive research is also known as statistical research and can with
gathered data describe characteristics of a population or phenomenon. The
36 (89)
aim with this type of research is to answer who, what, where, when, how, and
why questions (Bryman & Bell, 2011).
Descriptive research can further be divided into two separate research
designs, called cross-sectional research design and longitudinal research
design (Bryman & Bell, 2011; Ghauri & Gronhaug, 2010). A cross-sectional
research design is when the researcher implement several cases
simultaneously to gather data from. This approach is used to find patterns in
the gathered data to make it possible to see relationships between the
different variables under investigation (Ghauri & Gronhaug, 2010). A
longitudinal research design is when the researcher implement single cases
for an extended period of time. This approach is used to find changes in
variables by studying them over a longer period of time (Ghauri & Gronhaug,
2010). This approach is according to Bryman & Bell (2011) costly in terms
of time, money and resources since it requires more than one occasion to
collect data.
In order to find the appropriate research design for this study the available
research designs had to be considered. First, the exploratory research design
was excluded since the problem and research questions in this study are
stated and need no further exploration or direction in order to be determined
for further research. Secondly, a casual research design was considered and
excluded since the authors could not control the independent variables
fundamental for achieving a causal research design. A descriptive research
design is used in this study since it is most suitable due to the characteristics
of the purpose of the study. The purpose of this study is to explain how
satisfaction, trust and commitment impacts customer retention and word-of-
mouth communication, this can thus be examined through a descriptive
research design that becomes suitable. Further, a single cross-sectional
37 (89)
research design was chosen due to the limited availability of time, money and
resources.
!4.3 Data Sources
There are two different types of sources of information that are commonly
used in research. These types of data sources include secondary and primary
data. Secondary data is information collected with another purpose than to
help answer the specific problem at hand. This type of data can further be
divided into internal and external secondary data. Internal secondary data
derives from inside an organization and is internal information such as
strategy documents and annual reports. External secondary data is
information from any type of external source where information gathered for
another purposes can be used as empirical information to answer the specific
problem under investigation. This type of data is for instance information
from other studies, social media, and governmental institutes (Bryman &
Bell, 2011). An advantage of secondary data is that the data is already
available which can save time and money. Secondary data also provides the
possibility for longitudinal analysis that enables to observe potential trends
and tendencies over time. On the other hand, since the secondary data is not
gathered to solve the specific problem at hand, it could mean that the
information is not sufficient to draw any new conclusions from. Further, the
data could be of a complex character that can result in that it takes time for
the researcher to become familiar with the information and how it is coded
(Bryman & Bell, 2011; Ghauri & Gronhaug, 2010).
Primary data is first-hand information collected with the intention to answer
to the specific research problem at hand. An advantage with primary data is
that it is information tailored-made to fit the specific purpose of the research.
Further, this type of information is advantageous since it is always up-to-date.
38 (89)
Disadvantage with primary data is that it is costly and time consuming to
collect such information. There is also a risk of a low response rate when
gathering primary data since the quality of the outcome depends on another
party’s ability and desire to participate (Bryman & Bell, 2011).
Since the purpose of this study involves an industry were no specific
information about the subject at hand is available the study cannot emphasize
secondary sources of information to answer the purpose. A focus towards
primary data is thus inevitable in order to answer to the problem of this
specific research. In this study primary data sources will be used to answer
the specific research questions at hand.
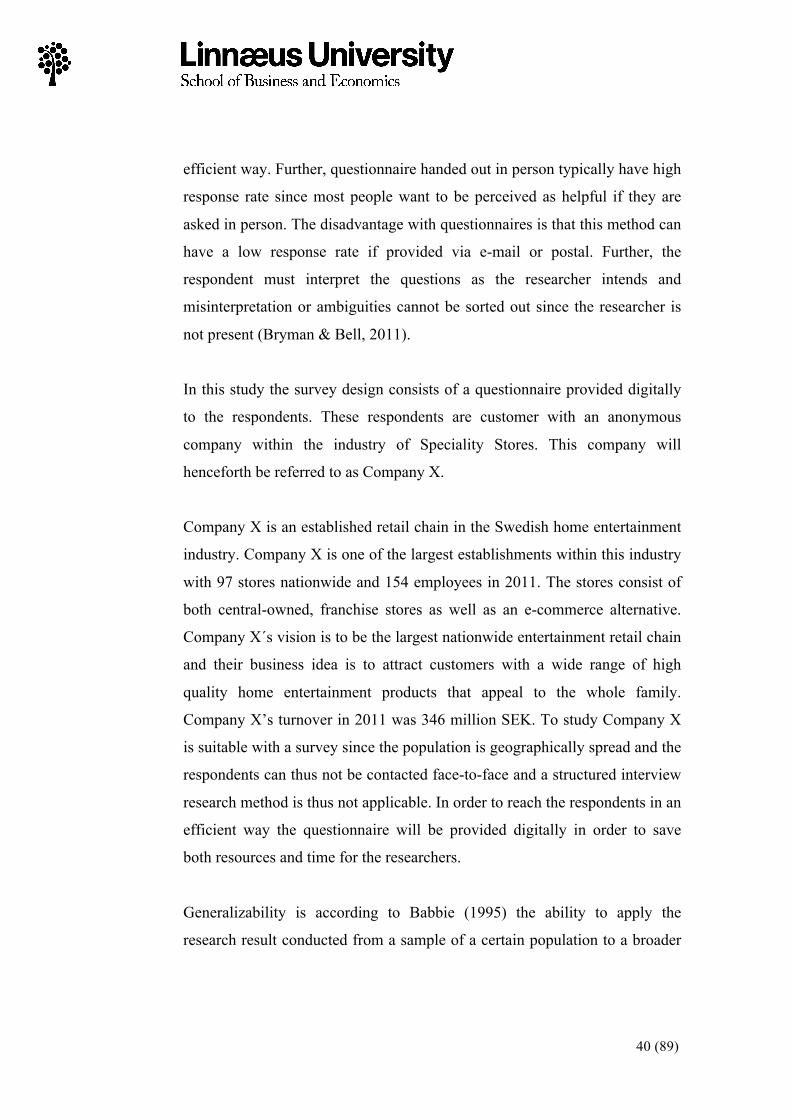
4.4 Research Strategy Table 1. Research Strategies. Yin (2003)
Research Strategy
Form of Research Question
Requires Control Over Behavioral Events
Focuses on Contemporary Events
Experiment Survey Archival analysis History Case study
How why Who, what, where, how many, how much Who, what, where, how many, how much How, why How, why
Yes No No No No
Yes Yes Yes/no No Yes
There are a number of different research strategies available. What separates
these strategies is the formulation of the research question, the required
control the research has over behavioral events, as well as the time
perspective the study assumes (Yin, 2003).

39 (89)
In this study the research strategy used is a survey. The justification for this
choice of strategy is based on that the research project requires a focus on
contemporary events and historical research strategy is thus not applicable for
this study. Further, archival analysis could be excluded since this type of
strategy focuses on secondary data already available from other sources of
information. Experiment was not viable since the researchers had no
opportunity to control the behavioral events of all respondents required to
accomplish an experiment. Further, this study will deal with a purpose that
answer to questions with the character of how much, which leads to that a
survey is the most suitable for this research project. Case study was not
suitable since questions of how much cannot be answered to with this type of
research strategy.
4.5 Data Collection Method
Within survey data collection there are a number of different approaches to
how data is collected and thereby how the survey is designed. A survey can
be formed as either a questionnaire or as a structured interview. A structured
interview is when the respondent completes the survey with the presence of
the researcher face-to-face or by telephone Ghauri & Gronhaug, 2010). The
advantage with an interview survey is that the researcher has the opportunity
to clarify any question marks that the respondent might experience.
Simultaneously, an interview survey also has disadvantages since the method
is very time consuming and more expensive to accomplish than a
questionnaire (Bryman & Bell, 2011; Ghauri & Gronhaug, 2010).
A questionnaire survey is when the respondent receives the research as a
document either by mail, digitally or in person from the researcher. The
advantage with these types of surveys is that the research can reach a wide
geographical area and a large amount of respondents in a cost and time
40 (89)
efficient way. Further, questionnaire handed out in person typically have high
response rate since most people want to be perceived as helpful if they are
asked in person. The disadvantage with questionnaires is that this method can
have a low response rate if provided via e-mail or postal. Further, the
respondent must interpret the questions as the researcher intends and
misinterpretation or ambiguities cannot be sorted out since the researcher is
not present (Bryman & Bell, 2011).
In this study the survey design consists of a questionnaire provided digitally
to the respondents. These respondents are customer with an anonymous
company within the industry of Speciality Stores. This company will
henceforth be referred to as Company X.
Company X is an established retail chain in the Swedish home entertainment
industry. Company X is one of the largest establishments within this industry
with 97 stores nationwide and 154 employees in 2011. The stores consist of
both central-owned, franchise stores as well as an e-commerce alternative.
Company X´s vision is to be the largest nationwide entertainment retail chain
and their business idea is to attract customers with a wide range of high
quality home entertainment products that appeal to the whole family.
Company X’s turnover in 2011 was 346 million SEK. To study Company X
is suitable with a survey since the population is geographically spread and the
respondents can thus not be contacted face-to-face and a structured interview
research method is thus not applicable. In order to reach the respondents in an
efficient way the questionnaire will be provided digitally in order to save
both resources and time for the researchers.
Generalizability is according to Babbie (1995) the ability to apply the
research result conducted from a sample of a certain population to a broader
41 (89)
population. This means that by studying a representative sample from a
population, for example a company, generalizability can be achieved for a
broader population such as an entire industry (Creswell, 2003; Yin, 2003)
Further, This type of generalizability is according to Yin (2003) called
statistical generalization and has been applied in this study. This was
implemented by studying a sample of Company X´s customers in order to be
able to draw generalizable conclusions about the industry of Speciality Stores
by applying the result of the sample to the entire population.
4.6 Data Collection Instrument
4.6.1 Operationalization and Measurement of Variables
According to Bryman & Bell (2011); Saunders, Lewis & Thornhill (2009) as
well as Ghauri & Gronhaug (2010) an operationalization is the process where
abstract theoretical concepts or a phenomenon are turned into measureable
items that can be measured and understood in a real world context. Bryman
& Bell (2011) mean that an extensive operationalization process is required
since a phenomenon or theoretical construct possesses no adequate real
measurability. According to Bryman & Bell (2011); Saunders, Lewis &
Thornhill (2009) as well as Ghauri & Gronhaug (2010) the operationalization
process means that these theoretical concepts are further divided into
variables that are decomposed into measureable items. Bryman & Bell
(2011); Saunders, Lewis & Thornhill (2009) as well as Ghauri & Gronhaug
(2010) mean that these constructed and decomposed measurable items can be
addressed as questions that ultimately represent the theoretical concept in a
study.
In order to measure the theoretical concepts (satisfaction, trust, commitment,
customer retention and word-of-mouth communication) in this study the
concepts had to be operationalized. These theoretical concepts were further
42 (89)
decomposed into variables that represented these theoretical concepts.
However, due to the complex nature of relationships described by Babin,
Darden & Griffin, (1994); Fornell & Wernerfelt, (1987); Reichheld & Teal
(1996) as well as Vinson et al, (1977) who mention that different types of
consumers value different things in the relationship with a company, the
concepts had to be further decomposed. Due to this reasoning, this
decomposition was performed in order to ensure that the complexity and
different viable influences of relationships were measured in the study. This
is also supported by Morgan & Hunt (1994) who stress issues related to
relationship measures. With this second decomposition the study reached
theoretical substantiated indicators that represented the variables.
Bryman & Bell (2011) mean that indicators themselves cannot be measured
and therefore need to be coded in order to be quantifiable. This can be
achieved through a Likert scale measure. A Likert scale measurement is
according to Bryman & Bell (2011) as well as Saunders, Lewis & Thornhill
(2009) a way to measure an indicator by coding the indicator for the
respondent. The indicator can be coded from either 1-7 or from 1-5 where 1
represents “strongly disagree” and the highest score represent “strongly
agree” (Bryman & Bell 2011; Saunders, Lewis & Thornhill 2009). With a
Likert scale the indicator is quantifiable and the result can thus be measured
and compared.
The use of available measurements such as a Likert scale measure is a
recognized method to reach appropriate measures (Bryman & Bell 2011;
Saunders, Lewis & Thornhill 2009). This will provide the study with more
adequate measures when it comes the quality of the measures (Bryman &
Bell 2011). Antecedents’ measures of satisfaction, trust, commitment,
customer retention and word-of-mouth communication have been reviewed
43 (89)
through the theoretical background in this study. All adequate instrumental
measure is originated from the literature. However, these indicators have
been reformulated to suit the specific purpose of this study. For a complete
operationalization table including measurable items see attachment 1 and to
see an overview of questions developed specifically for this study see
attachment 2.
Bryman & Bell (2011) as well as Ghauri & Gronhaug (2010) states that a
measurement can be achieved with either a single or multiple indicator
measurement. However, a single indicator may capture only a portion of the
underlying concept if the respondents misinterpret the single question that
can offset its effects. Simultaneously, multiple indicators cover a wider range
and at the same time ensure that concepts are investigated since a
misinterpreted question is covered by another. Most importantly, the internal
validity of the study is strengthened by multiple indicators (Bryman & Bell
2011; Ghauri & Gronhaug 2010).
The indicators in this study are derived from the literature review. However,
within the construct of commitment the measureable items continuity costs,
search costs, setup and sunk costs were excluded when the operationalization
process was performed since these items measure external factors beyond
Company X´s control to have an impact on and are thus not relevant to
investigate in this study. Further, solidarity and cohesion within the construct
of commitment was also discarded since these items did not fall within the
level of significance when a correlation analysis was performed.
Simultaneously, the items confidence, violation of promises and friendship
was also excluded due to that they did not fall within the level of
significance. Tailored offers within commitment were also excluded since the
pretest performed indicated that the respondents became confused when these
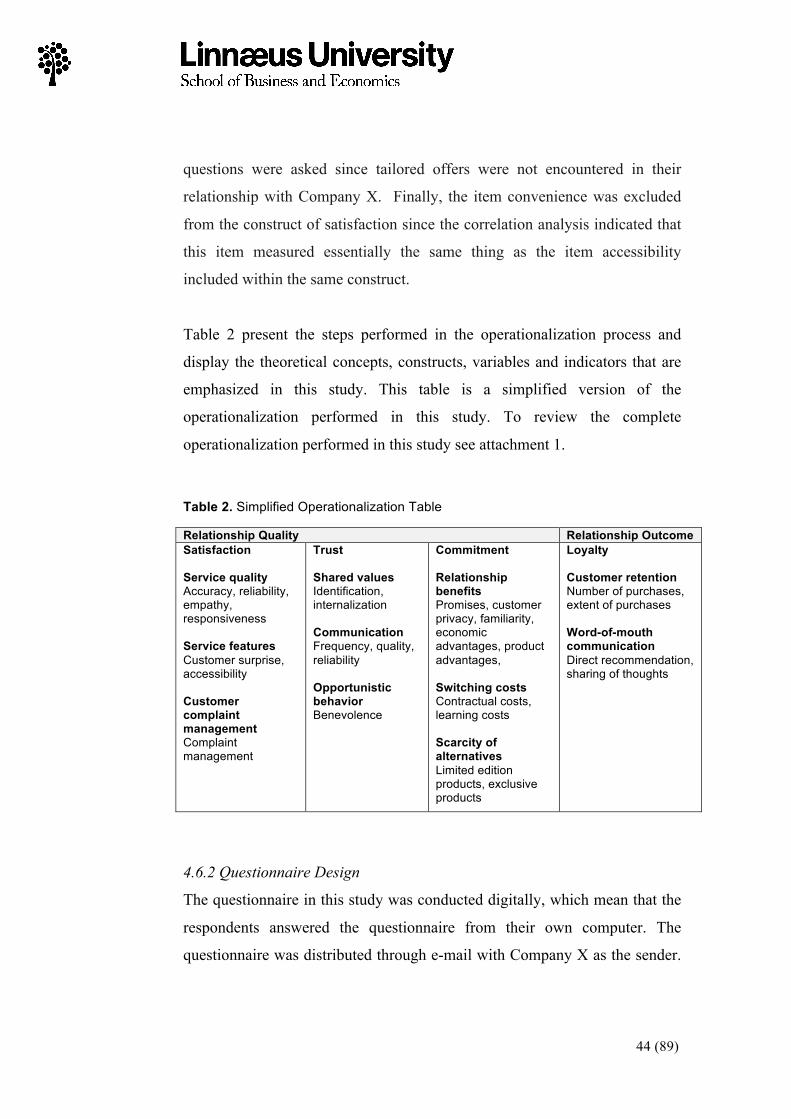
44 (89)
questions were asked since tailored offers were not encountered in their
relationship with Company X. Finally, the item convenience was excluded
from the construct of satisfaction since the correlation analysis indicated that
this item measured essentially the same thing as the item accessibility
included within the same construct.
Table 2 present the steps performed in the operationalization process and
display the theoretical concepts, constructs, variables and indicators that are
emphasized in this study. This table is a simplified version of the
operationalization performed in this study. To review the complete
operationalization performed in this study see attachment 1.
Table 2. Simplified Operationalization Table
Relationship Quality Relationship Outcome Satisfaction Service quality Accuracy, reliability, empathy, responsiveness Service features Customer surprise, accessibility Customer complaint management Complaint management
Trust Shared values Identification, internalization Communication Frequency, quality, reliability Opportunistic behavior Benevolence
Commitment Relationship benefits Promises, customer privacy, familiarity, economic advantages, product advantages, Switching costs Contractual costs, learning costs Scarcity of alternatives Limited edition products, exclusive products
Loyalty Customer retention Number of purchases, extent of purchases Word-of-mouth communication Direct recommendation, sharing of thoughts
4.6.2 Questionnaire Design
The questionnaire in this study was conducted digitally, which mean that the
respondents answered the questionnaire from their own computer. The
questionnaire was distributed through e-mail with Company X as the sender.
45 (89)
In this e-mail the respondents were asked to fill out the questionnaire and
were informed that their contribution was anonymous and of great
importance for the company’s ability to improve the offer provided by them.
In exchange for participating the respondents were granted a reward from
Company X in form of a discount offer. Bryman & Bell (2011) mention that
it is important to give respondents something in exchange when participating
in research in order to increase the response rate. Although the questionnaire
was intended to gather information for purposes of this study it was important
that the respondent got the feeling that Company X was conducting the
survey. This was important in order to maintain credibility with the
respondent and to further increase the response rate.
The questions were extracted from the operationalization of the study and
were each related to the different concepts of the study. The questions were
formulated as statements that the respondent had to consider from his
perspective and further grade on a provided Likert scale from one to seven
where one was referred to as “strongly disagree” and number seven where
referred to as “strongly agree”. According to Bryman & Bell (2011) a Likert
scale is a scale commonly involved in research and is often used in
questionnaires. Further, the advantage with this scale is that the questions are
equally weighted and pre-coded, which means that the analysis of the
answers are simplified due to the coding of the material. It is of great
importance that the questionnaire has a clear and understandable design of
how and why the respondent should complete the questionnaire. A short
introduction section can be added to clarify how the respondent should reply.
In this study an introductory text was created and included in the
questionnaire to achieve these described objectives. The respondents that
answered the survey have Swedish as their mother tongue. Due to this, their
46 (89)
skills in the English language could not be determined and to ensure that all
of the respondents understand the questions asked properly, a translation to a
Swedish version of the questionnaire was made. After the translation was
made, a third person with significant knowledge in the specific theoretical
field was asked to back translate the Swedish version so that the researcher
could ensure that the questions was translated and understood correctly. For
the Swedish version of the questionnaire see attachment 3 and the English
version attachment 4.
4.6.3 Pretesting
The objective to pursue when performing a pretest is to in an early stage
identify potential factors that in turn can be improved which finally will lead
to a more reliable study. A pretest can be performed by letting an expert with
theoretical knowledge about the specific concepts judge and give suggestions
of improvements. A pretest can also be conducted by using a selection of
respondents derived to the target group of the study in order to examine how
well the survey is understood. (Bryman & Bell, 2011)
In this study a pretest was conducted by letting an expert within the specific
area review the survey to determine if the questions were properly stated.
Further, a pretest was also conducted where 80 respondents from Company
X´s customer database was included. These respondents were given the
opportunity to complete the survey as well as give feedback about the
questions and structure. This feedback was than taken into account when
developing the final version of the survey. Further, these respondents were
excluded from the main data collection sample. As many as 80 respondents
could be used in the pretest due to the privilege of having access to Company
X´s database where up to 250 000 customer are registered.
47 (89)
4.7 Sampling
According to Bryman & Bell (2011) a population can be explained as the
entities within a specific group or/and in the same geographical area. The
population in this study consists of people that are members of Company X.
In order to become a member of the company the customer has at some point
in time sought the company and the customer information has at this point
been registered in the company database. This customer database consists of
approximately 250 000 members that are both male and females, represented
in the ages from 12 years and above spread across the geographical area of
Sweden.
According to Bryman & Bell (2011) there are typically two types of surveys,
including census surveys that study every element of a population and sample
surveys that study a share of a population to be able to draw generalizable
conclusions about the whole. There are distinct advantages of sample survey
methods in contrast to census survey methods in the way that it saves time
and money for the researcher when it comes to conducting the survey.
The survey method applied in this study is a sample survey since the
population studied is extensive and distributed across the geographical area
of Sweden. It is thereby not feasible to study the population with a census
approach and a sample survey method is thus preferable.
4.7.1 Sampling Frame
The first step in a sample survey method is to define the population under
investigation. The second step is to identify the sampling frame of the
population, which involves determining components of interest from which
the sample is decided. The last step in the process is to decide the size of the
sample to ensure that the entire population is represented in the sample. There
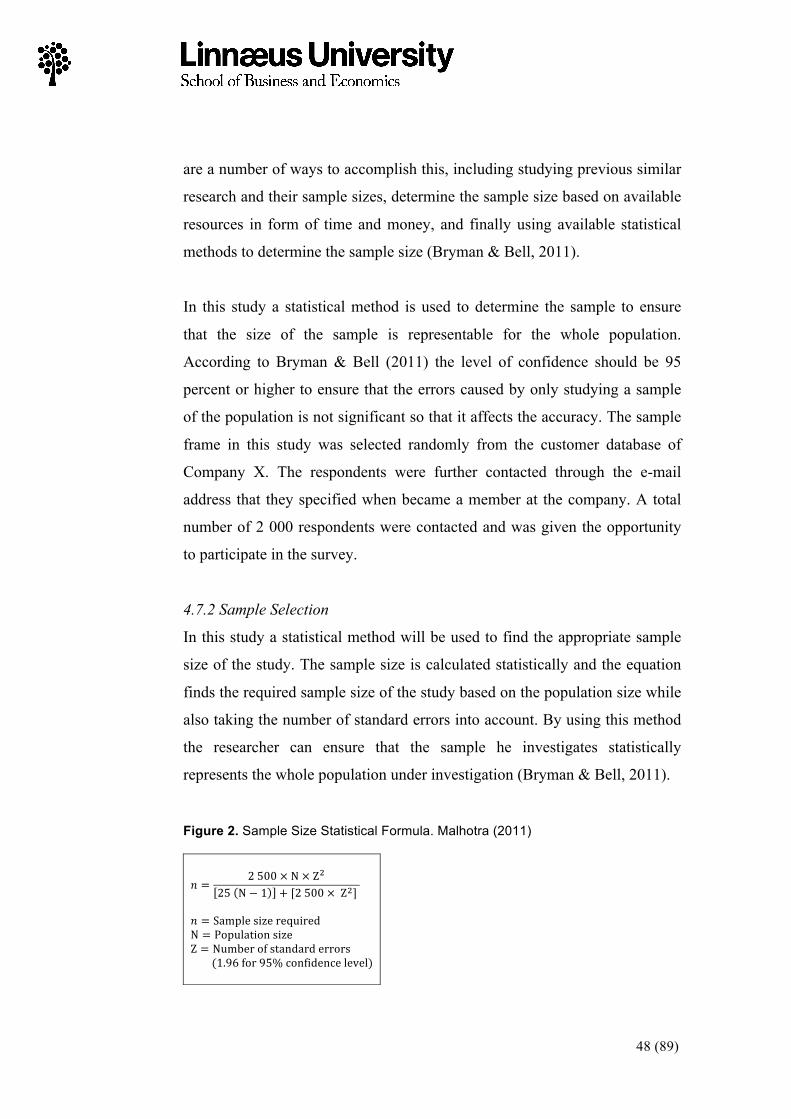
48 (89)
are a number of ways to accomplish this, including studying previous similar
research and their sample sizes, determine the sample size based on available
resources in form of time and money, and finally using available statistical
methods to determine the sample size (Bryman & Bell, 2011).
In this study a statistical method is used to determine the sample to ensure
that the size of the sample is representable for the whole population.
According to Bryman & Bell (2011) the level of confidence should be 95
percent or higher to ensure that the errors caused by only studying a sample
of the population is not significant so that it affects the accuracy. The sample
frame in this study was selected randomly from the customer database of
Company X. The respondents were further contacted through the e-mail
address that they specified when became a member at the company. A total
number of 2 000 respondents were contacted and was given the opportunity
to participate in the survey.
4.7.2 Sample Selection
In this study a statistical method will be used to find the appropriate sample
size of the study. The sample size is calculated statistically and the equation
finds the required sample size of the study based on the population size while
also taking the number of standard errors into account. By using this method
the researcher can ensure that the sample he investigates statistically
represents the whole population under investigation (Bryman & Bell, 2011). Figure 2. Sample Size Statistical Formula. Malhotra (2011)
! = 2!500!×!N!×!Z!25! N − 1 + [2!500!×!!Z!]!
! = Sample!size!required!!N = Population!size!!Z = Number!of!standard!errors!!!!!!!!!!(1.96!for!95%!confidence!level)
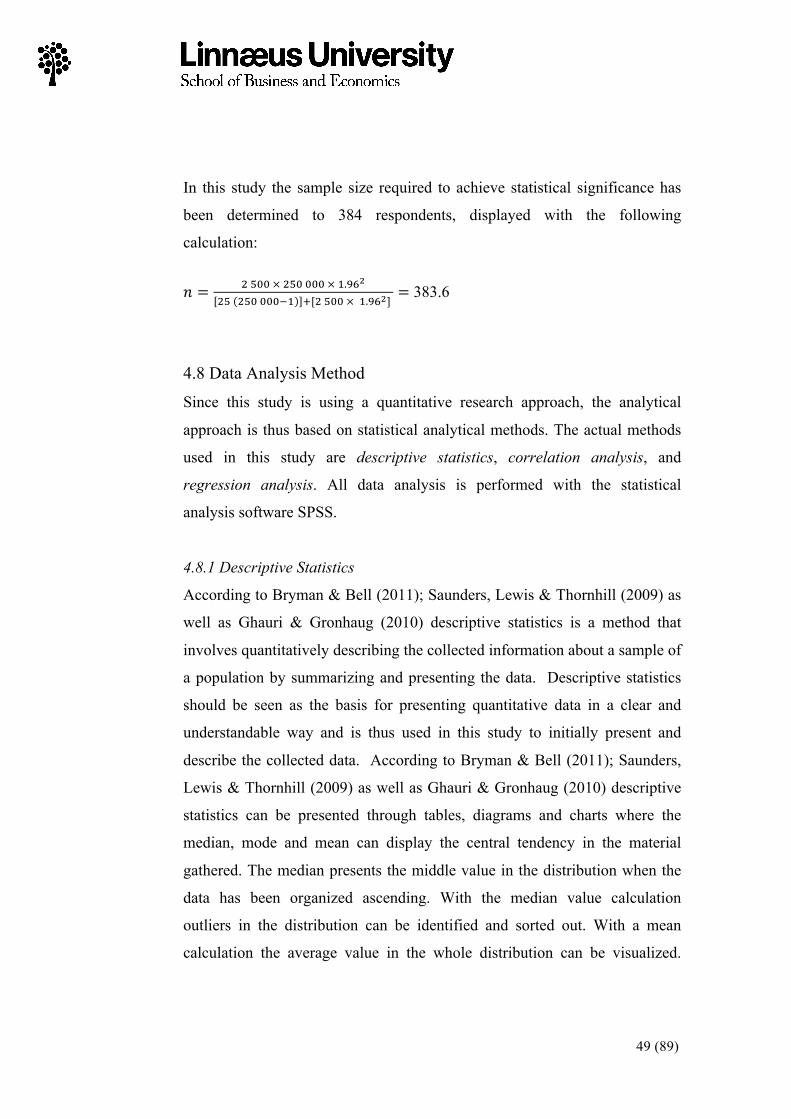
49 (89)
In this study the sample size required to achieve statistical significance has
been determined to 384 respondents, displayed with the following
calculation:
! = !!!""!×!!"#!!!!!×!!.!"!!"! !"#!!!!!! ![!!!""!×!!!.!"!]! = 383.6
4.8 Data Analysis Method
Since this study is using a quantitative research approach, the analytical
approach is thus based on statistical analytical methods. The actual methods
used in this study are descriptive statistics, correlation analysis, and
regression analysis. All data analysis is performed with the statistical
analysis software SPSS.
4.8.1 Descriptive Statistics
According to Bryman & Bell (2011); Saunders, Lewis & Thornhill (2009) as
well as Ghauri & Gronhaug (2010) descriptive statistics is a method that
involves quantitatively describing the collected information about a sample of
a population by summarizing and presenting the data. Descriptive statistics
should be seen as the basis for presenting quantitative data in a clear and
understandable way and is thus used in this study to initially present and
describe the collected data. According to Bryman & Bell (2011); Saunders,
Lewis & Thornhill (2009) as well as Ghauri & Gronhaug (2010) descriptive
statistics can be presented through tables, diagrams and charts where the
median, mode and mean can display the central tendency in the material
gathered. The median presents the middle value in the distribution when the
data has been organized ascending. With the median value calculation
outliers in the distribution can be identified and sorted out. With a mean
calculation the average value in the whole distribution can be visualized.
50 (89)
With the mode value calculation the most frequent value can be identified.
This calculation can be valuable if one value in the distribution is very
overrepresented making a median calculation misleading (Bryman & Bell,
2011; Saunders, Lewis & Thornhill, 2009; Ghauri & Gronhaug, 2010)
In this study the calculation of median will be emphasized to find the central
tendency of the gathered material. This is implemented due to the ordinal
nature of the measures where a Likert scale is emphasized. Bryman & Bell
(2011) mentions that median is the best way to find the central tendency in
ordinal level measures.
4.8.2 Correlation Analysis
Correlation analysis is according to Bryman & Bell (2011); Saunders, Lewis
& Thornhill (2009) as well as Ghauri & Gronhaug (2010) a method that
evaluate the strength of the relationship between variables, which more
concretely describes to what degree a change of one variable influence a
change in another. This can be addressed by calculating the correlation
coefficient between the variables. This coefficient can vary between -1 to 1
where -1 means that two variables are perfectly inversely related to each
other. Simultaneously, 1 means that two variables are perfectly related to
each other meaning that if one variable value changes by one the other
variable changes equally. If the coefficient between the variables is 0 or close
to 0 this means that the variables have no relation to each other. Further, it is
of importance that the independent variables in a study are not to closely
related to each other since this mean that they measure similar outcomes with
the respondent (Bryman & Bell, 2011; Saunders, Lewis & Thornhill, 2009;
Ghauri & Gronhaug, 2010). In this study a calculation of correlation between
the variables in the study has been performed in order to determine the
relationship between the variables.
51 (89)
4.8.3 Regression Analysis
According to Bryman & Bell (2011); Saunders, Lewis & Thornhill (2009) as
well as Ghauri & Gronhaug (2010) regression analysis is a method that
assesses the explanation between an independents and dependent variable.
The method can thus determine to what extent an independent variable
explains the value of a dependent variable.
Cohen et al. (2003) mentions that multiple regression analysis is a stronger
method than a single regression analysis since the researcher can address how
a dependent variable is explained by multiple independent variables. Cohen
et al. (2003) states that this analysis is assessed by investigating the R2 that
present how the variance of a dependent variable can be explained by the
investigated independent variables.
In this study a multiple regression analysis is implemented to due to the
advantages mentioned by Cohen et al. (2003). It is also performed since
multiple independent variables exist in relation to each construct. With this
approach the study can find how decomposed variables represent the
constructs of the study and in particular how these constructs (satisfaction,
trust and commitment) answers to the outcome of relationships (customer
retention and word-of mouth-communication).
4.9 Quality Criteria
4.9.1 Validity
According to Bryman & Bell (2011) validity refers to if measures of a
concept in a study actually measure that intended concept. Validity is an issue
that should be stressed in every particular study since different types of study
approaches applied requires that validity is addressed in different ways. Due
52 (89)
to the quantitative research approach of this study three types of validity is
taken into account. These are content, construct and criterion validity.
4.9.2 Content Validity
According to Bryman and Bell (2011) as well as Saunders, Lewis &
Thornhill (2009) it is of great importance to ensure that the questions asked to
the respondents actually measures what the question is intended to measure.
Further, Bryman and Bell (2011) as well as Saunders, Lewis & Thornhill
(2009) mentions that the questions should appear easy to answer and be
understandable for the respondents. This is addressed as content validity.
Content validity can be achieved by letting experts review and judge the
questions before the gathering of data. Bryman and Bell (2011) as well as
Saunders, Lewis & Thornhill (2009) mentions that a preview by experts
strengthens the content validity in the study.
Content validity can according to Bryman and Bell (2011) as well Saunders,
Lewis & Thornhill (2009) further be addressed by pretesting the
questionnaire with help from prospective respondents that is included in the
calculated sample. Bryman and Bell (2011) as well as Saunders, Lewis &
Thornhill (2009) mean that pretesting can determine whether questions
appear understandable or if the questionnaire are too extensive. The
knowledge gained from a pretest are very valuable for the actual gathering of
data since it gives the opportunity to correct any potential errors while
simultaneously improving the questionnaire with help from the pretest. In this
study content validity was achieved by allowing a person with approved
knowledge about the theoretical framework review the survey questionnaire
and by this ensure that the questions appear understandable and related to the
theory. Further, content validity in this study was also realized by distributing
53 (89)
the questionnaire to respondents derived from this study´s target group that in
turn gave feedback both regarding the formulation of questions and structure.
4.9.3 Construct Validity
Construct validity is according to Bryman and Bell (2011) as well as
Saunders, Lewis & Thornhill (2009) whether the measures in a study actually
address and measure the specific concepts that it is intended to measure or
not. In this study construct validity was addressed with convergence and
discriminate validity.
Convergence validity is according to Bryman and Bell (2011) as well as
Saunders, Lewis & Thornhill (2009) to what extent measures in a study
converge with other measures of the same construct. Bryman and Bell (2011)
as well as Saunders, Lewis & Thornhill (2009) mean that convergence
validity can be indicated as strong correlations between the independent
variables and dependent under the same constructs. In this study,
convergence validity has been addressed by stressing the correlation between
independent variables within theoretical constructs in relation to each other.
A strong positive correlation indicated convergence validity between the
theoretical constructs and the different independent variables within that
construct.
Discriminant validity is according to Miles & Huberman (1994) the
correlation between the different measures or theoretical concepts in a study.
Miles & Huberman (1994) mean that discriminant validity is achieved when
the different concepts or dependent variables are unrelated when they are
suppose to be unrelated. In other words, Miles & Huberman (1994) state that
the dependent variables should have low or no correlation between each other
in order to reach construct validity in the study. In this study the correlation
54 (89)
between the dependent variables stressed to ensure construct validity. It was
of great importance that the correlation coefficient between the variables
representing different theories in the study was non-existing or low in order
to ensure construct validity. This was important since these variables were
intended to measure different theoretical concepts and a correlation should
thus not exist.
4.9.4 Criterion Validity
Criterion validity refers to the extent to which the operationalization can
predict constructs in relation to other variables (Bryman & Bell, 2011).
Criterion validity can be divided into two different types of validities that is
concurrent and predictive validity (Bryman & Bell, 2011).
Concurrent validity is obtained by compare the test at hand with an existing
similar test with measures that already have been validated. The validated
measures do not have to be exactly the same constructs as the measures at
hand, only related to each other. Further, by using similar measures as used in
the validated tests the researcher can thus achieve concurrent validity in the
test at hand (Bryman & Bell, 2011; Ghauri & Gronhaug, 2010). In this study,
concurrent validity has been achieved by using measurable items validated in
previous research when formulating the survey questions.
Predictive validity is of similar character that concurrent validity, but with
one main difference. The time aspect separates the predictive validity from
the concurrent in the way that the researcher uses a future criterion measure
instead of a contemporary measure that is used to obtain concurrent validity
(Bryman & Bell, 2011). In order to obtain predictive validity an
operationalization of theoretical concepts is used to predict a future outcome
(Ghauri & Gronhaug, 2010). In this study, predictive validity has been
55 (89)
achieved by collecting theoretical insight that further has been
operationalized in order to state hypotheses, which later can be tested by
implementing a survey and analyzing the result.
4.9.5 Reliability
Reliability is according to Bryman & Bell (2011); Saunders, Lewis &
Thornhill (2009) as well as Ghauri & Gronhaug (2010) how consistent a
measure of a concept is. Reliability can according to Bryman & Bell (2011)
be addressed by assessing the stability, the internal reliability and inter-
observer consistency.
The stability aspect of reliability is according to Bryman & Bell (2011) how
stable a measurement is over time. In other words, stability occurs when there
is little variation in the results that measure a specific construct at different
points in time. Stability can be addressed by asking the questionnaire
questions at another point in time to find if there variances exists between the
results of the studies. In this study stability as described by Bryman & Bell
(2011) could not be performed due to the time restrains and limitation in
resources.
Internal reliability describes the degree to which a measure is consistent
within itself, i.e. how well the different measurable items within an
operationalized concept correlate with each other (Bryman & Bell, 2011).
According to Ghauri & Gronhaug (2010) internal reliability is established by
calculating the Cronbach´s alpha coefficient, which can vary from perfect
internal reliability (indicated as 1) to no internal reliability (indicated as 0).
Different authors accept different values of Cronbach´s alpha in order to
achieve internal reliability, but the most frequent accepted value is .70 as it
should be equal to or higher than to reach internal reliability (Hair et al.
56 (89)
2003). In this study, a Cronbach´s alpha value of at least .80 was accepted in
order to obtain internal reliability.
According to Bryman & Bell (2011) inter-observer consistency refers to
subjective perspectives that can influence the result of an observed measure.
This means that whenever human interpretation is a part of the measurement
procedure, the researcher must be aware of that the reliability can be
questioned. In this study, no observation has been made and interpretations of
subjective nature have been evaluated in symbiosis between the authors of
this study.
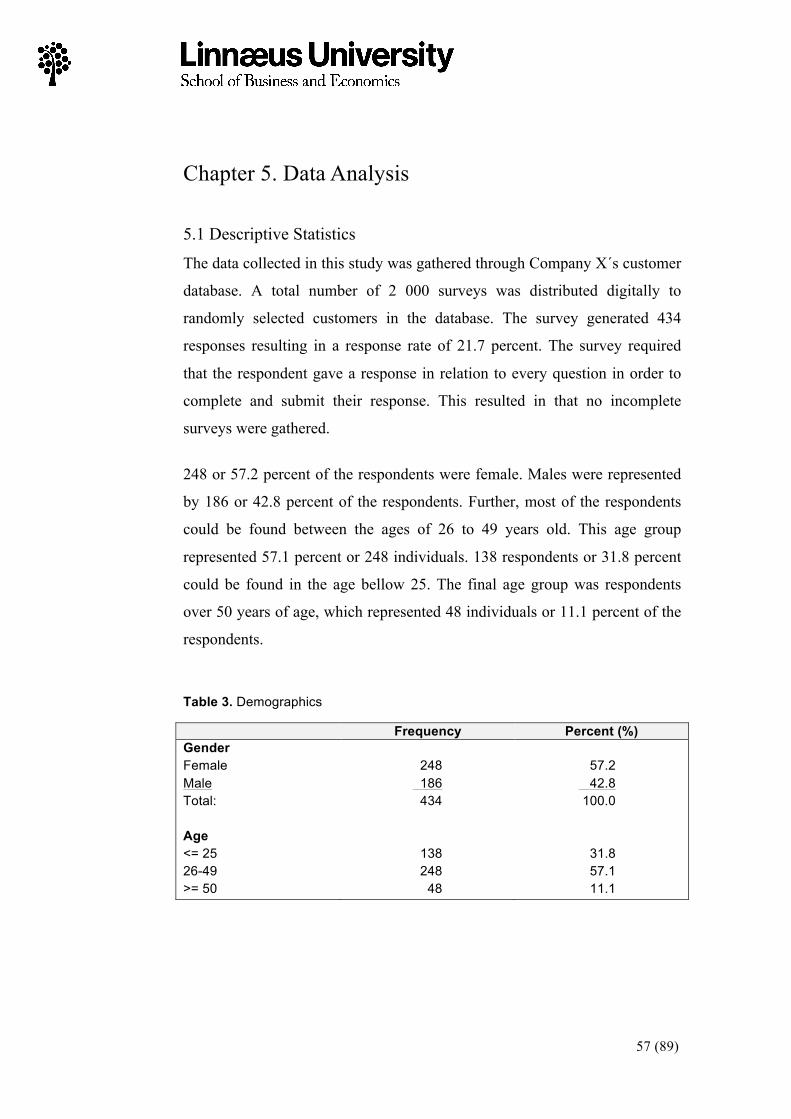
57 (89)
Chapter 5. Data Analysis
5.1 Descriptive Statistics
The data collected in this study was gathered through Company X´s customer
database. A total number of 2 000 surveys was distributed digitally to
randomly selected customers in the database. The survey generated 434
responses resulting in a response rate of 21.7 percent. The survey required
that the respondent gave a response in relation to every question in order to
complete and submit their response. This resulted in that no incomplete
surveys were gathered.
248 or 57.2 percent of the respondents were female. Males were represented
by 186 or 42.8 percent of the respondents. Further, most of the respondents
could be found between the ages of 26 to 49 years old. This age group
represented 57.1 percent or 248 individuals. 138 respondents or 31.8 percent
could be found in the age bellow 25. The final age group was respondents
over 50 years of age, which represented 48 individuals or 11.1 percent of the
respondents.
Table 3. Demographics
Frequency Percent (%) Gender Female Male Total: Age <= 25 26-49 >= 50
248 186 434 138 248 48
57.2 42.8 100.0 31.8 57.1 11.1
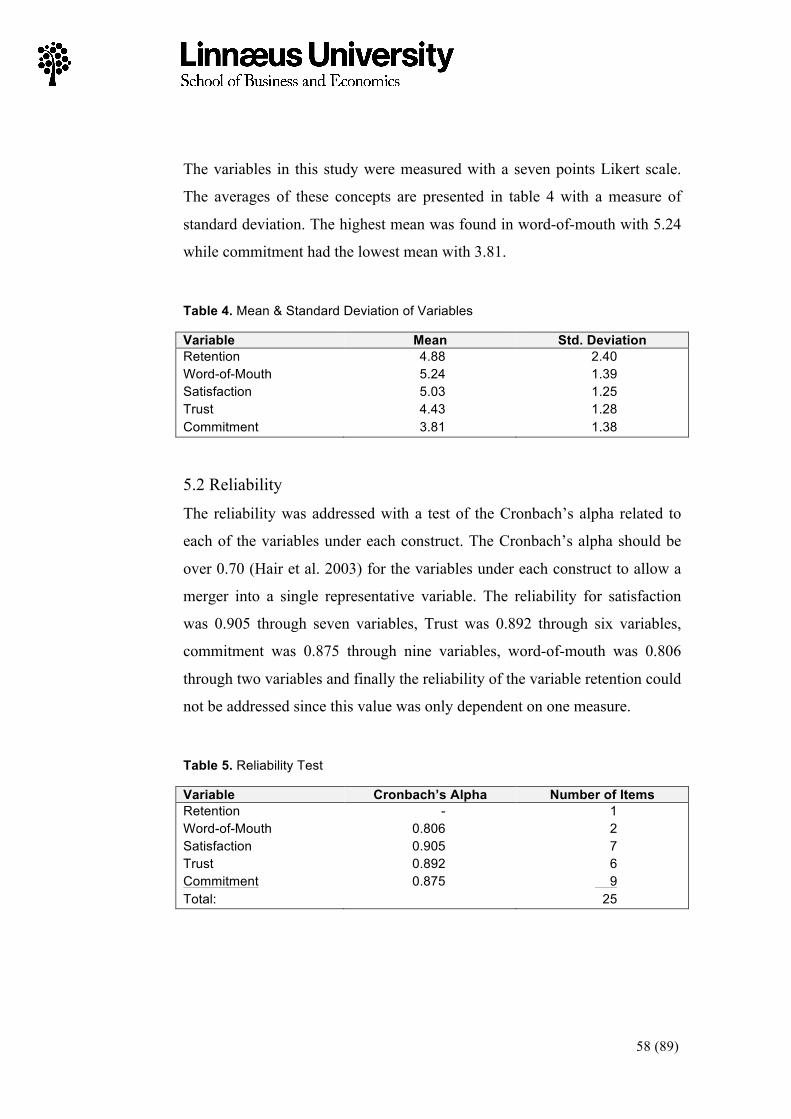
58 (89)
The variables in this study were measured with a seven points Likert scale.
The averages of these concepts are presented in table 4 with a measure of
standard deviation. The highest mean was found in word-of-mouth with 5.24
while commitment had the lowest mean with 3.81.
Table 4. Mean & Standard Deviation of Variables
Variable Mean Std. Deviation Retention Word-of-Mouth Satisfaction Trust Commitment
4.88 5.24 5.03 4.43 3.81
2.40 1.39 1.25 1.28 1.38
5.2 Reliability
The reliability was addressed with a test of the Cronbach’s alpha related to
each of the variables under each construct. The Cronbach’s alpha should be
over 0.70 (Hair et al. 2003) for the variables under each construct to allow a
merger into a single representative variable. The reliability for satisfaction
was 0.905 through seven variables, Trust was 0.892 through six variables,
commitment was 0.875 through nine variables, word-of-mouth was 0.806
through two variables and finally the reliability of the variable retention could
not be addressed since this value was only dependent on one measure.
Table 5. Reliability Test
Variable Cronbach’s Alpha Number of Items Retention Word-of-Mouth Satisfaction Trust Commitment Total:
- 0.806 0.905 0.892 0.875
1 2 7 6 9 25
!
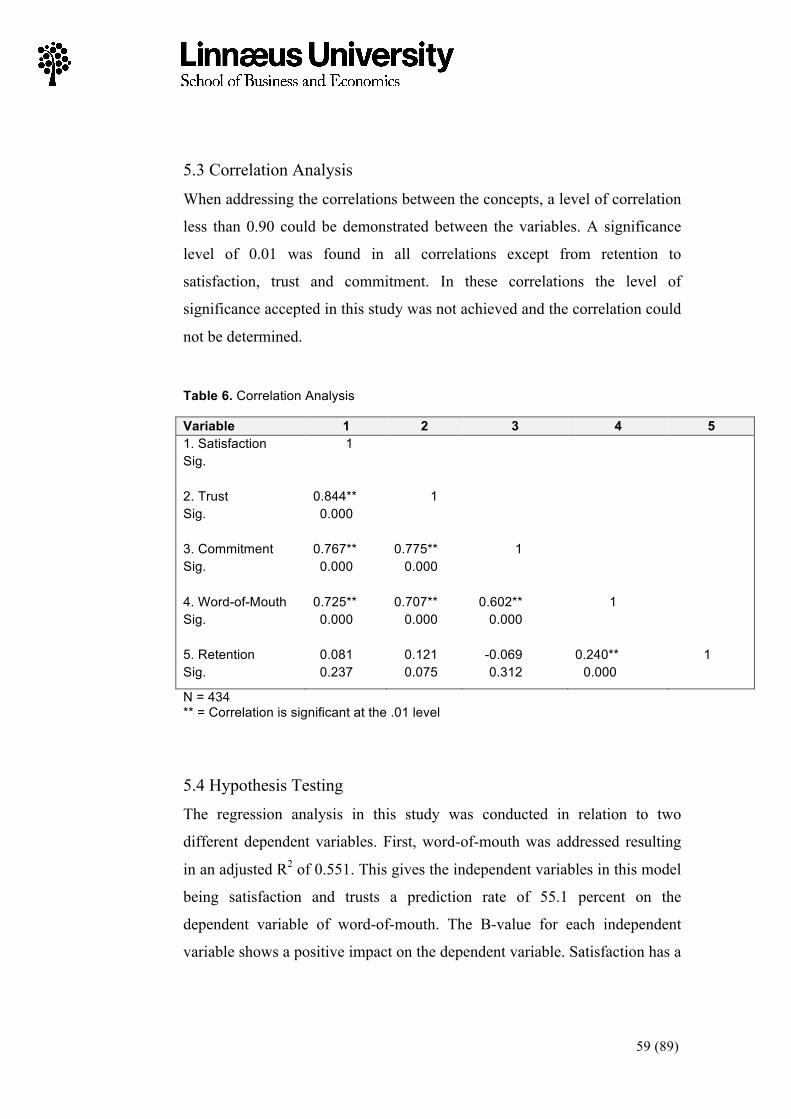
59 (89)
5.3 Correlation Analysis
When addressing the correlations between the concepts, a level of correlation
less than 0.90 could be demonstrated between the variables. A significance
level of 0.01 was found in all correlations except from retention to
satisfaction, trust and commitment. In these correlations the level of
significance accepted in this study was not achieved and the correlation could
not be determined.
Table 6. Correlation Analysis
Variable 1 2 3 4 5 1. Satisfaction Sig. 2. Trust Sig. 3. Commitment Sig. 4. Word-of-Mouth Sig. 5. Retention Sig.
1 0.844** 0.000 0.767** 0.000 0.725** 0.000 0.081 0.237
1 0.775** 0.000 0.707** 0.000 0.121 0.075
1
0.602** 0.000 -0.069 0.312
1 0.240** 0.000
1
N = 434 ** = Correlation is significant at the .01 level !5.4 Hypothesis Testing
The regression analysis in this study was conducted in relation to two
different dependent variables. First, word-of-mouth was addressed resulting
in an adjusted R2 of 0.551. This gives the independent variables in this model
being satisfaction and trusts a prediction rate of 55.1 percent on the
dependent variable of word-of-mouth. The B-value for each independent
variable shows a positive impact on the dependent variable. Satisfaction has a
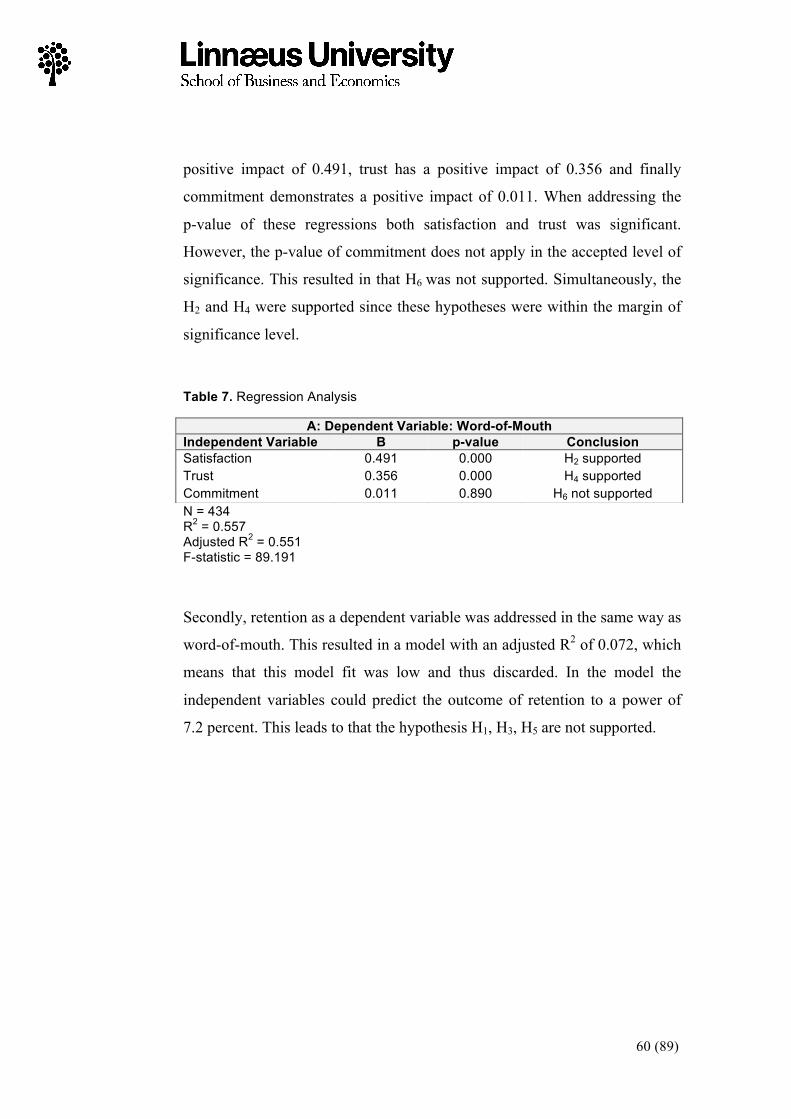
60 (89)
positive impact of 0.491, trust has a positive impact of 0.356 and finally
commitment demonstrates a positive impact of 0.011. When addressing the
p-value of these regressions both satisfaction and trust was significant.
However, the p-value of commitment does not apply in the accepted level of
significance. This resulted in that H6 was not supported. Simultaneously, the
H2 and H4 were supported since these hypotheses were within the margin of
significance level.
Table 7. Regression Analysis
N = 434 R2 = 0.557 Adjusted R2 = 0.551 F-statistic = 89.191
Secondly, retention as a dependent variable was addressed in the same way as
word-of-mouth. This resulted in a model with an adjusted R2 of 0.072, which
means that this model fit was low and thus discarded. In the model the
independent variables could predict the outcome of retention to a power of
7.2 percent. This leads to that the hypothesis H1, H3, H5 are not supported.
A: Dependent Variable: Word-of-Mouth Independent Variable B p-value Conclusion Satisfaction Trust Commitment
0.491 0.356 0.011
0.000 0.000 0.890
H2 supported H4 supported
H6 not supported
61 (89)
Chapter 6. Discussion, Conclusion & Implications
6.1 Discussion
The purpose of this thesis was to explain how satisfaction, trust and
commitment impacts customer retention and word-of-mouth communication
within the industry of Speciality Stores. Two suggested outcomes of
customer relationships were conceptualized through the available literature.
Customer retention function as one of the two outcome parts of the
relationship and word-of-mouth communication as the other. These outcomes
functioned as dependent variables in two different models that were tested in
relation to the independent variables of relationship quality. Regarding
customer retention, this model could not be supported since an accepted level
of significance was not achieved and a value of 0.072 for the adjusted R2
indicated a low model fit. The low model fit resulted in that this model was
discarded since no conclusions could be drawn. Accordingly, the hypotheses
H1, H3, H5 were thus not supported.
The model with word-of-mouth communication as dependent variable
achieved an adjusted R2 of 0.551. In this model, the two hypotheses regarding
satisfaction and trust (H2, H4) achieved an accepted level of significance
while the commitment hypothesis (H6) did not fall within the accepted level
of significance which resulted in that H6 could not be supported.
Simultaneously, the hypotheses H2 (satisfaction has a positive impact on
word-of-mouth communication) and H4 (trust has a positive impact on word-
of-mouth communication) could due to their accepted level of significance
therefore be supported. The B-values of these independent variables were
0.491 for satisfaction and 0.356 for trust, which indicated a variance in how
they individually influence the dependent variable of word-of-mouth
62 (89)
communication. It can thereby be stated that satisfaction has a greater impact
on word-of-mouth communication than trust.
The supported impact that satisfaction has on word-of-mouth communication
found in this study can also be supported in the available literature (Ladhari,
2007; Ranaweera & Prabhu, 2003; Kim, Ng & Kim, 2009; Bitner, 1990;
Oliver, 1980; Bloch, 1986; Reichheld & Sasser, 1990). This means that if
companies within the industry of Specialty Stores are able to satisfy
customers, these customers will communicate valuable word-of-mouth
communication about that company. In this way, word-of-mouth can be
achieved through high quality in both the physical offerings as well as in the
core service (Fornell et al., 1996).
Further, this study also support that trust has a positive impact on word-of-
mouth communication, which also is determined by Ranaweera & Prabhu
(2003). However, few studies have according to Ranaweera & Prabhu (2003)
investigated the relationship between trust and word-of-mouth
communication before. The supported relationship from this study stresses
the importance of trust in achieving word-of-mouth communication in the
industry of Specialty Stores. Specifically in this study, it has been
demonstrated that companies within the industry of Specialty Stores could
achieve word-of-mouth communication by reaching satisfaction and trust
among its customers. Further, this study has also demonstrated that
satisfaction to a greater extent leads to word-of-mouth communication than
trust in the industry of Specialty Stores. This indicates that the features of
satisfaction that are mentioned by Hensemark & Albinsson (2004) to be
service quality, service features and customer complaint management
represents the most important requirements, in relation to the features of trust,
that companies within the industry of Specialty Stores must consider in order
63 (89)
to achieve word-of-mouth communication among its customers. The features
of trust is mentioned by Morgan & Hunt (1994) to be shared values,
communication and opportunistic behavior that according to this study all
contributes to that customers spread word-of-mouth communication about a
company, but to a lower degree than satisfaction.
With an adjusted R2 of 0.551 it can be determined that satisfaction and trust
can explain word-of-mouth communication to 55.1 percent. Further, this also
indicates that word-of-mouth communication is explained to 44.9 percent by
other unknown factors than the independent variables of satisfaction and
trust. In recent years, service recovery has been described as a possible
antecedent of word-of-mouth communication (Buttle, 2011; Swanson &
Kelly, 2001). Swanson & Kelly (2001) mention that service recovery is the
actions that a company performs to address a failed service. What is
described is that if a company´s service recovery action is successfully
performed, the customer might be more willing to spread word-of-mouth
communication about that company. With regard to service recovery, the
remaining unexplained 44.9 percent of word-of-mouth might be attributed to
some extent by this theory. If service recovery was included in the conceptual
model the coefficient of determination could possibly be expanded.
The impact of commitment on word-of-mouth could not be supported in this
study. This may be due to that commitment consists of several dimensions,
which are not all examined in this study. Because of this, it is uncertain how
commitment affects word-of-mouth communication for the industry of
Specialty Stores. Further, the result of this study could either support
Fullerton (2003) who mentions that commitment can have a negative effect
on word-of-mouth or Dick & Basu (1994) as well as Harrison-Walker (2001)
who describe a positive relation between these concepts.
64 (89)
6.2 Conclusion
I. The model treating customer retention did not achieve significance,
which indicated a low model fit. This resulted in that the hypotheses
H1, H3 and H5 were not supported in this study.
II. The hypotheses treating word-of-mouth H2 and H4 were supported due
to their accepted level of significance while H6 did not fall within the
accepted level of significance and was thus not supported in this study.
III. Within the industry of Speciality Stores, satisfaction and trust can
together explain word-of-mouth communication with a 55.1 percent
certainty. The remaining 44.9 percent cannot be explained in this study
since it is dependent on unknown factors.
IV. The features of satisfaction (service quality, service features and
customer complaint management) are the most important of the treated
features for companies to enact within the industry of Specialty Stores
if customers to companies within this industry should express word-of-
mouth communication about that company.
V. The features of trust (shared values, communication, opportunistic
behavior) have also demonstrated to have an impact on the customer’s
willingness to spread word-of-mouth communication. However,
satisfaction has according to this study a greater coefficient of
determination than trust regarding word-of-mouth communication.
65 (89)
6.3 Academic Implications
Previous studies have demonstrated that satisfaction influences word-of-
mouth communication (Ladhari, 2007; Ranaweera & Prabhu, 2003, Kim, Ng
& Kim, 2009; Bitner, 1990; Oliver, 1980; Bloch, 1986; Reichheld & Sasser,
1990). The results found in this study supports the reasoning that these
authors mention. A contribution has further been made by this study in the
sense that the unknown influence between satisfaction and word-of-mouth
communication within the industry of Speciality Stores is hereby confirmed.
The influence that trust has on word-of-mouth communication described by
Ranaweera & Prabhu (2003) has also been supported with this study.
However, few studies have according to Ranaweera & Prabhu (2003)
investigated this influence. This study contributes by demonstrating that the
influence described by Ranaweera & Prabhu (2003) also is applicable in the
industry of Speciality Stores. Further, Ranaweera & Prabhu (2003) mention
that trust is just as important as satisfaction in achieving word-of-mouth
communication. This reasoning could not be supported since the influence of
satisfaction has according to this study been demonstrated to have a greater
impact on word-of-mouth communication than trust.
6.4 Managerial Implications
This study has supported that customer satisfaction and trust leads to word-
of-mouth communication within the industry of Speciality Stores. Further,
satisfaction has shown to have a stronger impact on word-of-mouth than
trust.
For managers it is therefore important to consider the different features of
satisfaction and trust in order to get customers to spread word-of-mouth about
the company. With regard to satisfaction it is important that the company´s
66 (89)
representatives proclaims that they cares about the customers in order to
convey reliability and accuracy. Further, it is also import for mangers to
consider the accessibility of their offer. This means that satisfaction can be
achieved by extending opening hours that exceeds the customers
predetermined expectations. Finally, it is import for mangers to be responsive
to customers’ opinions in order to achieve satisfaction. This can be
accomplished by advocating customer complaint management about the
company.
With regard to trust it is important that customers can identify themselves
with the company in order to achieve trust. With this in mind it is important
for managers at companies with this industry to know their target audience in
order to understand what is important for these customers. With this
knowledge the company can create an emotion among its customers that the
company match whom the customer is. For the sales representatives it is
important to demonstrate competence and credibility in order to create trust
both for the company as a whole and also for the sales representative as an
individual. Finally, trust can be achieved if the customer experiences that the
company is willing or has sacrificed something extra or unexpected in order
to maintain the relationship with the customer.
67 (89)
Chapter 7. Limitations & Future Research
7.1 Limitations
The findings of this study have been derived from the empirical information
gathered through Company X´s customer database. Since Company X is a
company within the industry of Speciality Stores this means that the result is
applicable for companies mainly within this specific industry. This type of
generalization were a sample of a population (in this study a sample of
Company X) is studied in order to draw general conclusions about a broader
population (in this study the industry of Speciality Stores) is supported by
Creswell (2003) as well as Yin (2003). Companies in other industries or
branches should interpret the result of this study carefully because the focus
throughout the entire study has been on the specific industry of Speciality
Stores.
The low model fit of customer retention lead to that the hypotheses treating
customer retention were not supported. This is a limitation of the study since
one part of the relationship outcome was thus discarded and conclusions in
relation to customer retention could therefore not be stated. The authors of
this study believe that the low model fit can be a result of that customers from
a specific company were emphasized for the empirical investigation. This
could have had an impact on the result in sense that some customers despite
dissatisfaction with the company choose to return to the company because of
unknown factors. This speculation is derived from a manual overview of the
empirical material were several respondents demonstrated contradictory
answers in relation to the study´s stated hypotheses. For instance, several
respondents showed a high retention rate to the company while
simultaneously being dissatisfied with the company. Further, the opposite
result was also observed in empirical material were very satisfied customers

68 (89)
had a low retention rate. This ambiguity can potentially be explained by that
the company’s customers do not value the components of relationship that
this study has treated.
7.2 Future Research
The model treating customer retention did not achieve statistical significance
and was thus discarded. Still, customer retention remains an important factor
for businesses in all types of industries according to the literature. This is
supported by Rigby, Reichheld & Dawson (2003) who mention that such a
small increase as five percent in customer retention could result in an
increase of up to 95 percent in profits for the company. Since the model
including retention developed in this study did not achieve statistical
significance it is suggested that future research stresses the issue of customer
retention within the industry of Speciality Stores. Due to that the conceptual
model treating customer retention developed in this study did not achieve
statistical significance we believe that it is important for future research to
initially adopt an exploratory research design to gain a deeper understanding
about the antecedents of customer retention within the industry of Speciality
Stores. With new valuable knowledge about customer retention derived from
exploratory research the phenomena can further be explored from a new
perspective.
That word-of-mouth communication can be derived from the company’s
achievement of satisfaction and trust has been supported in this study. These
results are derived from the supported hypotheses and the antecedents of
word-of-mouth communication could be tested on several companies in
different industries by emphasizing the supported hypothesis developed in
this study. The literature also suggests that service recovery could be a part of
what triggers word-of-mouth communication. With this in mind, it would be
69 (89)
of interest for future research to include service recovery as an independent
variable to investigate how this affects the result and the turnout of word-of-
mouth communication.
Finally, this study has been performed specifically on the industry of
Speciality Stores. Future studies concerning other industries within retailing
could provide the opportunity to compare how the developed conceptual
framework in this study performs in different retail contexts. By extending
the field of study we as authors believe that the conclusions drawn in this
study could be further strengthen.
70 (89)
References Agariya, A. K. & Singh, D. (2011). What Really Defines Relationship Marketing? A Review of Definitions and General and Sector-Specific Defining Constructs. Journal of Relationship Marketing. 10 (4), pp. 203-237. Allen, N. J. & Meyer, J. P. (1990). The Measurement and Antecedents of Affective, Continuance and Normative Commitment to the Organization. Journal of Occupational Psychology. 63, pp. 1–18. Allen, N. J. & Meyer, J. P. (1997). Commitment in the Workplace: Theory, Research and Application. Thousand Oaks: Sage Publications Inc. Anderson, E. W. (1998). Customer Satisfaction and Word of Mouth. Journal of Service Research. 1, pp. 5-17. Anderson, E. W. & Fornell, C. (1994). A customer satisfaction research prospectus. Service Quality: New Directions in Theory and Practice. pp.241-268. Anderson, J. L., Jolly, L. D. & Fairhurst, A. E. (2007) Customer relationship management in retailing: A content analysis of retail trade journals. Journal of Retailing and Consumer Services. 14, pp. 394–399. Anderson, E. W. & Sullivan, M. W. (1993). The Antecedents And Consequences Of Customer Satisfaction For Firm. Marketing Science. 12 (2), pp. 125-143. Anderson, E. & Weitz, B. (1992). The use of pledges to build and sustain commitment in distribution channels. Journal of Marketing Research. 29, pp. 18–34. Andreassen, T, W. (2000). Antecedents to Satisfaction with Service Recovery. The European Journal of Marketing. 34 (1), pp. 156-175. Arnett, D. B. & Badrinarayanan, V. (2005). Enhancing Customer needs–driven CRM strategies: core selling teams, knowledge management competence, and relationship marketing competence. Journal of Personal Selling & Sales Management. 25 (4), pp. 329-343. Babbie, E. (1995). The Practice of Social Research. Belmont: Wadsworth/Thomson Learning.
71 (89)
Babin, B. J., Darden, W. R. & Griffin, M. (1994). Work and/or Fun: Measuring Hedonic and Utilitarian Shopping Value. Journal of Consumer Research. 20 (4), pp. 644-656. Baker, T. L., Simpson, P. M. & Siguaw, J. A. (1999). The Impact of Suppliers’ Perceptions of Reseller Market Orientation on Key Relationship Constructs. Journal of the Academy of Marketing Science. 27, pp. 50-57. Barnes, B. R., Fox, M. T. & Morris, D. S. (2004). Exploring the linkage between internal marketing, relationship marketing and service quality: A case study of a consulting organization. Total Quality Management. 15, pp. 593–601. Bendapudi, N. & Berry, L. (1997). Customers motivations for maintaining relationships with service providers. Journal of Retailing. 73 (1), pp. 15–37. Berry, L. L. (2002). Relationship Marketing of Services-Perspectives from 1983 and 2000. Journal of Relationship Marketing. 1 (1), pp. 59-72. Bhagat, P. (2009). Relationship Development: Tracking the Formation of Relationship Commitment in a Controlled Setting. Journal of Relationship Marketing. 8, pp. 267–278. Bhattacharya, C. B. & Sen, S. (2003). Consumer-Company Identification: A Framework for Understanding Consumers' Relationships with Companies. The Journal of Marketing. 67 (2), pp. 76-88. Bitner, M. J. (1990). Evaluating Service Encounters: The Effects of Physical Surroundings and Employee Responses. Journal of Marketing. 54 (2), pp. 69-82. Bitner, M. J., Booms, B. H. & Mohr, L.A. (1994). Critical Service Encounters: The Employee's Viewpoint". Journal of Marketing. 58, pp. 95-106. Blackwell, R. D., Miniard, P. W. & Engel, J. F. (2006). Consumer Behaviour. Stamford: Sout-Western, Division of Thomson Learning. Bloch, P. H. (1986). The Product Enthusiasts: Implications for Marketing Strategy. Journal of Consumer Marketing. 3, pp. 51-62. Bloemer, J. M. M. & Poiesz, T. B. C. (1989). The illusion of customer satisfaction. Journal of Customer Satisfaction, Dissatisfaction and Complaining Behavior. 2, 43-48.
72 (89)
Boles J. S., Barksdale, H. C. & Johnson, T. (1997). Business Relationships: an examination of effects of buyer–salesperson relationships on customer retention and willingness to refer and recommend. Journal of Business & Industrial Marketing. 12 (4), pp. 253–65. Boles, J., Brashear, T., Bellenger, D. & Barksdale, H. (2000). Relationship Selling Behaviors: Antecedents and Relationship with Performance. Journal of Business & Industrial Marketing. 15 (2), pp. 141–153. Bowman, D. & Narayandas, D. (2001). Managing Customer Initiated Contacts with Manufacturers: The Impact on Share of Category Requirements and Word-of-Mouth Behavior. Journal of Marketing Research. 38, pp. 281-297. Brown, S. P. & Peterson R. A. (1993). Antecedents and consequences of salesperson job satisfaction: meta-analysis and assessment of causal effects. Journal of Marketing Research 30. pp. 63–77. Caceres, R. C. & Paparoidamis, N. G. (2007). Service quality, relationship satisfaction, trust, commitment and business-to-business loyalty. European Journal of Marketing. 41 (7), pp. 836–867. Chatman, J. A. (1991). Matching People and Organizations: Selection and Socialization in Public Accounting Firms. Administrative Science Quarterly 36, pp. 459-84. Chaudhuri, A. & Holbrook, M. (2001). The chain of effects from brand trust and brand affect to brand performance: the role of brand loyalty. Journal of Marketing. 65 (2) pp. 81–93. Churchill, G. A. & Suprenant, C. (1982). An Investigation into the Determinants of Customer Satisfaction. Journal of Marketing Research. 19, pp. 491-504. Cialdini, R. (2007). Influence - The Psychology of Persuasion. Harper Business Essentials. Cox, A. (2004). Business relationship alignment: On the commensurability of the value capture and mutuality in the buyer-supplier exchange. Supply Chain Management. 9, pp. 410–420. Cravens, D. W. & Piercy, N. F. (1994). Relationship Marketing and Collaborative Networks in Service Organisations. International Journal Service Industry Management. 5 (5), pp. 39-5.
73 (89)
Creswell, J. W. (2003). Research Design: Qualitative, Quantitative, and Mixed Methods Approaches. Thousand Oaks: Sage Publications Inc. Crosby, L. A, Evans, K. R. & Cowles, D. (1990). Relationship quality in services selling: an interpersonal influence perspective. Journal of Marketing. 54, pp. 68–81. Dagger, T.S., David, M.E. & Ng, S. (2011). Do relationship benefits and maintenance drive commitment and loyalty? Journal of Services Marketing. 25 (4), pp. 274-281. Day, G. S. (2000). Managing Marketing Relationships. Journal of the Academy of Marketing Science. 28 (1), pp. 24–30. De Wulf, K., Odekerken-Schröder, G. & Iacobucci. (2001). Investment in Consumer Relationships: A Cross-Country and Cross-Industry Exploration. Journal of Marketing. 65, pp. 33-50. Dick, A.S. & Basu, K. (1994). Customer Loyalty: Toward an Integrated Conceptual Framework. Journal of the Academy of Marketing Science. 22 (2), pp. 99-113. Dorsch, M. J., Swanson, S. R. & Kelley, S. W. (1998). The Role of Relationship Quality in the Stratification of Vendors as Perceived by Customers. Journal of the Academy of Marketing Science. 26, pp. 128-142. Dwyer, F. R., Schurr, P. H., & Oh, S. (1987). Developing buyer-seller relationships. Journal of Marketing. 51 (2), pp. 11–27. Edlund, J. E., Sagarin, B. J. & Johnson, B. S. (2007). Reciprocity and the belief in a just world. Personality and Individual Differences 43, pp. 589–596. Edvardsson, B., Johnson, M. D., Gustafsson, A., and Strandvik, T. (2000). The effects of satisfaction and loyalty on profits and growth: products versus services. Total Quality Management. 11, pp. 917–927. Evanschitzky, H., Iyer, R.G., Plassmann, H., Niessing, J. & Meffert, H. (2006). The relative strength of affective commitment in securing loyalty in service relationships. Journal of Business Research. 59 pp. 1207–1213. Ferber, R. (1970). The Expanding Role of Marketing in the 1970s. Journal of Marketing. 34, pp. 29-30.
74 (89)
Fornell, C. (1992). A National Customer Satisfaction Barometer: The Swedish Experience. Journal of Marketing. 56, pp. 6-21. Fornell, C. & Wernerfelt, B. (1987). Defensive marketing strategy by customer complaint management: a theoretical analysis. Journal of Marketing Research. 24 (4), pp. 337-346. Fullerton, G. (2003). When Does Commitment Lead to Loyalty?. Journal of Service Research. 5 (4), pp. 333-344. Fullerton, G. (2005). The service quality–loyalty relationship in retail services: does commitment matter? Journal of Retailing and Consumer Services. 12, pp. 99–111. Fullerton, G. & Taylor, S. (2002). Mediating, interactive, and non-linear effects in service quality and satisfaction research. Canadian Journal of Administrative Sciences. 19 (2), pp. 124–136. Gagliano, K.B. & Hathcote, J. (1994). Customer Expectations and Perceptions of Service Quality in Retail Apparel Specialty Stores. Journal of services marketing. 8 (1), pp. 60-69. Ganesan, S. Hess, R (1997) Dimensions and Levels of Trust: Implications for Commitment to a Relationship. Marketing Letters. 8 (4), pp. 439–448. Garbarino, E. & Johnson, M. S. (1999). The Different Roles of Satisfaction, Trust, and Commitment in Customer Relationships. Journal of Marketing. 63 (2), pp. 70-87. Gerpott, T. J., Rams, W. & Schindler. (2001). A. Customer retention, loyalty, and satisfaction in the German mobile cellular telecommunications market. Telecommunications Policy. 25 (4) pp. 249–269. Ghauri, P. & Gronhaug, K. (2010). Research methods in Business Studies: A Practical Guide. New Jersey: Prentice Hall. Gierl, H. & Huettl, V. (2010). Are scarce products always more attractive? The interaction of different types of scarcity signals with products' suitability for conspicuous consumption. Internal Journal of Research in Marketing. 27, pp. 225-235. Grönroos, C. (1989). Defining Marketing: A Market-oriented Approach. European Journal of Marketing. 23 (1), pp. 52-60.
75 (89)
Grönroos, C. (1990). Service Management and Marketing: Managing the Moments of Truth in Service Competition. Lexington: Lexington Books. Grönroos, C. (1991). The Marketing Strategy Continuum: Towards a Marketing Concept for the 1990s. Management Decision. 29 (1), pp. 7-13. Grönroos, C. (1994). From Marketing Mix to Relationship Marketing: Towards a Paradigm Shift in Marketing. Management Decision. 32 (2), pp. 4-20. Guiltinan, J. P. (1989). A classification of switching costs with implications for relationship marketing. AMA Winter Educators' Conference: Marketing Theory and Practice. pp. 216–20. Gummesson, E. (1987). The New Marketing - Developing Long-Term Interactive Relationships. Long Range Planning: International Journal of Strategic Management. 20 (4), pp. 10-20. Gundlach, G., Achrol, R. & Mentzer, J. (1995). The structure of commitment in exchange. Journal of Marketing. 59 (1), pp. 78–92. Gwinner, K., Gremler, D. & Bitner, M. (1998). Relational benefits in services industries: the customer’s perspective. Journal of the Academy of Marketing Science 26 (2), pp. 101-14. Gripsrud, J. (2002). Understanding Media Culture. London: Hodder Arnold. Hair, J. F. Jr., Babin, B., Money, A. H. & Samoel, P. (2003). Essentials of business research methods. Danvers, MA: John Wiley & Sons. Hansemark, O. C. & Albinsson, M. (2004). Customer Satisfaction and Retention: The Experience of Individual Employees. Managing Service Quality. 14 (1), pp. 40-57. Harrison-Walker, J. (2001). The measurement of word-of-mouth communication and an investigation of service quality and customer commitment as potential antecedents. Journal of Service Research. 4 (1), pp. 60-75. Hart, C. W. L., Heskett, J. L. & Sasser, E. W. (1990). The profitable art of service recovery. Harvard Business Review. 68 (4), pp. 148-156. Haywood, M.K. (1993). Managing Word of Mouth Communications. Journal of Services Marketing, 3 (2), pp. 55-67.
76 (89)
Hennig-Thurau, T. & Klee, A. (1997). The Impact of Customer Satisfaction and Relationship Quality on Customer Retention: A Critical Reassessment and Model Development. Psychology & Marketing. 14 (8), pp. 737-764. Herr, P.M., Kardes, F.R. & Kim. J. (1991). Effects of Word-of-Mouth and Product-Attribute Information on Persuasion: An Accessibility-Diagnosticity Perspective. Journal of Consumer Research, 17, pp. 454-462. Heskett, J. L. (1990). Rethinking strategy for service management. Service management effectiveness: balancing strategy, organization and human resources, operations and marketing. pp. 17. Hovland, C. E., Janis I. L. & Harold H. K. (1953). Communication and Persuasion. New Haven: Yale University Press. Hunt, S. D. (1983). General Theories and the Fundamental Explanada of Marketing. Journal of Marketing. 47, pp. 9-17. Hunt, S. D. (1997). Competing Through Relationships: Grounding Relationship Marketing in Resource-Advantage Theory. Journal of Marketing Management. 13 (5), pp. 431–445. Johnson, M. D. & Fornell, C. (1991). A Framework for Comparing Customer Satisfaction Across Individuals and Product Categories. Journal of Economic Psychology. 12 (2), pp. 267–86. Johnston, R. (2001). Linking complaint management to profit. International Journal of Service Industry Management. 12 (1), pp. 60-69. Jones, M. A., Mothersbaugh, D. L. & Beatty, S. E. (2002). Why customers stay: measuring the underlying dimensions of services switching costs and managing their differential strategic outcomes. Journal of Business Research. 55 (6), pp. 441–50. Kashyap, V. & Sivadas, E. (2012). An exploratory examination of shared values in channel relationships. Journal of Business Research 65, pp. 586–593. Kotler, P. (1972). A Generic Concept of Marketing. Journal of Marketing. 36, pp. 46-54. Kotler, P. (1994). Marketing management. Analysis, planning, implementation, and control. New Jersey: Prentice-Hall.
77 (89)
Kassim, N. & Abdullah, N. A. (2010). The effect of perceived service quality dimensions on customer satisfaction, trust, and loyalty in e-commerce settings: A cross cultural analysis. Asia Pacific Journal of Marketing and Logistics. 22 (3), pp. 351-371. Kim, W.G., Ng, C. Y-N. & Kim, Y-S. (2009). Influence of institutional DINESERV on customer satisfaction, return intention, and word-of-mouth. International Journal of Hospitality Management 28 pp. 10–17. Ladhari, R. (2007). The Effect of Consumption Emotions on Satisfaction and Word-of-Mouth Communications. Psychology & Marketing. 24 (12), pp. 1085-1108. Lambert, D. M., Emmelhainz, M. A., & Gardner, J. T. (1999). Building successful logistics partnerships. Journal of Business Logistics. 20 (1), pp. 165–181. Lavesque, T. & McDougall, G. H. G. (1996). Determinants of customer satisfaction in retail banking. Journal of Bank Marketing. 14 (7), pp. 12-20. Li, Z. & Dant, R. (1997), An exploratory study of exclusive dealing in channel relationships. Journal of the Academy of Marketing Science. 25 (3), pp. 301-313. MacNealy, R. (1994) Making Customer Satisfaction Happen: A Strategy for Delighting Customers. London: Chapman & Hall. MacMillan, K., Money, K., Money, A. & Downing, S. (2005). Relationship marketing in the not-for-profit sector: an extension and application of the commitment–trust theory. Journal of Business Research. 58 pp. 806–818. Malhotra, N. K. (2011). Basic Marketing Research. New Jersey: Prentice Hall. Malhotra, N., Budhwar, P. & Prowse, P. (2007). Linking rewards to commitment: An empirical investigation of four UK call centers. Internal Journal of Human Resource Management 18 (12), pp. 2095–2127. Mathieu, J. E. & Zajac, D. (1990). A Review and Meta- Analysis of the Antecedents, Correlates and Consequences of Organizational Commitment. Psychological Bulletin. 108, pp. 171–194.
78 (89)
Mattson, L.-G. (1997), “Relationship marketing and the markets-as-networks approach: a comparative analysis of two evolving streams of research”, Journal of Marketing Management, 13 (5), pp. 447-61. Maru File, K., Cermak, D.S.P. & Prince, R.A. (1994). Word-of-mouth effects in professional service buyer behavior. The Service Industries Journal. 14 (3), pp. 301–314. McDougall, G. & Levesque, T. (1994). A revised view of service quality dimensions: an empirical investigation. Journal of Professional Services Marketing. 11 (1), pp. 189-210. Meyer, J. P. & Herscovitch, L. (2001). Commitment in the Workplace: Toward a General Model. Human Resource Management Review. 11, pp. 299–326. Miles, M.B & Huberman, A.M. (1994) Qualitative Data Analysis. Thousand Oaks: Sage Publications Inc. Moorman, C., Deshpande, R., & Zaltman, G. (1993). Factors affecting trust in market research relationships. Journal of Marketing. 57 (1), pp. 81–101. Moorman, C., Zaltman, G., & Deshpande, R. (1992). Relationship between providers and users of market research: The dynamics of trust within and between organizations. Journal of Marketing Research. 29, pp. 314–328. Morgan, R. M., & Hunt, S. D. (1994). The commitment-trust theory of relationship marketing. Journal of Marketing. 58 (3), pp. 20–38. Morgan, N. A. & Piercy, N.F. (1992). Market-led quality. Industrial Marketing Management. 21 (2), pp. 111-18. Morgan Stanley Capital International. (2002). Global Industry Classification Standard. Available on: http://www.msci.com/resources/pdfs/MK-GICS-DIR-3-02.pdf. 2012-25-04. Nyer, P. U. (2000) An investigation into whether complaining can cause increased consumer satisfaction. Journal of Consumer Marketing. 17 (1), pp. 9-19. Oliver, R. L. (1980). A Cognitive Model of the Antecedents and Consequences of Satisfaction Decisions. Journal of Marketing Research. 17, pp. 460-469.
79 (89)
Oliver, R. L. & DeSarbo, W. (1988). Response Determinants in Satisfaction Judgments. Journal of Consumer Research. 14, pp. 495-507. Palmer, A. & Bejou, D. (1994). Buyer-Seller Relationships: A Conceptual Model and Empirical Investigation. Journal of Marketing Management. 10 (6), pp. 495-512. Pan, S. L. & Lee, J-N. (2003). Using e-CRM For A Unified View Of The Customer. Communications of The ACM. 46 (4), pp. 95-99. Parasuraman, A., Berry, L. L. & Zeithaml, V.A. (1991). Understanding Customer Expectations of Service. Sloan Management Review. 39, pp. 39-48. Payne, A. & Frow, P. (2005). A Strategic Framework for Customer Relationship Management. Journal of Marketing. 69 (4), pp. 167-176. Piccoli, G., O’connor, P., Capaccioli, C., & Alvarez, R. (2003). Customer relationship management: A driver for change in the structure of the US lodging industry. Cornell Hotel and Restaurant Administration Quarterly. 61, pp. 61–73. Ranaweera, C. & Prabhu, J. (2003). On the relative importance of customer satisfaction and trust as determinants of customer retention and positive word of mouth. Journal of Targeting, Measurement and Analysis for Marketing. 12 (1), pp. 82–90. Rapp, S. & Collins, T. (1990). The Great Marketing Turnaround. New Jersey: Prentice-Hall. Rauyruen, P. & Miller, K.E. (2007). Relationship quality as a predictor of B2B customer loyalty. Journal of Business Research. 60, pp. 21–31. Reichheld, F. & Aspinall, K. (1993). Building high-loyalty business system. Journal of Retail Banking. 15 (4), pp. 21-9. Reichheld, F. & Sasser, W. E. (1990). Zero Defections: Quality Comes to Service. Harvard Business Review. 68, pp. 105–111. Reichheld, F. & Teal, T. (1996) The Loyalty Effect: The Hidden Force behind Growth, Profits, and Lasting Value. Harvard Business School Press.
80 (89)
Rempel, J.K., Holmes, J.G., and Zanna, M.P. (1985). Trust in close relationships. Journal of Personality and Social Psychology. 49 (1), pp. 95-112. Rempel, J.K., Ross, M. & Holmes, J.G. (2001). Trust and communicated attributes in close relationships. Journal of Personality and Social Psychology. 81 (1), pp. 57-64. Richins, M.L. (1983). Negative Word-of-Mouth by Dissatisfied Consumers: A Pilot Study. Journal of Marketing, 47, pp. 68-78. Rigby, D. K., Reichheld, F. & Dawson, C. (2003). Winning customer loyalty is the key to a winning CRM strategy. Ivey Business Journal. 67 (4), pp. 1-5. Rosenberg, L. J. & Czepiel, J. A. (1984). A marketing approach for customer retention. Journal of Consumer Marketing. 1 (2), pp. 45-51. Rotter, J. B. (1967). A new scale for the measurement of interpersonal trust. Journal of Personality. 35, pp. 651–665. Rust, R. T. & Zahorik, A. J. (1993). Customer satisfaction, customer retention, and market share. Journal of Retailing. 69 (2), pp. 193–215. Sheth, J.N. (1996). Relationship Marketing: Frameworks and Concepts. International Conference on Relationship Marketing: Development, Management and Governance of Relationships. March 29-31, Berlin, Germany. Sirdeshmukh, D. Singh, J. & Sabol, B. (2002) Consumer trust, value, and loyalty in relational exchanges. Journal of Marketing. 66 (1), pp. 15-37. Smith, J. B. (1998). Buyer-Seller Relationships: Similarity, Relationship Management, and Quality. Psychology & Marketing. 15, pp. 3-21. Spreng, R. A., Harrell, G. D. & Mackoy, R. D. (1995). Service recovery: impact on satisfaction and intentions. Journal of Services Marketing. 9 (1), pp. 15-23. Thomas. R, Skinner. L (2002). Total Trust and Trust Asymmetry: Does Trust Need to Be Equally Distributed in Interfirm Relationships?. Journal of Relationship Marketing. 9, pp. 43–53. Yin, R. K. (2003). Case Study Research: Design and Methods. Thousand Oaks: Sage Publications Inc.
81 (89)
Vinson, D. E., Scott, J. E. & Lamont, L. M. (1977). The Role of Personal Values in Marketing and Consumer Behavior. The Journal of Marketing. 41 (2), pp. 44-50. Walter, A. & Gemünden, H. G. (2000). Bridging the Gap Between Suppliers and Customers Through Relationship Promoters: Theoretical Considerations and Empirical Results. Journal of Business & Industrial Marketing.15 (2), pp. 86–105. Zeithaml, V. A, Berry, L. L. & Parasuraman, A. (1996). The behavioral consequences of service quality. Journal of Marketing 60. pp. 31–46. Zeithaml, V. A. & Bitner, M. J. (1996), Services Marketing. New York: McGraw-Hill. Zemke, R. & Schaff, D. (1990). The Service Edge: 101 Companies That Profit from Customer Care. New York: Penguin Books. Zineldin, M. (2000). TRM: Total Relationship Management. Lund: Studentlitteratur AB. Özgenera, S., & Iraz, R. (2006). Customer relationship management in small–medium enterprises: The case of Turkish tourism industry. Journal of Tourism Management 27, pp. 1356–1363
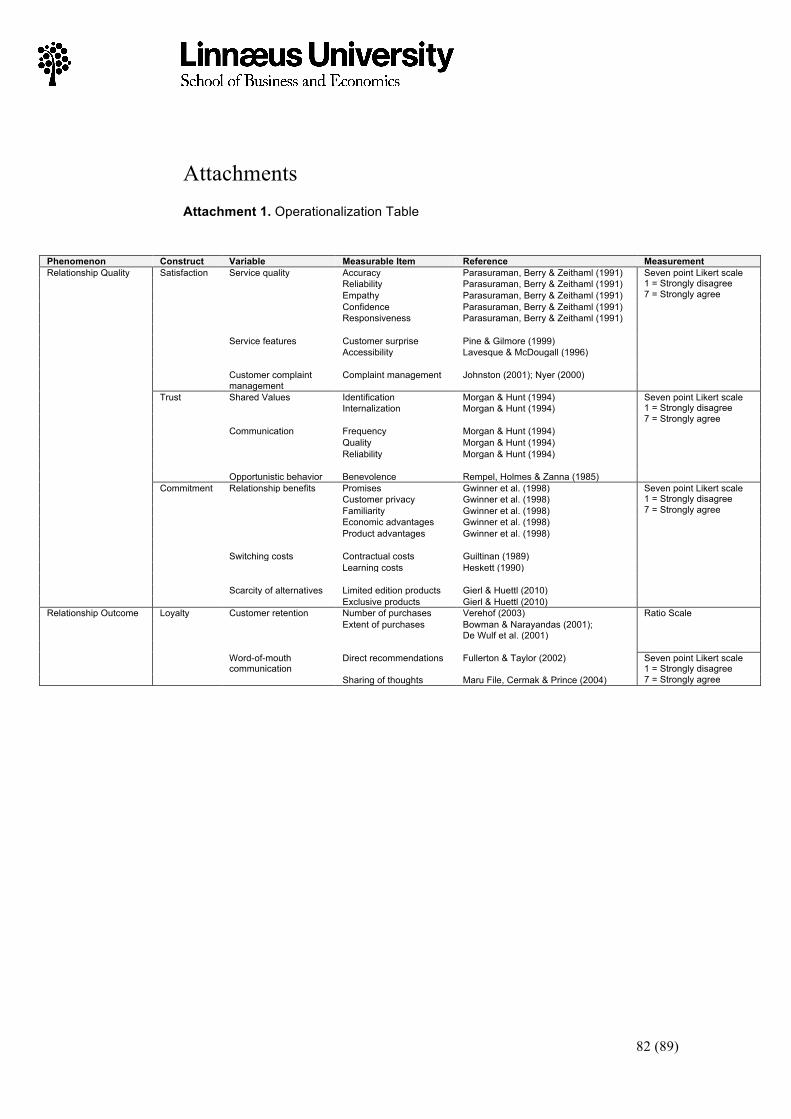
82 (89)
Attachments Attachment 1. Operationalization Table
Phenomenon Construct Variable Measurable Item Reference Measurement Relationship Quality Satisfaction Service quality Accuracy Parasuraman, Berry & Zeithaml (1991) Seven point Likert scale
1 = Strongly disagree 7 = Strongly agree
Reliability Parasuraman, Berry & Zeithaml (1991) Empathy Parasuraman, Berry & Zeithaml (1991) Confidence Parasuraman, Berry & Zeithaml (1991) Responsiveness Parasuraman, Berry & Zeithaml (1991) Service features Customer surprise Pine & Gilmore (1999) Accessibility Lavesque & McDougall (1996) Customer complaint
management Complaint management Johnston (2001); Nyer (2000)
Trust Shared Values Identification Morgan & Hunt (1994) Seven point Likert scale 1 = Strongly disagree 7 = Strongly agree
Internalization Morgan & Hunt (1994) Communication Frequency Morgan & Hunt (1994) Quality Morgan & Hunt (1994) Reliability Morgan & Hunt (1994) Opportunistic behavior Benevolence Rempel, Holmes & Zanna (1985) Commitment Relationship benefits Promises Gwinner et al. (1998) Seven point Likert scale
1 = Strongly disagree 7 = Strongly agree
Customer privacy Gwinner et al. (1998) Familiarity Gwinner et al. (1998) Economic advantages Gwinner et al. (1998) Product advantages Gwinner et al. (1998) Switching costs Contractual costs Guiltinan (1989) Learning costs Heskett (1990) Scarcity of alternatives Limited edition products Gierl & Huettl (2010) Exclusive products Gierl & Huettl (2010) Relationship Outcome Loyalty Customer retention Number of purchases Verehof (2003) Ratio Scale
Extent of purchases Bowman & Narayandas (2001); De Wulf et al. (2001)
Word-of-mouth
communication Direct recommendations Fullerton & Taylor (2002) Seven point Likert scale
1 = Strongly disagree 7 = Strongly agree Sharing of thoughts Maru File, Cermak & Prince (2004)
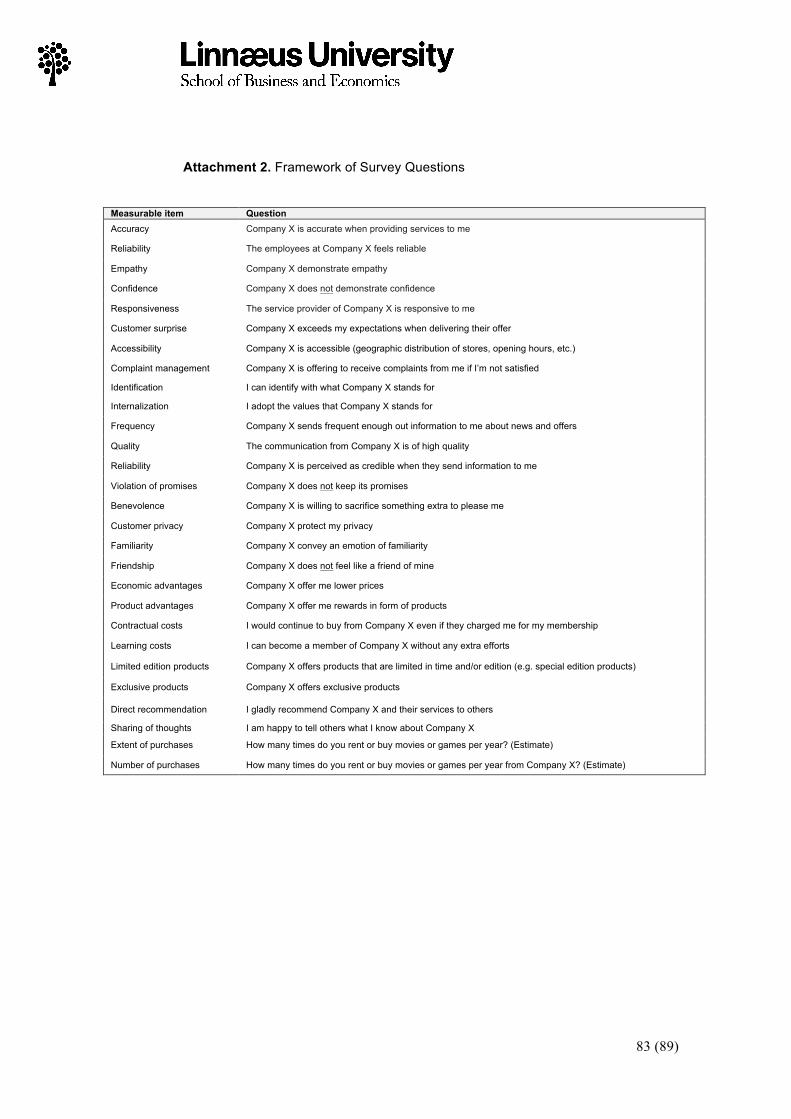
83 (89)
Attachment 2. Framework of Survey Questions
Measurable item Question Accuracy Company X is accurate when providing services to me
Reliability The employees at Company X feels reliable
Empathy Company X demonstrate empathy
Confidence Company X does not demonstrate confidence
Responsiveness The service provider of Company X is responsive to me
Customer surprise Company X exceeds my expectations when delivering their offer
Accessibility Company X is accessible (geographic distribution of stores, opening hours, etc.)
Complaint management Company X is offering to receive complaints from me if I’m not satisfied
Identification I can identify with what Company X stands for
Internalization I adopt the values that Company X stands for
Frequency Company X sends frequent enough out information to me about news and offers
Quality The communication from Company X is of high quality
Reliability Company X is perceived as credible when they send information to me
Violation of promises Company X does not keep its promises
Benevolence Company X is willing to sacrifice something extra to please me
Customer privacy Company X protect my privacy
Familiarity Company X convey an emotion of familiarity
Friendship Company X does not feel like a friend of mine
Economic advantages Company X offer me lower prices
Product advantages Company X offer me rewards in form of products
Contractual costs I would continue to buy from Company X even if they charged me for my membership
Learning costs I can become a member of Company X without any extra efforts
Limited edition products Company X offers products that are limited in time and/or edition (e.g. special edition products)
Exclusive products Company X offers exclusive products
Direct recommendation I gladly recommend Company X and their services to others
Sharing of thoughts I am happy to tell others what I know about Company X
Extent of purchases How many times do you rent or buy movies or games per year? (Estimate)
Number of purchases How many times do you rent or buy movies or games per year from Company X? (Estimate)
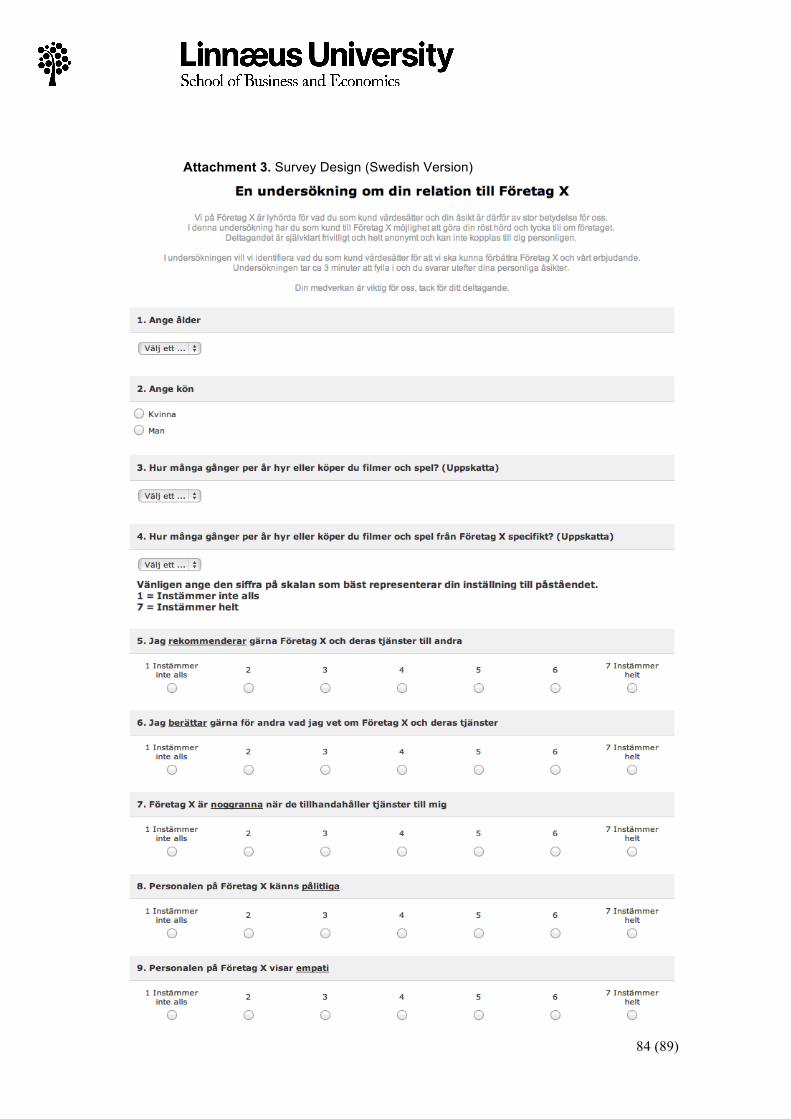
84 (89)
Attachment 3. Survey Design (Swedish Version)
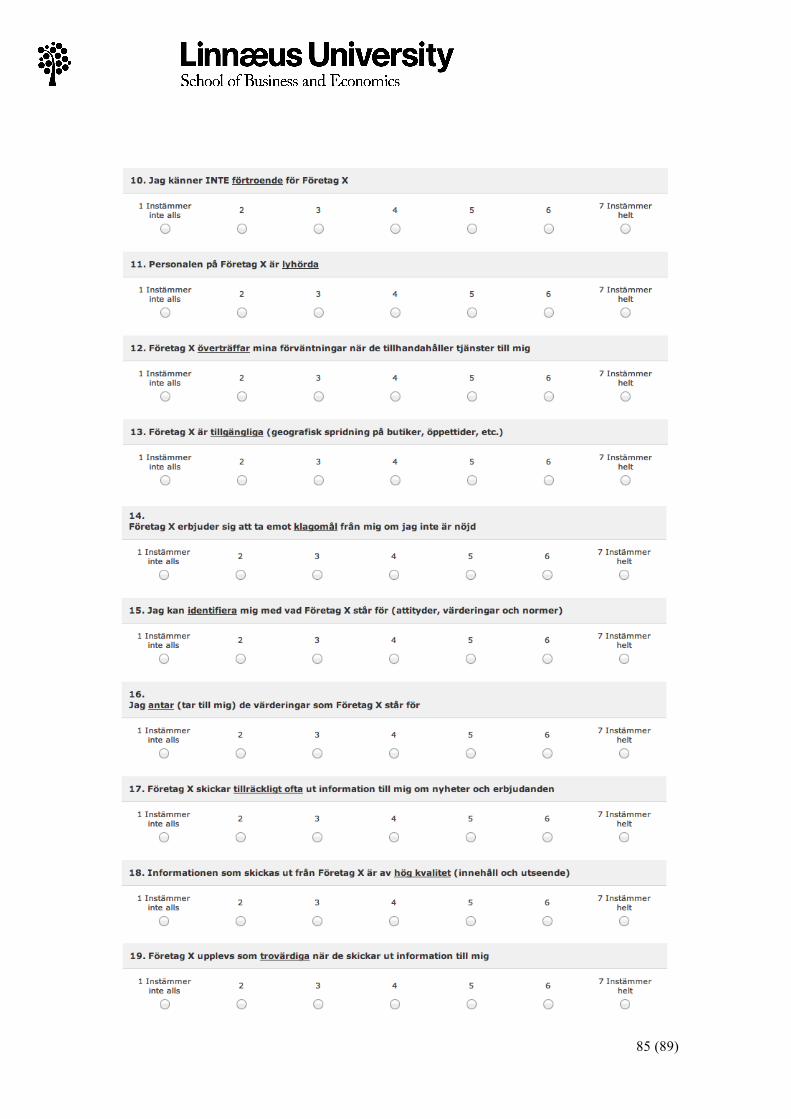
85 (89)
!! !
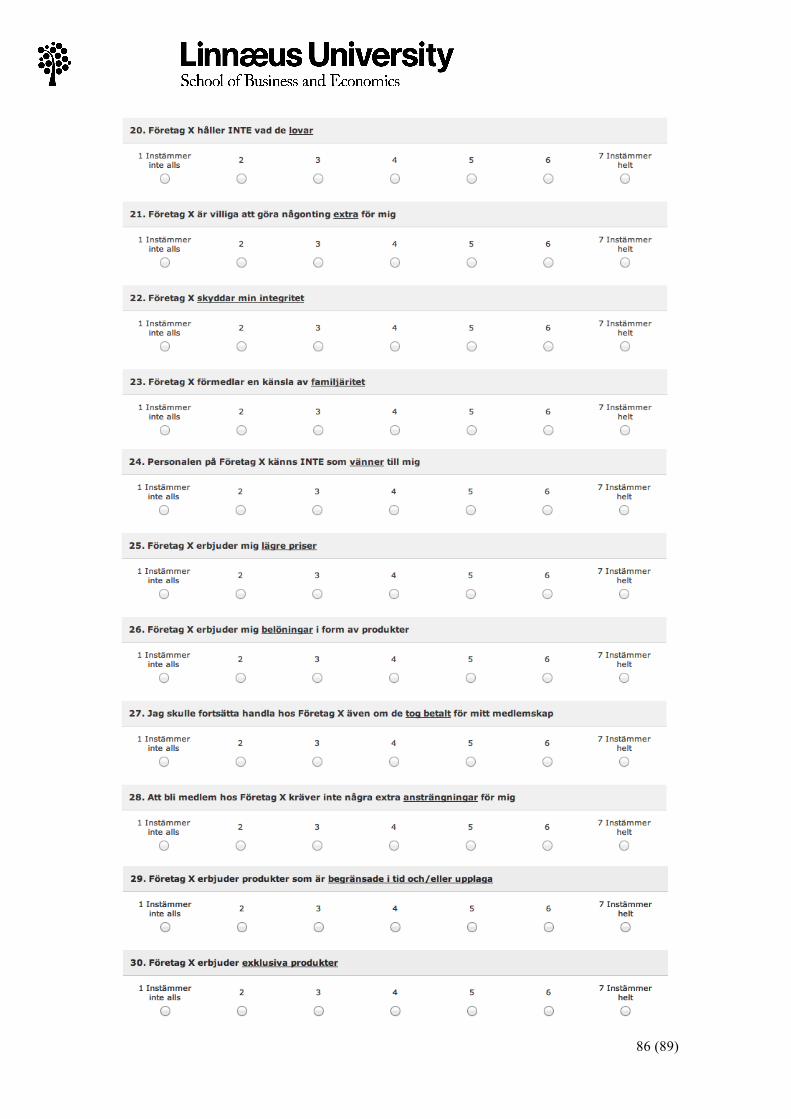
86 (89)
!
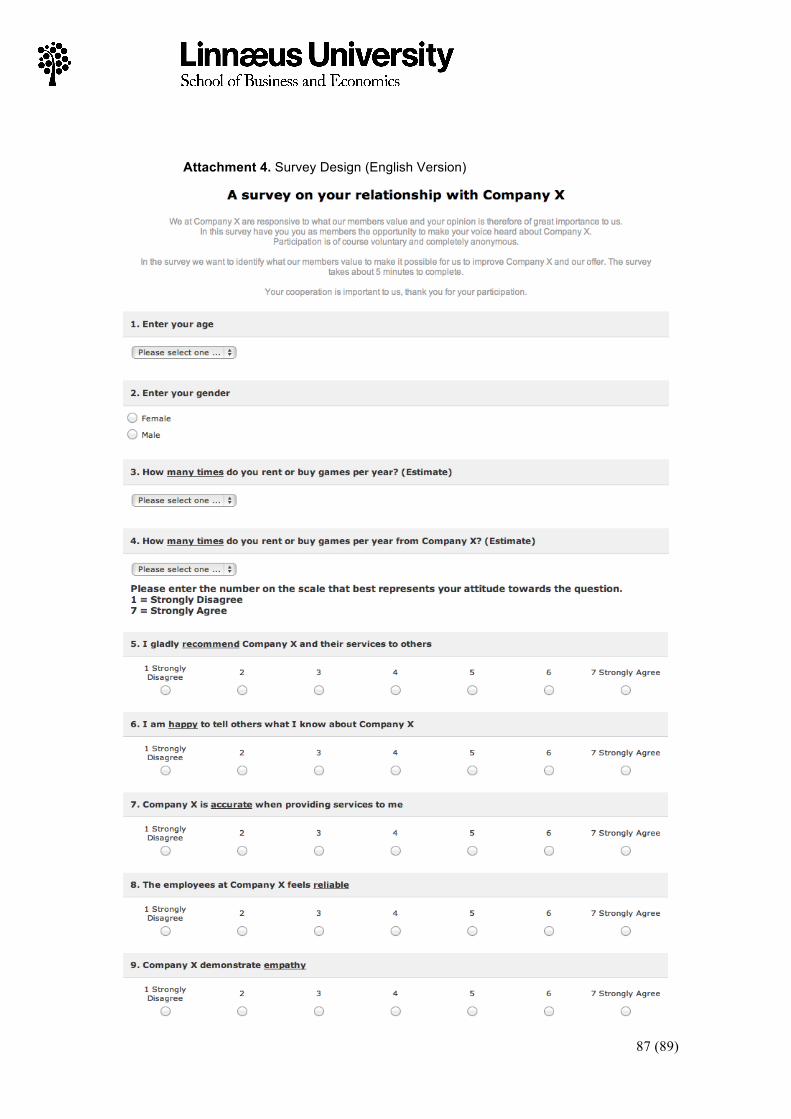
87 (89)
Attachment 4. Survey Design (English Version)
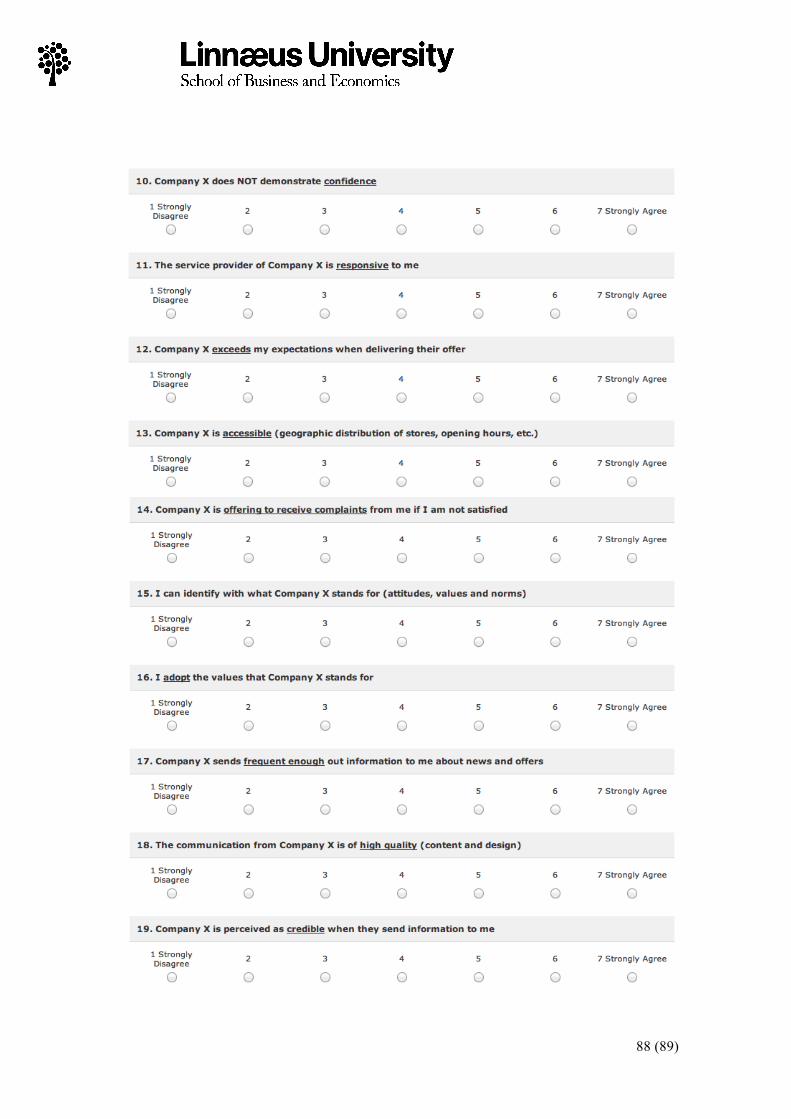
88 (89)
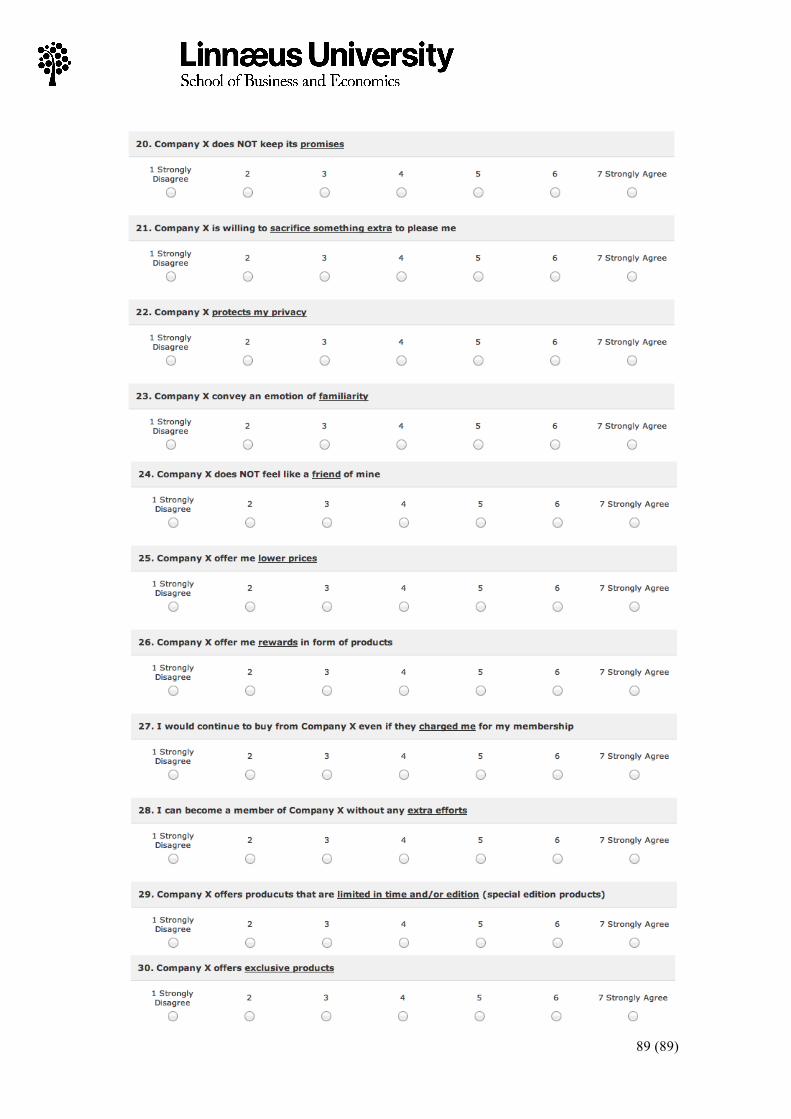
89 (89)
Linnaeus University – a firm focus on quality and competence On 1 January 2010 Växjö University and the University of Kalmar merged to form Linnaeus University. This new university is the product of a will to improve the quality, enhance the appeal and boost the development potential of teaching and research, at the same time as it plays a prominent role in working closely together with local society. Linnaeus University offers an attractive knowledge environment characterised by high quality and a competitive portfolio of skills. Linnaeus University is a modern, international university with the emphasis on the desire for knowledge, creative thinking and practical innovations. For us, the focus is on proximity to our students, but also on the world around us and the future ahead. Linnæus University SE-391 82 Kalmar/SE-351 95 Växjö Telephone +46 772-28 80 00