customer level exit analysis and lifetime value · customer level exit analysis and lifetime value...
TRANSCRIPT

Customer Level Exit Analysis and Lifetime Value
Caroline StevensonQuantium

Agenda
• Current view of portfolio value• Calculating the components• Customer lifetime value

• Start by determining expected cohort
Calculating Appraisal Value
Year
In Force Exits
New product sales

• Then overlay value, incorporating:– Current profitability– Assumed premium increases– Discount rates
Calculating Appraisal Value

Exit Analysis
• Traditional Modelling based on cohort level analysis– Broad understanding of effects– Separating concurrent drivers?
• Can improve on this with customer level analysis

Improving Exit Experience?Observed Exit Rate Experience by Calendar Year
70
75
80
85
90
95
100
105
110
2002 2003 2004 2005
Calendar Year
Rel
ativ
e Ex
it R
ate
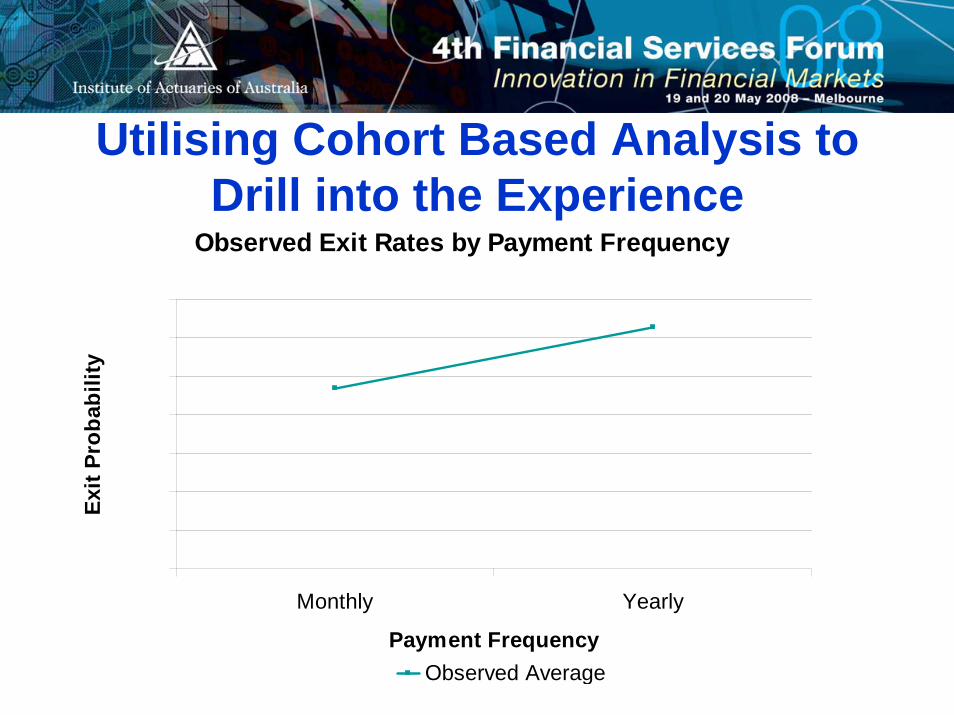
Utilising Cohort Based Analysis to Drill into the Experience
Observed Exit Rates by Payment Frequency
0%
2%
4%
6%
8%
10%
12%
14%
Monthly Yearly
Payment Frequency
Exit
Prob
abili
ty
Observed Average

Analyse how this varies over timeObserved Exit Rate Experience by Year and
Payment Frequency
0%
2%
4%
6%
8%
10%
12%
M YPayment Frequency
Exit
Prob
abili
ty
0%
20%
40%
60%
80%
100%
Prop
ortio
n
2003 2004 2005

RenewalLikelihood
Modelling Exit Experience
• Build GLMs at customer level
Customer Characteristics
OtherData
ProductDetails
PriceData
LapseModel

Relative Propensity to Exit by Payment Frequency
0
20
40
60
80
100
120
Monthly Yearly
Payment Frequency
Rel
ativ
e Pr
open
sity
to E
xit
Pure Effect of Payment Frequency

What is Causing This?Relative Propensity to Exit by Payment Method
0
50
100
150
200
250
300
350
Credit Card Direct Debit Manual
Payment Method
Rel
ativ
e Pr
open
sity
to E
xit
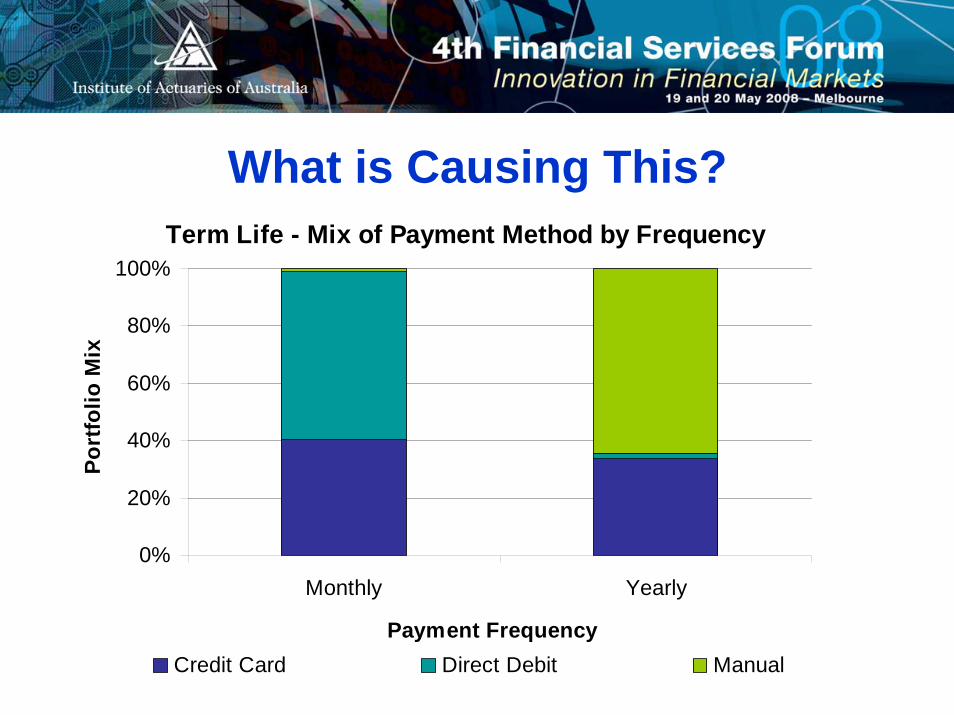
What is Causing This?Term Life - Mix of Payment Method by Frequency
0%
20%
40%
60%
80%
100%
Monthly Yearly
Payment Frequency
Port
folio
Mix
Credit Card Direct Debit Manual

We Predict Observed ExperienceObserved & Fitted Exit Rates by Payment
Frequency
0%2%4%6%8%
10%12%14%
Monthly Yearly
Payment Frequency
Exit
Prob
abili
ty
Observed Average Fitted Average

We Test Numerous Factors Sum Insured Tenure
Number of Risks Policyholder Age
$ Sum Insured Tenure in Months
AgeNumber of Risks
Rel
ativ
e la
pses
Rel
ativ
e la
pses
Rel
ativ
e la
pses
Rel
ativ
e la
pses

Relative Propensity to Exit by Calendar Year
80
85
90
95
100
105
110
2002 2003 2004 2005
Calendar Year
Rel
ativ
e Ex
it R
ate
Exit Experience was Deteriorating
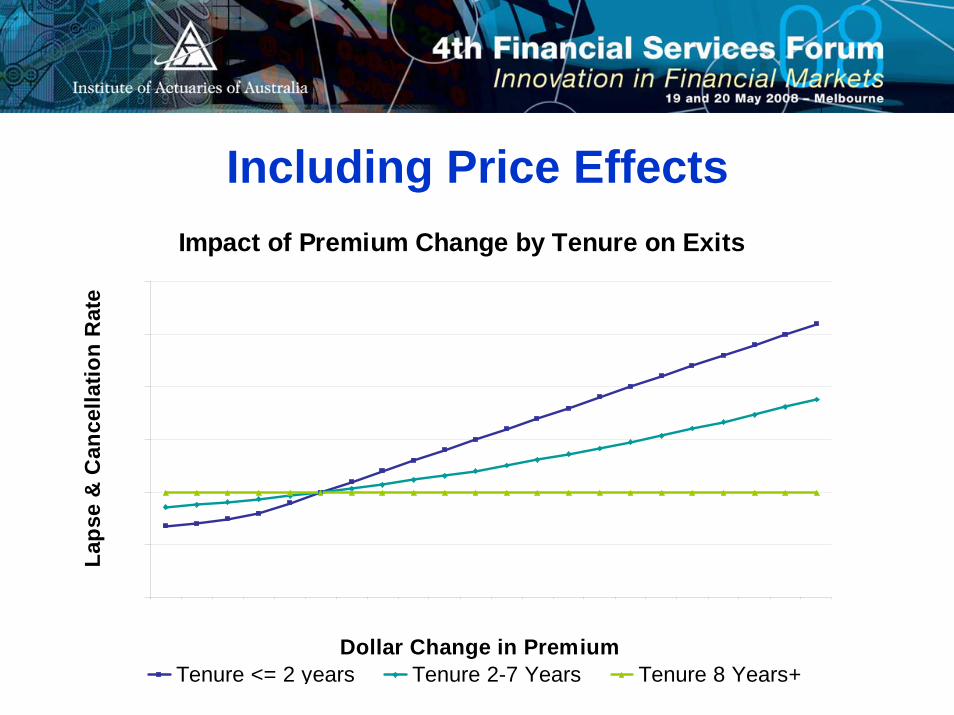
Impact of Premium Change by Tenure on Exits
80
90
100
110
120
130
140
<-50 10 60 150 1kDollar Change in Premium
Laps
e &
Can
cella
tion
Rat
e
Tenure <= 2 years Tenure 2-7 Years Tenure 8 Years+
Including Price Effects

Scenario testing tool

Improved Strategic Insights
• Detection of undistorted trends• Appraisal value calculations need to
incorporate appropriate trends in exit experience
• Targeted pricing action based on desired portfolio outcomes

• Product level v. Customer level view
Returning to Value Calculations
Year
Expected Value Exits
New product sales

Why a Customer Level View?
• Companies moving from product to customer/segment view
• Assess intrinsic value of, and hence justifiable investment in, different customer segments

Need to Consider Path for Each Customer
• At each point in time, consider product take-up/lapse
• Dynamically adjusting for customer characteristics
Credit Card
Credit Card
CC & TA
CC & TA
CC, TA & HL
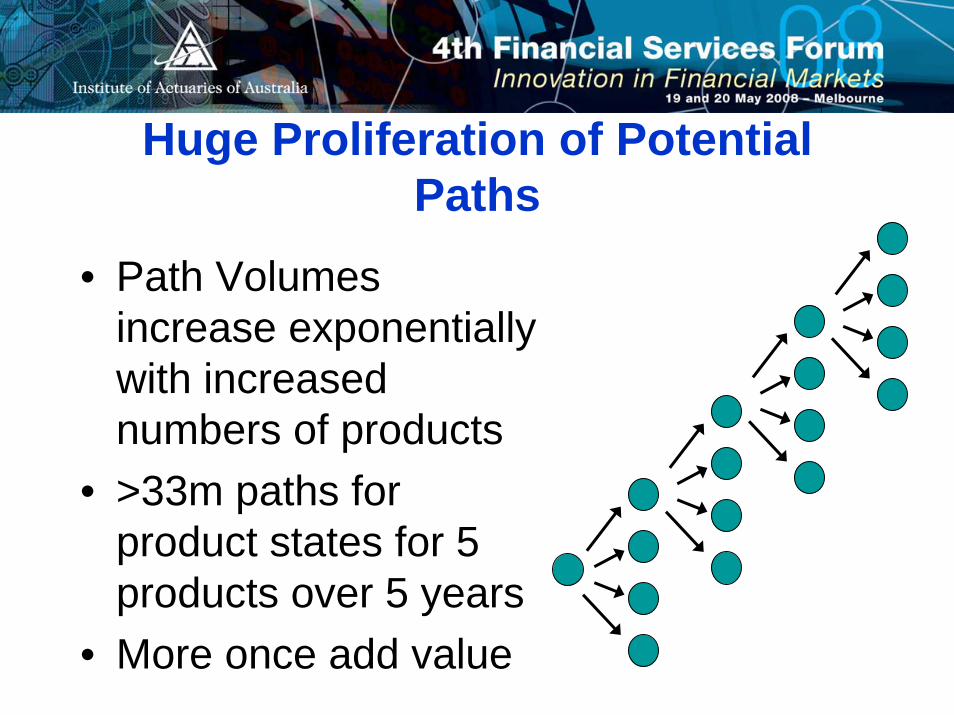
Huge Proliferation of Potential Paths
• Path Volumes increase exponentially with increased numbers of products
• >33m paths for product states for 5 products over 5 years
• More once add value

Other Products Important Even for Single Product View
Value from Transaction Account over Time
8
10
12
14
16
18
20
22
1 4 7 10 13 16 19 22 25 28 31 34 37 40 43 46 49Month
Expe
cted
val
ue
All Products Single Product View

Value from Three Products over Time
8
18
28
38
48
58
68
78
1 4 7 10 13 16 19 22 25 28 31 34 37 40 43 46 49Month
Expe
cted
val
ue
All Products Product 1 Product 2 Product 3
Potential Error at Customer Level
Customer Level
Shortfall

Need for Stochastic Approach
• Simple Markov Chain approaches only consider current state
• Necessary to track individual paths due to impact of factors such as product tenure
• Proliferation of paths lead to requirement for a simulation approach

Expected Portfolio Value
02468
10121416
2 2 2 2 2 2 2 2 2 2 2 2 2 2 2 2
Freq
uenc
y of
Occ
urre
nce
Understanding Portfolio Value
Deterministic mean Stochastic
mean
• Deterministic approaches can lead to incorrect conclusions, due to tenure effects
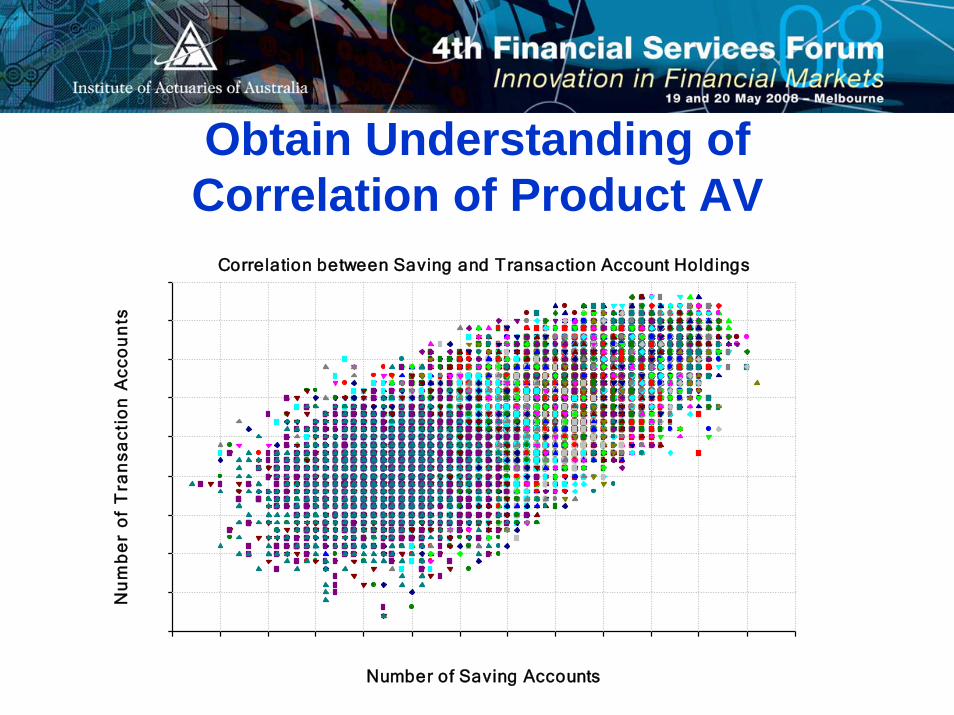
Obtain Understanding of Correlation of Product AV
Correlation between Saving and Transaction Account Holdings
30
35
40
45
50
55
60
65
70
75
85 90 95 100 105 110 115 120 125 130 135 140 145 150Number of Saving Accounts
Nu
mb
er
of
Tra
nsa
ctio
n A
cco
un
ts

Conclusions
• Cohort level analysis of AV components can lead to incorrect conclusions
• Single product view of value is flawed• Organisations moving to customer level
view• Need to adapt and go beyond current
AV approaches, drawing on customer level modelling and simulation