customer-friendly demand response
DESCRIPTION
Customer-Friendly Demand Response. Chris King Chief Strategy Officer, eMeter Chair, SVLG Demand Response Subcommittee. Who’s eMeter?. Company Background & Qualifications Founded in Silicon Valley in 1999 by original executive group from CellNet - PowerPoint PPT PresentationTRANSCRIPT

July 21, 2006
Customer-Friendly Demand Response
Chris King
Chief Strategy Officer, eMeter
Chair, SVLG Demand Response Subcommittee

2© eMeter Corporation 2006
Who’s eMeter?
Company Background & Qualifications
• Founded in Silicon Valley in 1999 by original executive group from CellNet
– Team pioneered advanced metering infrastructure technology
• Develop and sell Advanced Meter Information Systems (AMIS) software
1. Advanced Metering Business Process Management (BPM)
2. Meter Data Management
3. AMI Integration Platform
• Experience in all aspects of AMI implementation
– AMI technologies,
– Software implementation,
– Data collection and management,
– Deployment & operations,
– Business and regulatory strategy
Business Focus
• Software & professional services
• Strategic consulting on AMI issues

3© eMeter Corporation 2006
Why is Demand Response Important?Price-based
•Tool for customers to manage bills
•Keeps wholesale prices in check
Reliability
•Protects the grid
•Prevents rolling blackouts
Over 975 MW Over 975 MW shed in 60 shed in 60 secondsseconds
Generator Down, Emergency Control
(SCRAM)
Generator RestorationStarted
RestorationSuspended
More Generation Down, System re-SCRAM
RestorationStarted
TIMETIME
SY
ST
EM
SY
ST
EM
LO
AD
(M
W)
LO
AD
(M
W)
Case Study 1: Loss of 1,000 MW Power Plant

4© eMeter Corporation 2006
Main Job of Customers is Not Energy
Source: Primen

5© eMeter Corporation 2006
Even Facility Managers Spend Little Time on Energy
Source: Primen

6© eMeter Corporation 2006
Customers & Utilities Don’t Speak the Same Language
Source: Primen

7© eMeter Corporation 2006
Primary Customer Energy Concerns
Source: Primen

8© eMeter Corporation 2006
Tools That Help With Pricing
Source: Primen

9© eMeter Corporation 2006
Market Research – Commercial Customer Concerns
Statements regarding energy efficiency investments
Source: Quantum Research

10© eMeter Corporation 2006
Commercial Pricing Preferences
Source: NYSERDA
11© eMeter Corporation 2006
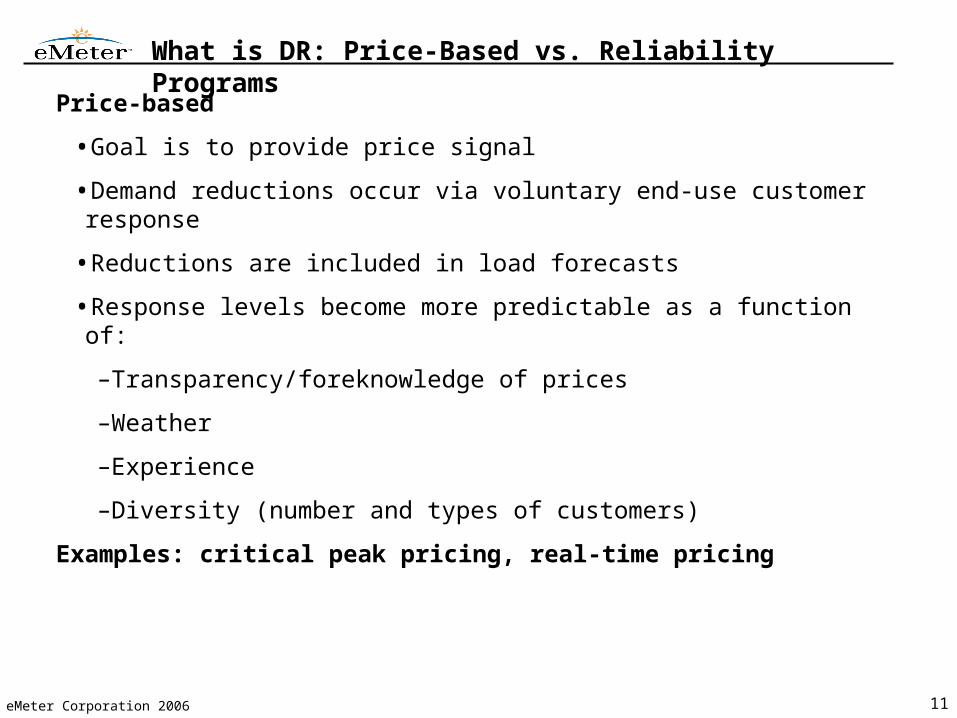
What is DR: Price-Based vs. Reliability Programs
Price-based
•Goal is to provide price signal
•Demand reductions occur via voluntary end-use customer response
•Reductions are included in load forecasts
•Response levels become more predictable as a function of:
–Transparency/foreknowledge of prices
–Weather
–Experience
–Diversity (number and types of customers)
Examples: critical peak pricing, real-time pricing

12© eMeter Corporation 2006
What is DR: Price-Based vs. Reliability Programs
Emergency/reliability
•Goal is “load acting as a resource”
•Demand reductions occur via dispatch by system operators
•Reductions are included in resource/supply portfolio
–Same as a power plant (with limitations)
•Response levels more variable
–Minimal foreknowledge by end-use customers
–Dispatch reasons varied
–Less diversity in loads involved
Examples: interruptible programs or demand bidding programs with penalties

13© eMeter Corporation 2006
Customer-Friendly Demand Response
Principles developed by SLVG (subset)
•Voluntary
–Default programs must have no penalty for “opting-out”
–PUC ruling on critical peak pricing for large commercial customers adopted SVLG’s principle
•Easy to participate
–Minimize complex forms and procedures
–Avoid specific peak reduction targets (e.g. minimum of 100 kilowatts)
•Easy to understand
–Maintain stable programs over time
•Easy to reduce demand
–Promote availability of automation technology through incentives and rebates
•Good value
–Customers should be fairly rewarded for their efforts
–The benefits should be maximized relative to the cost

14© eMeter Corporation 2006
Case Study 2: CPUC Ruling on Critical Peak Pricing
Decision in spring 2006
Requires utilities to implement “default” critical peak pricing for customers above 200 kW
•Decision does not say when
•Decision says the rate design will be covered in a “future” rate case
–Unlikely to see anything before the summer of 2008
Customer-friendly features
•Promoted by SVLG in the proceeding
•Adopted in decision
Key customer protections
•CPP is to be voluntary, meaning customers can opt-out with zero penalty to their current time-of-use rate
•Opting out must be very easy – no more than a phone call or email
•Customers have bill protection for their first year
–Can pay no more on the CPP price than the TOU
•Customers must be fully informed as to the likely bill effects

15© eMeter Corporation 2006
Critical Peak Pricing: What is it?
$-
$0.10
$0.20
$0.30
$0.40
$0.50
$0.60
Sunday Monday Tuesday Wednesday Thursday Friday Saturday
Pri
ce
per
kW
h
Off-Peak
Peak (12-6 pm)
Critical Peak (12-6 pm)
Critical Peak Notification to Customer (by 5 p.m.)

16© eMeter Corporation 2006
Case Study 3: Two-Part Real-Time Pricing
Georgia Power Company
Very high participation
•1,700 customers (80% of those eligible)
•> 5,000 MW peak load; 500 to 1,000 MW peak reduction
•Voluntary
•Day-ahead (75%) and hour-ahead (25%) hourly pricing
•Prices based on wholesale market with adjustments
Features
•Customer pays for baseline level of usage at standard tariff prices
•Deviations from baseline – increases or decreases – billed at RTP price

17© eMeter Corporation 2006
kW
1 24
Actual load
Customer “sells” load at high RTP prices
Customer “buys” load at low RTP prices
Baseline
Hour of Day
Two-part RTP Example
Source: Christensen Associates

18© eMeter Corporation 2006
0.60
0.70
0.80
0.90
1.00
1.10
1.20
1 2 3 4 5 6 7 8 9 10 11 12 13 14 15 16 17 18 19 20 21 22 23 24
Hour
Nor
mal
ized
Loa
d
0
2
4
6
8
10
12
14
16
Loga
rithm
of
Pric
e ($
/MW
)
Load at highest prices
Highest prices
Reference Load
Load at moderate prices
Reference prices
Moderate prices
Load Response, by Price Day-type
Source: Christensen Associates

19© eMeter Corporation 2006
Price Elasticities: Commercial Office Buildings
0.000
0.050
0.100
0.150
0.200
0.250
0.300
0.350
0.400
0.450
0.500
1 3 5 7 9 11
13
15
17
19
21
23
25
27
29
31
33
35
37
39
41
43
45
47
49
51
Source: Christensen Associates
Elasticity is the amount load is reduced when the on-peak price is doubled
20© eMeter Corporation 2006
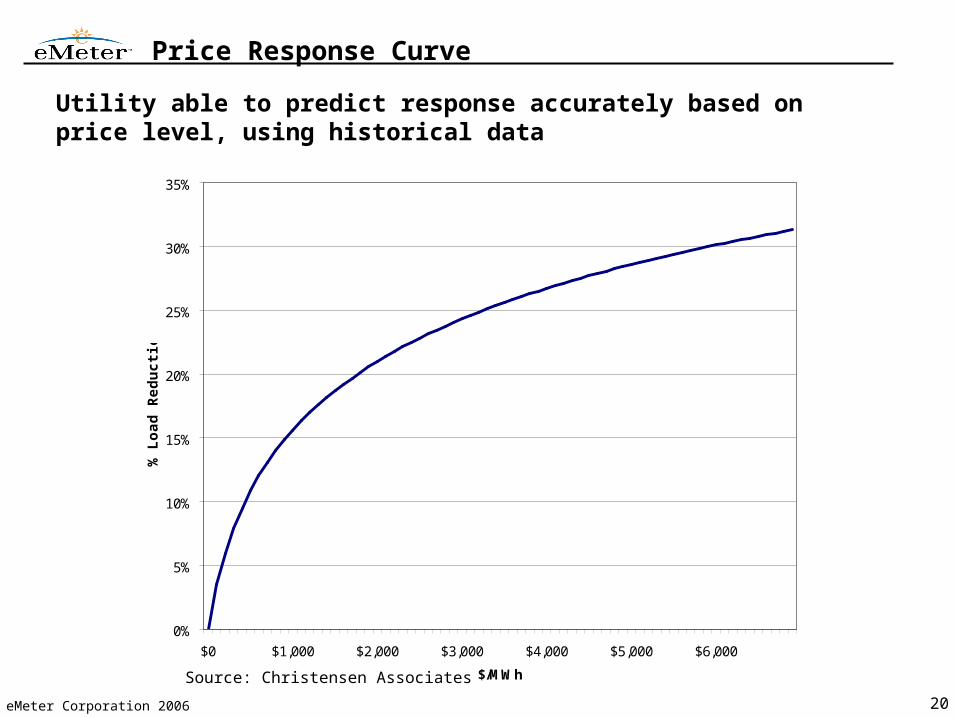
Price Response Curve
Utility able to predict response accurately based on price level, using historical data
0%
5%
10%
15%
20%
25%
30%
35%
$0 $1,000 $2,000 $3,000 $4,000 $5,000 $6,000
$/MWh
% L
oa
d R
ed
uc
tio
n
Source: Christensen Associates
21© eMeter Corporation 2006
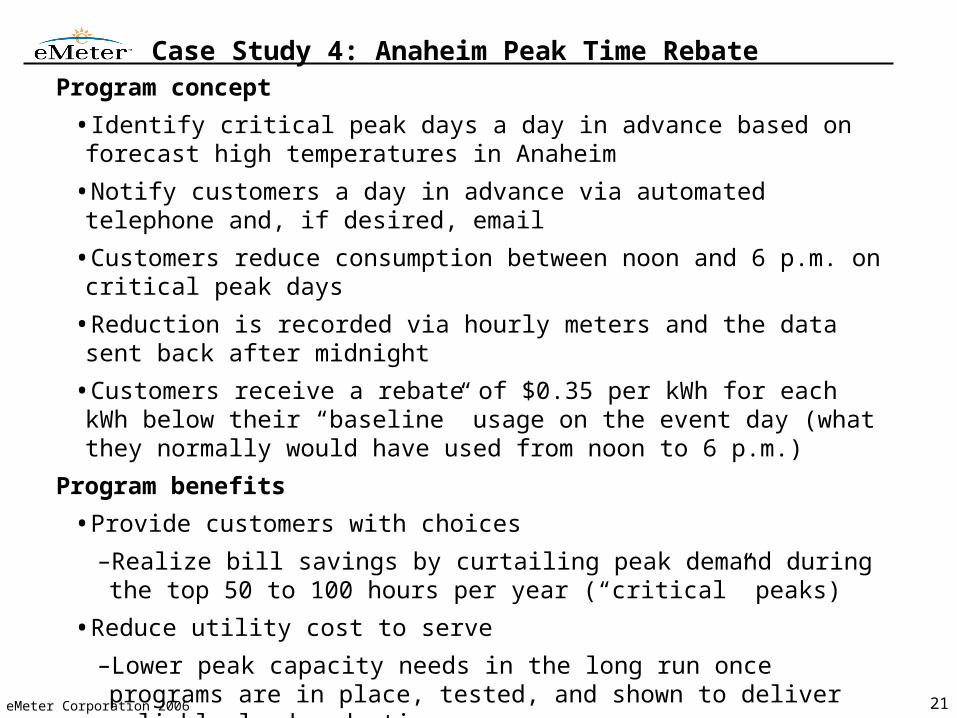
Case Study 4: Anaheim Peak Time RebateProgram concept
•Identify critical peak days a day in advance based on forecast high temperatures in Anaheim
•Notify customers a day in advance via automated telephone and, if desired, email
•Customers reduce consumption between noon and 6 p.m. on critical peak days
•Reduction is recorded via hourly meters and the data sent back after midnight
•Customers receive a rebate of $0.35 per kWh for each kWh below their “baseline” usage on the event day (what they normally would have used from noon to 6 p.m.)
Program benefits
•Provide customers with choices
–Realize bill savings by curtailing peak demand during the top 50 to 100 hours per year (“critical” peaks)
•Reduce utility cost to serve
–Lower peak capacity needs in the long run once programs are in place, tested, and shown to deliver reliable load reductions

22© eMeter Corporation 2006
Peak-Time Rebate
Establish customer baseline
•Three highest of previous 10 non-event weekdays
Rebate is reduction times the price (30 cents per kWh rebate)
No risk to customer
No need to meet specific reduction targets
kW
1 24Hour of Day
12
Peak hoursPeak reduction

23© eMeter Corporation 2006
Program OperationsExperimental sample provided with meters
•Sample designed by Professor Frank Wolak of Stanford University
Recruitment
•Recruitment via direct mail
•No incentive payment
Customer education
•Customers sent fact sheets and a refrigerator magnet
•Webpage added to anaheim.net with FAQs and other info
•Customer service via 800 number and email enabled
Events
•12 events in 2005
•Included both days when California grid had problems
Results
•13% peak reduction – same as reduction measured in critical peak price program
•SDG&E has proposed rolling this out to all of its small business and residential customers

24© eMeter Corporation 2006
Case Study 5: Auto-DR
Nationwide test by Lawrence Berkeley National Labs
Automated response to hourly prices
•Prices published on server
•Customer systems grab prices automatically
•Energy management system controls load in response to prices

25© eMeter Corporation 2006
Auto DR Results

26© eMeter Corporation 2006
Auto DR Results: Office Buildings

27© eMeter Corporation 2006
Customer Shed Strategies

28© eMeter Corporation 2006
Conclusions
Demand response and energy information are of interest to a subset of businesses
•For whom controlling energy costs is a major concern
•Who are provided with tools to manage energy costs
Some good success stories
Customer-friendly demand response programs are:
•Simple
•Easy to participate in
•Are supported by automation tools and automated response
•Have risks that are known and easily managed
•Stable over time
•Offer good value for customer efforts