customer complaint resolution excellence - capturing insights to drive business improvements report...
TRANSCRIPT

1
Best Practices, LLC Strategic Benchmarking Research & Analysis
Customer Complaint Resolution Excellence: Capturing Insights to Drive Business
Improvements

BEST PRACTICES,®
LLC2
Copyright © Best Practices, LLC
Table of Contents
Project Background
Project Overview
Benchmark Class Profile
Key Findings
Study Findings
Complaint Resolution Groups: Structure, Roles & Responsibilities
Listening to Customer Complaints to Glean Improvement Insights
Service Claim Resolution Benchmarks
Reducing Complaint Volume
Complaint Process Automation & Analytics
Driving Improvements via the Complaints Process
Lessons Learned: Turning Customer Complaints into Business Improvements
About Best Practices, LLC

BEST PRACTICES,®
LLC3
Copyright © Best Practices, LLC
Key Topic Areas Probed:
Study Objective & Research Methodology
Research Objectives:
• Establish performance benchmarks for complaint and service claim resolution processes among leading manufacturing organizations, especially ones that support a high volume of customer orders
• Gather innovative approaches to reduce claim volume and cost, improve supply chain effectiveness, and achieve maximum customer satisfaction (including insights for serving key customer segments)
• Adapt lessons that improve complaint resolution processes (including process automation) and maximize the impact of Voice- of-the-Customer information and other critical data gleaned throughout the complaint resolution cycle
This benchmarking research, conducted
through a field survey instrument and a
series of interviews with selected
participants, delivers performance metrics,
insights, and lessons learned on:
• Complaint resolution group structures,
roles, and responsibilities• Service claim resolution benchmarks• Processes for reducing complaint
volume• Complaint process automation and
analytics• Driving business improvements through
the complaints process
This benchmarking research study examines complaint resolution excellence, focusing on the areas of service claim resolution performance and the reduction of overall complaint volume. The study also probes key strategies and tactics for translating VOC and customer complaint data into business insights and improvements.

Universe of Learning: Benchmark Class Profiles &
Demographics
BEST PRACTICES,®
LLC
Participating Companies:
5Copyright © Best Practices, LLC
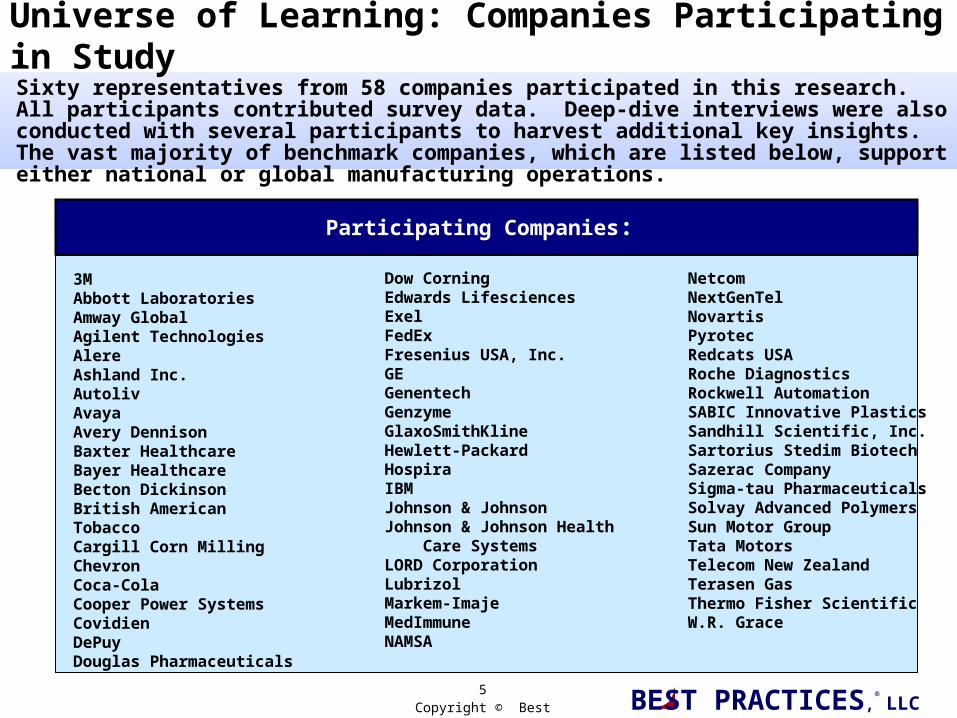
Sixty representatives from 58 companies participated in this research. All participants contributed survey data. Deep-dive interviews were also conducted with several participants to harvest additional key insights. The vast majority of benchmark companies, which are listed below, support either national or global manufacturing operations.
Universe of Learning: Companies Participating in Study
3M Abbott LaboratoriesAmway GlobalAgilent TechnologiesAlere Ashland Inc.AutolivAvaya Avery DennisonBaxter HealthcareBayer HealthcareBecton DickinsonBritish American TobaccoCargill Corn MillingChevronCoca-Cola Cooper Power SystemsCovidienDePuy Douglas Pharmaceuticals
Dow CorningEdwards LifesciencesExelFedEx Fresenius USA, Inc.GE GenentechGenzyme GlaxoSmithKlineHewlett-PackardHospiraIBM Johnson & Johnson Johnson & Johnson Health Care Systems LORD CorporationLubrizolMarkem-ImajeMedImmuneNAMSA
Netcom NextGenTelNovartisPyrotecRedcats USARoche DiagnosticsRockwell AutomationSABIC Innovative PlasticsSandhill Scientific, Inc.Sartorius Stedim BiotechSazerac CompanySigma-tau PharmaceuticalsSolvay Advanced Polymers Sun Motor GroupTata MotorsTelecom New Zealand Terasen GasThermo Fisher Scientific W.R. Grace

BEST PRACTICES,®
LLC
Research Participant Job Titles Include:
6Copyright © Best Practices, LLC
Job Titles of Research ParticipantsResearch data and insights were contributed by a seasoned class of respondents, from vice presidents to managers. The diversity of the job titles and functions among benchmark partners – including Customer Service, Supply Chain Management, Quality, and Business Process Improvement – suggests the cross-functional character of complaint resolution excellence and execution at many leading companies.
VP, Global QualityVP, QualityVP, Quality & RegulatoryVP, Supply ChainExecutive Director, Customer ServiceDirector, Customer ExperienceDirector, Global QualityDirector, LogisticsDirector, Operational EffectivenessDirector, Quality SystemsDirector, Regulatory ComplianceDirector, Supply Chain ManagementDirector, Wholesaler Channel OperationsManaging Director, Strategic Planning & QualityHead of Customer ServiceHead of Finance, SCM & OperationsHead of Service, Global Supply ChainService Claims Team LeaderGroup Business Process LeaderCustomer Service LeadSenior Manager, Regional OperationsSenior Product Complaint ManagerManager, Customer AdvocacyManager, Customer Assistance
Manager, Customer Quality AssuranceManager, Customer ServiceManager, National Customer Service & Marketing
CommunicationsManager, OperationsManager, Process ImprovementManager, QualityManager, Quality OperationsManager, Quality SystemsManager, Remote ServicesManager, Supply ChainBusiness Process ManagerCorporate Manager, Technical Sales & Client CareDepartment Manager, Customer DevelopmentGlobal Category Manager, SourcingOperational Regulatory ManagerProgram Manager, Customer Issue ResolutionBusiness Lean MasterMaster Black BeltCustomer AdvocateAnalyst, Supply ChainConsumer Affair AssociateLogistic & Customer Support, Supply Chain

BEST PRACTICES,®
LLC7
Copyright © Best Practices, LLC
Customer Complaint Resolution Benchmarks:
• Benchmark Companies Receive Service Claims on less than 2% of Customer Orders: Participating
companies manage an average of 25,812 total customer orders each month, fielding an average of 375 service claims.
• Non-Centralized Structures Common for High-Volume Customer Support: Companies that support a large
number of product orders and manage hundreds or thousands of service claims per month tend to distribute complaint management across the organization, in hybrid and especially decentralized management models. Companies employing a centralized complaint management structure managed an average of just 8,547 customer orders and 169 service claims each month. In contrast, companies employing de-centralized complaint management structure managed
an average of 64,605 customer orders and 1,725 service claims each month.
• Benchmark Companies Deny Only 21% of Customer Service Claims: Of these denied claims, study
participants report an average denied claim recovery percentage of 51%. For companies currently recovering on less than half of the claims they deny, there exists a substantial portion “unrecovered” revenue on all of these denied claims. Increasing recovery percentage represents a valuable opportunity to significantly boost revenue. Possible explanations for low recovery percentage of denied claims include:
• Tracking/Reporting Issues: Some denied claims which are classified as “unrecovered” may ultimately be paid beyond an organizations standard tracking period
• Terms & Conditions Policy: Comparatively short reporting window for customers to report common service claim types (shipment errors, damages, late deliveries, shortages, etc.) may cause recovery problems
The following key findings emerged from this study.
SAMPLE: Key Research Findings and Insights

BEST PRACTICES,®
LLC8
Copyright © Best Practices, LLC
Designated Complaint Management Groups Often Lead Key Resolution and Long-term Improvement Activities
Q3. Which group at your company has the primary leadership role for the following complaint management activities?
(n=59)
Benchmark Participants:: 25% 24% 2% 5% 19% 25%
Primary leadership for many of the key complaint management and continuous improvement activities probed in this research resides either in customer service or in a designated complaint management group at a majority of companies.
Customer Service
Designated Complaint
Management Group
Sales Department /
Account Managers
Distribution Centers
Six Sigma / Continuous
Improvement Other
Service claims credit approval or denial 46% 14% 22% 3% 3% 12%
Root cause analysis 25% 39% 3% 2% 19% 12%
Complaint trends analysis 24% 43% 3% 3% 16% 10%
Customer-complaint-driven Continuous Improvement 22% 34% 3% 3% 24% 14%
Includes mainly Quality Assurance departments

BEST PRACTICES,®
LLC9
Copyright © Best Practices, LLC
Late Deliveries Most Common Source of Service Claims
Q4. Please rank which areas generate the largest number of service claims: (“6" = most service claims and “1" = least service claims)
4.27
3.64
3.54
3.54
2.98
2.05
(n=57)
Late Deliveries
Shipment Errors (e.g., wrong address)
Shortages
Damages to Shipment (during transit)
Pricing Discrepancies
Overages
Benchmark companies most often confront service claims arising from shipment problems that may be, though are not necessarily, carrier-related. According to the benchmark class, the areas which generate the largest number of service claims were late deliveries, followed by shipment errors (e.g., wrong address).

BEST PRACTICES,®
LLC10
Copyright © Best Practices, LLC
Companies Typically Allow 30 Days to Report a Service Claim
Q9. How many days does your company's Terms & Conditions policy allow for a customer to report the following service claim types? (Responses given in days)
(n=37)
The Terms & Conditions policies at most benchmark companies provide a two-week to 30-day window for customers to file shipping-related service claims. Policies generally allow for a longer reporting period around pricing discrepancy issues. Companies in regulated industries such as healthcare tend to provide longer reporting windows around Quality and Product Safety issues.
Shipment Errors
Late Deliveries
Shortages Overages Damages to
ShipmentPricing
Discrepancies
High 180 180 365 365 365 365
75th Percentile 30 30 30 30 30 44
Average (Mean) 35 39 49 49 43 54
Median 30 30 30 30 23 30
25th Percentile 14 14 14 14 9 30
Low 1 1 2 2 1 1

BEST PRACTICES,®
LLC11
Copyright © Best Practices, LLC
Flexible Approaches Common for Key Customers
Q10. How rigidly or loosely do you enforce your Terms & Conditions policies for key customers and accounts? (Please choose the option that best describes your complaint
management group's approach to key accounts)
(n=49)
20%
35%
43%
Rigid Enforcement
Somewhat Rigid Enforcement:
Somewhat Flexible Enforcement
Loose Enforcement, 2%
Almost half of benchmark partners adopt a “Somewhat Flexible” approach to enforcing Terms & Conditions polices for key customers and accounts, whereby reporting requirements for various service issues may sometimes be relaxed. In contrast, only 20% of companies deploy a “Rigid” approach to enforcing policies for this critical group.
“We only relax our reporting policies on rare occasions.”
“We hold all customers up to the same reporting standards and timelines.”
“We often relax our reporting policies.”
“We hardly ever enforce our reporting policy.”
Voices from the Field:The Marketing group does a lot of work around
managing key customers: they do a lot of focus
groups and other key-customer-related things.
That’s less often done in the complaint system, at
least in our company.
--Director, Quality Systems
Voices from the Field:The Marketing group does a lot of work around
managing key customers: they do a lot of focus
groups and other key-customer-related things.
That’s less often done in the complaint system, at
least in our company.
--Director, Quality Systems

BEST PRACTICES,®
LLC12
Copyright © Best Practices, LLC
Best Practices, LLC6350 Quadrangle Drive, Suite 200
Chapel Hill, NC 27517www.best-in-class.com
About Best Practices, LLCBest Practices, LLC is a research and consulting firm that conducts work based on the simple yet profound principle that organizations can chart a course to superior economic performance by studying the best business practices, operating tactics, and winning strategies of world-class companies.
Link for Report: Capturing Insights to Drive Business Improvements