current status of the hiv/aids epidemic hail m. al-abdely, md consultant, infectious diseases
TRANSCRIPT

Current Status of the HIV/AIDS EpidemicCurrent Status of the HIV/AIDS Epidemic
Hail M. Al-Abdely, MDHail M. Al-Abdely, MD
Consultant, Infectious DiseasesConsultant, Infectious Diseases

History of HIV/AIDS

History of HIV Infection
1926– Some scientists believe HIV spread from monkeys to
humans between 1926 - 1946.
– Recent research indicates HIV most probably first jumped from chimpanzees to humans as early as 1675 and didn't establish itself as an epidemic strain in Africa until 1930

1959– A man died in the Congo in what was the first
proven AIDS death. Nature (02/05/98) Vol. 391, No. 6667, P. 594
1978– Gay men in the US and Sweden -- and
heterosexuals in Tanzania and Haiti -- begin showing signs of what will later be called AIDS.
History of HIV Infection

1981
– CDC (USA) notices an alarming rate of a rare cancer (Kaposi's Sarcoma) in otherwise healthy gay men. They first called the disease "gay cancer" but soon rename it GRID ("gay-related immune deficiency").
– 422 cases diagnosed in the U.S.; 159 are dead.
History of HIV Infection

1982
– CDC (USA) links the new disease to blood. – The term AIDS ("acquired immune deficiency
syndrome") is used for the first time. – The Gay Men's Health Crisis is founded in New
York City.
– 1,614 cases of AIDS diagnosed in the U.S.; 619 are dead..
History of HIV Infection

1983– CDC (USA) warns blood banks of a possible problem
with the blood supply. – Institut Pasteur (France) finds the virus (HIV).
– 4,749 cases of AIDS in the U.S.; 2,122 are dead.
History of HIV Infection

1984
– Dr. Robert Gallo (US) claims he discovered the virus that causes AIDS; however, this is about a year after the French discovery.
– 11,055 cases of AIDS diagnosed in the U.S.; 5,620 are dead.
History of HIV Infection

1985
– The FDA (US) approves the first HIV antibody test. Blood products begin to be tested in the US and Japan.
– The first International Conference on AIDS is held in Atlanta (US).
– 22,996 cases of AIDS diagnosed in the U.S.; 12,592 are dead.
History of HIV Infection

1987
– AZT (zidovudine, Retrovir®) -- Glaxo Wellcome -- becomes the first anti-HIV drug approved by the FDA. • The recommended dose was one 100mg capsule every
four hours around the clock.
– 71,176 AIDS cases diagnosed in the U.S.; 41,027 people are dead.
History of HIV Infection

1991-1994– ddI (didanosine, Videx®), ddC (zalcitabine, Hivid®), d4T
(Zerit®) were approved by the FDA.– 478,756 AIDS cases diagnosed in the U.S.; 288,597
are dead
History of HIV Infection

1995-2000
– The era of Highly Active Anti-Retroviral Therapy (HAART).
– Understanding of Viral dynamics
– Effective prevention of perinatal transmission
History of HIV Infection

UN/AIDS data on the global epidemicJune 2000

End-1999 global HIV/AIDS estimatesEnd-1999 global HIV/AIDS estimates Children and adultsChildren and adults
People living with HIV/AIDS
New HIV infections in 1999
Deaths due to HIV/AIDS in 1999
Cumulative number of deaths due to HIV/AIDS
34.3 million
5.4 million
2.8 million
18.8 million
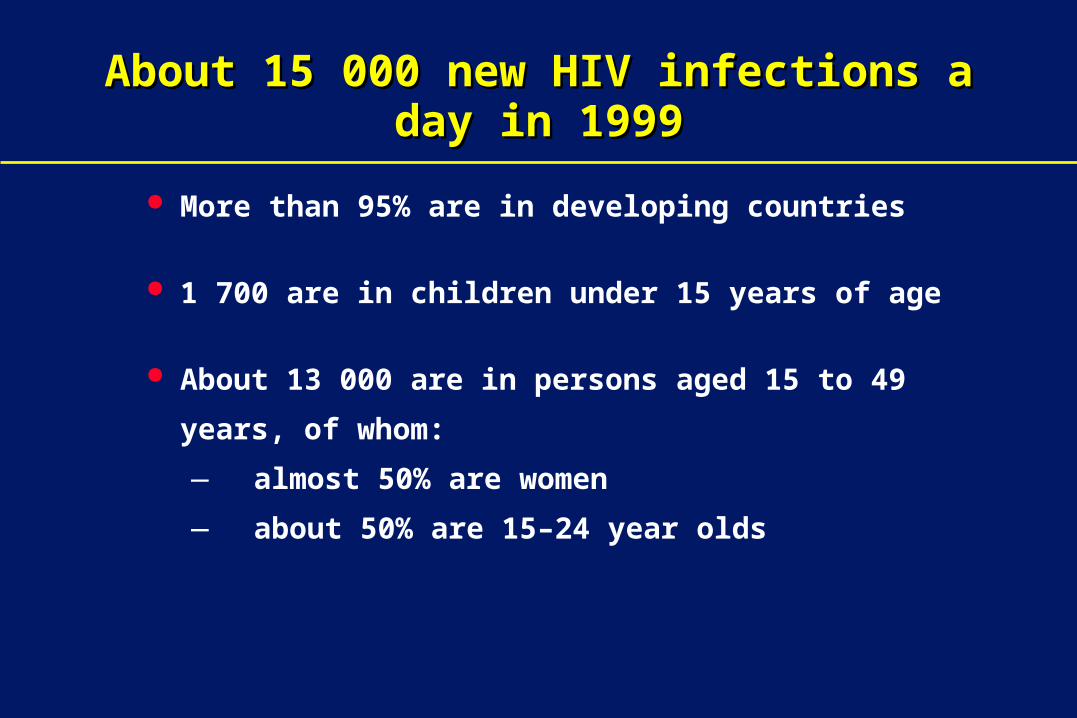
About 15 000 new HIV infections a day in 1999About 15 000 new HIV infections a day in 1999
More than 95% are in developing countries
1 700 are in children under 15 years of age
About 13 000 are in persons aged 15 to 49 years, of
whom:
— almost 50% are women
— about 50% are 15–24 year olds
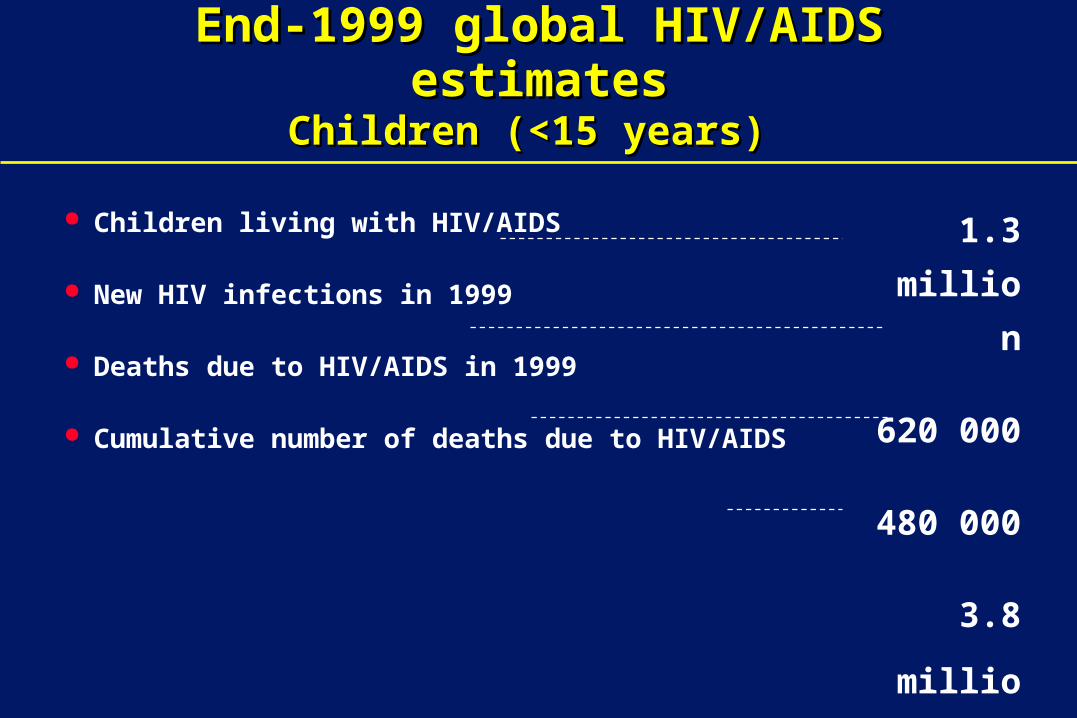
Children living with HIV/AIDS
New HIV infections in 1999
Deaths due to HIV/AIDS in 1999
Cumulative number of deaths due to HIV/AIDS
End-1999 global HIV/AIDS estimatesEnd-1999 global HIV/AIDS estimatesChildren Children (<15 years)(<15 years)
1.3 million
620 000
480 000
3.8 million
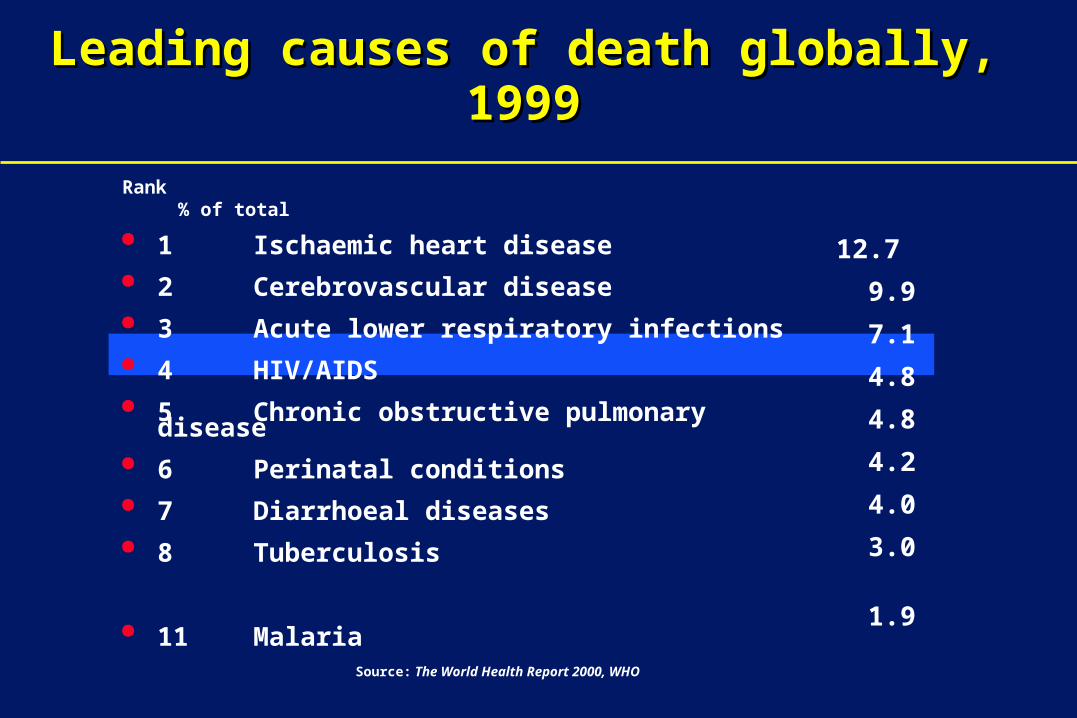
Leading causes of death globally, 1999Leading causes of death globally, 1999
1 Ischaemic heart disease 2 Cerebrovascular disease 3 Acute lower respiratory infections 4 HIV/AIDS 5 Chronic obstructive pulmonary disease 6 Perinatal conditions 7 Diarrhoeal diseases 8 Tuberculosis
11 Malaria
12.7
9.9
7.1
4.8
4.8
4.2
4.0
3.0
1.9
Source: The World Health Report 2000, WHO
Rank % of total

Leading causes of death in Africa, 1999Leading causes of death in Africa, 1999
1 HIV/AIDS 2 Acute lower respiratory infections 3 Malaria 4 Diarrhoeal diseases 5 Perinatal conditions 6 Measles 7 Tuberculosis 8 Cerebrovascular disease 9 Ischaemic heart disease 10 Maternal conditions
20.6
10.3
9.1
7.3
5.9
4.9
3.4
3.2
3.0
2.4
Source: The World Health Report 2000, WHO
Rank % of total

Adults and children estimated to be living Adults and children estimated to be living with HIV/AIDS as of end 1999with HIV/AIDS as of end 1999
Western Europe
520 000520 000North Africa & Middle East
220 000220 000sub-Saharan
Africa
24.5 million24.5 million
Eastern Europe & Central Asia
420 000420 000
South & South-East Asia 5.6 million5.6 million
Australia & New Zealand
15 00015 000
North America
900 000900 000Caribbean
360 000360 000
Latin America
1.3 million1.3 million
Total: 34.3 millionTotal: 34.3 million
East Asia & Pacific
530 000530 000

ChildrenChildren (<15 years)(<15 years) estimated to be living estimated to be living with HIV/AIDS as of end 1999with HIV/AIDS as of end 1999
Western Europe
4 1004 100North Africa & Middle East
8 0008 000sub-Saharan
Africa
1 million1 million
Eastern Europe &Central Asia
15 00015 000East Asia & Pacific
5 2005 200South & South-East Asia
200 000200 000
Australia & New Zealand
< 200< 200
North America
11 00011 000Caribbean
9 6009 600
Latin America
28 00028 000
Total: 1.3 millionTotal: 1.3 million

Estimated adult and child deaths due to HIV/AIDSEstimated adult and child deaths due to HIV/AIDSfrom the beginning of the epidemic to end 1999from the beginning of the epidemic to end 1999
Western Europe
210 000210 000North Africa & Middle East
70 00070 000sub-Saharan
Africa
14.8 million14.8 million
Eastern Europe &Central Asia
21 00021 000East Asia & Pacific
52 00052 000South & South-East Asia
2.6 million2.6 million
Australia & New Zealand
6 6006 600
North America
470 000470 000Caribbean
210 000210 000
Latin America
460 000460 000
Total: 18.8 millionTotal: 18.8 million

Estimated deaths in children Estimated deaths in children (<15 years)(<15 years) due to due to HIV/AIDS from the beginning of the epidemic HIV/AIDS from the beginning of the epidemic
to end 1999to end 1999
Western Europe
3 0003 000North Africa & Middle East
6 0006 000sub-Saharan
Africa
3.3 million3.3 million
Eastern Europe &Central Asia
5 0005 000East Asia & Pacific
2 9002 900South & South-East Asia
440 000440 000
Australia & New Zealand
< 100< 100
North America
5 0005 000Caribbean
24 00024 000
Latin America
24 00024 000
Total: 3.8 millionTotal: 3.8 million

Estimated adult and child deaths Estimated adult and child deaths from HIV/AIDS during 1999from HIV/AIDS during 1999
Western Europe
6 8006 800North Africa & Middle East
13 00013 000sub-Saharan
Africa
2.2 million2.2 million
Eastern Europe &Central Asia
8 5008 500East Asia & Pacific
18 00018 000South & South-East Asia
460 000460 000
Australia & New Zealand
< 200< 200
North America
20 00020 000Caribbean
30 00030 000
Latin America
48 00048 000
Total: 2.8 millionTotal: 2.8 million
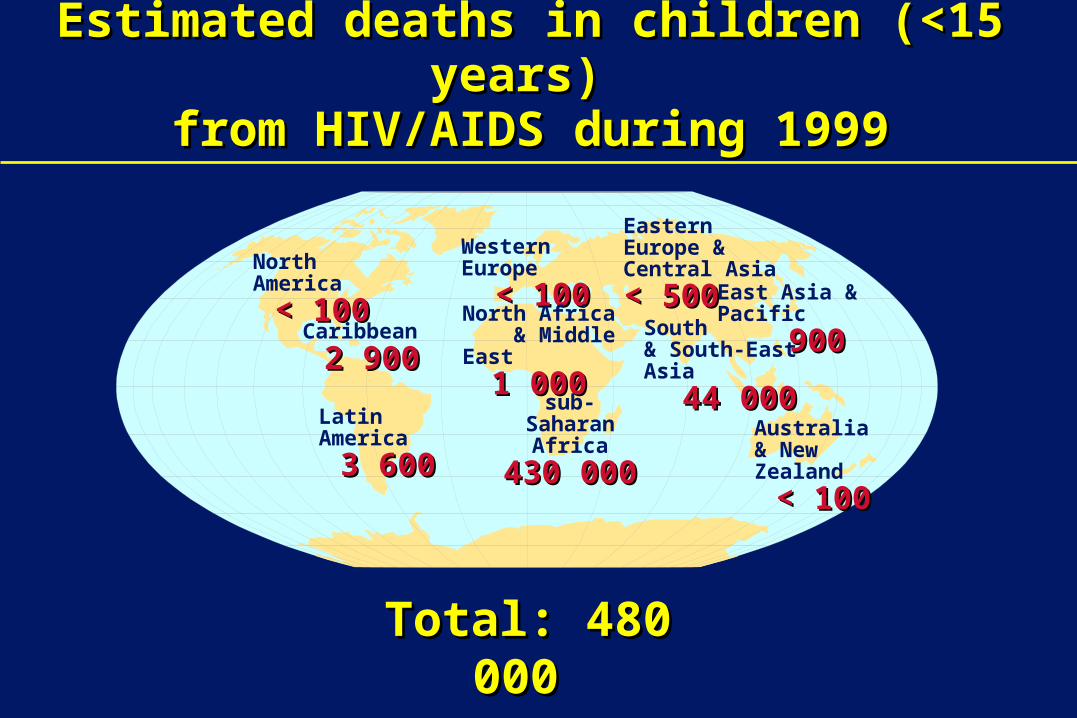
Estimated deaths in children Estimated deaths in children (<15 years)(<15 years) from HIV/AIDS during 1999from HIV/AIDS during 1999
Western Europe
< 100< 100North Africa & Middle East
1 0001 000sub-Saharan
Africa
430 000430 000
Eastern Europe &Central Asia
< 500< 500East Asia & Pacific
900900South & South-East Asia
44 00044 000
Australia & New Zealand
< 100< 100
North America
< 100< 100Caribbean
2 9002 900
Latin America
3 6003 600
Total: 480 000Total: 480 000

Estimated number of adults and childrenEstimated number of adults and childrennewly infected with HIV during 1999newly infected with HIV during 1999
Western Europe
30 00030 000North Africa & Middle East
20 00020 000sub-Saharan
Africa
4.0 million4.0 million
Eastern Europe &Central Asia
130 000130 000East Asia & Pacific
120 000120 000South & South-East Asia
800 000800 000
Australia & New Zealand
500500
North America
45 00045 000Caribbean
60 00060 000
Latin America
150 000150 000
Total: 5.4 millionTotal: 5.4 million

Estimated number of children Estimated number of children (<15 years)(<15 years) newly infected with HIV during 1999newly infected with HIV during 1999
Western Europe
< 500< 500North Africa & Middle East
2 0002 000sub-Saharan
Africa
515 000515 000
Eastern Europe &Central Asia
500500East Asia & Pacific
2 4002 400South & South-East Asia
86 00086 000
Australia & New Zealand
< 100< 100
North America
< 500< 500Caribbean
4 0004 000
Latin America
6 8006 800
Total: 620 000Total: 620 000

Cumulative number of children estimated to have Cumulative number of children estimated to have been orphaned by AIDS* at age 14 or youngerbeen orphaned by AIDS* at age 14 or younger
at the end of 1999at the end of 1999
Western Europe
9 0009 000North Africa & Middle East
15 00015 000sub-Saharan
Africa
12.1 million12.1 million
Eastern Europe &Central Asia
500500 East Asia & Pacific
5 6005 600South & South-East Asia
850 000850 000
Australia & New Zealand
< 500< 500
North America
70 00070 000Caribbean
85 00085 000
Latin America
110 000110 000
Total: 13.2 millionTotal: 13.2 million * Children who have lost their mother or both parents to AIDS before the age of 15 years

A global view of HIV infectionA global view of HIV infection 33 million adults living with HIV/AIDS as of end 199933 million adults living with HIV/AIDS as of end 1999
Adult prevalence rate
15.0% – 36.0% 5.0% – 15.0% 1.0% – 5.0% 0.5% – 1.0% 0.1% – 0.5% 0.0% – 0.1% not available

Spread of HIV over time in Asia, 1984 to 1999Spread of HIV over time in Asia, 1984 to 1999
2.0% – 5.0% 1.0% – 2.0% 0.5% – 1.0% 0.1% – 0.5% 0.0% – 0.1%trend data unavailable
outside region

New
in
fect
ion
s
-
500,000
1,000,000
1,500,000
2,000,000
2,500,000
3,000,000
3,500,000
4,000,000
80 81 82 83 84 85 86 87 88 89 90 91 92 93 94 95 96 97 98 99
Highly industrialized countries
North Africa & Middle EastEastern Europe & Central asiaSub-Saharan AfricaLatin America & the Caribbean
Southern & Eastern Asia
Estimated annual number of new HIV Estimated annual number of new HIV infections by region, 1980 to 1999infections by region, 1980 to 1999

Peo
ple
liv
ing
wit
h H
IV/A
IDS
Highly industrialized countries
North Africa & Middle East
Eastern Europe & Central Asia
Sub-Saharan AfricaLatin America & the Caribbean
Southern & Eastern Asia
5,000,000
10,000,000
15,000,000
20,000,000
25,000,000
80 81 82 83 84 85 86 87 88 89 90 91 92 93 94 95 96 97 98 99
Estimated number of people living with Estimated number of people living with HIV/AIDS by region, 1980 to 1999HIV/AIDS by region, 1980 to 1999

Estimated adult HIV prevalence in Kenya, Estimated adult HIV prevalence in Kenya, 1990-19991990-1999
Source: National AIDS and STD Control Programme, 1999 and UNAIDS
0
2
4
6
8
10
12
14
16
90 91 92 93 94 95 96 97 98 99
HIV
pre
vale
nc
e (%
)

HIV prevalence among pregnant womenHIV prevalence among pregnant womenin South Africa, 1990 to 1999in South Africa, 1990 to 1999
Source: Department of Health, South Africa
0.71.7 2.1
4
7.6
10.4
14.2
17
22.8 22.4
0
5
10
15
20
25
90 91 92 93 94 95 96 97 98 99
HIV
pre
vale
nc
e (%
)

Impact of HIV/AIDS on urban households, Côte d’Ivoire
Impact of HIV/AIDS on urban households, Côte d’Ivoire
General populationGeneral population Families living with AIDSFamilies living with AIDS
Source: Simulation-based on data from Bechu, Delcroix and Guillaume, 1997
Monthly income per capitaMonthly income per capita
Monthly consumptionper capitaMonthly consumptionper capita
00
5 0005 000
10 00010 000
15 00015 000
20 00020 000
25 00025 000
– 5 000– 5 000
30 000 Francs CFA30 000 Francs CFA
Savings/DisavingsSavings/Disavings
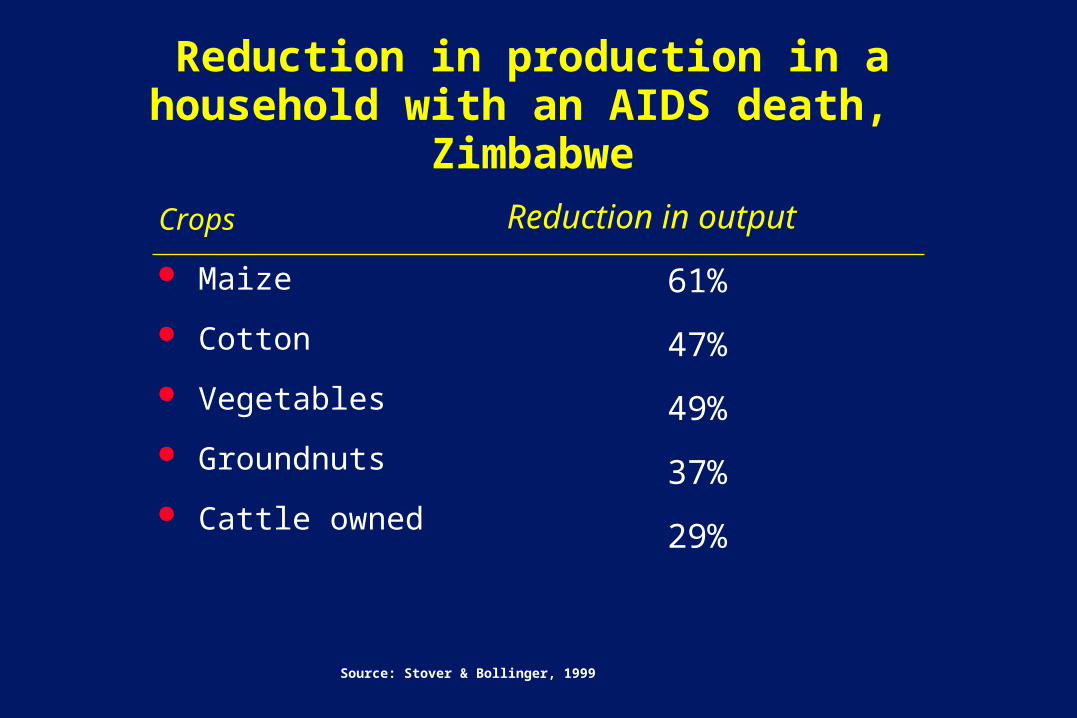
Reduction in production in a household with an AIDS death, Zimbabwe
Crops
Maize
Cotton
Vegetables
Groundnuts
Cattle owned
Reduction in output
61%
47%
49%
37%
29%
Source: Stover & Bollinger, 1999

Projected population structure with and Projected population structure with and without the AIDS epidemic, Botswana, 2020without the AIDS epidemic, Botswana, 2020
80757065605550454035302520151050
020406080100120140 0 20 40 60 80 100 120 140
Males Females Deficits due to AIDS
Projected population structure in 2020
Population (thousands)
Ag
e in
yea
rs
Source: US Census Bureau, World Population Profile 2000
Prevention Campaigns can be effective
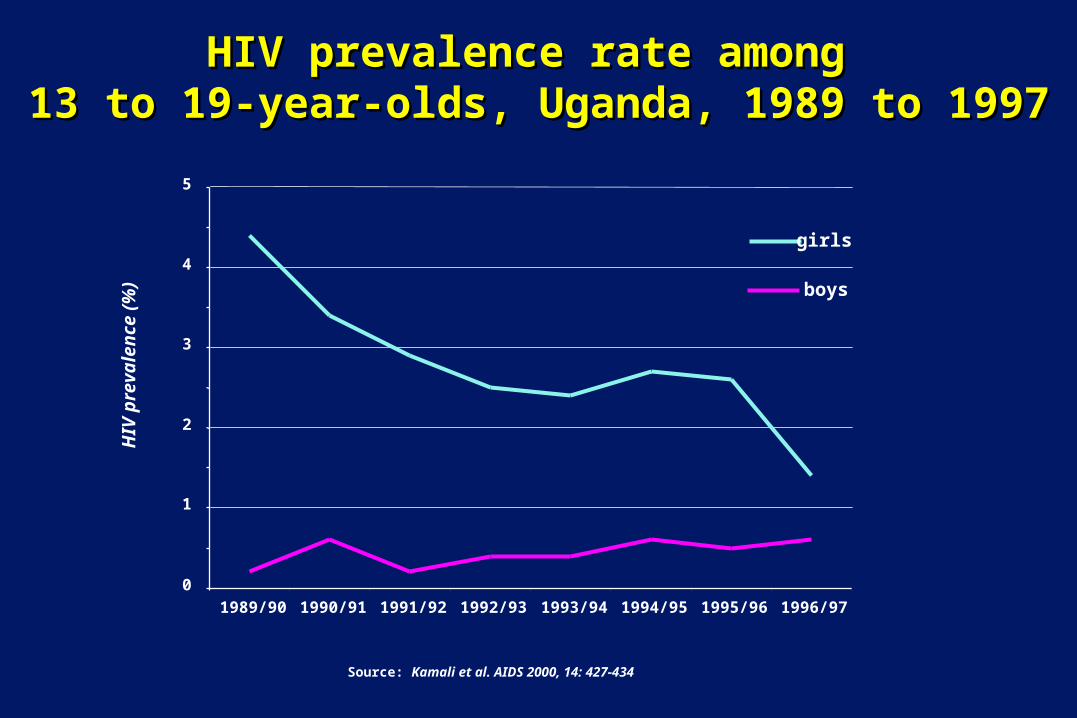
HIV prevalence rate among HIV prevalence rate among 13 to 19-year-olds, Uganda, 1989 to 199713 to 19-year-olds, Uganda, 1989 to 1997
0
1
2
3
4
5
1989/90 1990/91 1991/92 1992/93 1993/94 1994/95 1995/96 1996/97
girls
boys
Source: Kamali et al. AIDS 2000, 14: 427-434
HIV
pre
vale
nc
e (%
)

HIV prevalence rate among pregnant 15-24 year-olds HIV prevalence rate among pregnant 15-24 year-olds by educational status, Ugandaby educational status, Uganda
0
5
10
15
20
25
30
1991-1994 1995-1997
HIV
pre
vale
nc
e (%
)
illiterate
primary education
secondary education
Source: Kilian A et al. AIDS 1999, 13: 391-398.

Changes in life expectancy in selected African countries with high HIV prevalence, 1950 to 2000
South-Africa
35
40
45
50
55
60
65
1950-55 1955-60 1960-65 1965-70 1970-75 1975-80 1980-85 1985-90 1990-95 1995-00
Lif
e e
xp
ecta
ncy
at
bir
th,
in y
ears
Botswana
Uganda
Zambia
Zimbabwe
Source: United Nations Population Division, 1998

HIV prevalence in military personnel in AfricaHIV prevalence in military personnel in Africa
Nigeria: 11% among peacekeepers returning from
Sierra Leone and Liberia vs 5% in adult
population
South Africa: 60-70% in military vs 20% in adult
population
Source: Nigeria AIDS bulletin No 15, May 20, 2000; The Mail & Guardian, Pretoria, March 31, 2000; UNAIDS/WHO 1999 estimate

Trend in HIV prevalence in 21 year old military Trend in HIV prevalence in 21 year old military conscripts in Thailandconscripts in Thailand
Source: Armed Forces Research Institute of Medical Sciences, Thailand
1989 1990 1991 1992 1993 1994 1995 1996 1997 1998 1999
HIV
pre
vale
nc
e (%
)H
IV p
reva
len
ce
(%)
00
55
I.V drug injection – a growing problem in eastern Europe

Proportion of all new HIV infections that are inProportion of all new HIV infections that are ininjecting drug users, selected countries, 1998-1999injecting drug users, selected countries, 1998-1999
0
10
20
30
40
50
60
70
80
90
100
Canada China Latvia Malaysia Moldova RussianFederation
Ukraine Viet Nam
Source: National AIDS Programmes
Per
cen
tag
e

Annual number of newly registered HIV infections, Annual number of newly registered HIV infections, Russia, 1993 to 1999Russia, 1993 to 1999
108 158 196
1,546
4,399 3,947
15,462
0
2,000
4,000
6,000
8,000
10,000
12,000
14,000
16,000
18,000
93 94 95 96 97 98 99
Year of registration
Nu
mb
er o
f H
IV i
nfe
ctio
ns
Source: Russian Federal AIDS Centre, Moscow

Heterosexual transmission is taking over even in the West
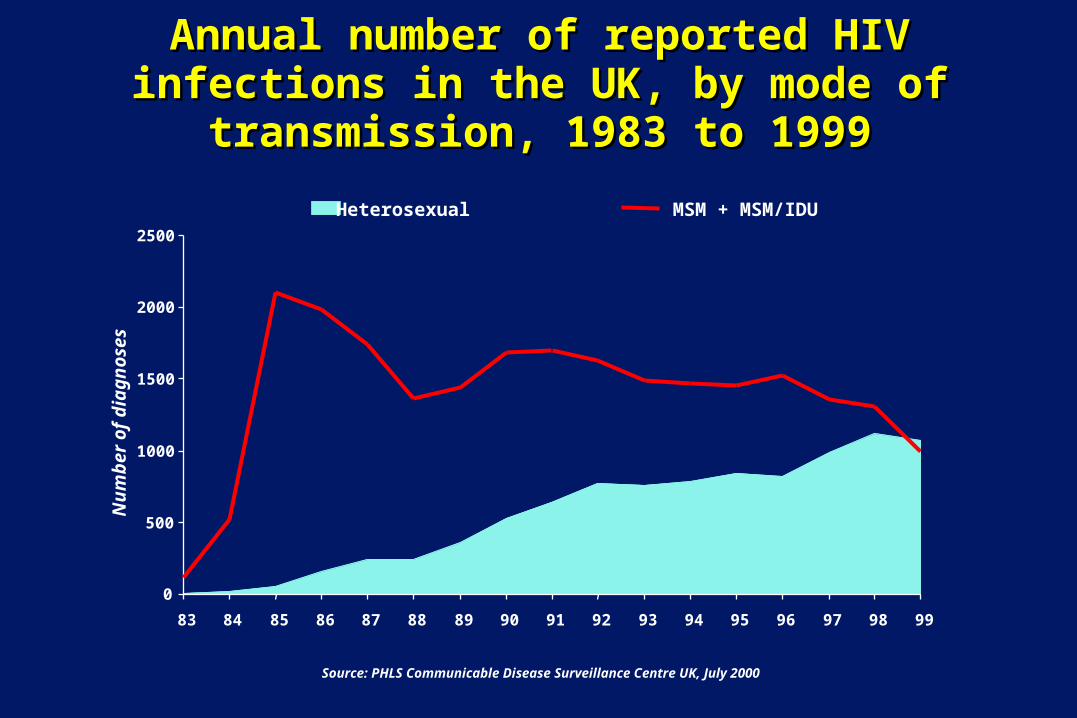
Annual number of reported HIV infections in the Annual number of reported HIV infections in the UK, by mode of transmission, 1983 to 1999UK, by mode of transmission, 1983 to 1999
0
500
1000
1500
2000
2500
83 84 85 86 87 88 89 90 91 92 93 94 95 96 97 98 99
Nu
mb
er o
f d
iag
no
ses
Heterosexual MSM + MSM/IDU
Source: PHLS Communicable Disease Surveillance Centre UK, July 2000

Effective therapy: epidemiological effects

AIDS patients, AIDS deaths and patients AIDS patients, AIDS deaths and patients on HAART among homosexual men, San Francisco, on HAART among homosexual men, San Francisco,
USA, 1980 to 1998USA, 1980 to 1998
0
1000
2000
3000
4000
5000
6000
7000
8000
80 81 82 83 84 85 86 87 88 89 90 91 92 93 94 95 96 97 98
taking antiretroviral drugstaking antiretroviral drugs
AIDS deathsAIDS deaths
AIDS casesAIDS cases
Source: San Francisco Department of Public Health (California), USA, 1999

0
2
4
6
8
10
12
14
16
18
82 84 86 88 90 92 94 96 98**
Year
Dea
ths
per
100
,000
Po
pu
lati
on
**Preliminary 1998 data
Trends in Age-Adjusted* Rates of Death due to HIV Infection,USA, 1982-1998
*Using the age distribution of the projected year 2000 US population as the standard.

Annual number of deaths due to AIDS, Annual number of deaths due to AIDS, Canada, 1990 to 1999Canada, 1990 to 1999
0
200
400
600
800
1000
1200
1400
1600
90 91 92 93 94 95 96 97 98 99
Nu
mb
er o
f A
IDS
de
ath
s
Source: Health Canada, HIV and AIDS in Canada. Surveillance Report to December 31, 1999

The Middle-East – “Good luck with an accurate data!”

Estimates of HIV/AIDS Cases in the Middle-East- end of 1999
Country Adults (15-49) Adult rate (%)North Africa & Middle East 210,000 0.12Algeria 11,000* 0.07*Bahrain 500* 0.15*Cyprus 400 0.10Egypt 8100* 0.02*Iraq 300* <0.01*Israel 2,400 0.08Jordan 660* 0.02*Kuwait 1,300* 0.12*Lebanon 1,500* 0.09*Libyan Arab Jamahiriya 1,400* 0.05*Morocco 5,000* 0.03*Oman 1,200* 0.11*Qatar 300* 0.09*Saudi Arabia 1,100* 0.01*Sudan 140,000* 0.99*Syrian Arab Republic 800* 0.01*Tunisia 2,200* 0.04*Turkey 2,500 0.01United Arab Emirates 2,300* 0.18*Yemen 900* 0.01*

Reported AIDS Cases in Saudi Arabia – WHO data
0
20
40
60
80
100
120
Ca
se
s
1985 1986 1987 1988 1989 1990 1991 1992 1993 1994 1995 1996 1997 1998 1999
Total = 414

KFSH Experience
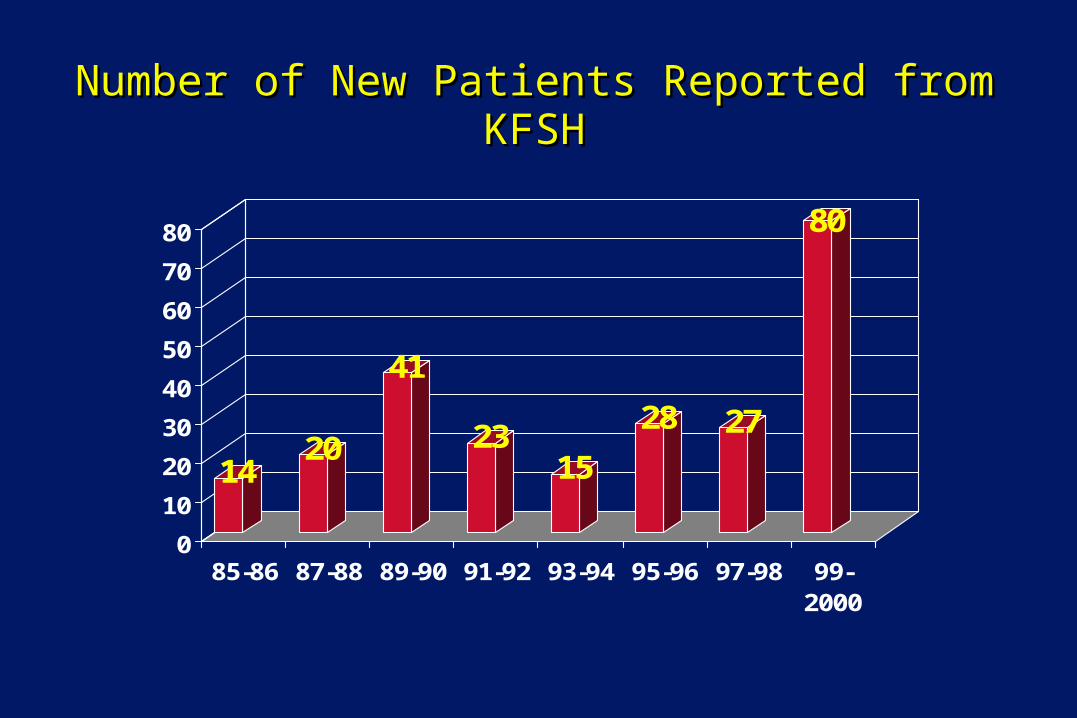
Number of New Patients Reported from KFSHNumber of New Patients Reported from KFSH
1420
41
2315
28 27
80
0
10
20
30
40
50
60
70
80
85-86 87-88 89-90 91-92 93-94 95-96 97-98 99-2000

Sex Distribution
69%
31%
Male Female
Total of 168 patients

Age Distribution - 1998Age Distribution - 1998
7%14%
32%17%
30%
>50 35-49 25-34 16-24 <15
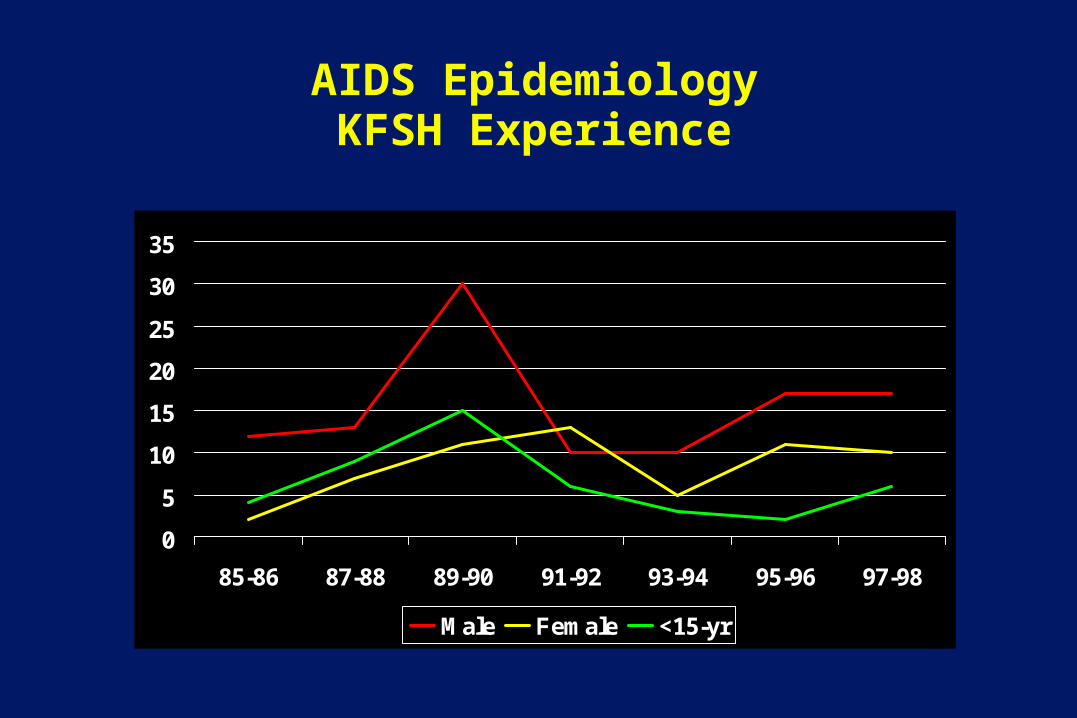
AIDS EpidemiologyKFSH Experience
0
5
10
15
20
25
30
35
85-86 87-88 89-90 91-92 93-94 95-96 97-98
Male Female <15-yr

Mode of Transmission
34%
16%
8%
2%
1993-1998
46%
30%
8.90%
14%
Blood Hetero Perinatal Others
1985-1998
**Others : homosexual, bisexual, drugs, OTx, Unknown

Source of InfectionSource of Infection
0
2
4
6
8
10
12
14
16
1987 1988 1989 1990 1991 1992 1993 1994 1995 1996 1997 1998
Haem Btx Hetero Per Otx Multiple

Conclusion
HIV epidemic continues to expand.
Poorer countries are more affected with enormous detrimental
consequences medically, socially and economically.
HAART may lead to prolonged survival and larger pool of HIV
infected patients.
Our country is not immune against HIV, hence preventive
measures need to be adopted with great emphasis on education.
HIV is not going away any soon. Be prepared to manage HIV
patients.